
Driver Take-Over Behaviour Study Based on Gaze Focalization and Vehicle Data in CARLA Simulator
 , ,
, ,  , ,
, ,
Abstract
:1. Introduction
- Gaze focalization, i.e., the objects at which the driver is focalizing his gaze. We study this behaviour during the transition and the first moments of manual driving after an emergency TOR.
- Take-over time, the time it takes for the driver to resume manual driving after TOR.
- Take-over quality, the quality of the driver’s intervention after resuming manual control from the vehicle data (e.g., vehicle velocity, lane position, steering wheel angle, and throttle/brake pedal position).
- Driver situation awareness (DSA), this novel metric assesses the awareness of the driver during the current traffic situation. DSA appends an additional step concerning the calculation of gaze focalization since it compares the focused objects with those that should have been focused on, according to a supervisor.
2. Related Works
3. Experiment Framework
3.1. Driver’s Gaze Focalization (Subsystem 1)
3.2. Simulator (Subsystem 2)
Vehicle Data
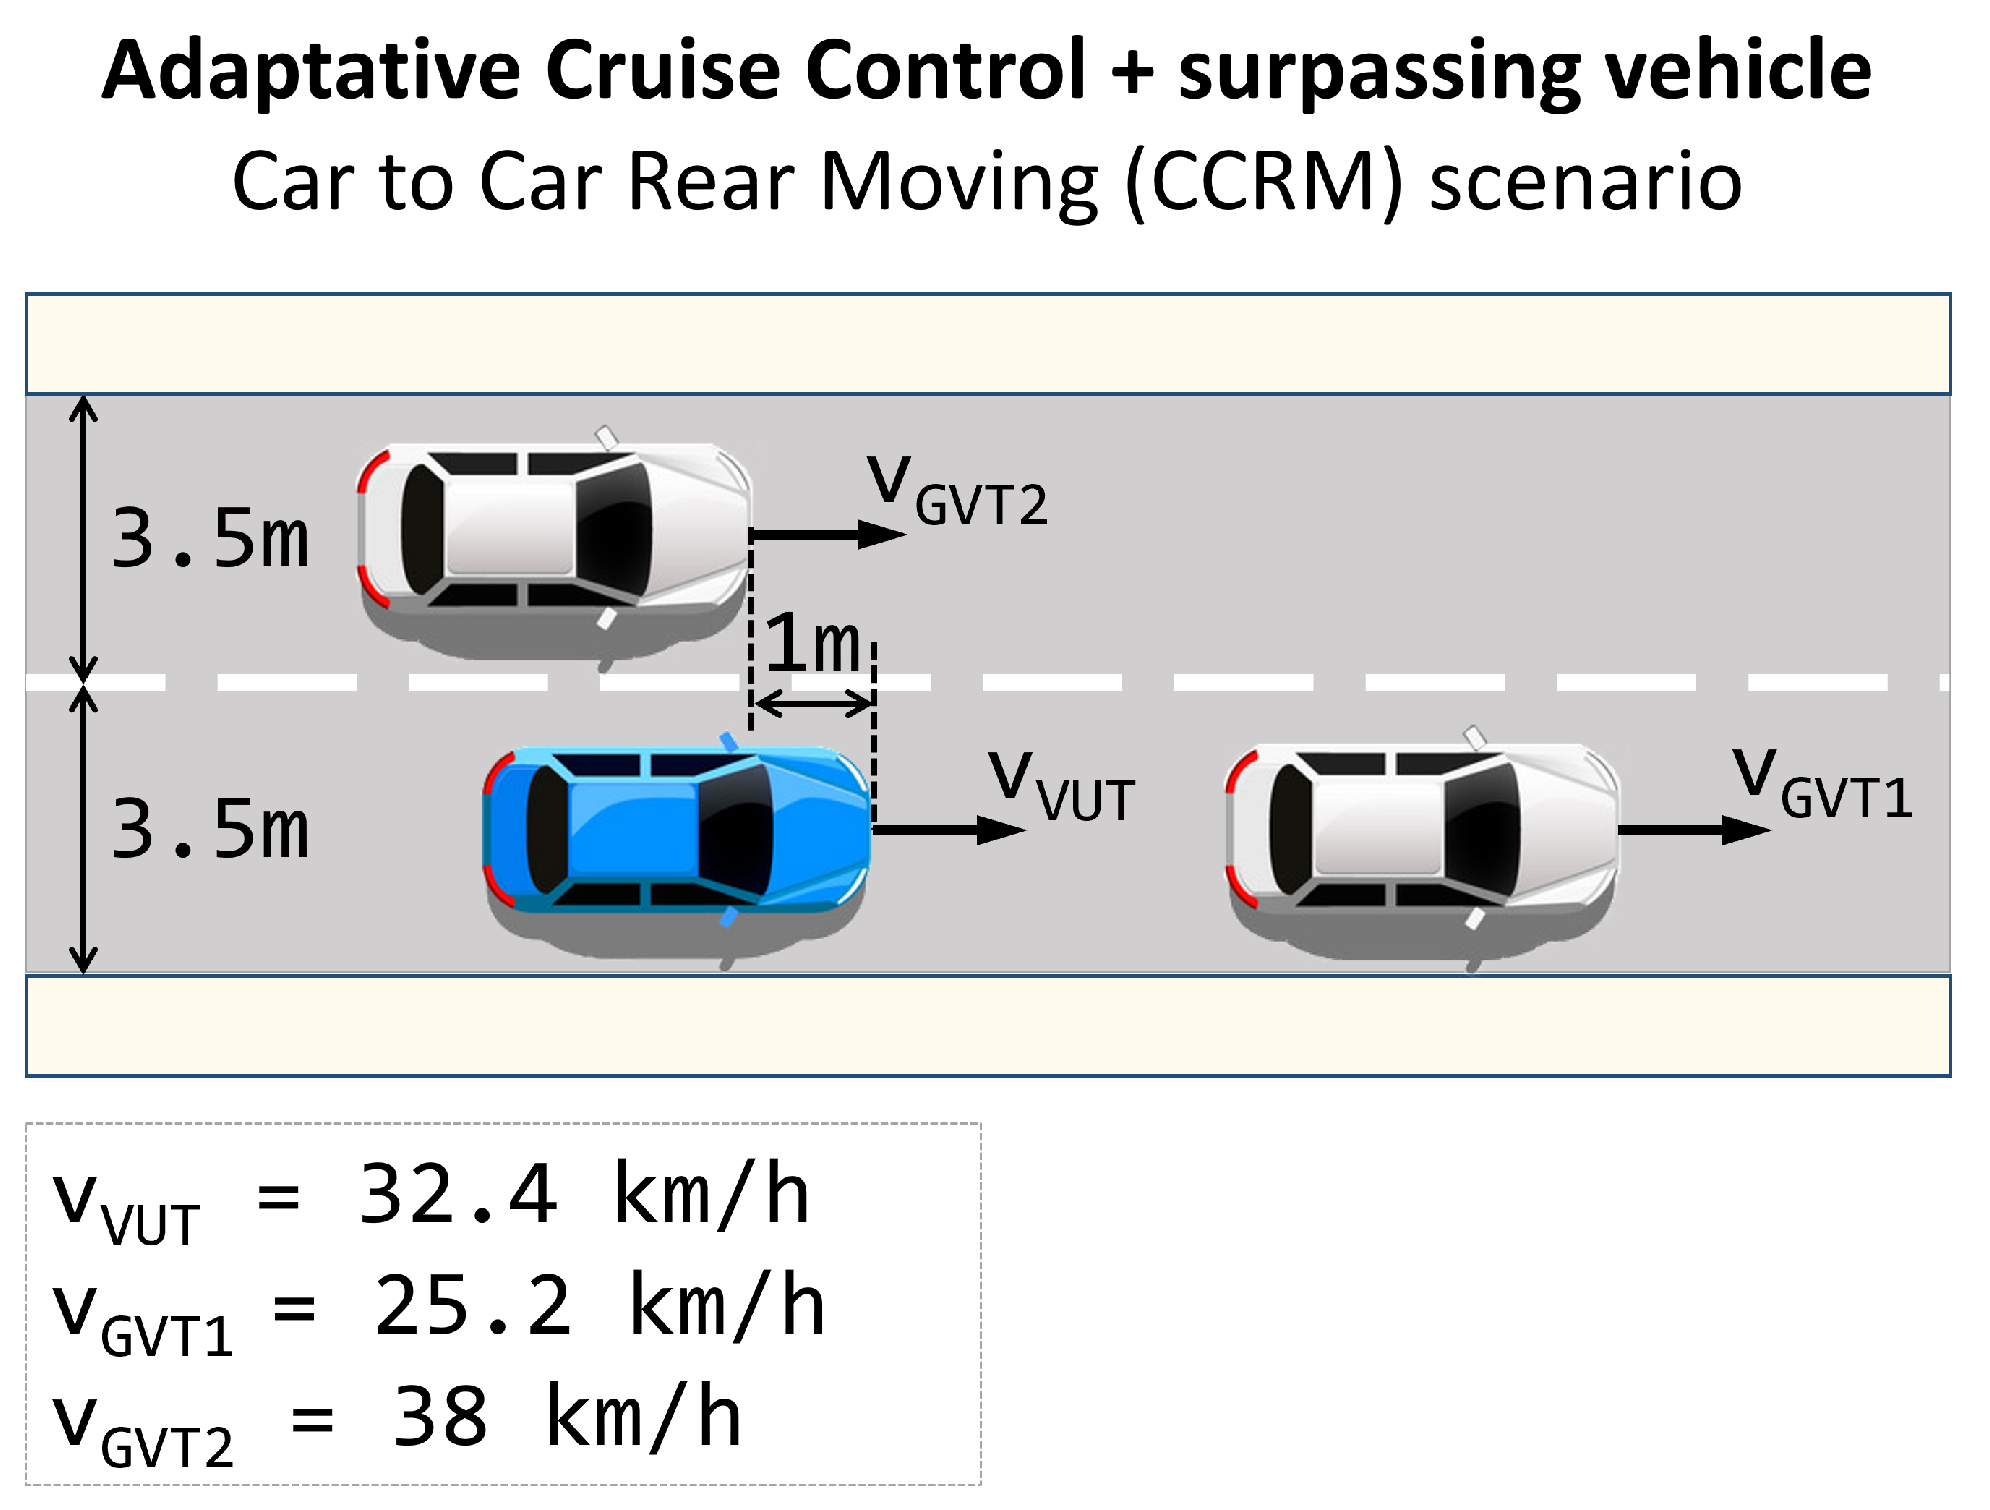
4. Scenarios
5. Experiment Setup
6. Results
6.1. Gaze Focalization Analysis
6.1.1. Fusion of the Gaze Focalization and the Semantic Segmentation
6.1.2. Analysis of the Gaze Focalization on the Different Screens
6.2. Vehicle Status Analysis
6.2.1. Vehicle Velocity Analysis during the Transition
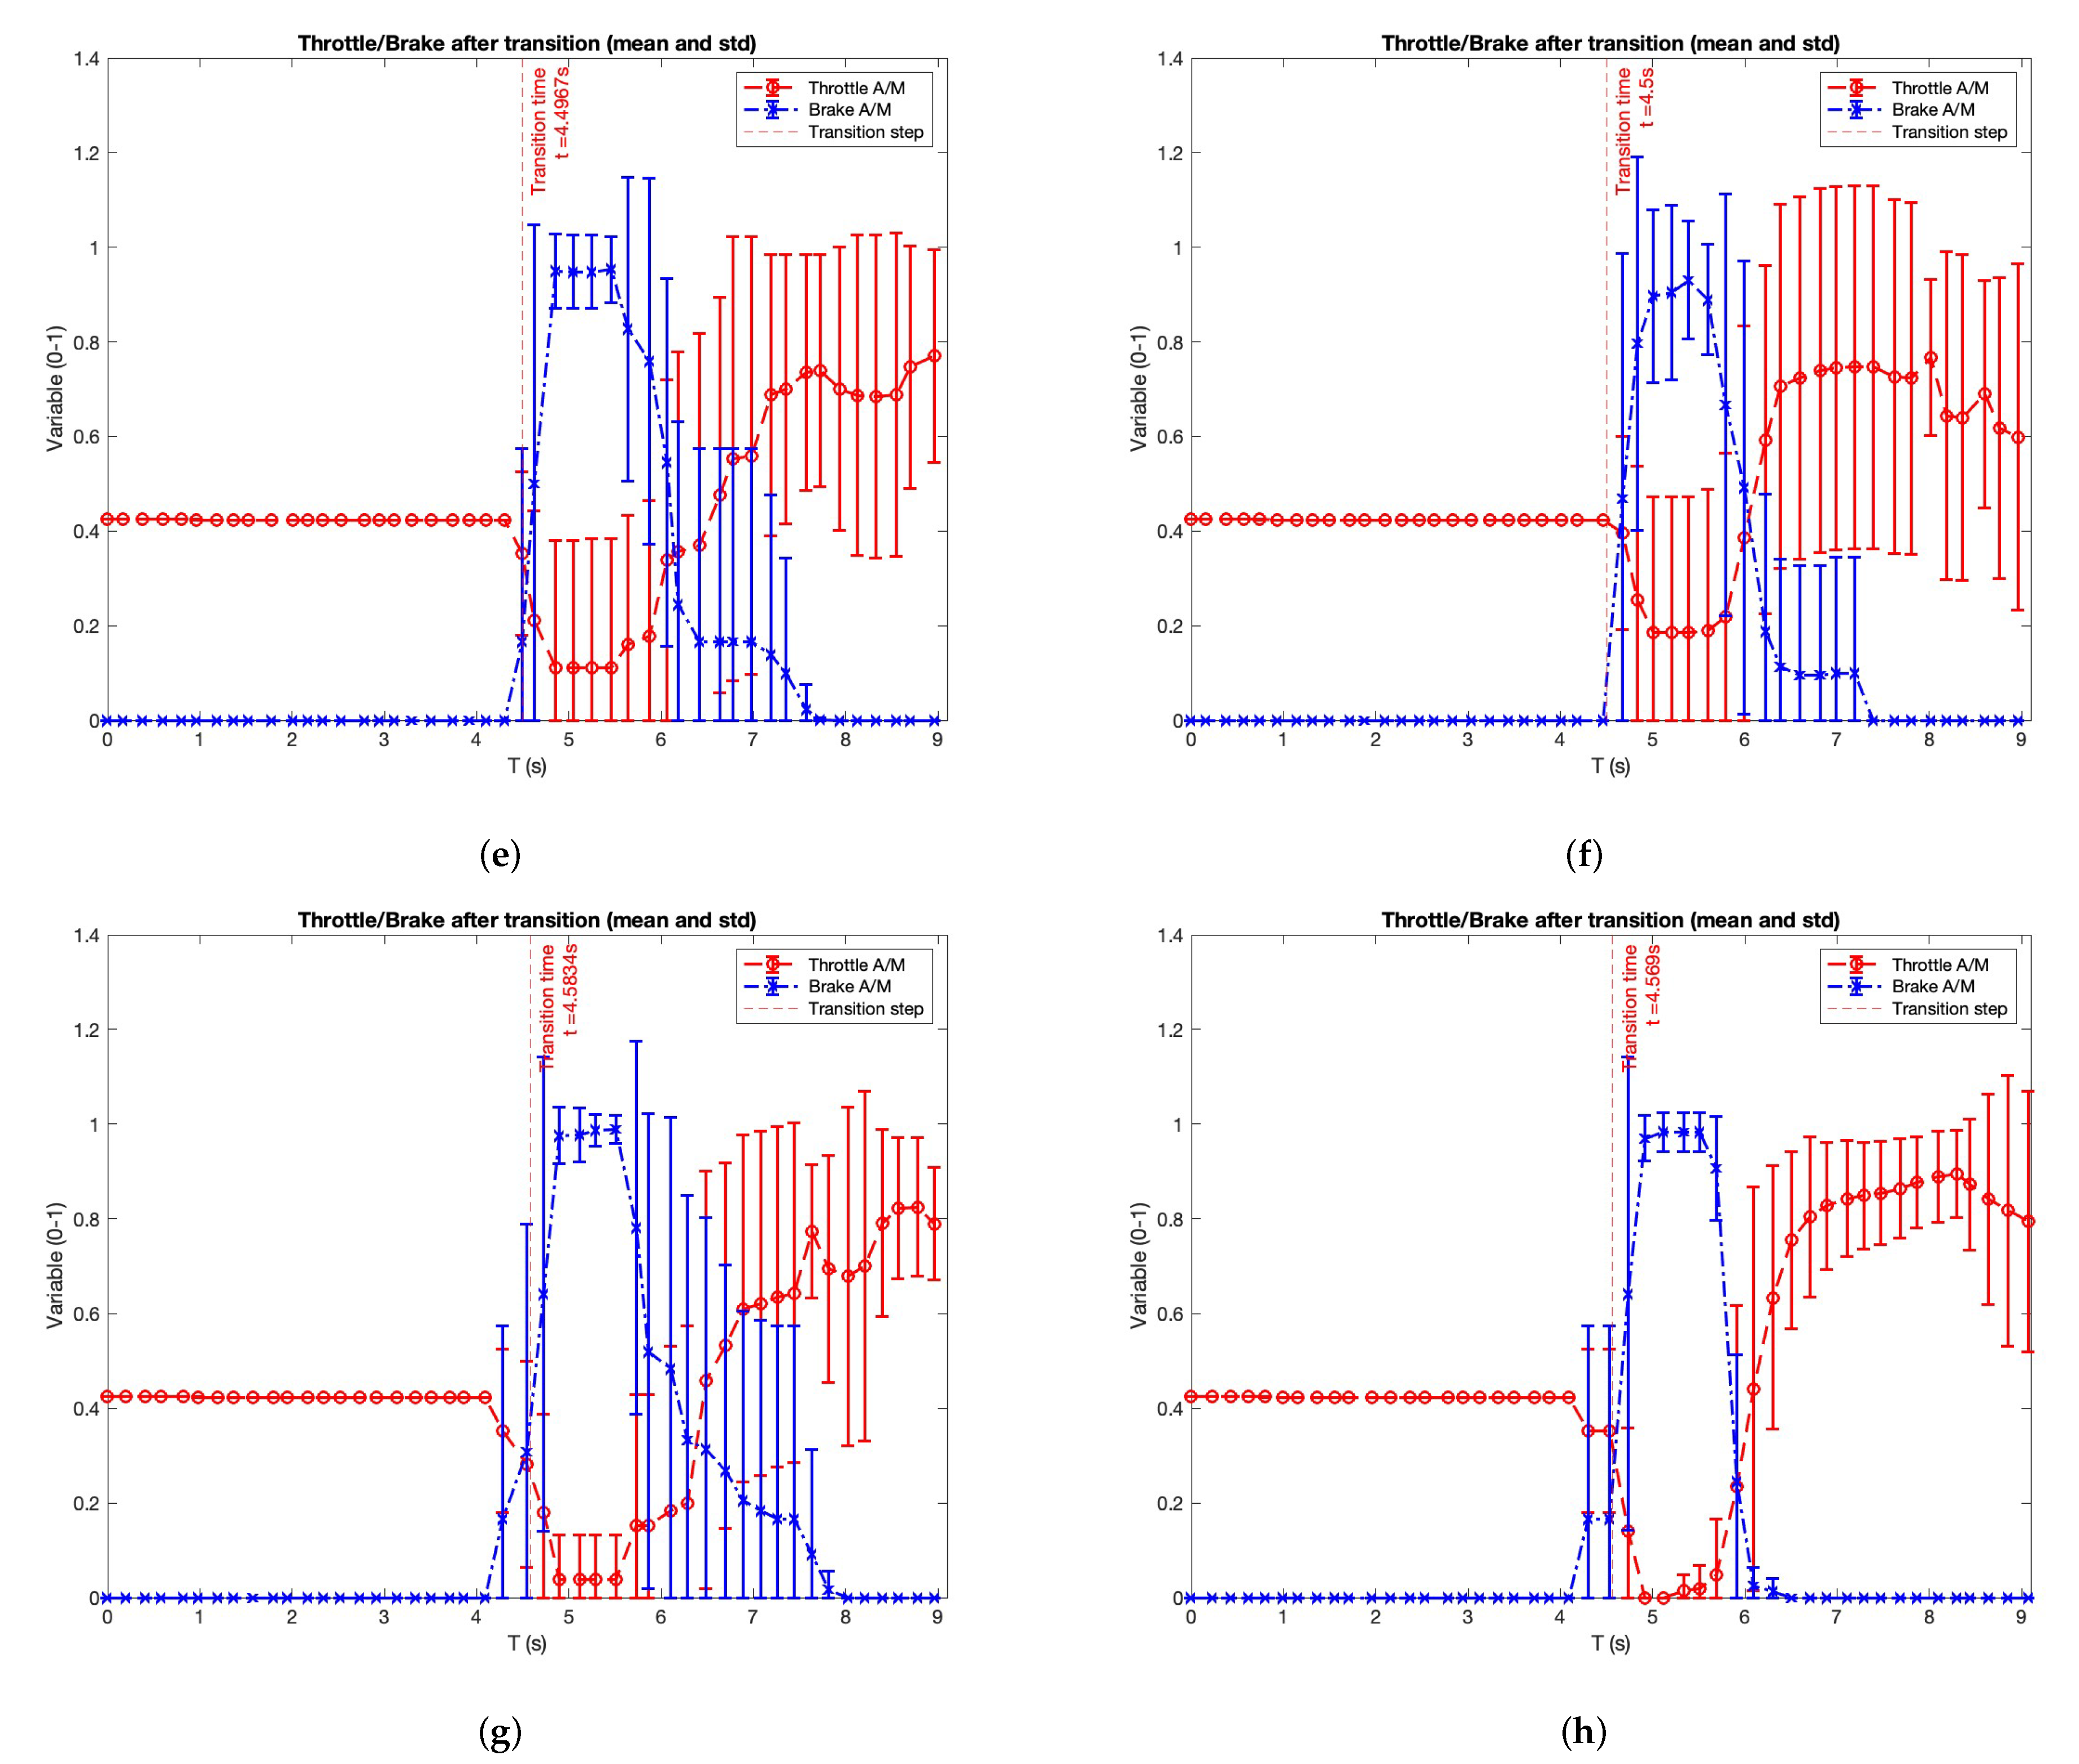
6.2.2. Vehicle Actuators Analysis during the Transition
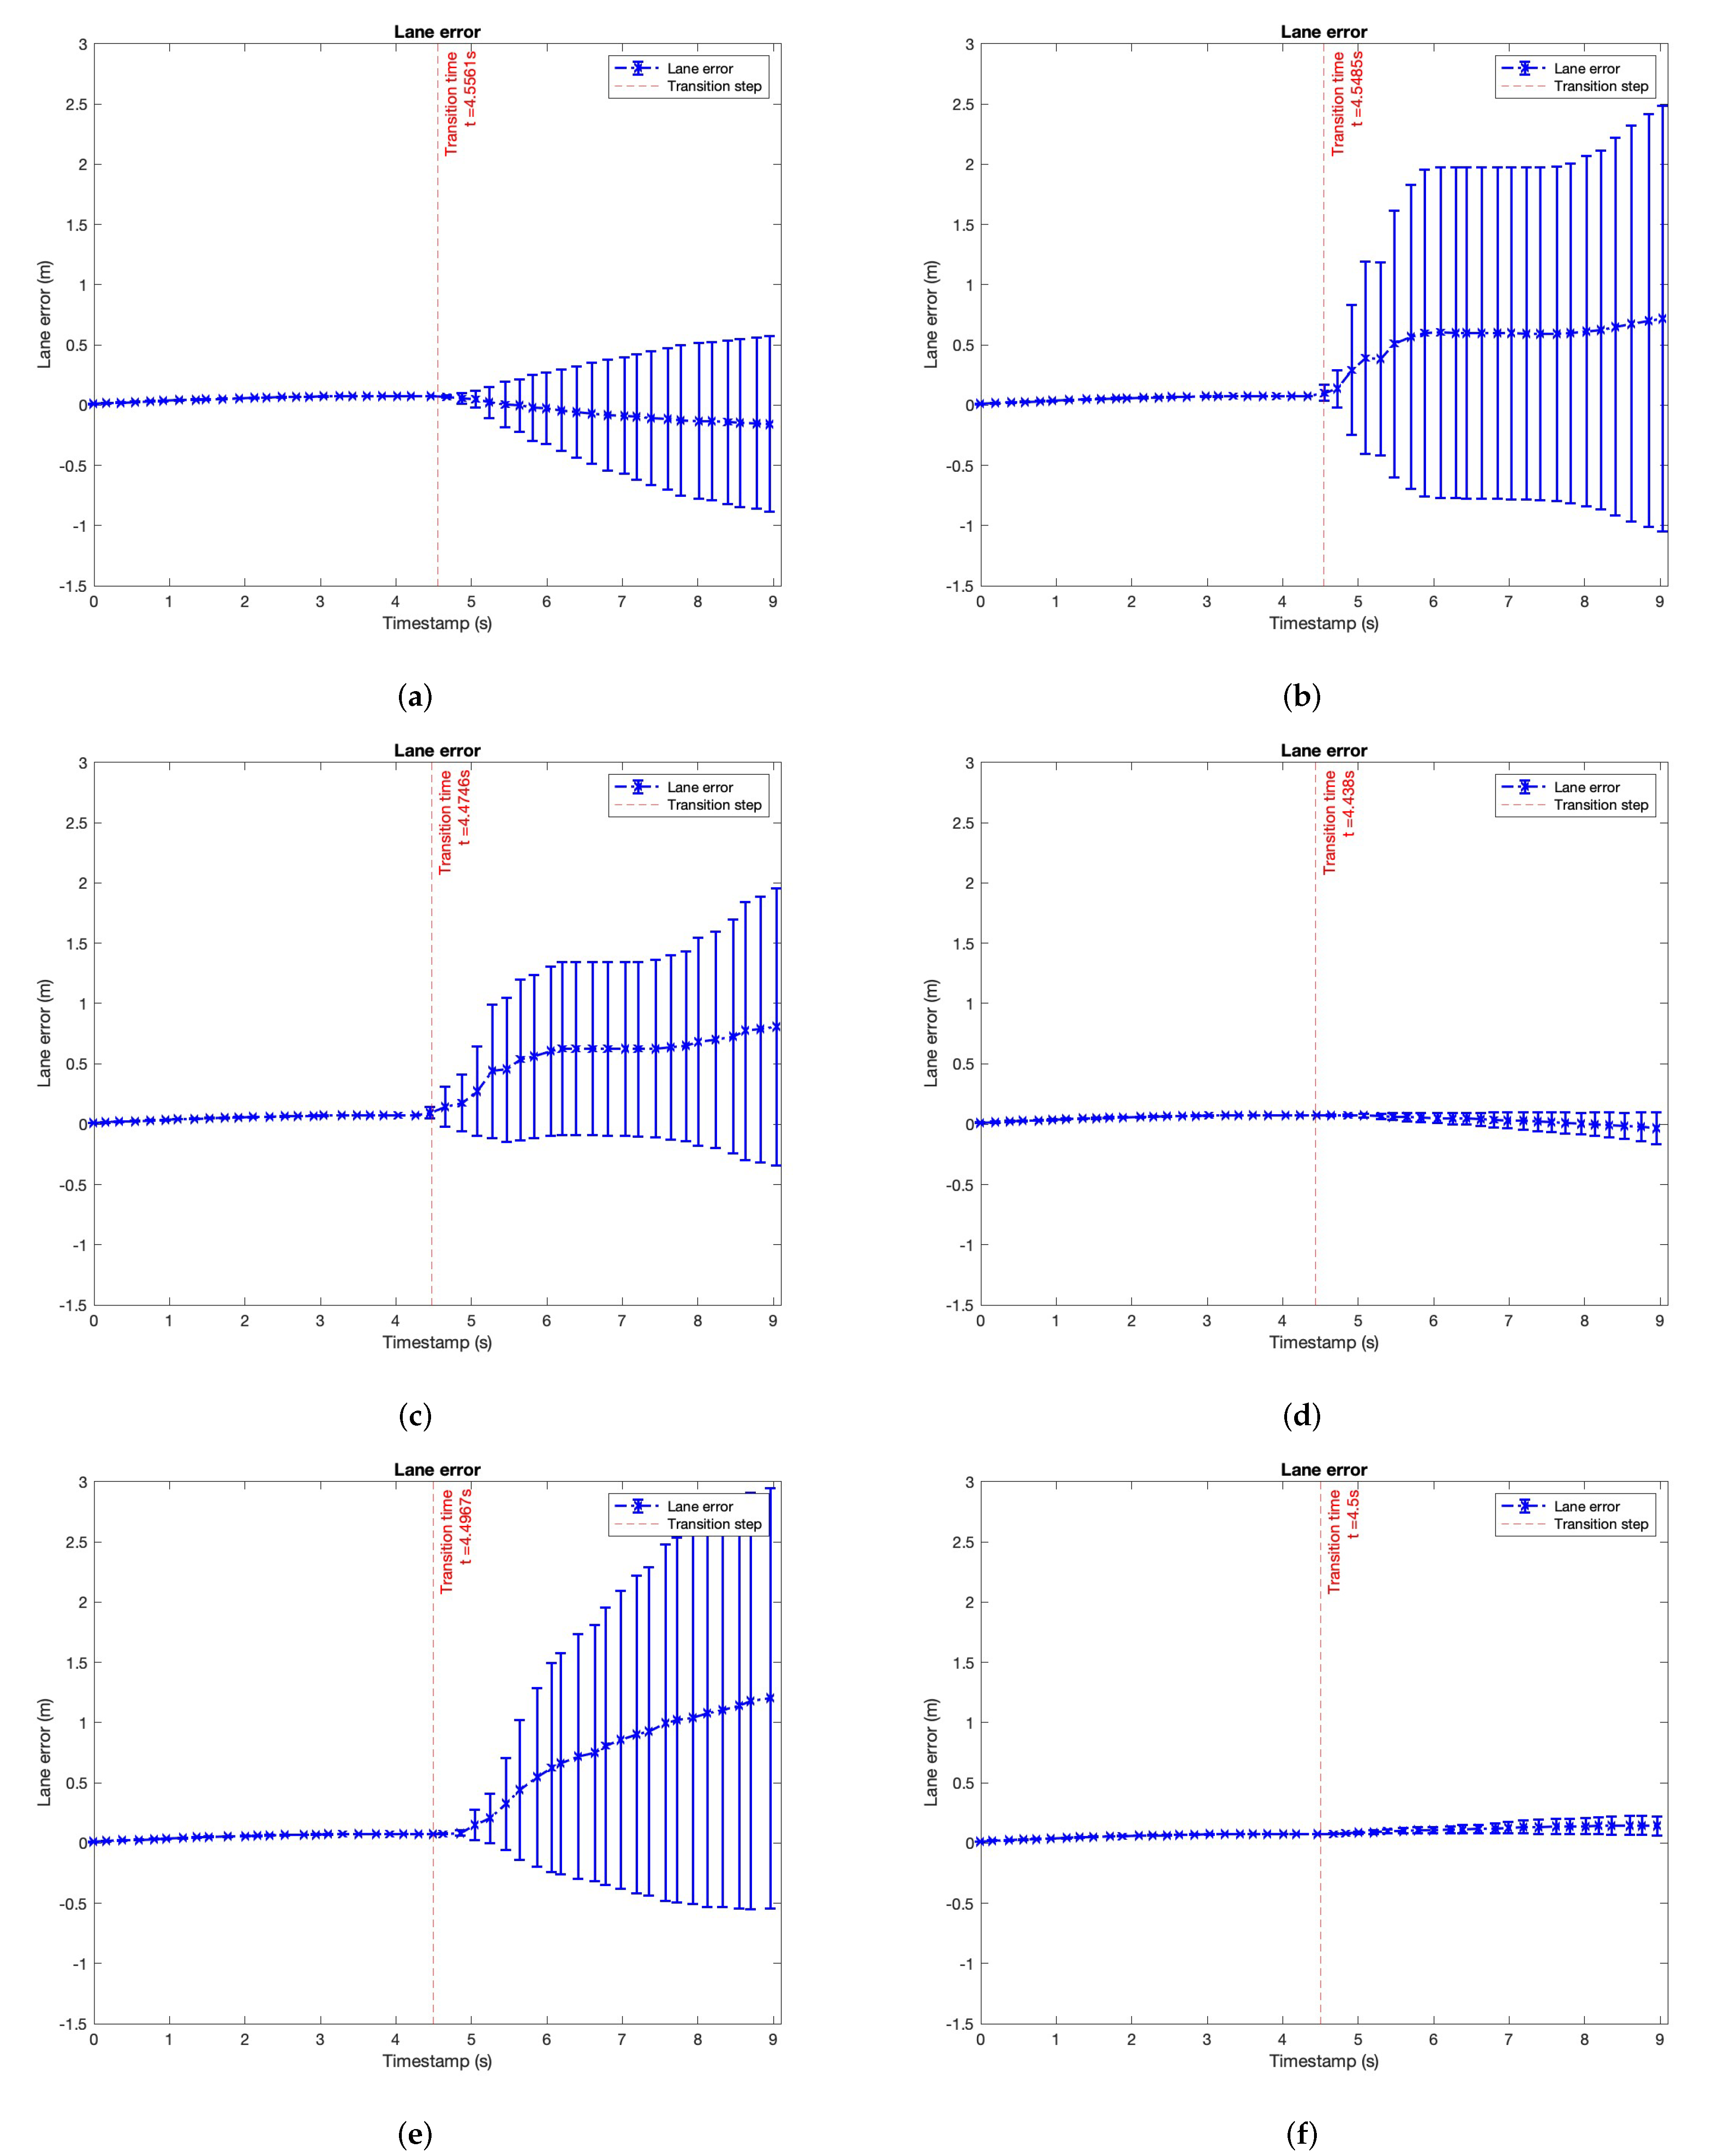
6.2.3. Vehicle Lane-Error Analysis during the Transition
6.3. Reaction-Time Analysis
6.4. Situation Awareness
7. Conclusions
Author Contributions
Funding
Institutional Review Board Statement
Informed Consent Statement
Data Availability Statement
Conflicts of Interest
References
- Jimenez, F. Intelligent Vehicles: Enabling Technologies and Future Developments; Butterworth-Heinemann: Oxford, UK, 2017. [Google Scholar]
- McCall, R.; McGee, F.; Mirnig, A.; Meschtscherjakov, A.; Louveton, N.; Engel, T.; Tscheligi, M. A taxonomy of autonomous vehicle handover situations. Transp. Res. Part A Policy Pract. 2019, 124, 507–522. [Google Scholar] [CrossRef]
- Yang, L.; Dong, K.; Dmitruk, A.J.; Brighton, J.; Zhao, Y. A Dual-Cameras-Based Driver Gaze Mapping System with an Application on Non-Driving Activities Monitoring. IEEE Trans. Intell. Transp. Syst. 2019, 21, 4318–4327. [Google Scholar] [CrossRef] [Green Version]
- Santos, G.H.G.; Larocca, A.P.C. Drivers Take-Over Performance from Partial Automation to Manual Driving. In Proceedings of the 2019 33th Congresso de Pesquisa e Ensino em Transporte da ANPET, Balneário Camboriú, Brasil, 10–14 November 2019; pp. 3885–3888. [Google Scholar]
- Dosovitskiy, A.; Ros, G.; Codevilla, F.; Lopez, A.; Koltun, V. CARLA: An open urban driving simulator. arXiv 2017, arXiv:1711.03938. [Google Scholar]
- Baltrusaitis, T.; Zadeh, A.; Lim, Y.C.; Morency, L.P. Openface 2.0: Facial behavior analysis toolkit. In Proceedings of the 2018 13th IEEE International Conference on Automatic Face & Gesture Recognition (FG 2018), Xi’an, China, 15–19 May 2018; pp. 59–66. [Google Scholar]
- Araluce, J.; Bergasa, L.M.; Ocaña, M.; López-Guillén, E.; Revenga, P.A.; Arango, J.F.; Pérez, O. Gaze Focalization System for Driving Applications Using OpenFace 2.0 Toolkit with NARMAX Algorithm in Accidental Scenarios. Sensors 2021, 21, 6262. [Google Scholar] [CrossRef]
- Berghöfer, F.L.; Purucker, C.; Naujoks, F.; Wiedemann, K.; Marberger, C. Prediction of take-over time demand in conditionally automated driving-results of a real world driving study. In Proceedings of the Human Factors and Ergonomics Society Europe, Philadelphia, PA, USA, 1–5 October 2018; pp. 69–81. [Google Scholar]
- Lotz, A.; Weissenberger, S. Predicting take-over times of truck drivers in conditional autonomous driving. In International Conference on Applied Human Factors and Ergonomics; Springer: Berlin/Heidelberg, Germany, 2018; pp. 329–338. [Google Scholar]
- Deo, N.; Trivedi, M.M. Looking at the driver/rider in autonomous vehicles to predict take-over readiness. IEEE Trans. Intell. Veh. 2019, 5, 41–52. [Google Scholar] [CrossRef] [Green Version]
- Du, N.; Zhou, F.; Pulver, E.; Tilbury, D.; Robert, L.P.; Pradhan, A.K.; Yang, X.J. Predicting Takeover Performance in Conditionally Automated Driving. In Proceedings of the 2020 CHI Conference on Human Factors in Computing Systems, Honolulu, HI, USA, 25–30 April 2020; pp. 1–8. [Google Scholar]
- Du, N.; Zhou, F.; Pulver, E.M.; Tilbury, D.M.; Robert, L.P.; Pradhan, A.K.; Yang, X.J. Predicting driver takeover performance in conditionally automated driving. Accid. Anal. Prev. 2020, 148, 105748. [Google Scholar] [CrossRef]
- Pakdamanian, E.; Sheng, S.; Baee, S.; Heo, S.; Kraus, S.; Feng, L. Deeptake: Prediction of driver takeover behavior using multimodal data. In Proceedings of the 2021 CHI Conference on Human Factors in Computing Systems, Yokohama, Japan, 8–13 May 2021; pp. 1–14. [Google Scholar]
- Eriksson, A.; Banks, V.; Stanton, N. Transition to manual: Comparing simulator with on-road control transitions. Accid. Anal. Prev. 2017, 102, 227–234. [Google Scholar] [CrossRef] [Green Version]
- Merat, N.; Jamson, A.H.; Lai, F.C.; Daly, M.; Carsten, O.M. Transition to manual: Driver behaviour when resuming control from a highly automated vehicle. Transp. Res. Part F Traffic Psychol. Behav. 2014, 27, 274–282. [Google Scholar] [CrossRef] [Green Version]
- Du, N.; Zhou, F.; Pulver, E.M.; Tilbury, D.M.; Robert, L.P.; Pradhan, A.K.; Yang, X.J. Examining the effects of emotional valence and arousal on takeover performance in conditionally automated driving. Transp. Res. Part C Emerg. Technol. 2020, 112, 78–87. [Google Scholar] [CrossRef]
- Ebnali, M.; Hulme, K.; Ebnali-Heidari, A.; Mazloumi, A. How does training effect users’ attitudes and skills needed for highly automated driving? Transp. Res. Part F Traffic Psychol. Behav. 2019, 66, 184–195. [Google Scholar] [CrossRef]
- Zeeb, K.; Buchner, A.; Schrauf, M. What determines the take-over time? An integrated model approach of driver take-over after automated driving. Accid. Anal. Prev. 2015, 78, 212–221. [Google Scholar] [CrossRef] [PubMed]
- Rangesh, A.; Deo, N.; Greer, R.; Gunaratne, P.; Trivedi, M.M. Autonomous Vehicles that Alert Humans to Take-Over Controls: Modeling with Real-World Data. arXiv 2021, arXiv:2104.11489. [Google Scholar]
- Naujoks, F.; Mai, C.; Neukum, A. The effect of urgency of take-over requests during highly automated driving under distraction conditions. Adv. Hum. Asp. Transp. 2014, 7, 431. [Google Scholar]
- Pakdamanian, E.; Feng, L.; Kim, I. The effect of whole-body haptic feedback on driver’s perception in negotiating a curve. In Proceedings of the Human Factors and Ergonomics Society Annual Meeting, Philadelphia, PA, USA, 1–5 October 2018; SAGE Publications Sage: Los Angeles, CA, USA, 2018; Volume 62, pp. 19–23. [Google Scholar]
- Wan, J.; Wu, C. The effects of vibration patterns of take-over request and non-driving tasks on taking-over control of automated vehicles. Int. J. Hum. Comput. Interact. 2018, 34, 987–998. [Google Scholar] [CrossRef]
- Dalmaijer, E.; Mathôt, S.; Stigchel, S. PyGaze: An open-source, cross-platform toolbox for minimal-effort programming of eyetracking experiments. Behav. Res. Methods 2013, 46, 913–921. [Google Scholar] [CrossRef]
- Cognolato, M.; Atzori, M.; Müller, H. Head-mounted eye gaze tracking devices: An overview of modern devices and recent advances. J. Rehabil. Assist. Technol. Eng. 2018, 5, 2055668318773991. [Google Scholar] [CrossRef]
- Shen, J.; Zafeiriou, S.; Chrysos, G.G.; Kossaifi, J.; Tzimiropoulos, G.; Pantic, M. The First Facial Landmark Tracking in-the-Wild Challenge: Benchmark and Results. In Proceedings of the 2015 IEEE International Conference on Computer Vision Workshop (ICCVW), Santiago, Chile, 7–13 December 2015; pp. 1003–1011. [Google Scholar] [CrossRef] [Green Version]
- Xia, Y.; Zhang, D.; Kim, J.; Nakayama, K.; Zipser, K.; Whitney, D. Predicting driver attention in critical situations. In Proceedings of the Asian Conference on Computer Vision, Perth, Australia, 2–6 December 2018; Springer: Berlin/Heidelberg, Germany; pp. 658–674. [Google Scholar]
- Mizuno, N.; Yoshizawa, A.; Hayashi, A.; Ishikawa, T. Detecting driver’s visual attention area by using vehicle-mounted device. In Proceedings of the 2017 IEEE 16th International Conference on Cognitive Informatics & Cognitive Computing (ICCI* CC), Oxford, UK, 26–28 July 2017; pp. 346–352. [Google Scholar]
- Vicente, F.; Huang, Z.; Xiong, X.; De la Torre, F.; Zhang, W.; Levi, D. Driver gaze tracking and eyes off the road detection system. IEEE Trans. Intell. Transp. Syst. 2015, 16, 2014–2027. [Google Scholar]
- Naqvi, R.A.; Arsalan, M.; Batchuluun, G.; Yoon, H.S.; Park, K.R. Deep learning-based gaze detection system for automobile drivers using a NIR camera sensor. Sensors 2018, 18, 456. [Google Scholar] [CrossRef] [Green Version]
- Jiménez, P.; Bergasa, L.M.; Nuevo, J.; Hernández, N.; Daza, I.G. Gaze fixation system for the evaluation of driver distractions induced by IVIS. IEEE Trans. Intell. Transp. Syst. 2012, 13, 1167–1178. [Google Scholar] [CrossRef]
- Hofbauer, M.; Kuhn, C.B.; Püttner, L.; Petrovic, G.; Steinbach, E. Measuring Driver Situation Awareness Using Region-of-Interest Prediction and Eye Tracking. In Proceedings of the 2020 IEEE International Symposium on Multimedia (ISM), Naples, Italy, 2–4 December 2020; pp. 91–95. [Google Scholar]
- Langner, T.; Seifert, D.; Fischer, B.; Goehring, D.; Ganjineh, T.; Rojas, R. Traffic awareness driver assistance based on stereovision, eye-tracking, and head-up display. In Proceedings of the 2016 IEEE International Conference on Robotics and Automation (ICRA), Stockholm, Sweden, 16–21 May 2016; pp. 3167–3173. [Google Scholar]
- Mori, M.; Miyajima, C.; Angkititrakul, P.; Hirayama, T.; Li, Y.; Kitaoka, N.; Takeda, K. Measuring driver awareness based on correlation between gaze behavior and risks of surrounding vehicles. In Proceedings of the 2012 15th International IEEE Conference on Intelligent Transportation Systems, Anchorage, AK, USA, 16–19 September 2012; pp. 644–647. [Google Scholar]
- Quigley, M.; Conley, K.; Gerkey, B.; Faust, J.; Foote, T.; Leibs, J.; Wheeler, R.; Ng, A.Y. ROS: An open-source Robot Operating System. In Proceedings of the ICRA Workshop on Open Source Software, Kobe, Japan, 12–17 May 2009; Volume 3, p. 5. [Google Scholar]
- Billings, S.; Korenberg, M.; Chen, S. Identification of non-linear output-affine systems using an orthogonal least-squares algorithm. Int. J. Syst. Sci. 1988, 19, 1559–1568. [Google Scholar] [CrossRef]
- Fang, J.; Yan, D.; Qiao, J.; Xue, J.; Wang, H.; Li, S. DADA-2000: Can Driving Accident be Predicted by Driver Attentionƒ Analyzed by A Benchmark. In Proceedings of the 2019 IEEE Intelligent Transportation Systems Conference (ITSC), Auckland, NZ, USA, 27–30 October 2019; pp. 4303–4309. [Google Scholar]
- Nagaraju, D.; Ansah, A.; Ch, N.A.N.; Mills, C.; Janssen, C.P.; Shaer, O.; Kun, A.L. How will drivers take back control in automated vehicles? In A driving simulator test of an interleaving framework. In Proceedings of the 13th International Conference on Automotive User Interfaces and Interactive Vehicular Applications, Leeds, UK, 9–14 September 2021; pp. 20–27. [Google Scholar]
- Wan, J.; Wu, C. The Effects of Lead Time of Take-Over Request and Nondriving Tasks on Taking-Over Control of Automated Vehicles. IEEE Trans. Hum. Mach. Syst. 2018, 48, 582–591. [Google Scholar] [CrossRef]
- Romera, E.; Alvarez, J.M.; Bergasa, L.M.; Arroyo, R. Erfnet: Efficient residual factorized convnet for real-time semantic segmentation. IEEE Trans. Intell. Transp. Syst. 2017, 19, 263–272. [Google Scholar] [CrossRef]
- Chen, L.; Papandreou, G.; Schroff, F.; Adam, H. Rethinking Atrous Convolution for Semantic Image Segmentation. arXiv 2017, arXiv:1706.05587. [Google Scholar]
- Zabihi, S.; Zabihi, S.; Beauchemin, S.S.; Bauer, M.A. Detection and recognition of traffic signs inside the attentional visual field of drivers. In Proceedings of the 2017 IEEE Intelligent Vehicles Symposium (IV), Los Angeles, CA, USA, 11–14 June 2017; pp. 583–588. [Google Scholar]
- ScenarioRunner Is a Module That Allows Traffic Scenario Definition and Execution for the CARLA Simulator. Available online: https://carla-scenariorunner.readthedocs.io/en/latest/ (accessed on 12 December 2022).
- Blackman, S.; Popoli, R. Design and Analysis of Modern Tracking Systems; Artech House: Norwood, MA, USA, 1999. [Google Scholar]
- Hooey, B.L.; Gore, B.F.; Wickens, C.D.; Scott-Nash, S.; Socash, C.; Salud, E.; Foyle, D.C. Modeling pilot situation awareness. In Human Modelling in Assisted Transportation; Springer: Berlin/Heidelberg, Germany, 2011; pp. 207–213. [Google Scholar]


| Behaviour Studied | Section | Figure/Table |
|---|---|---|
| Gaze focalization object analysis | Section 6.1.1 | Figure 9 and Table 2 |
| Gaze-focalization screen analysis | Section 6.1.2 | Table 3 |
| Velocity behaviour analysis | Section 6.2.1 | Figure 10 |
| Throttle and brake behaviour analysis | Section 6.2.2 | Figure 11 |
| Steer behaviour analysis | Section 6.2.2 | Figure 12 |
| Lane-error behaviour analysis | Section 6.2.3 | Figure 13 |
| Reaction-time behaviour analysis | Section 6.3 | Table 4 |
| Driver situation awareness (DSA) analysis | Section 6.4 | Table 5 |
| Gaze Median Area | |||
|---|---|---|---|
| First Class | Second Class | Third Class | |
| Manual | Vehicles (36.17%) | Roads (23.75%) | Building (13.07%) |
| Autonomous | Out of screen (52.68%) | Vehicles (23.37%) | Walls (8.12%) |
| Transition | Vehicles (47.5%) | Out of screen (20%) | Walls (12.5%) |
| Use Case | Distraction | Screen Analysis | |||
|---|---|---|---|---|---|
| Left | Center | Right | Out of Screen | ||
| ACC | Focus | 0.00% | 100.00% | 0.00% | 0.00% |
| ACC | Mobile | 3.59% | 72.66% | 5.75% | 17.98% |
| ACC | Reading | 1.43% | 90.64% | 3.59% | 4.31% |
| ACC | Talking | 6.47% | 78.41% | 10.07% | 5.03% |
| ACC + passing vehicle | Focus | 0.00% | 100.00% | 0.00% | 0.00% |
| ACC + passing vehicle | Mobile | 1.44% | 74.63% | 4.34% | 19.56% |
| ACC + passing vehicle | Reading | 11.51% | 76.25% | 7.19% | 5.03% |
| ACC + passing vehicle | Talking | 0.00% | 84.89% | 7.91% | 7.19% |
| Reaction Time (s) | |||||||
|---|---|---|---|---|---|---|---|
| Use Case | Distraction | Roads | Vehicle | Screen | Throttle | Brake | Steer |
| ACC | Focus | 3.08 | 0.13 | 0.00 | 3.22 | 2.01 | 3.21 |
| ACC | Mobile | 7.07 | 2.93 | 1.34 | 1.88 | 1.69 | 2.29 |
| ACC | Reading | 2.11 | 3.56 | 1.23 | 1.87 | 1.87 | 2.95 |
| ACC | Talking | 3.13 | 2.73 | 1.13 | 4.44 | 2.33 | 4.37 |
| ACC + passing vehicle | Focus | 4.69 | 0.86 | 0.00 | 5.41 | 1.66 | 2.66 |
| ACC + passing vehicle | Mobile | 4.36 | 1.97 | 1.08 | 4.70 | 2.08 | 2.25 |
| ACC + passing vehicle | Reading | 3.78 | 2.22 | 1.47 | 5.24 | 2.24 | 2.24 |
| ACC + passing vehicle | Talking | 3.64 | 1.31 | 0.65 | 4.29 | 1.85 | 2.31 |
| Use Case | Distraction | Awareness Ratio Transition |
|---|---|---|
| ACC | Focus | 0.6131 |
| ACC | Mobile | 0.287 |
| ACC | Reading | 0.4144 |
| ACC | Talking | 0.3583 |
| ACC + Passing vehicle | Focus | 0.7602 |
| ACC + Passing vehicle | Mobile | 0.4272 |
| ACC + Passing vehicle | Reading | 0.4308 |
| ACC + Passing vehicle | Talking | 0.6958 |
Publisher’s Note: MDPI stays neutral with regard to jurisdictional claims in published maps and institutional affiliations. |
© 2022 by the authors. Licensee MDPI, Basel, Switzerland. This article is an open access article distributed under the terms and conditions of the Creative Commons Attribution (CC BY) license (https://creativecommons.org/licenses/by/4.0/).
Share and Cite
Araluce, J.; Bergasa, L.M.; Ocaña, M.; López-Guillén, E.; Gutiérrez-Moreno, R.; Arango, J.F. Driver Take-Over Behaviour Study Based on Gaze Focalization and Vehicle Data in CARLA Simulator. Sensors 2022, 22, 9993. https://doi.org/10.3390/s22249993
Araluce J, Bergasa LM, Ocaña M, López-Guillén E, Gutiérrez-Moreno R, Arango JF. Driver Take-Over Behaviour Study Based on Gaze Focalization and Vehicle Data in CARLA Simulator. Sensors. 2022; 22(24):9993. https://doi.org/10.3390/s22249993
Chicago/Turabian StyleAraluce, Javier, Luis M. Bergasa, Manuel Ocaña, Elena López-Guillén, Rodrigo Gutiérrez-Moreno, and J. Felipe Arango. 2022. "Driver Take-Over Behaviour Study Based on Gaze Focalization and Vehicle Data in CARLA Simulator" Sensors 22, no. 24: 9993. https://doi.org/10.3390/s22249993