

IoTMapper: A Metrics Aggregation System Architecture in Support of Smart City Solutions

Abstract
:1. Introduction
- Sigfox [6]: An alternative network with the same aim, based on a closed business model, in which the network is always supported by an operator, also called Sigfox. This is the key difference from other technologies; there is only one operator.
- Narrowband internet of things (NB-IoT) [10,11]: A technology supported by public mobile communications operators, resulting from the evolution of the widely deployed LTE (long-term evolution) technology. NB-IoT is a more recent IoT technology, its operating model is based on the conventional models of public mobile operators, and is based on a subscription.
- The urban landscape may change, for example, the construction of new buildings, which affect the propagation characteristics of existing networks.
- The continuous expansion of the city, both in terms of population and occupied geographical area, may increase the pressure such that networks are subjected through a higher traffic volume and device number, which was an issue identified in previous research such as in [2].
1.1. Contributions
1.2. Organization of the Document
2. Background and Related Work
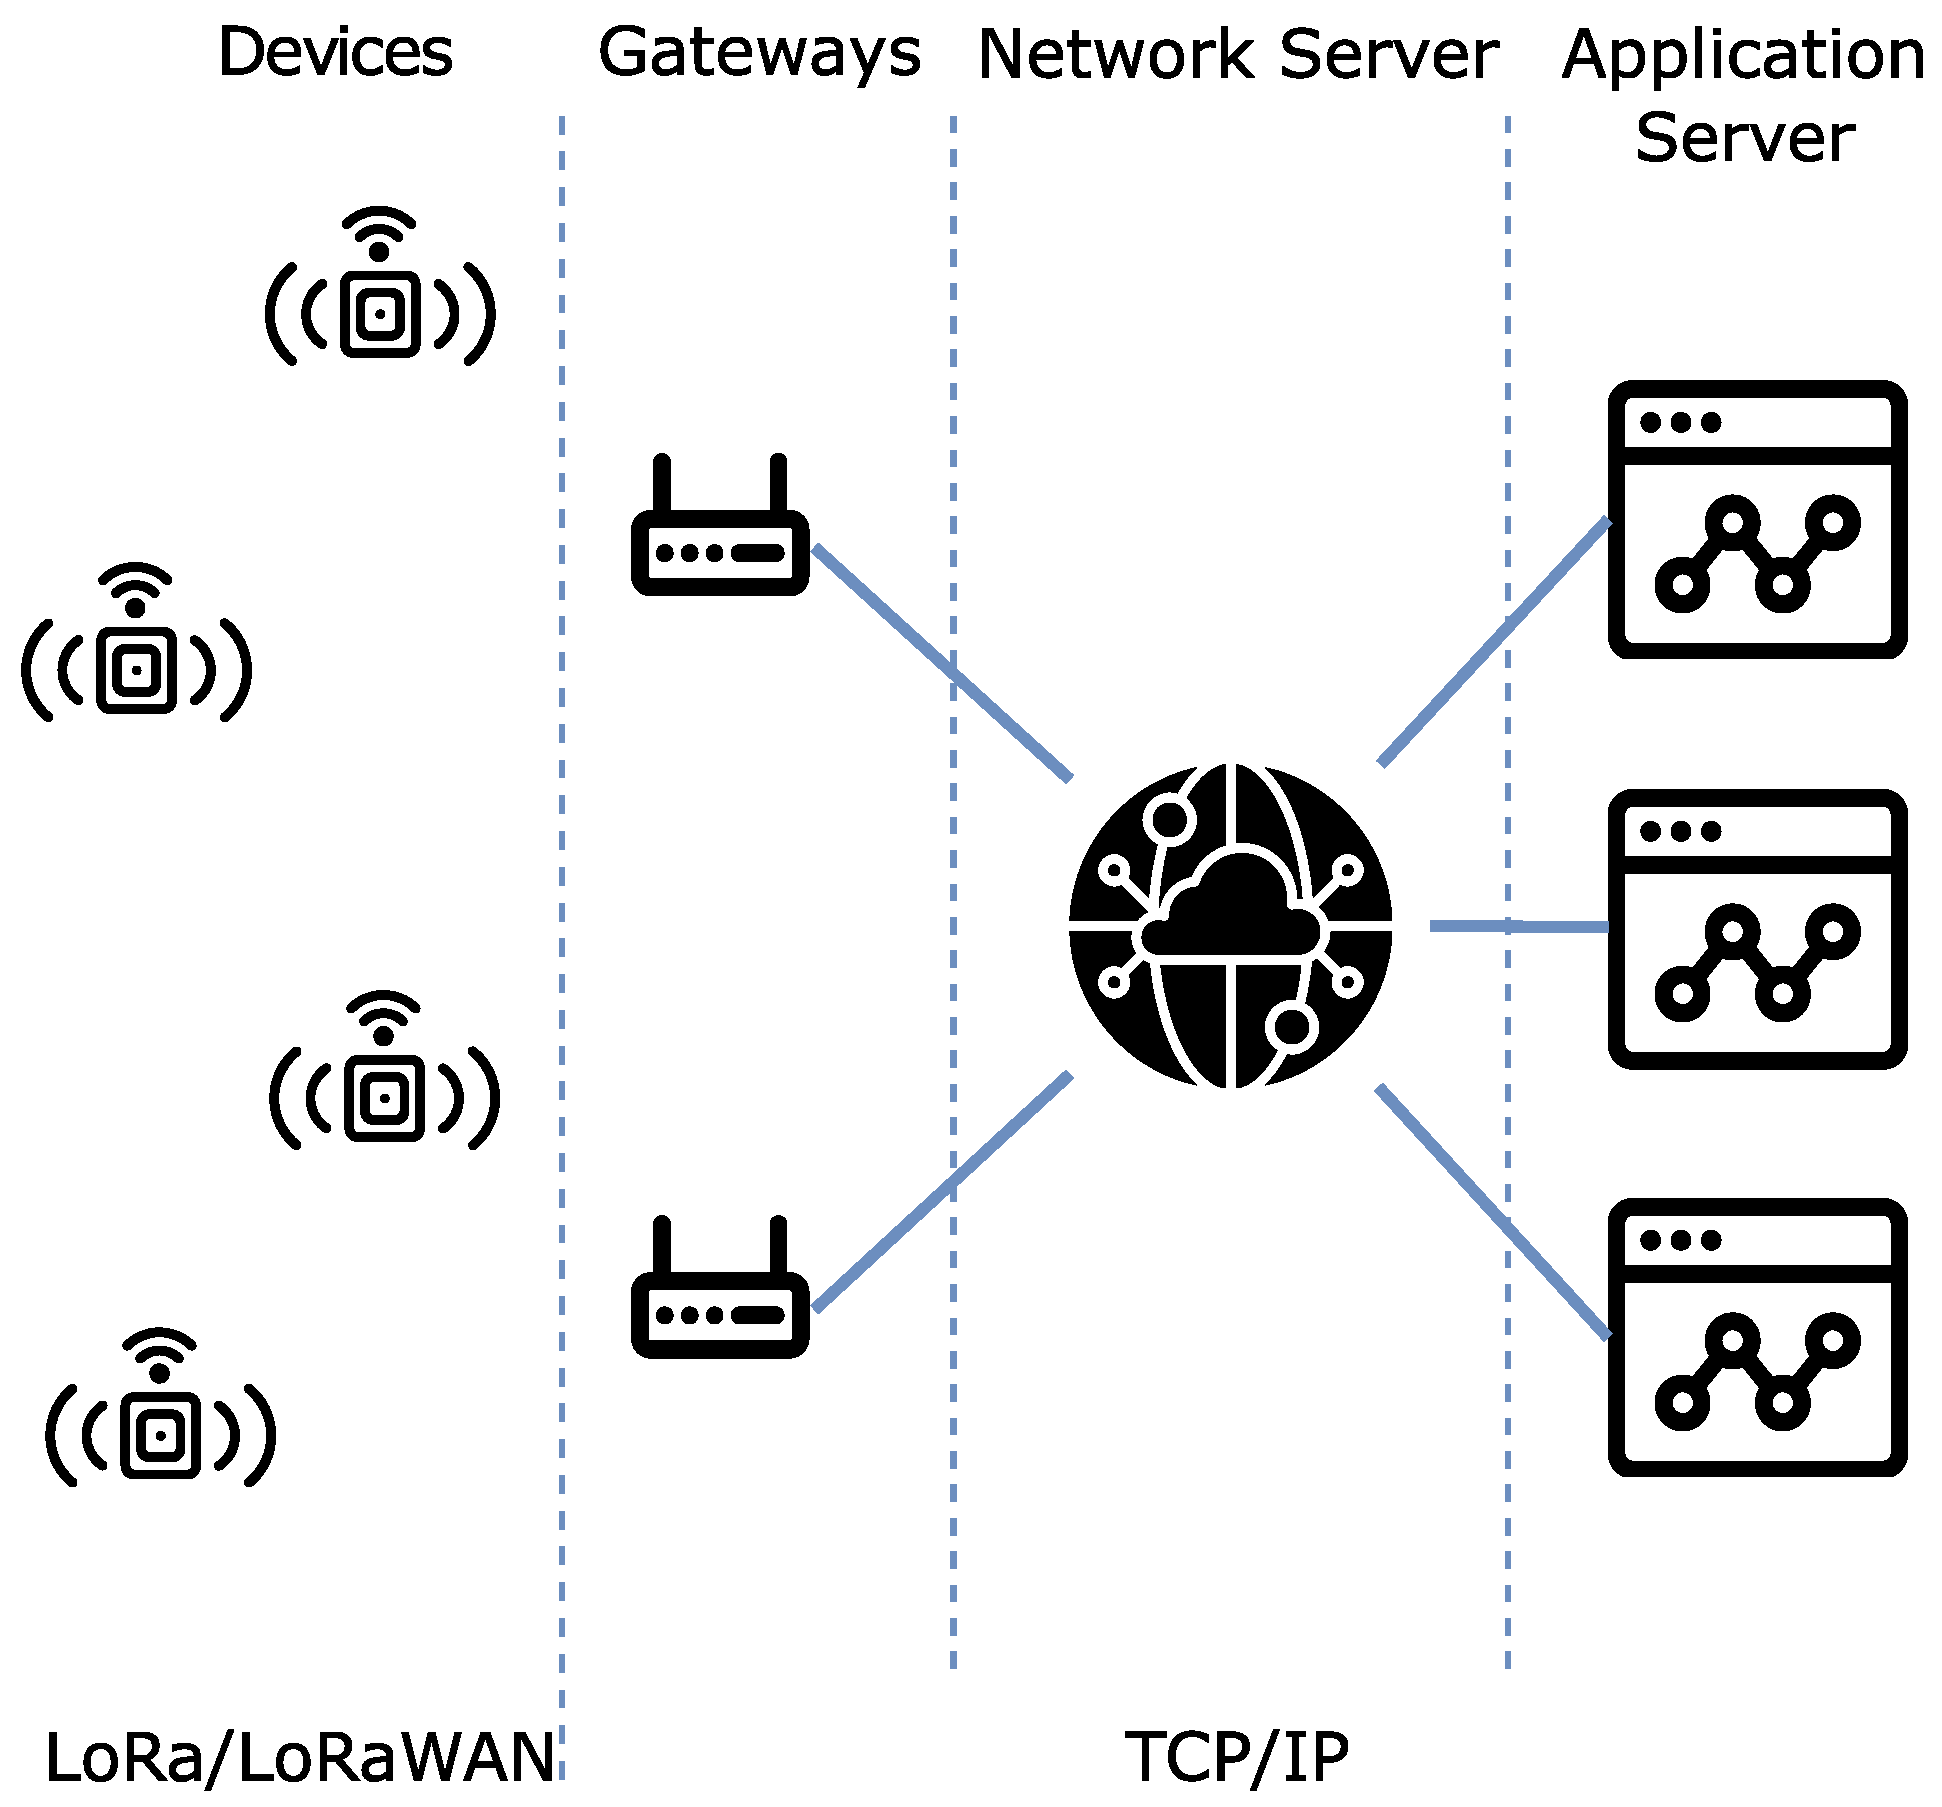
2.1. LPWAN for IoT and Smart Cities
LoRaWAN
2.2. The FIWARE Framework
2.3. Related Work
3. Materials and Methods
3.1. Methodology
3.2. Problem
3.3. Requirements
- The system must make use of components from the FIWARE catalog;
- The system must be scalable, in such a way that it may be scaled to support a wide geographic area, with high volumes of messages and multiple LPWAN networks:
- (a)
- The system must at least implement support for long-range wide-area network (LoRaWAN) over the things network (TTN);
- (b)
- The design choices must not limit future support for additional LPWAN networks, deployed using distinct protocols.
- The system must join metrics by some geographic area and aggregate them, obtaining the average value for each collected metric;
- The system should not lose more than 1% of messages received from data sources:
- (a)
- It is acceptable that this introduces significant latency in updating aggregated metrics, in the order of a few seconds.
- The system must make the aggregated metrics available, both to external systems through a web application programming interface (API), and to the final user through a graphical interface.
3.4. Design of the System Architecture
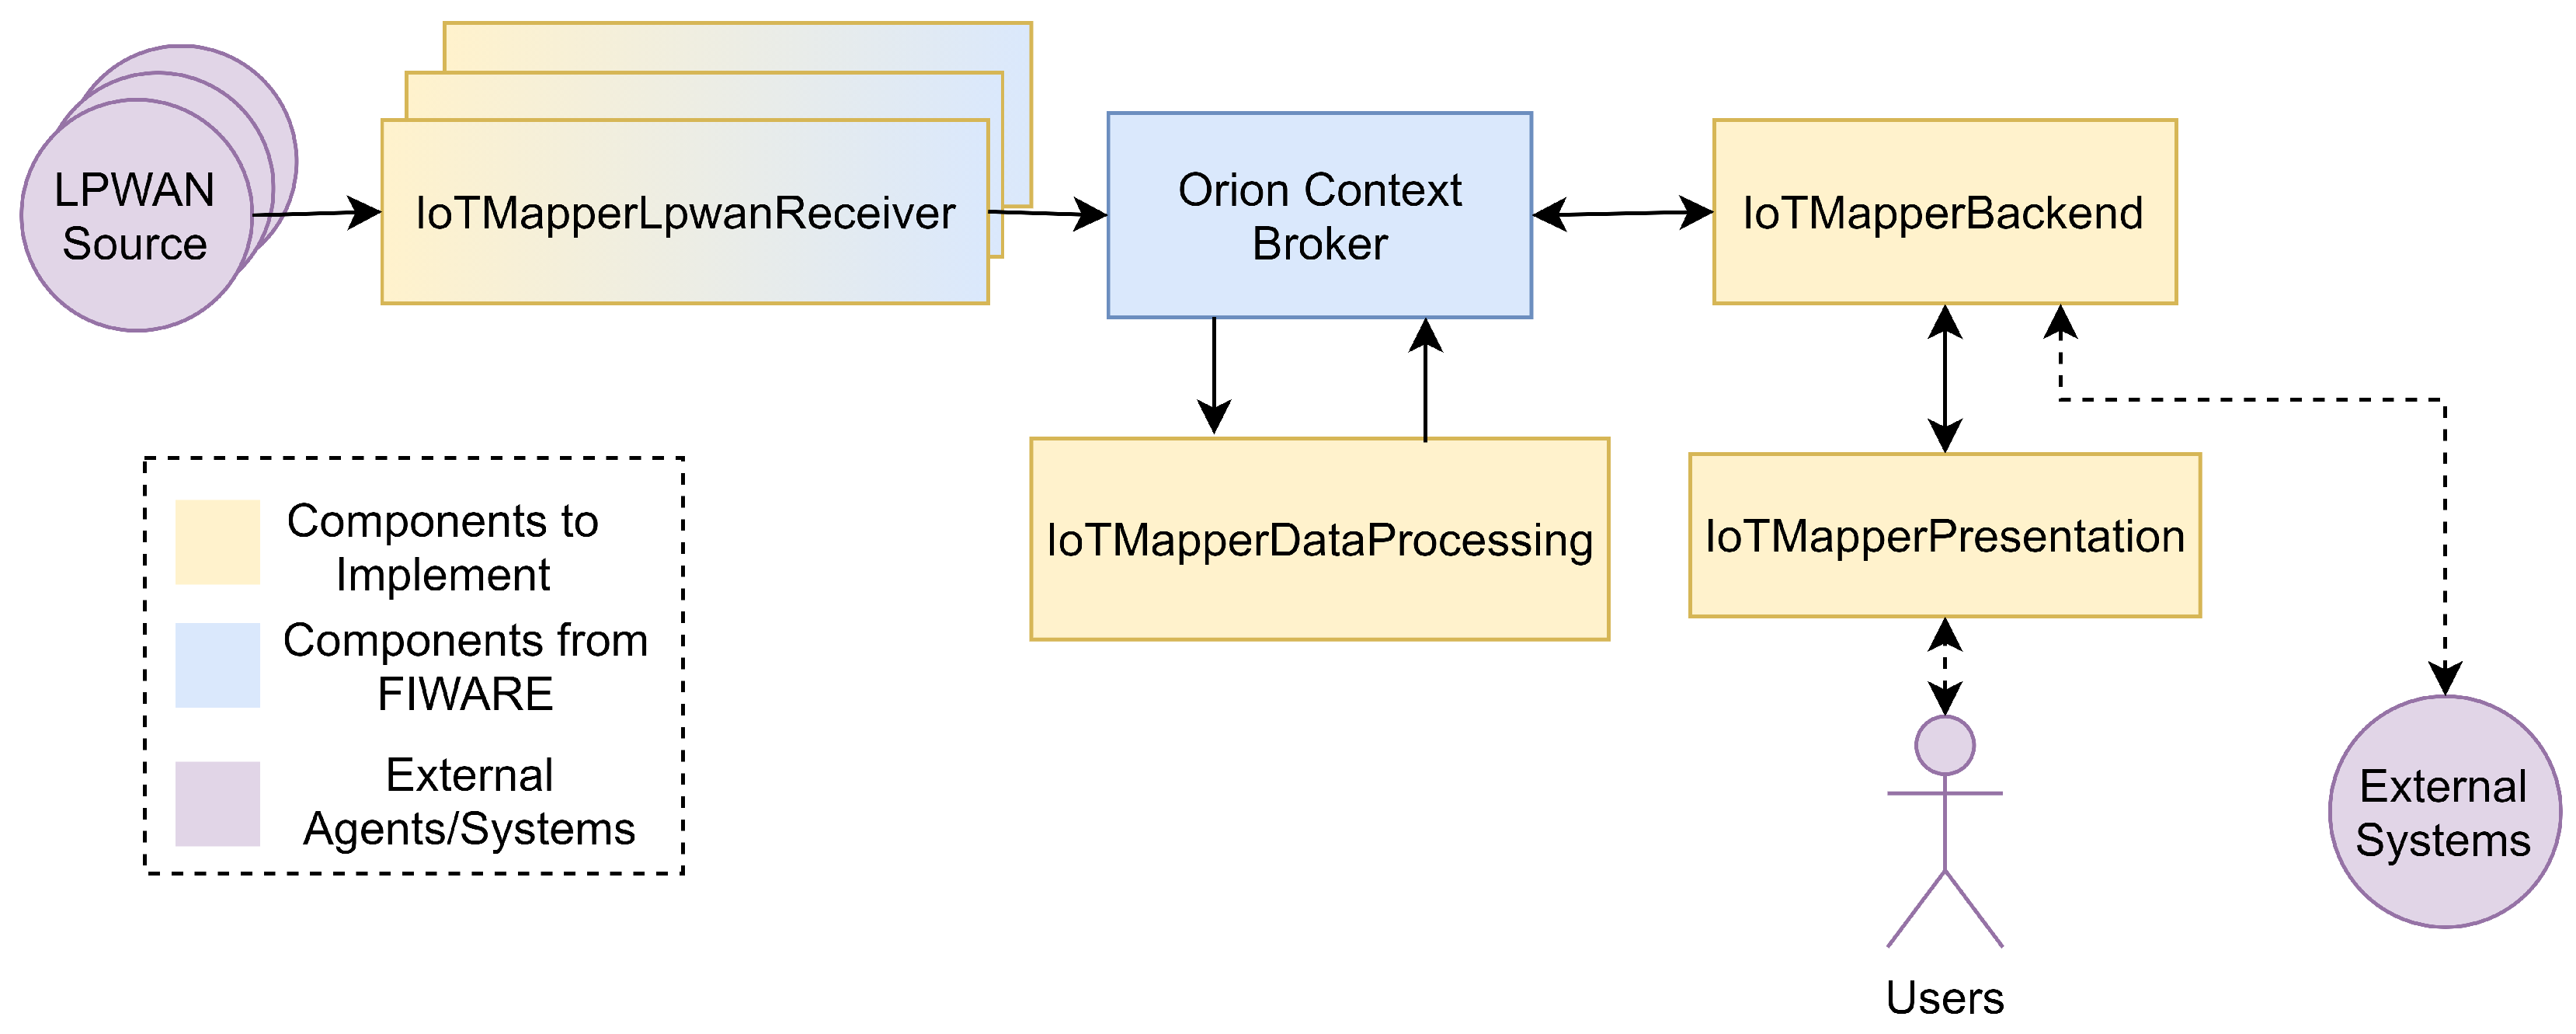
- The low-power wide-area networks (LPWAN) sources represent any external system, or internet-of-things (IoT) device that reports metrics about an LPWAN network.
- The IoTMapperLpwanReceivers are the set of components suitable for one or more LPWAN networks, mediating the reception and insertion of metrics. It may be any component capable of using the NGSI-v2 API, but the FIWARE catalog already offers some adequate components, namely the IoTAgents.
- The Orion Context Broker (OCB) performs the role of manager of the context data, composed of initial metrics events and the obtained aggregations, allowing the integration of other FIWARE components according to the NGSI-v2 API.
- The IoTMapperDataProcessing obtains the initial metrics from the OCB, processing them in near real time as a stream of events to be processed, filtered and aggregated into OCB as the final metrics entities.
- The IoTMapperBackend intermediates access to the managed context, allowing both external systems and the IoTMapperPresentation to consume the aggregated metrics entities, while abstracting implementation details, such as the FIWARE services used for the context separation of entities.
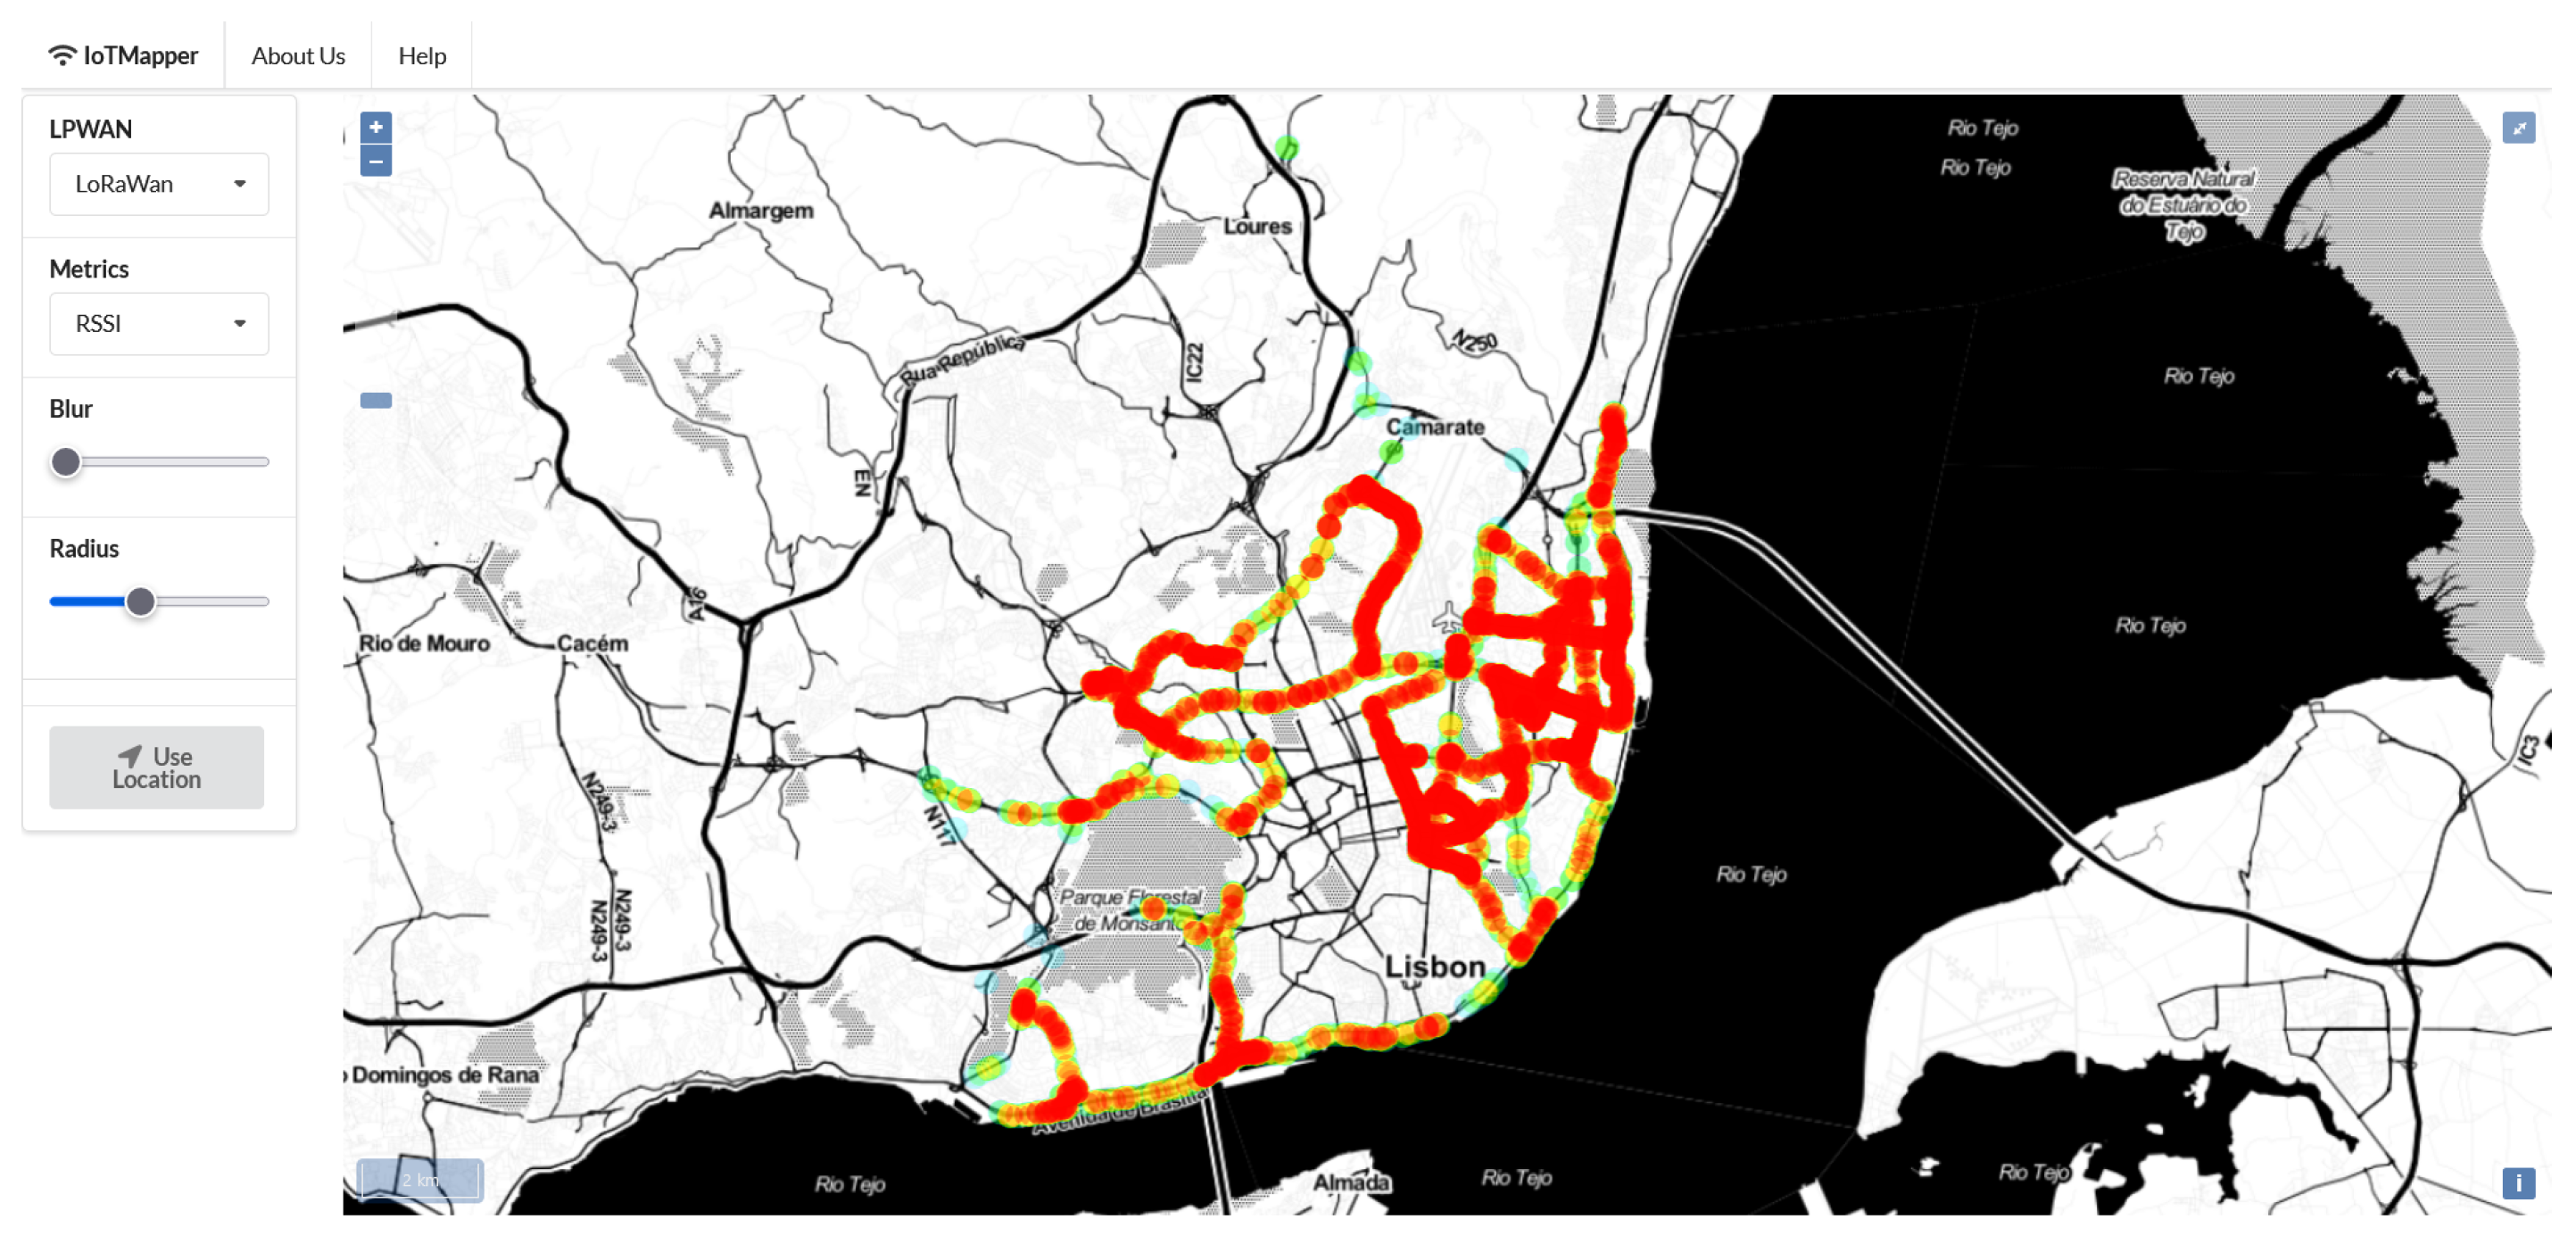
- The IoTMapperPresentation permits an initial and simplified overview of the aggregated metrics as a heatmap presenting the relative quality of the collected metrics.
3.5. Implementation Considerations
3.5.1. IoTMapperLpwanReceivers
3.5.2. Orion Context Broker—Layers for Separation
- A input flow: from the reception of metrics reports to the creation and update of the metrics aggregations;
- A exit flow: that allows the consumption of aggregations through IoTMapperBackend and IoTMapperPresentation.
3.5.3. IoTMapperDataProcessing
- A FIWARE Cygnus component that processes notifications received from the OCB, inserting them into a topic in the Apache Kafka broker.
- The Apache Kafka brokers that handle the distribution of messages between components, while ensuring exactly once message delivery guaranties.
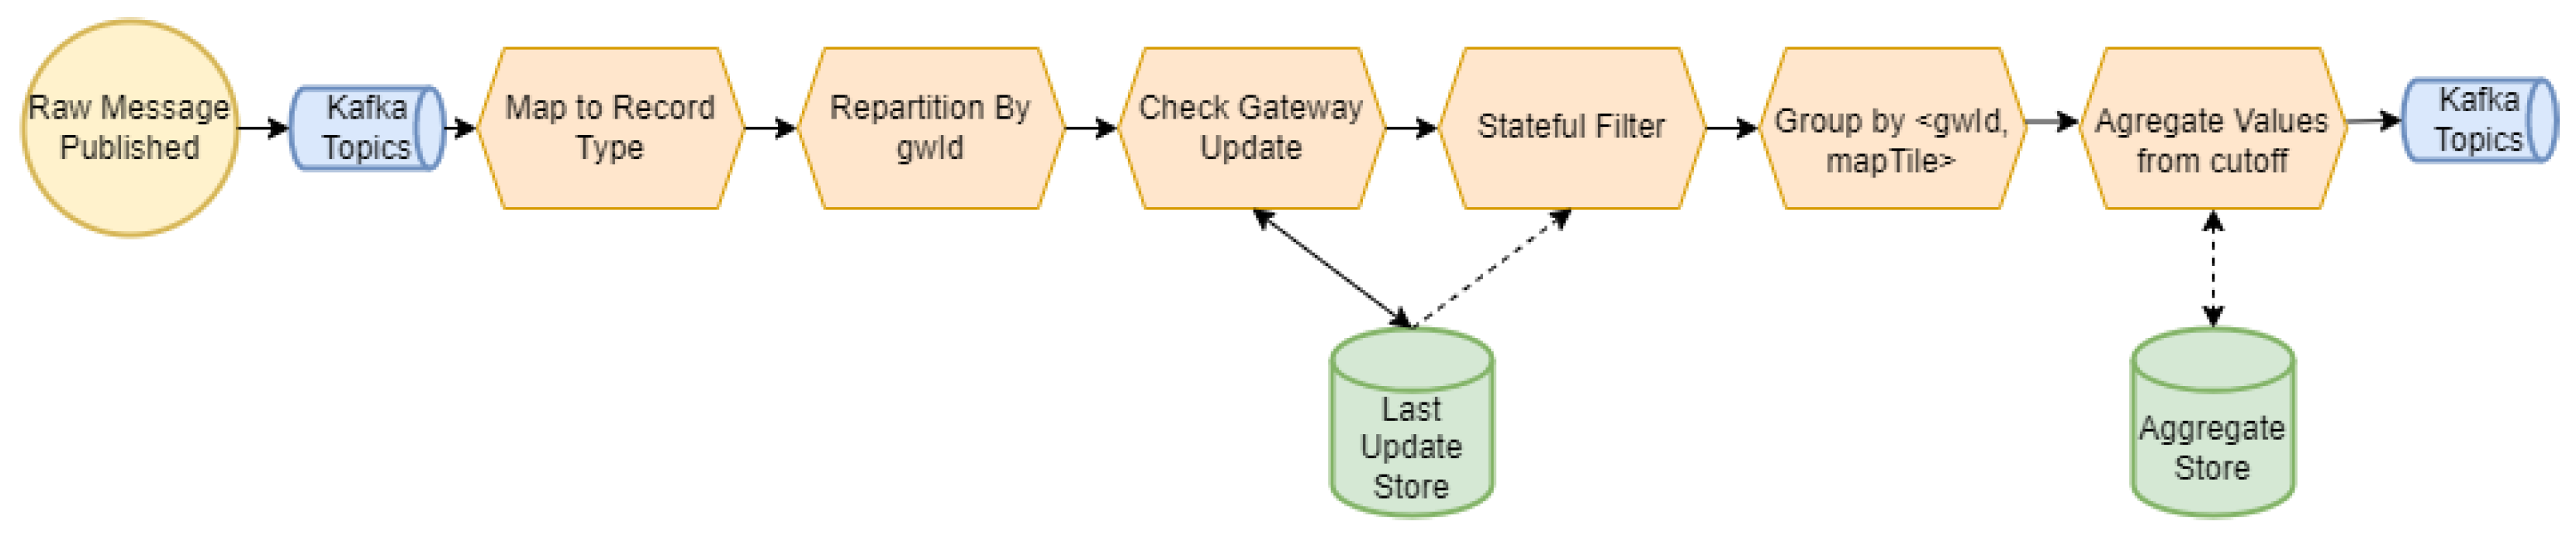
- The actual implementation of the IoTMapperDataProcessing logic, a set of Kafka Streams components, responsible for all processing of messages and the calculation of aggregated metrics. The processing is divided into steps that are check pointed into Apache Kafka topics.
- Mapping: Reading and mapping from a generic format, a MetricsReports, to a type specific to each LPWAN, a IMetricsRecord.
- Repartition: Initially, the messages do not have an associated key. The correct distribution of messages is assured by extracting from each message a gateway identifier (GwId) to be used as a key.
- Gateway update: The collected metrics are directly correlated with the test conditions (environment, weather, hardware, etc.). Any change on these will probably be reflected on the extracted samples, and one would need to redo the network surveys so that they are only valid while channel characteristics are reasonably unaltered. IoTMapperDataProcessing checks, for each new IMetricsRecord, a set of mechanisms to verify their validity. As a default, a gateway may not move more than 100 meters from the first observed location, and it is also possible to configure a time to live for IMetricsRecord. Whenever channel characteristics are deemed to have changed, a new aggregation is started. Another parameter of interest could be the time since the start of the current aggregation.
- Filtering: The message flow is filtered in order to exclude out-of-order messages posterior to the last change.
- Metrics grouping: The metrics are grouped in geographic areas (designated mapTiles), obtaining pairs . The mapTiles are formed as GeoHashes [38], due to the wide availability of compatible libraries.
- Metrics aggregation: The obtained set of metrics, already filtered, is aggregated obtaining the final internal representation, a IMetricsAggregate. The logic to aggregate metrics is specific to each LPWAN network.
- Writing the results: The aggregations are persisted in a topic to be consumed by Kafka Connect, already formed as NGSI-v2 entities (MetricsAggregations).
3.5.4. IoTMapperBackend
3.5.5. IoTMapperPresentation
3.6. Integration for Validation
3.7. Validation and Evaluation
4. Results and Discussion
4.1. First Stage—Validation
4.2. Second Stage—Evaluation
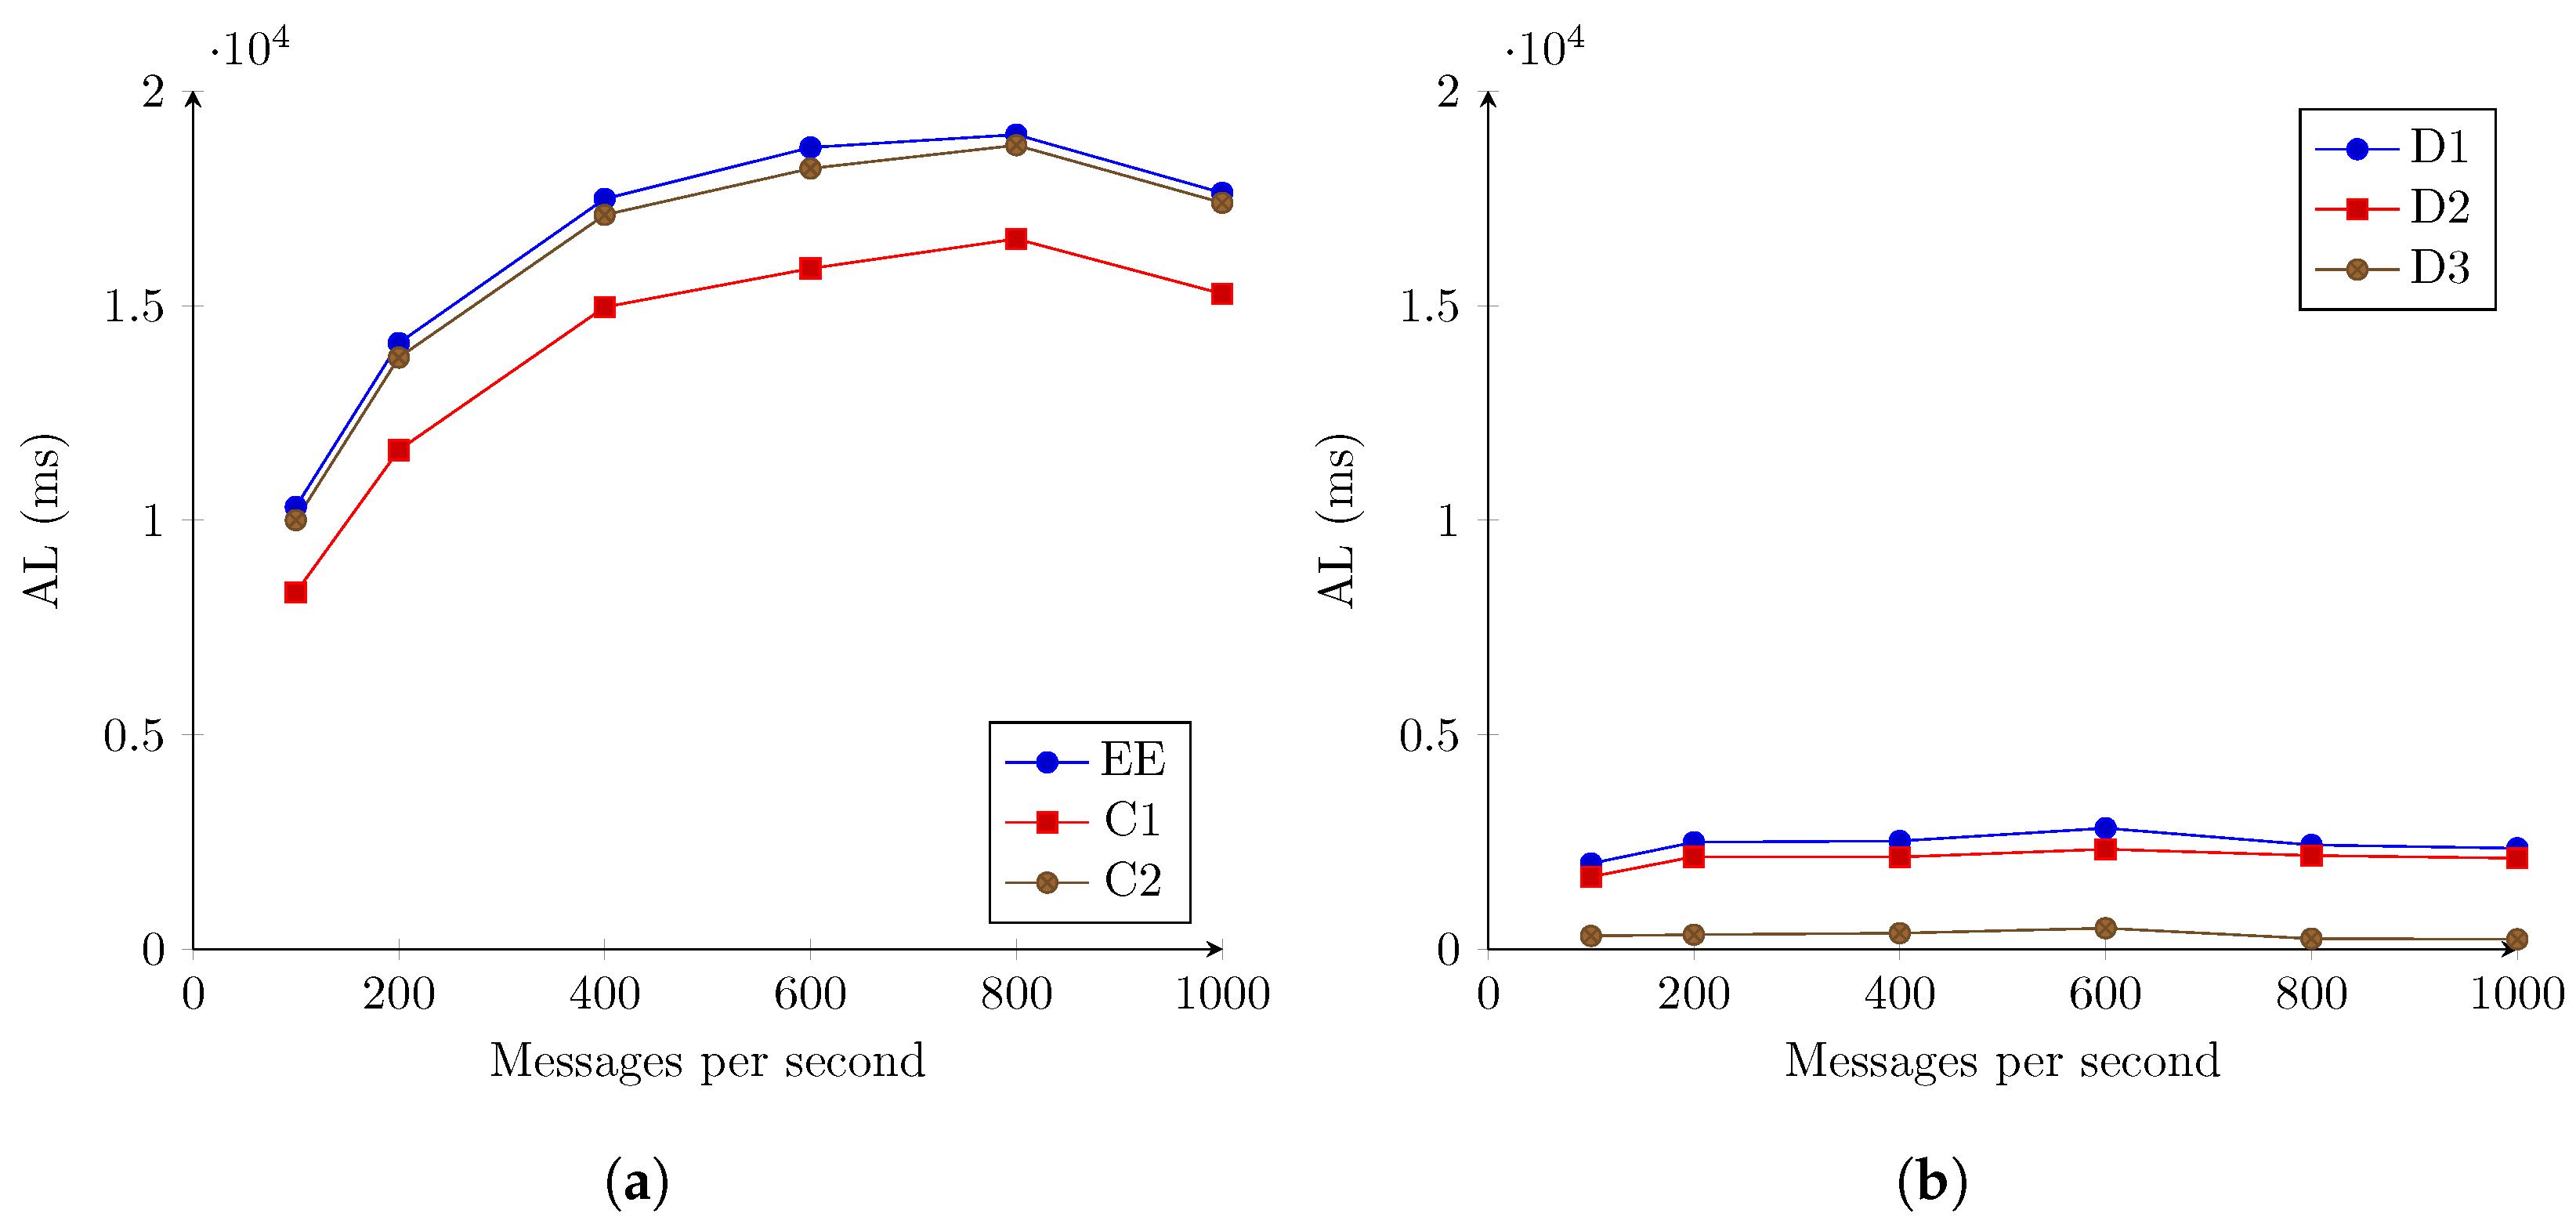
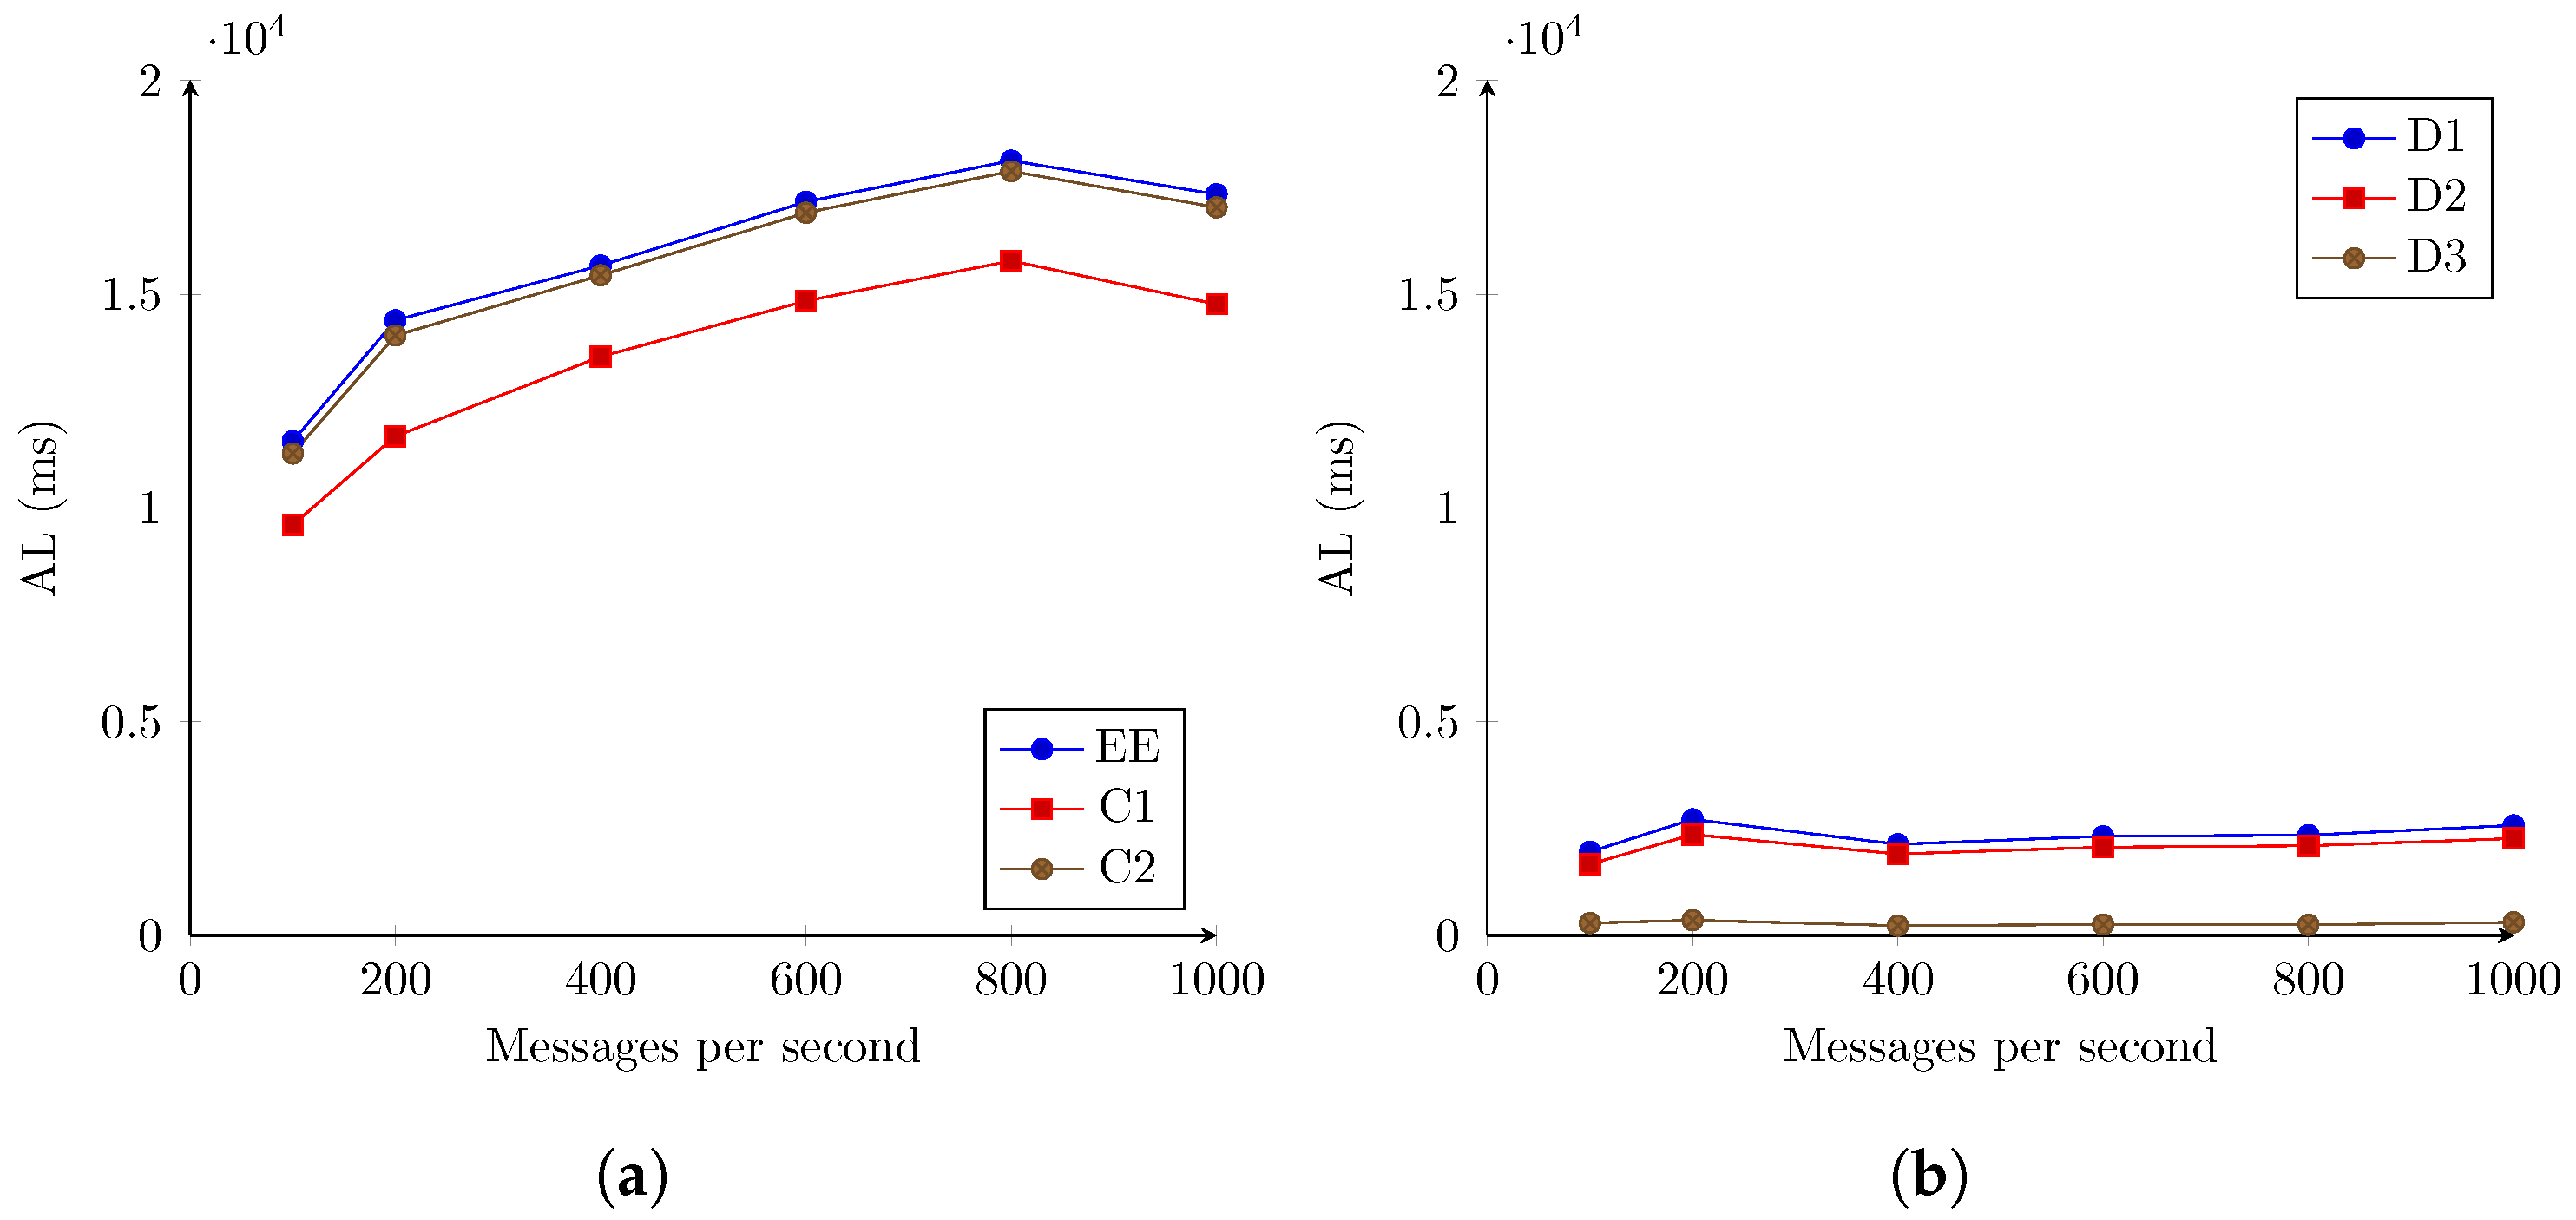
4.2.1. Latency
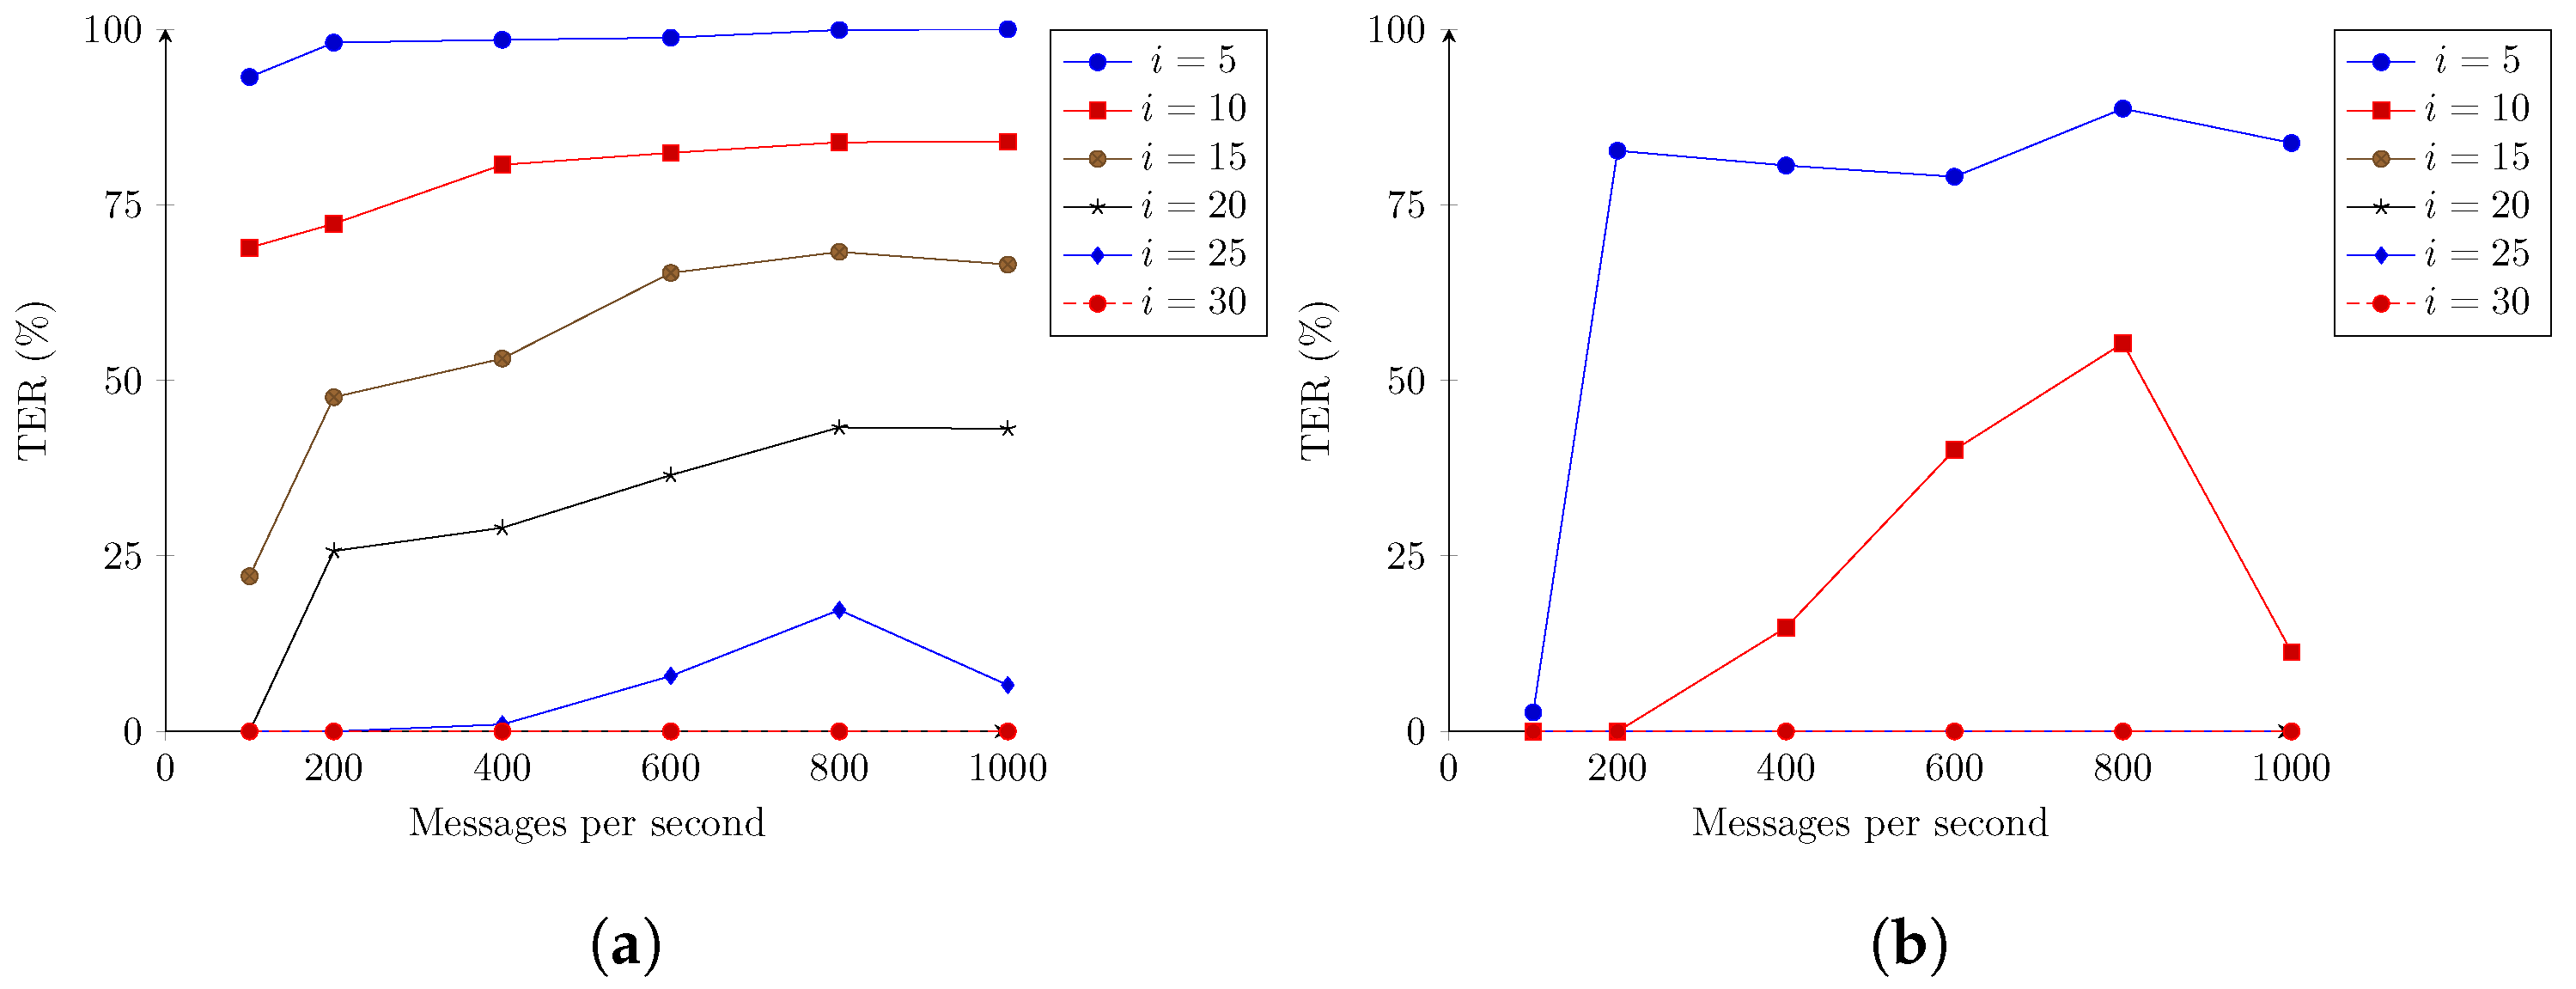
4.2.2. Error Rates
5. Conclusions
Author Contributions
Funding
Institutional Review Board Statement
Informed Consent Statement
Data Availability Statement
Acknowledgments
Conflicts of Interest
Appendix A
Appendix A.1
MetricsReport: description: ’Description of a generic and raw message entity, containing a message coming from a device or other data source.’ properties: dateCreated: description: ’Entity creation timestamp. This will usually be allocated by the storage platform.’ format: date-time type: string x-ngsi: type: Property dateModified: description: ’Timestamp of the last modification of the entity. This will usually be allocated by the storage platform.’ format: date-time type: string x-ngsi: type: Property id: anyOf: - description: ’Property. Identifier format of any NGSI entity’ maxLength: 256 minLength: 1 pattern: ’^[\w\-\.\{\}\$\+\*\[\]`|~^@!,:\\]+\$’ type: string - description: ’Property. Identifier format of any NGSI entity’ format: uri type: string description: ’Unique identifier of the entity’ x-ngsi: type: Property name: description: ’The name of this item.’ type: string x-ngsi: type: Property MetricsReport: description: ’The raw value of the report, represented as a string. Must be URL safe.’ type: string x-ngsi: model: https://schema.org/Text type: Property type: |
Appendix A.2
MetricsAggregation: description: ’Description of a generic aggregation of measures/metrics’ properties: dateCreated: description: ’Entity creation timestamp. This will usually be allocated by the storage platform.’ format: date-time type: string x-ngsi: type: Property dateModified: description: ’Timestamp of the last modification of the entity. This will usually be allocated by the storage platform.’ format: date-time type: string x-ngsi: type: Property id: description: ’Property. Identifier format of any NGSI entity’ maxLength: 256 minLength: 1 pattern: ’^[\w\-\.\{\}\$\+\*\[\]`|~^@!,:\\]+$’ type: string x-ngsi: type: Property name: description: ’The name of this item.’ type: string x-ngsi: type: Property type: description: ’NGSI Entity type. It has to be MetricsAggregation’ enum: - MetricsAggregation type: string x-ngsi: type: Property dateLastGwUpdate: description: ’Timestamp of the last action that led to the rest of the this aggregation’ format: date-time type: string x-ngsi: type: Property dateLastUpdate: description: ’Timestamp of the last measure aggregated’ format: date-time type: string x-ngsi: type: Property gwId: description: ’Unique identifier of the Gateway’ maxLength: 256 minLength: 1 pattern: ’^[\w\-\.\{\}\$\+\*\[\]`|~^@!,:\\]+$’ type: string x-ngsi: type: Property mapTile: description: ’Unique identifier of the geographic area’ maxLength: 128 minLength: 1 pattern: ’^[\w\-\.\{\}\$\+\*\[\]`|~^@!,:\\]+$’ type: string x-ngsi: type: Property measures: description: ’List of aggregated measures’ type: array items: properties: name: type: string value: type: double type: object location: description: ’Geojson reference to the location covered by the item. It can be Polygon or MultiPolygon’ oneOf: - description: ’Geoproperty. Geojson reference to the item. Polygon’ properties: bbox: items: type: number minItems: 4 type: array coordinates: items: items: items: type: number minItems: 2 type: array minItems: 4 type: array type: array type: enum: - Polygon type: string required: - type - coordinates title: ’GeoJSON Polygon’ type: object - description: ’Geoproperty. Geojson reference to the item. MultiPolygon’ properties: bbox: items: type: number minItems: 4 type: array coordinates: items: items: items: items: type: number minItems: 2 type: array minItems: 4 type: array type: array type: array type: enum: - MultiPolygon type: string required: - type - coordinates title: ’GeoJSON MultiPolygon’ type: object x-ngsi: type: Geoproperty required: - id - type - gwId - mapTile - measures - location type: object version: 1.0.0 |
References
- United Nations Population Fund—Urbanization. Available online: https://www.unfpa.org/urbanization (accessed on 18 May 2022).
- Paiva, S.; Ahad, M.; Tripathi, G.; Feroz, N.; Casalino, G. Enabling Technologies for Urban Smart Mobility: Recent Trends, Opportunities and Challenges. Sensors 2021, 21, 2143. [Google Scholar] [CrossRef]
- Cruz, N.; Cota, N.; Tremoceiro, J. LoRaWAN and Urban Waste Management—A Trial. Sensors 2021, 21, 2142. [Google Scholar] [CrossRef] [PubMed]
- Rubio-Aparicio, J.; Cerdan-Cartagena, F.; Suardiaz-Muro, J.; Ybarra-Moreno, J. Design and Implementation of a Mixed IoT LPWAN Network Architecture. Sensors 2019, 19, 675. [Google Scholar] [CrossRef] [PubMed] [Green Version]
- Mekki, K.; Bajic, E.; Chaxel, F.; Meyer, F. A comparative study of LPWAN technologies for large-scale IoT deployment. ICT Express 2019, 5, 1–7. [Google Scholar] [CrossRef]
- Lalle, Y.; Fourati, L.C.; Fourati, M.; Barraca, J.P. A Comparative Study of LoRaWAN, SigFox, and NB-IoT for Smart Water Grid. In Proceedings of the 2019 Global Information Infrastructure and Networking Symposium (GIIS), Paris, France, 18–20 December 2019; pp. 1–6. [Google Scholar] [CrossRef]
- LoRa Aliance. LoRaWAN™ 1.1 Specification. 2017. Available online: https://lora-alliance.org/wp-content/uploads/2020/11/lorawantm_specification_-v1.1.pdf (accessed on 21 March 2022).
- Andrade, R.O.; Yoo, S.G. A Comprehensive Study of the Use of LoRa in the Development of Smart Cities. Appl. Sci. 2019, 9, 4753. [Google Scholar] [CrossRef] [Green Version]
- Basford, P.J.; Bulot, F.M.J.; Apetroaie-Cristea, M.; Cox, S.J.; Ossont, S.J. LoRaWAN for Smart City IoT Deployments: A Long Term Evaluation. Sensors 2020, 20, 648. [Google Scholar] [CrossRef] [PubMed] [Green Version]
- GSMA. NB-IoT Deployment Guide—Release 3. 2013. Available online: https://www.gsma.com/iot/wp-content/uploads/2019/07/201906-GSMA-NB-IoT-Deployment-Guide-v3.pdf (accessed on 21 March 2022).
- Gozalvez, J. New 3GPP Standard for IoT [Mobile Radio]. IEEE Veh. Technol. Mag. 2016, 11, 14–20. [Google Scholar] [CrossRef]
- Cirillo, F.; Solmaz, G.; Berz, E.L.; Bauer, M.; Cheng, B.; Kovacs, E. A Standard-Based Open Source IoT Platform: FIWARE. IEEE Internet Things Mag. 2019, 2, 12–18. [Google Scholar] [CrossRef]
- Fonseca, J.; Márquez, F.; Jacobs, T. NGSIv2 API Specification—v2.0n. Available online: https://fiware.github.io/specifications/ngsiv2/stable/ (accessed on 20 November 2021).
- TTNMapper Documentation. Available online: https://docs.ttnmapper.org/ (accessed on 21 November 2021).
- HeliumMapper. Available online: https://github.com/helium/mappers (accessed on 15 November 2021).
- Liya, M.L.; Arjun, D. A Survey of LPWAN Technology in Agricultural Field. In Proceedings of the 2020 Fourth International Conference on I-SMAC (IoT in Social, Mobile, Analytics and Cloud) (I-SMAC), Palladam, India, 7–9 October 2020; IEEE: Piscataway, NJ, USA, 2020; pp. 313–317. [Google Scholar] [CrossRef]
- Gomez, C.; Paradells, J. Urban Automation Networks: Current and Emerging Solutions for Sensed Data Collection and Actuation in Smart Cities. Sensors 2015, 15, 22874–22898. [Google Scholar] [CrossRef] [PubMed] [Green Version]
- Hu, Z.; Xue, G.; Chen, Y.; Li, M.; Wang, M.; Lv, F. City-Wide NB-IoT Network Monitoring and Diagnosing. Wirel. Commun. Mob. Comput. 2022, 2022, 3153274. [Google Scholar] [CrossRef]
- Yang, D.; Shen, L.; Zhang, X.; Chang, X.; Huang, J.; Xing, G. Software Suite for NB-IoT Measurement Analysis. In Proceedings of the EWSN, Beijing, China, 25–27 February 2019; pp. 279–281. [Google Scholar]
- The Things Network. Available online: http://thethingsnetwork.org (accessed on 21 November 2021).
- Blenn, N.; Kuipers, F. LoRaWAN in the Wild: Measurements from The Things Network. arXiv 2017. [Google Scholar] [CrossRef]
- Beliatis, M.J.; Mansour, H.; Nagy, S.; Aagaard, A.; Presser, M. Digital waste management using LoRa network a business case from lab to fab. In Proceedings of the 2018 Global Internet of Things Summit (GIoTS), Bilbao, Spain, 4–7 June 2018; pp. 1–6. [Google Scholar] [CrossRef]
- Magrin, D.; Centenaro, M.; Vangelista, L. Performance evaluation of LoRa networks in a smart city scenario. In Proceedings of the 2017 IEEE International Conference on Communications (ICC), Paris, France, 21–25 May 2017; pp. 1–7. [Google Scholar] [CrossRef]
- Stusek, M.; Moltchanov, D.; Masek, P.; Andreev, S.; Koucheryavy, Y.; Hosek, J. Time-Dependent Propagation Analysis and Modeling of LPWAN Technologies. In Proceedings of the 2020 IEEE Globecom Workshops (GC Wkshps), Taipei, Taiwan, 7–11 December 2020; pp. 1–7. [Google Scholar] [CrossRef]
- Stusek, M.; Moltchanov, D.; Masek, P.; Mikhaylov, K.; Hosek, J.; Andreev, S.; Koucheryavy, Y.; Kustarev, P.; Zeman, O.; Roubicek, M. LPWAN Coverage Assessment Planning Without Explicit Knowledge of Base Station Locations. IEEE Internet Things J. 2022, 9, 4031–4050. [Google Scholar] [CrossRef]
- Kousias, K.; Caso, G.; Alay, O.; Brunstrom, A.; Nardis, L.D.; Benedetto, M.G.D.; Neri, M. Coverage and Deployment Analysis of Narrowband Internet of Things in the Wild. IEEE Commun. Mag. 2020, 58, 39–45. [Google Scholar] [CrossRef]
- Zhohov, R.; Minovski, D.; Johansson, P.; Andersson, K. Real-time Performance Evaluation of LTE for IIoT. In Proceedings of the 2018 IEEE 43rd Conference on Local Computer Networks (LCN), Chicago, IL, USA, 1–4 October 2018; IEEE: Piscataway, NJ, USA, 2018; pp. 623–631. [Google Scholar] [CrossRef] [Green Version]
- Brodsky, I. H3: Uber’s Hexagonal Hierarchical Spatial Index. Available online: https://eng.uber.com/h3/ (accessed on 10 June 2022).
- Kubernetes. Available online: https://kubernetes.io/ (accessed on 12 August 2022).
- Huß, R.; Ibryam, B. Kubernetes Patterns: Reusable Elements for Designing Cloud-Native Applications, 1st ed.; O’Reilly Media: Sebastopol, CA, USA, 2019. [Google Scholar]
- Abdollahi Vayghan, L.; Saied, M.A.; Toeroe, M.; Khendek, F. Deploying Microservice Based Applications with Kubernetes: Experiments and Lessons Learned. In Proceedings of the 2018 IEEE 11th International Conference on Cloud Computing (CLOUD), San Francisco, CA, USA, 2–7 July 2018; pp. 970–973. [Google Scholar] [CrossRef]
- Masek, P.; Stusek, M.; Krejci, J.; Zeman, K.; Pokorny, J.; Kudlacek, M. Unleashing Full Potential of Ansible Framework: University Labs Administration. In Proceedings of the 2018 22nd Conference of Open Innovations Association (FRUCT), Jyvaskyla, Finland, 15–18 May 2018; IEEE: Piscataway, NJ, USA, 2018; pp. 144–150. [Google Scholar] [CrossRef]
- Kreps, J.; Narkhede, N.; Rao, J. Kafka: A Distributed Messaging System for Log Processing. In Proceedings of the NetDB’11, Athens, Greece, 12 June 2011. [Google Scholar]
- Auradkar, A.; Botev, C.; Das, S.; De Maagd, D.; Feinberg, A.; Ganti, P.; Gao, L.; Ghosh, B.; Gopalakrishna, K.; Harris, B.; et al. Data Infrastructure at LinkedIn. In Proceedings of the 2012 IEEE 28th International Conference on Data Engineering, Arlington, VA, USA, 1–5 April 2012; IEEE Computer Society: Washington, DC, USA, 2012; pp. 1370–1381. [Google Scholar] [CrossRef]
- Narkhede, N.; Shapira, G.; Palino, T.K. The Definitive Guide: Real-Time Data and Stream Processing at Scale, 1st ed.; O’Reilly Media: Sebastopol, CA, USA, 2017. [Google Scholar]
- Bejeck, B. Kafka Streams in Action: Real-Time Apps and Microservices with the Kafka Streams API, 1st ed.; O’Reilly Media: Sebastopol, CA, USA, 2018. [Google Scholar]
- Kafka Connect. Available online: https://kafka.apache.org/documentation/#connect (accessed on 25 November 2021).
- OpenStreetMap—GeoHash. Available online: https://wiki.openstreetmap.org/wiki/Geohash (accessed on 15 December 2021).
- Arthur, J.; Azadegan, S. Spring Framework for Rapid Open Source J2EE Web Application Development: A Case Study. In Proceedings of the Sixth International Conference on Software Engineering, Artificial Intelligence, Networking and Parallel/Distributed Computing and First ACIS International Workshop on Self-Assembling Wireless Networks (SNPD/SAWN’05), Towson, MD, USA, 23–25 May 2005; IEEE: Piscataway, NJ, USA, 2005; pp. 90–95. [Google Scholar] [CrossRef]
- Mythily, M.; Samson Arun Raj, A.; Thanakumar Joseph, I. An Analysis of the Significance of Spring Boot in The Market. In Proceedings of the 2022 International Conference on Inventive Computation Technologies (ICICT), Lalitpur, Nepal, 20–22 July 2022; IEEE: Piscataway, NJ, USA, 2022; pp. 1277–1281. [Google Scholar] [CrossRef]
- React Framework. Available online: https://reactjs.org/ (accessed on 12 December 2021).
- Microk8s. Available online: https://microk8s.io/ (accessed on 1 August 2022).
- Böhm, S.; Wirtz, G. Profiling Lightweight Container Platforms: MicroK8s and K3s in Comparison to Kubernetes. In Proceedings of the 13th Central European Workshop on Services and their Composition, Bamberg, Germany, 25–26 February 2021. [Google Scholar]
- Eclipse Mosquitto. Available online: https://mosquitto.org/ (accessed on 20 November 2021).
- Araujo, V.; Mitra, K.; Saguna, S.; Åhlund, C. Performance evaluation of FIWARE: A cloud-based IoT platform for smart cities. J. Parallel Distrib. Comput. 2019, 132, 250–261. [Google Scholar] [CrossRef]
- Zyrianoff, I.; Heideker, A.; Silva, D.; Kleinschmidt, J.; Soininen, J.P.; Salmon Cinotti, T.; Kamienski, C. Architecting and Deploying IoT Smart Applications: A Performance–Oriented Approach. Sensors 2019, 20, 84. [Google Scholar] [CrossRef] [PubMed]


| Legend | Description | CPU | Memory | Operating System |
|---|---|---|---|---|
| TFM-00 | Deploys the Input Layer | 4 vCPU | 16 Gb | Ubuntu 22.04 LTS (5.15.0-40-generic) |
| TFM-01 | Deploys the Exit Layer | 4 vCPU | 8 Gb | Ubuntu 22.04 LTS (5.15.0-40-generic) |
| TFM-02 | Runs test loads | 4 vCPU | 8 Gb | Ubuntu 22.04 LTS (5.15.0-40-generic) |
| Legend | Name | Description |
|---|---|---|
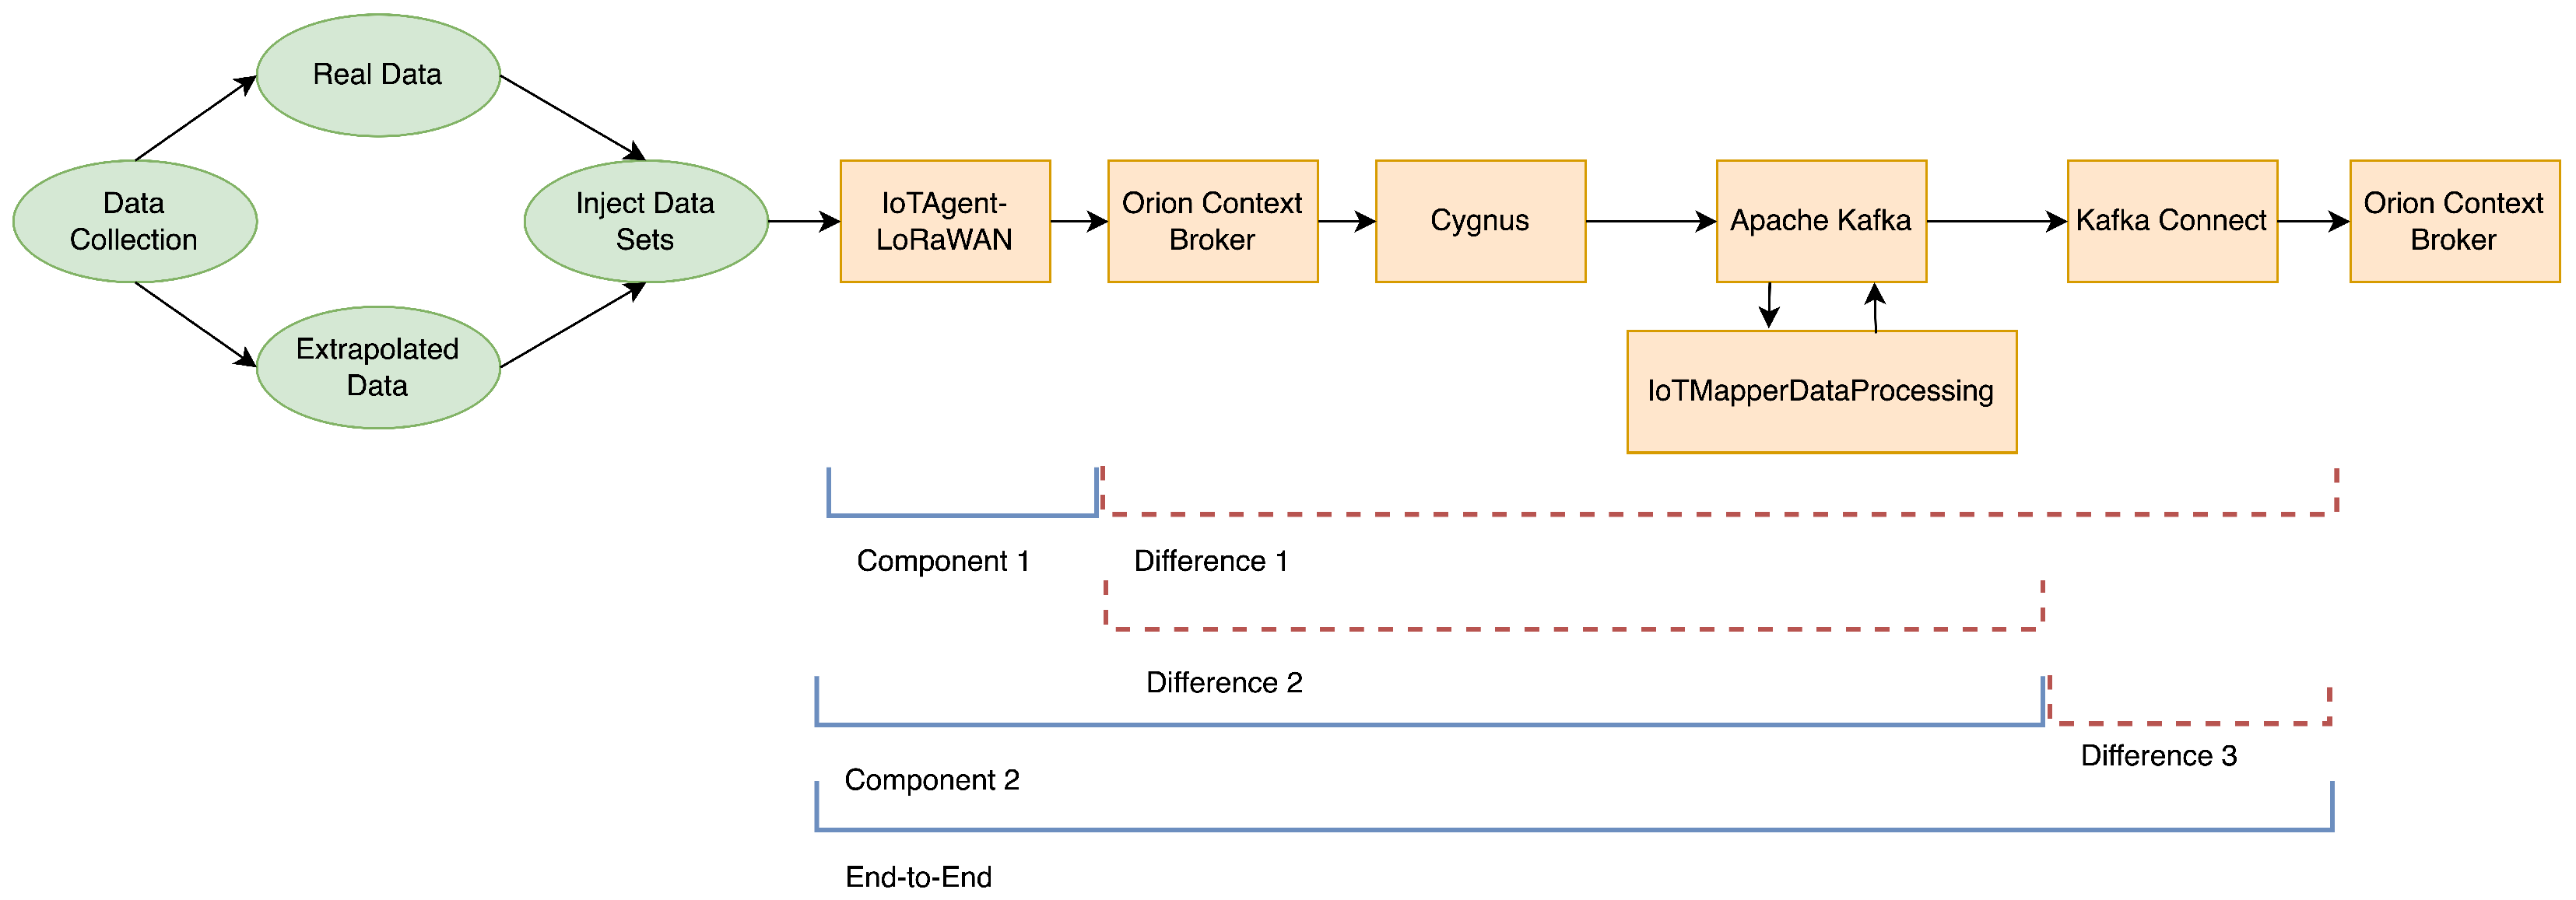
| EE | End-To-End | Latency measured from message creation to being written as an aggregation in the Orion Context Broker (OCB) |
| C1 | Component 1 | Latency measured at the moment the IoTAgent-LoRaWAN finishes sending each message to the OCB |
| C2 | Component 2 | Latency measured at the moment each aggregation is written to Apache Kafka |
| D1 | Difference 1 | Difference in latencies measured in EE and C1. Latency for all components, but IoTAgent-LoRaWAN |
| D2 | Difference 2 | Difference in latencies measured in C1 and C2. Latency spent processing the message into an aggregation |
| D3 | Difference 3 | Difference in latencies measured in EE and C2. Latency spent inserting each aggregation into the OCB |
Publisher’s Note: MDPI stays neutral with regard to jurisdictional claims in published maps and institutional affiliations. |
© 2022 by the authors. Licensee MDPI, Basel, Switzerland. This article is an open access article distributed under the terms and conditions of the Creative Commons Attribution (CC BY) license (https://creativecommons.org/licenses/by/4.0/).
Share and Cite
Vitorino, J.P.; Cruz, N. IoTMapper: A Metrics Aggregation System Architecture in Support of Smart City Solutions. Sensors 2022, 22, 7484. https://doi.org/10.3390/s22197484
Vitorino JP, Cruz N. IoTMapper: A Metrics Aggregation System Architecture in Support of Smart City Solutions. Sensors. 2022; 22(19):7484. https://doi.org/10.3390/s22197484
Chicago/Turabian StyleVitorino, João Pedro, and Nuno Cruz. 2022. "IoTMapper: A Metrics Aggregation System Architecture in Support of Smart City Solutions" Sensors 22, no. 19: 7484. https://doi.org/10.3390/s22197484