
Electrochemical Sensor Based on Iron(II) Phthalocyanine and Gold Nanoparticles for Nitrite Detection in Meat Products

 ,
, 
Abstract
:
1. Introduction
2. Materials and Methods
2.1. Materials
2.2. Electrodes Preparation
2.3. Instrumentation
2.4. Preparation of Meat Food Samples
2.5. Statistical Analysis
3. Results and Discussion
3.1. Characterization of the FePc(tBu)4/GCE and Au/FePc(tBu)4/GCE
3.2. Charge Transfer Behavior of GCE, FePc(tBu)4/GCE and Au/FePc(tBu)4/GCE
3.3. Effect of the Electrolyte pH on Nitrite Oxidation
3.4. Cyclic Voltammetry Characterization of GCE, FePc(tBu)4/GCE, and Au/FePc(tBu)4/GCE
3.5. The Mechanism of Nitrite Oxidation on the FePc(tBu)4/GCE and Au/FePc(tBu)4/GCE
3.6. Nitrite Detection

| Electrode | Method (pH) | Concentration Range | LOD (μM) | Sensitivity (μAμM−1) | Ref. |
|---|---|---|---|---|---|
| AuNP/rGO HMS/GCE a | Amp (7) | 0.5 μM–2.8 mM | 0.5 | - | [67] |
| Rose-like AuNPs/ MoS2 nanoflower/graphene | Amp (4.7) | 0.5 μM–5 mM | 1 | - | [68] |
| GCE modified with Pd/CoPc nanorods | DPV (6) | 0–5 mM | 0.1 | 0.01 | [33] |
| Nano-Au/Ch/GCE b | DPV (7) | 0.7–750 μM | 0.1 | 0.35 | [66] |
| Au-Fe(III) nanoparticle/GCE |
DPV (7) | 0.3–150 μM | 0.3 | 0.13 | [69] |
| FeMAPc-MPA/AuNPs/GCE |
DPV (5.8) | 1.9 μM–2 mM | 0.21 | 0.015 | [34] |
| AuNPs/GCE | - | 0.008 | |||
| Dendrimer/AuNPs/GCE c |
Amp (5) | 10–5000 μM | 0.2 | - | [56] |
| CoTM-QOPc/CNP/GCE d | Amp (7) | 0.1–350 μM | 0.033 | - | [21] |
| Fe(III)P/MWCNTs/GCE e | Amp (4) |
1–600 μM 0.6–1.6 mM | 0.5 | - | [70] |
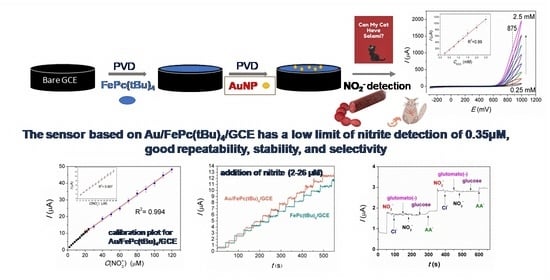
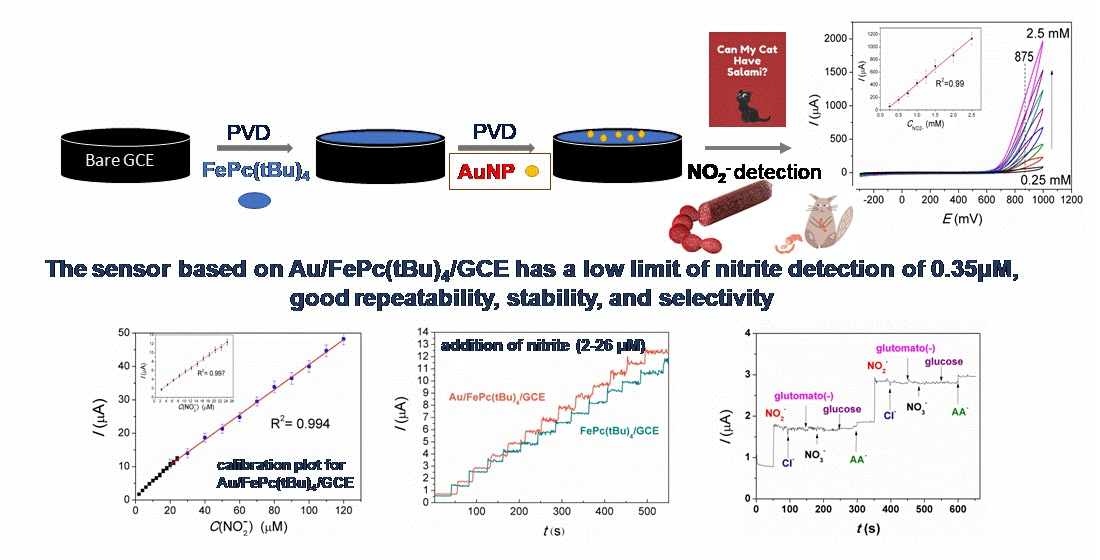
| FePc(tBu)4/GCE | Amp (6.8) | 2–26 μM (20–120 μM) | 0.63 | 0.36 (0.33) | This work |
| Au/FePc(tBu)4/GCE | 0.35 | 0.46 (0.42) |
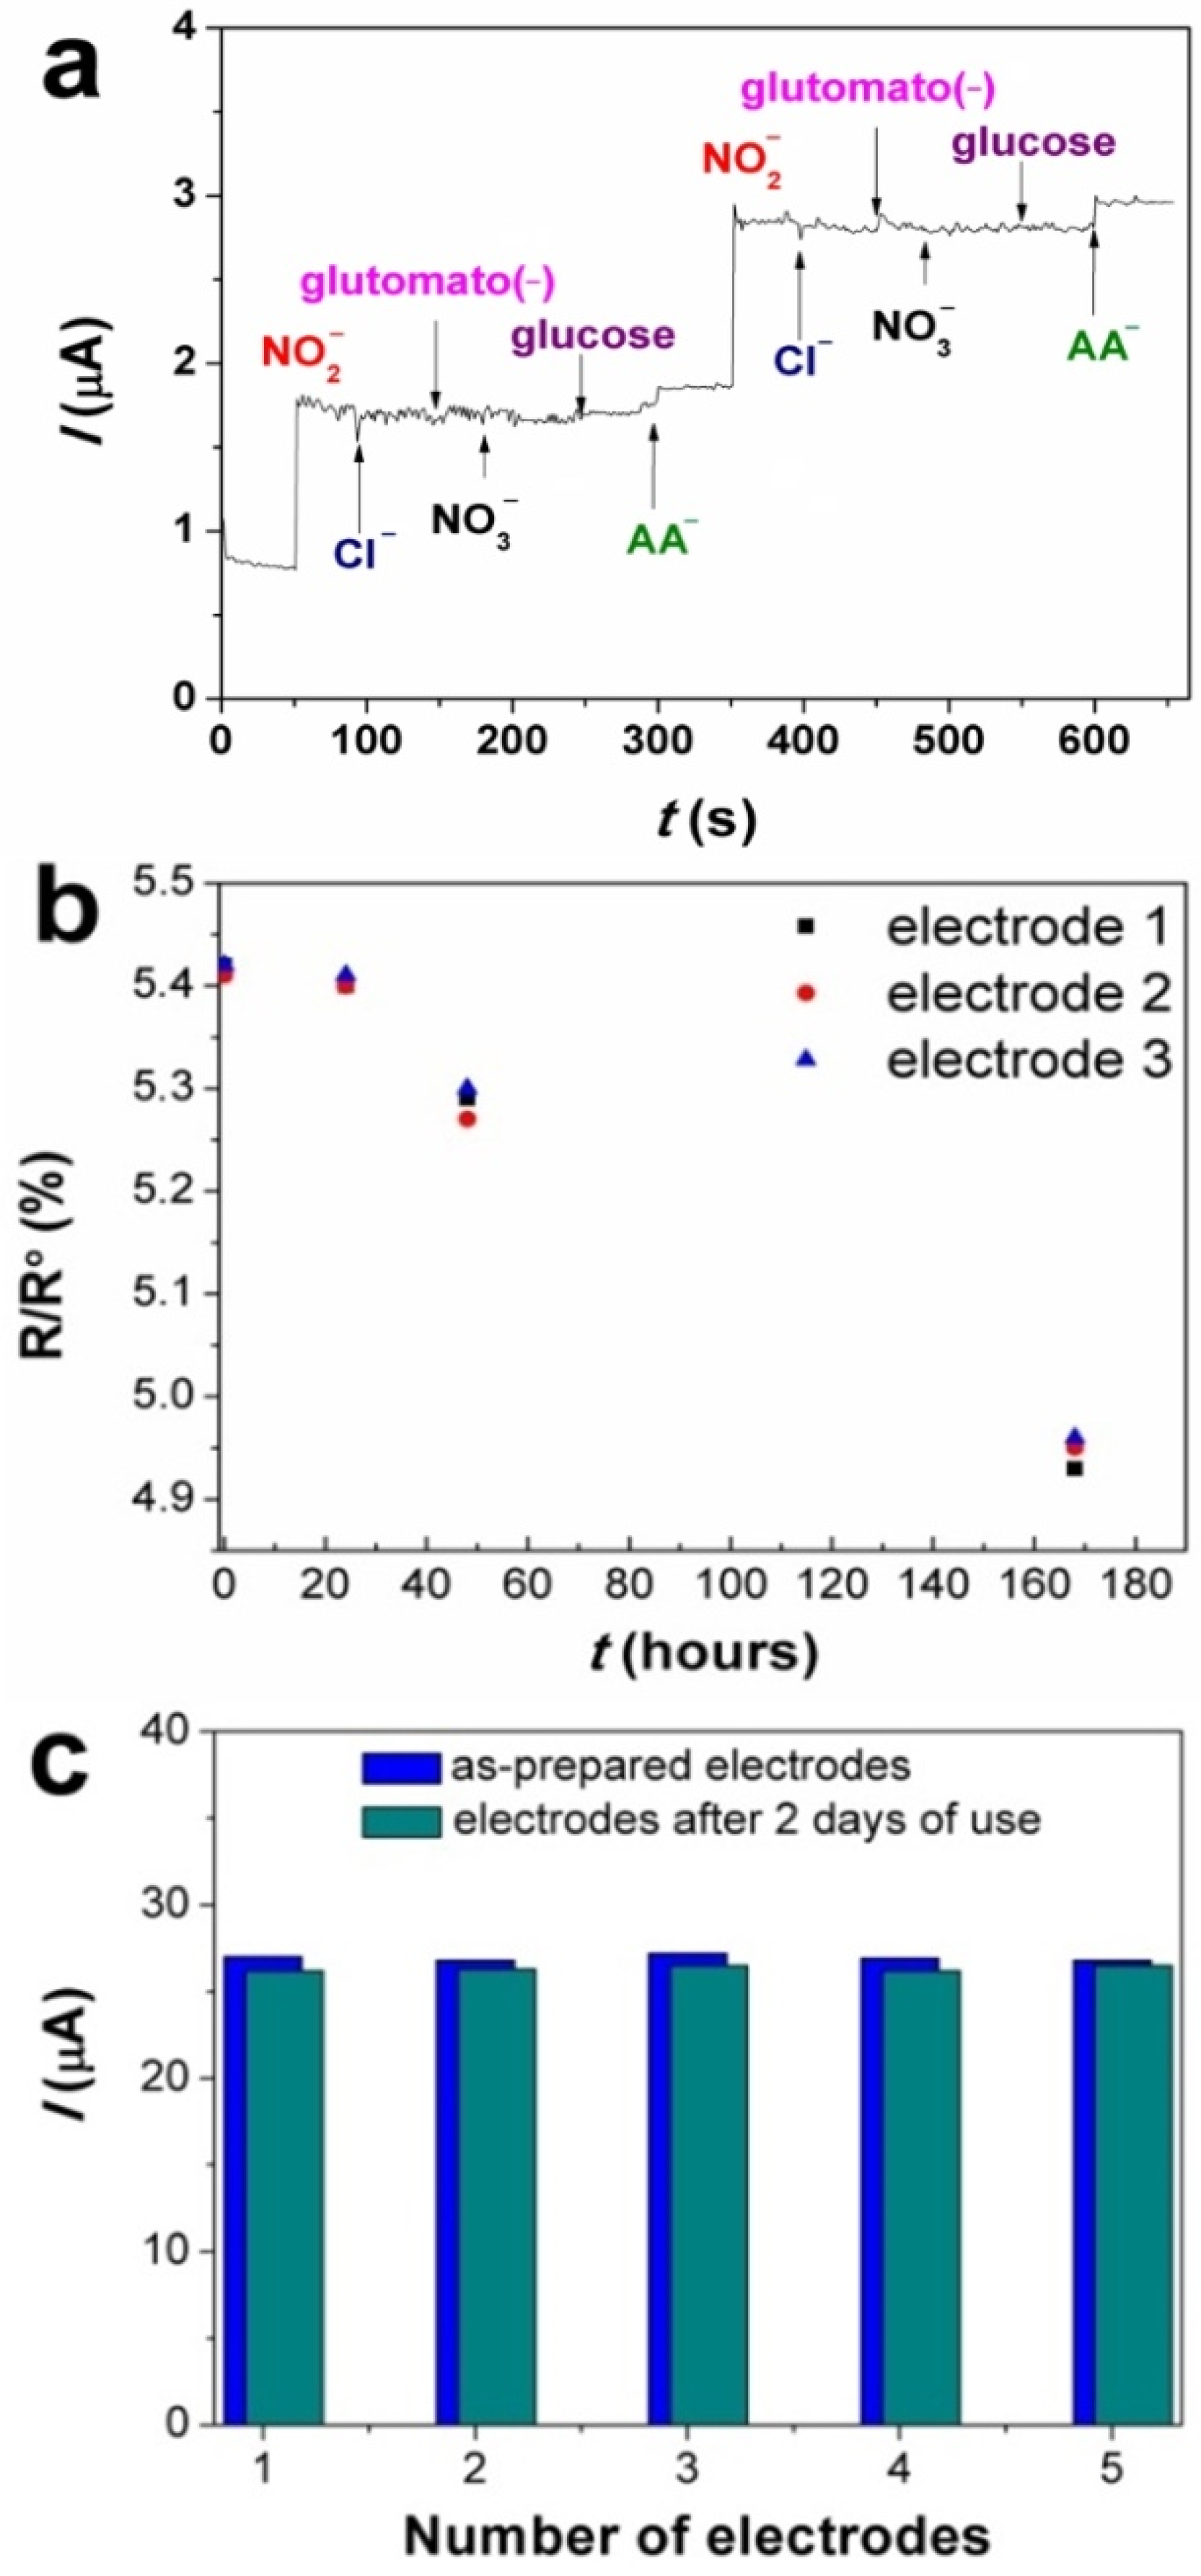
3.7. Selectivity, Stability, and Reproducibility of Au/FePc(tBu)4/GCE
3.8. Real Meat Food Sample Analysis Using Au/FePc(tBu)4/GCE
4. Conclusions
Supplementary Materials
Author Contributions
Funding
Institutional Review Board Statement
Informed Consent Statement
Data Availability Statement
Acknowledgments
Conflicts of Interest
References
- Neth, M.R.; Love, J.S.; Horowitz, B.Z.; Shertz, M.D.; Sahni, R.; Daya, M.R. Fatal Sodium Nitrite Poisoning: Key Considerations for Prehospital Providers. Prehospital Emerg. Care 2021, 25, 844–850. [Google Scholar] [CrossRef]
- Tricker, A.R.; Preussmann, R. Carcinogenic N-nitrosamines in the diet: Occurrence, formation, mechanisms and carcinogenic potential. Mutat. Res. Toxicol. 1991, 259, 277–289. [Google Scholar] [CrossRef]
- Sudarvizhi, A.; Siddiqha, Z.A.; Pandian, K. Single step synthesis of graphene oxide protected silver nanoparticles using aniline as reducing agent and study its application on electrocatalytic detection of nitrite in food samples. J. Chem. Appl. Biochem. 2014, 1, 101. [Google Scholar]
- Abdulmumeen, H.A.; Risikat, A.N.; Sururah, A.R. Food: Its preservatives, additives and applications. Int. J. Chem. Biochem. Sci. 2012, 1, 36–47. [Google Scholar] [CrossRef]
- Martinez, J.; Dabert, P.; Barrington, S.; Burton, C. Livestock waste treatment systems for environmental quality, food safety, and sustainability. Bioresour. Technol. 2009, 100, 5527–5536. [Google Scholar] [CrossRef] [Green Version]
- Coviello, D.; Pascale, R.; Ciriello, R.; Salvi, A.M.; Guerrieri, A.; Contursi, M.; Scrano, L.; Bufo, S.A.; Cataldi, T.R.I.; Bianco, G. Validation of an analytical method for nitrite and nitrate determination in meat foods for infants by ion chromatography with conductivity detection. Foods 2020, 9, 1238. [Google Scholar] [CrossRef] [PubMed]
- Santos, W.J.R.; Lima, P.R.; Tanaka, A.A.; Tanaka, S.M.C.N.; Kubota, L.T. Determination of nitrite in food samples by anodic voltammetry using a modified electrode. Food Chem. 2009, 113, 1206–1211. [Google Scholar] [CrossRef]
- Da Silva, S.; Cosnier, S.; Almeida, M.G.; Moura, J.J.G. An efficient poly(pyrrole-viologen)-nitrite reductase biosensor for the mediated detection of nitrite. Electrochem. Commun. 2004, 6, 404–408. [Google Scholar] [CrossRef]
- Da Rocha, J.; Angnes, L.; Bertotti, M.; Araki, K.; Toma, H. Amperometric detection of nitrite and nitrate at tetraruthenated porphyrin-modified electrodes in a continuous-flow assembly. Anal. Chim. Acta 2002, 452, 23–28. [Google Scholar] [CrossRef]
- Chen, L.; Liu, X.; Wang, C.; Lv, S.; Chen, C. Amperometric nitrite sensor based on a glassy carbon electrode modified with electrodeposited poly(3,4-ethylenedioxythiophene) doped with a polyacenic semiconductor. Microchim. Acta 2017, 184, 2073–2079. [Google Scholar] [CrossRef]
- Zhang, Y.; Chen, P.; Wen, F.; Huang, C.; Wang, H. Construction of polyaniline/molybdenum sulfide nanocomposite: Characterization and its electrocatalytic performance on nitrite. Ionics 2016, 22, 1095–1102. [Google Scholar] [CrossRef]
- Wang, G.; Han, R.; Feng, X.; Li, Y.; Lin, J.; Luo, X. A glassy carbon electrode modified with poly(3,4-ethylenedioxythiophene) doped with nano-sized hydroxyapatite for amperometric determination of nitrite. Microchim. Acta 2017, 184, 1721–1727. [Google Scholar] [CrossRef]
- Fan, X.; Lin, P.; Liang, S.; Hui, N.; Zhang, R.; Feng, J.; Xu, G. Gold nanoclusters doped poly(3,4-ethylenedioxythiophene) for highly sensitive electrochemical sensing of nitrite. Ionics 2017, 23, 997–1003. [Google Scholar] [CrossRef]
- Deng, K.; Zhou, J.; Huang, H.; Ling, Y.; Li, C. Electrochemical Determination of Nitrite Using a Reduced Graphene Oxide–Multiwalled Carbon Nanotube-Modified Glassy Carbon Electrode. Anal. Lett. 2016, 49, 2917–2930. [Google Scholar] [CrossRef]
- Rabti, A.; Ben Aoun, S.; Raouafi, N. A sensitive nitrite sensor using an electrode consisting of reduced graphene oxide functionalized with ferrocene. Microchim. Acta 2016, 183, 3111–3117. [Google Scholar] [CrossRef]
- Sheng, Q.; Liu, D.; Zheng, J. A nonenzymatic electrochemical nitrite sensor based on Pt nanoparticles loaded Ni(OH)2/multi-walled carbon nanotubes nanocomposites. J. Electroanal. Chem. 2017, 796, 9–16. [Google Scholar] [CrossRef]
- Cui, L.; Zhu, J.; Meng, X.; Yin, H.; Pan, X.; Ai, S. Controlled chitosan coated Prussian blue nanoparticles with the mixture of graphene nanosheets and carbon nanoshperes as a redox mediator for the electrochemical oxidation of nitrite. Sens. Actuators B Chem. 2012, 161, 641–647. [Google Scholar] [CrossRef]
- Sudarvizhi, A.; Pandian, K.; Oluwafemi, O.S.; Gopinath, S.C.B. Amperometry detection of nitrite in food samples using tetrasulfonated copper phthalocyanine modified glassy carbon electrode. Sens. Actuators B Chem. 2018, 272, 151–159. [Google Scholar] [CrossRef]
- Matemadombo, F.; Nyokong, T. Characterization of self-assembled monolayers of iron and cobalt octaalkylthiosubstituted phthalocyanines and their use in nitrite electrocatalytic oxidation. Electrochim. Acta 2007, 52, 6856–6864. [Google Scholar] [CrossRef]
- Aralekallu, S.; Mohammed, I.; Manjunatha, N.; Palanna, M.; Dhanjai; Sannegowda, L.K. Synthesis of novel azo group substituted polymeric phthalocyanine for amperometric sensing of nitrite. Sens. Actuators B Chem. 2019, 282, 417–425. [Google Scholar] [CrossRef]
- Jilani, B.S.; Mounesh; Malathesh, P.; Mruthyunjayachari, C.D.; Reddy, K.R.V. Cobalt (II) tetra methyl-quinoline oxy bridged phthalocyanine carbon nano particles modified glassy carbon electrode for sensing nitrite: A voltammetric study. Mater. Chem. Phys. 2020, 239, 121920. [Google Scholar] [CrossRef]
- Lu, S.; Jia, H.; Hummel, M.; Wu, Y.; Wang, K.; Qi, X.; Gu, Z. Two-dimensional conductive phthalocyanine-based metal-organic frameworks for electrochemical nitrite sensing. RSC Adv. 2021, 11, 4472–4477. [Google Scholar] [CrossRef] [PubMed]
- Baranton, S.; Coutanceau, C.; Garnier, E.; Léger, J.M. How does α-FePc catalysts dispersed onto high specific surface carbon support work towards oxygen reduction reaction (orr)? J. Electroanal. Chem. 2006, 590, 100–110. [Google Scholar] [CrossRef]
- Mamuru, S.A.; Ozoemena, K.I. Impedimetric and electrocatalytic properties of nanostructured iron(II) phthalocyanine at pyrolytic graphite electrode. Mater. Chem. Phys. 2009, 114, 113–119. [Google Scholar] [CrossRef]
- Zagal, J.H.; Griveau, S.; Silva, J.F.; Nyokong, T.; Bedioui, F. Metallophthalocyanine-based molecular materials as catalysts for electrochemical reactions. Coord. Chem. Rev. 2010, 254, 2755–2791. [Google Scholar] [CrossRef]
- Sousa, A.L.; Santos, W.J.R.; Luz, R.C.S.; Damos, F.S.; Kubota, L.T.; Tanaka, A.A.; Tanaka, S.M.C.N. Amperometric sensor for nitrite based on copper tetrasulphonated phthalocyanine immobilized with poly-l-lysine film. Talanta 2008, 75, 333–338. [Google Scholar] [CrossRef]
- Maringa, A.; Antunes, E.; Nyokong, T. Electrochemical behaviour of gold nanoparticles and Co tetraaminophthalocyanine on glassy carbon electrode. Electrochim. Acta 2014, 121, 93–101. [Google Scholar] [CrossRef]
- Wang, Y.; Qu, J.; Wu, R.; Lei, P. The electrocatalytic reduction of nitrate in water on Pd/Sn-modified activated carbon fiber electrode. Water Res. 2006, 40, 1224–1232. [Google Scholar] [CrossRef]
- Wu, Y.Y.; Li, C.; Dou, Z.Y.; Cui, L.L.; Liu, D.J.; He, X.Q. A novel nitrite sensor fabricated through anchoring nickel-tetrahydroxy-phthalocyanine and polyethylene oxide film onto glassy carbon electrode by a two-step covalent modification approach. J. Solid State Electrochem. 2014, 18, 2625–2635. [Google Scholar] [CrossRef]
- Lee, Y.-L.; Hsiao, C.-Y.; Chang, C.-H.; Yang, Y.-M. Effects of sensing temperature on the gas sensing properties of copper phthalocyanine and copper tetra-tert-butyl phthalocyanine films. Sens. Actuators B Chem. 2003, 94, 169–175. [Google Scholar] [CrossRef]
- Klyamer, D.; Bonegardt, D.; Krasnov, P.; Sukhikh, A.; Popovetskiy, P.; Khezami, K.; Durmuş, M.; Basova, T. Halogen-substituted zinc(II) phthalocyanines: Spectral properties and structure of thin films. Thin Solid Films 2022, 754, 139301. [Google Scholar] [CrossRef]
- Basova, T.V.; Ray, A.K. Review—Hybrid Materials Based on Phthalocyanines and Metal Nanoparticles for Chemiresistive and Electrochemical Sensors: A Mini-Review. ECS J. Solid State Sci. Technol. 2020, 9, 061001. [Google Scholar] [CrossRef]
- Song, X.; Gao, L.; Li, Y.; Mao, L.; Yang, J.H. A sensitive and selective electrochemical nitrite sensor based on a glassy carbon electrode modified with cobalt phthalocyanine-supported Pd nanoparticles. Anal. Methods 2017, 9, 3166–3171. [Google Scholar] [CrossRef]
- Saeed, A.A.; Singh, B.; Abbas, M.N.; Issa, Y.M.; Dempsey, E. Electrocatalytic Nitrite Determination Using Iron Phthalocyanine Modified Gold Nanoparticles. Electroanalysis 2015, 27, 1086–1096. [Google Scholar] [CrossRef]
- Shumba, M.; Nyokong, T. Characterization and Electrocatalytic Activity of Nanocomposites Consisting of Nanosized Cobalt Tetraaminophenoxy Phthalocyanine, Multi-walled Carbon Nanotubes and Gold Nanoparticles. Electroanalysis 2016, 28, 1478–1488. [Google Scholar] [CrossRef]
- Maringa, A.; Nyokong, T. The influence of gold nanoparticles on the electroactivity of nickel tetrasulfonated phthalocyanine. J. Porphyr. Phthalocyanines 2014, 18, 642–651. [Google Scholar] [CrossRef]
- Arlyapov, V.A.; Kharkova, A.S.; Kurbanaliyeva, S.K.; Kuznetsova, L.S.; Machulin, A.V.; Tarasov, S.E.; Melnikov, P.V.; Ponamoreva, O.N.; Alferov, V.A.; Reshetilov, A.N. Use of biocompatible redox-active polymers based on carbon nanotubes and modified organic matrices for development of a highly sensitive BOD biosensor. Enzym. Microb. Technol. 2021, 143, 109706. [Google Scholar] [CrossRef]
- N’Diaye, J.; Bagchi, R.; Howe, J.Y.; Lian, K. Redox Active Organic-Carbon Composites for Capacitive Electrodes: A Review. Sustain. Chem. 2021, 2, 407–440. [Google Scholar] [CrossRef]
- Fang, D.; Gao, G.; Yang, Y.; Wang, Y.; Gao, L.; Zhi, J. Redox Mediator-Based Microbial Biosensors for Acute Water Toxicity Assessment: A Critical Review. ChemElectroChem 2020, 7, 2513–2526. [Google Scholar] [CrossRef]
- Kim, K.; Park, J.; Kim, H.; Jung, G.Y.; Kim, M.-G. Solid-Phase Photocatalysts: Physical Vapor Deposition of Au Nanoislands on Porous TiO2 Films for Millimolar H2O2 Production within a Few Minutes. ACS Catal. 2019, 9, 9206–9211. [Google Scholar] [CrossRef]
- Wang, Y.; Limon-Petersen, J.G.; Compton, R.G. Measurement of the diffusion coefficients of [Ru(NH3)6]3+ and [Ru(NH3)6]2+ in aqueous solution using microelectrode double potential step chronoamperometry. J. Electroanal. Chem. 2011, 652, 13–17. [Google Scholar] [CrossRef]
- Sallan, S.; Kaban, G.; Kaya, M. The effects of nitrite, sodium ascorbate and starter culture on volatile compounds of a semi-dry fermented sausage. LWT 2022, 153, 112540. [Google Scholar] [CrossRef]
- Ramezani, H.; Abhari, K.; Pilevar, Z.; Hosseini, H.; Mohammadi, A. Volatile N-nitrosamine, residual nitrite, and ascorbic acid levels in sausages during storage. Foods Raw Mater. 2020, 8, 107–114. [Google Scholar] [CrossRef]
- Oyarzún, M.P.; Silva, N.; Cortés-Arriagada, D.; Silva, J.F.; Ponce, I.O.; Flores, M.; Tammeveski, K.; Bélanger, D.; Zitolo, A.; Jaouen, F.; et al. Enhancing the electrocatalytic activity of Fe phthalocyanines for the oxygen reduction reaction by the presence of axial ligands: Pyridine-functionalized single-walled carbon nanotubes. Electrochim. Acta 2021, 398, 139263. [Google Scholar] [CrossRef]
- Venegas, R.; Recio, F.J.; Zuñiga, C.; Viera, M.; Oyarzún, M.P.; Silva, N.; Neira, K.; Marco, J.F.; Zagal, J.H.; Tasca, F. Comparison of the catalytic activity for O2 reduction of Fe and Co MN4 adsorbed on graphite electrodes and on carbon nanotubes. Phys. Chem. Chem. Phys. 2017, 19, 20441–20450. [Google Scholar] [CrossRef] [PubMed]
- Ottaviano, L.; Lozzi, L.; Ramondo, F.; Picozzi, P.; Santucci, S. Copper hexadecafluoro phthalocyanine and naphthalocyanine: The role of shake up excitations in the interpretation and electronic distinction of high-resolution X-ray photoelectron spectroscopy measurements. J. Electron Spectrosc. Relat. Phenom. 1999, 105, 145–154. [Google Scholar] [CrossRef]
- Åhlund, J.; Nilson, K.; Schiessling, J.; Kjeldgaard, L.; Berner, S.; Mårtensson, N.; Puglia, C.; Brena, B.; Nyberg, M.; Luo, Y. The electronic structure of iron phthalocyanine probed by photoelectron and x-ray absorption spectroscopies and density functional theory calculations. J. Chem. Phys. 2006, 125, 034709. [Google Scholar] [CrossRef] [PubMed]
- Evangelista, F.; Ruocco, A.; Gotter, R.; Cossaro, A.; Floreano, L.; Morgante, A.; Crispoldi, F.; Betti, M.G.; Mariani, C. Electronic states of CuPc chains on the Au(110) surface. J. Chem. Phys. 2009, 131, 174710. [Google Scholar] [CrossRef]
- Alfredsson, Y.; Brena, B.; Nilson, K.; Åhlund, J.; Kjeldgaard, L.; Nyberg, M.; Luo, Y.; Mårtensson, N.; Sandell, A.; Puglia, C.; et al. Electronic structure of a vapor-deposited metal-free phthalocyanine thin film. J. Chem. Phys. 2005, 122, 214723. [Google Scholar] [CrossRef]
- Suresh Kumar, P.; Lakshminarayanan, V. Electron-Transfer Studies in a Lyotropic Columnar Hexagonal Liquid Crystalline Medium. Langmuir 2006, 23, 1548–1554. [Google Scholar] [CrossRef] [PubMed]
- Holm, T.; Ingdal, M.; Fanavoll, E.V.; Sunde, S.; Seland, F.; Harrington, D.A. Mass-transport impedance at channel electrodes: Accurate and approximate solutions. Electrochim. Acta 2016, 202, 84–89. [Google Scholar] [CrossRef] [Green Version]
- Ji, X.; Banks, C.E.; Crossley, A.; Compton, R.G. Oxygenated edge plane sites slow the electron transfer of the ferro-/ferricyanide redox couple at graphite electrodes. ChemPhysChem 2006, 7, 1337–1344. [Google Scholar] [CrossRef] [PubMed]
- Schrattenecker, J.D.; Heer, R.; Melnik, E.; Maier, T.; Fafilek, G.; Hainberger, R. Hexaammineruthenium (II)/(III) as alternative redox-probe to Hexacyanoferrat (II)/(III) for stable impedimetric biosensing with gold electrodes. Biosens. Bioelectron. 2019, 127, 25–30. [Google Scholar] [CrossRef] [PubMed]
- Miao, P.; Liang, Z.; Liu, L.; Chen, G. Fabrication of Multi-functionalized Gold Nanoparticles and the Application to Electrochemical Detection of Nitrite. Curr. Nanosci. 2011, 7, 354–358. [Google Scholar] [CrossRef]
- Gutierrez, A.P.; Griveau, S.; Richard, C.; Pailleret, A.; Granados, S.G.; Bediouia, F. Hybrid materials from carbon nanotubes, nickel tetrasulfonated phthalocyanine and thin polymer layers for the selective electrochemical activation of nitric oxide in solution. Electroanalysis 2009, 21, 2303–2310. [Google Scholar] [CrossRef]
- Losada, J.; García Armada, M.P.; García, E.; Casado, C.M.; Alonso, B. Electrochemical preparation of gold nanoparticles on ferrocenyl-dendrimer film modified electrodes and their application for the electrocatalytic oxidation and amperometric detection of nitrite. J. Electroanal. Chem. 2017, 788, 14–22. [Google Scholar] [CrossRef]
- Ozoemena, K.; Nyokong, T. Voltammetric characterization of the self-assembled monolayer (SAM) of octabutylthiophthalocyaninatoiron(II): A potential electrochemical sensor. Electrochim. Acta 2002, 47, 4035–4043. [Google Scholar] [CrossRef]
- Lu, S.; Yang, C.; Nie, M. Hydrothermal synthesized urchin-like nickel-cobalt carbonate hollow spheres for sensitive amperometric detection of nitrite. J. Alloys Compd. 2017, 708, 780–786. [Google Scholar] [CrossRef]
- Lu, S.; Hummel, M.; Kang, S.; Gu, Z. Selective Voltammetric Determination of Nitrite Using Cobalt Phthalocyanine Modified on Multiwalled Carbon Nanotubes. J. Electrochem. Soc. 2020, 167, 046515. [Google Scholar] [CrossRef]
- Cui, Y.; Yang, C.; Zeng, W.; Oyama, M.; Pu, W.; Zhang, J. Electrochemical Determination of Nitrite Using a Gold Nanoparticles-modified Glassy Carbon Electrode Prepared by the Seed-mediated Growth Technique. Anal. Sci. 2007, 23, 1421–1425. [Google Scholar] [CrossRef] [Green Version]
- Patra, S.; Munichandraiah, N. Electrochemical reduction of hydrogen peroxide on stainless steel. J. Chem. Sci. 2009, 121, 675–683. [Google Scholar] [CrossRef] [Green Version]
- Piela, B.; Wrona, P.K. Oxidation of Hydroxylamine on the Rotating Solid Electrodes. J. Electrochem. Soc. 2004, 151, E69–E79. [Google Scholar] [CrossRef]
- Santos, W.J.R.; Sousa, A.L.; Luz, R.C.S.; Damos, F.S.; Kubota, L.T.; Tanaka, A.A.; Tanaka, S.M.C.N. Amperometric sensor for nitrite using a glassy carbon electrode modified with alternating layers of iron(III) tetra-(N-methyl-4-pyridyl)-porphyrin and cobalt(II) tetrasulfonated phthalocyanine. Talanta 2006, 70, 588–594. [Google Scholar] [CrossRef]
- Wang, Y.; Ward, K.R.; Laborda, E.; Salter, C.; Crossley, A.; Jacobs, R.M.J.; Compton, R.G. A joint experimental and computational search for authentic nano-electrocatalytic effects: Electrooxidation of nitrite and L-ascorbate on gold nanoparticle-modified glassy carbon electrodes. Small 2013, 9, 478–486. [Google Scholar] [CrossRef] [PubMed]
- Manikandan, V.S.; Durairaj, S.; Boateng, E.; Sidhureddy, B.; Chen, A. Electrochemical Detection of Nitrite Based on Co3O4-Au Nanocomposites for Food Quality Control. J. Electrochem. Soc. 2021, 168, 107505. [Google Scholar] [CrossRef]
- Wang, P.; Mai, Z.; Dai, Z.; Li, Y.; Zou, X. Construction of Au nanoparticles on choline chloride modified glassy carbon electrode for sensitive detection of nitrite. Biosens. Bioelectron. 2009, 24, 3242–3247. [Google Scholar] [CrossRef] [PubMed]
- Zhang, F.; Yuan, Y.; Zheng, Y.; Wang, H.; Liu, T.; Hou, S. A glassy carbon electrode modified with gold nanoparticle-encapsulated graphene oxide hollow microspheres for voltammetric sensing of nitrite. Microchim. Acta 2017, 184, 1565–1572. [Google Scholar] [CrossRef]
- Han, Y.; Zhang, R.; Dong, C.; Cheng, F.; Guo, Y. Sensitive electrochemical sensor for nitrite ions based on rose-like AuNPs/MoS2/graphene composite. Biosens. Bioelectron. 2019, 142, 111529. [Google Scholar] [CrossRef]
- Liu, T.S.; Kang, T.F.; Lu, L.P.; Zhang, Y.; Cheng, S.Y. Au–Fe(III) nanoparticle modified glassy carbon electrode for electrochemical nitrite sensor. J. Electroanal. Chem. 2009, 632, 197–200. [Google Scholar] [CrossRef]
- Wang, C.; Yuan, R.; Chai, Y.; Chen, S.; Zhang, Y.; Hu, F.; Zhang, M. Non-covalent iron(III)-porphyrin functionalized multi-walled carbon nanotubes for the simultaneous determination of ascorbic acid, dopamine, uric acid and nitrite. Electrochim. Acta 2012, 62, 109–115. [Google Scholar] [CrossRef]
- Thomas, D.; Rajith, L.; Lonappan, L.; Issac, S.; Kumar, K.G. Sensitive determination of nitrite in food samples using voltammetric techniques. Food Anal. Methods 2012, 5, 752–758. [Google Scholar] [CrossRef]
- Yang, C.; Lu, Q.; Hu, S. A novel nitrite amperometric sensor and its application in food analysis. Electroanalysis 2006, 18, 2188–2193. [Google Scholar] [CrossRef]
- Merino, L.; Örnemark, U.; Toldrá, F. Analysis of Nitrite and Nitrate in Foods: Overview of Chemical, Regulatory and Analytical Aspects. Adv. Food Nutr. Res. 2017, 81, 65–107. [Google Scholar] [CrossRef] [PubMed]


| Electrode 1 | ΔEp (mV) | Ipa (μA) | A (cm2) |
|---|---|---|---|
| GCE | 84 | 681 | 0.413 |
| FePc(tBu)4/GCE | 80 | 744 | 0.451 |
| Au/FePc(tBu)4/GCE | 76 | 863 | 0.523 |
| Electrode 1 | I(μA)-υ1/2(V/s)1/2 | E(V)-logυ | (1-α)nα |
|---|---|---|---|
| FePc(tBu)4/GCE | I = 6.781 + 167.4υ1/2 (R2 = 0.995) | E= 1.343 + 0.058 logυ (R2 = 0.997) | 0.50 |
| Au/FePc(tBu)4/GCE | I = 7.833 + 163.9υ1/2 (R2 = 0.997) | E= 1.554 + 0.054 logυ (R2 = 0.994) | 0.55 |
| Au/FePc(tBu)4/GCE | I = 8.033 + 190.9υ1/2 (R2 = 0.998) | E = 0.954 + 0.089 logυ (R2 = 0.997) | 0.31 |
| Food Sample | Added (μM) | Found (μM) | Recovery (%) | Nitrite in Sample mg/kg |
|---|---|---|---|---|
| Sample 1 | 3.00 | 2.91 ± 0.18 | 97 | 15.56 ± 0.63 |
| 5.00 | 5.12 ± 0.27 | 102 | ||
| 9.00 | 9.29 ± 0.34 | 103 | ||
| Sample 2 | 3.00 | 3.15 ± 0.21 | 105 | 11.38 ± 0.48 |
| 5.00 | 4.90 ± 0.29 | 98 | ||
| 9.00 | 9.24 ± 0.37 | 103 |
Publisher’s Note: MDPI stays neutral with regard to jurisdictional claims in published maps and institutional affiliations. |
© 2022 by the authors. Licensee MDPI, Basel, Switzerland. This article is an open access article distributed under the terms and conditions of the Creative Commons Attribution (CC BY) license (https://creativecommons.org/licenses/by/4.0/).
Share and Cite
Dorovskikh, S.I.; Klyamer, D.D.; Fedorenko, A.D.; Morozova, N.B.; Basova, T.V. Electrochemical Sensor Based on Iron(II) Phthalocyanine and Gold Nanoparticles for Nitrite Detection in Meat Products. Sensors 2022, 22, 5780. https://doi.org/10.3390/s22155780
Dorovskikh SI, Klyamer DD, Fedorenko AD, Morozova NB, Basova TV. Electrochemical Sensor Based on Iron(II) Phthalocyanine and Gold Nanoparticles for Nitrite Detection in Meat Products. Sensors. 2022; 22(15):5780. https://doi.org/10.3390/s22155780
Chicago/Turabian StyleDorovskikh, Svetlana I., Darya D. Klyamer, Anastasiya D. Fedorenko, Natalia B. Morozova, and Tamara V. Basova. 2022. "Electrochemical Sensor Based on Iron(II) Phthalocyanine and Gold Nanoparticles for Nitrite Detection in Meat Products" Sensors 22, no. 15: 5780. https://doi.org/10.3390/s22155780