
Upper Limb Rehabilitation Tools in Virtual Reality Based on Haptic and 3D Spatial Recognition Analysis: A Pilot Study


Abstract
:1. Introduction
2. Materials and Methods
2.1. System Design
2.1.1. Haptics
2.1.2. Pre-Processing
2.2. Evaluation
2.2.1. Subjects
2.2.2. Euclidean Distance
2.2.3. Manhattan Distance
2.2.4. Dynamic Time Warping
2.2.5. Cosine Similarity
2.2.6. Correlation Coefficient
3. Results
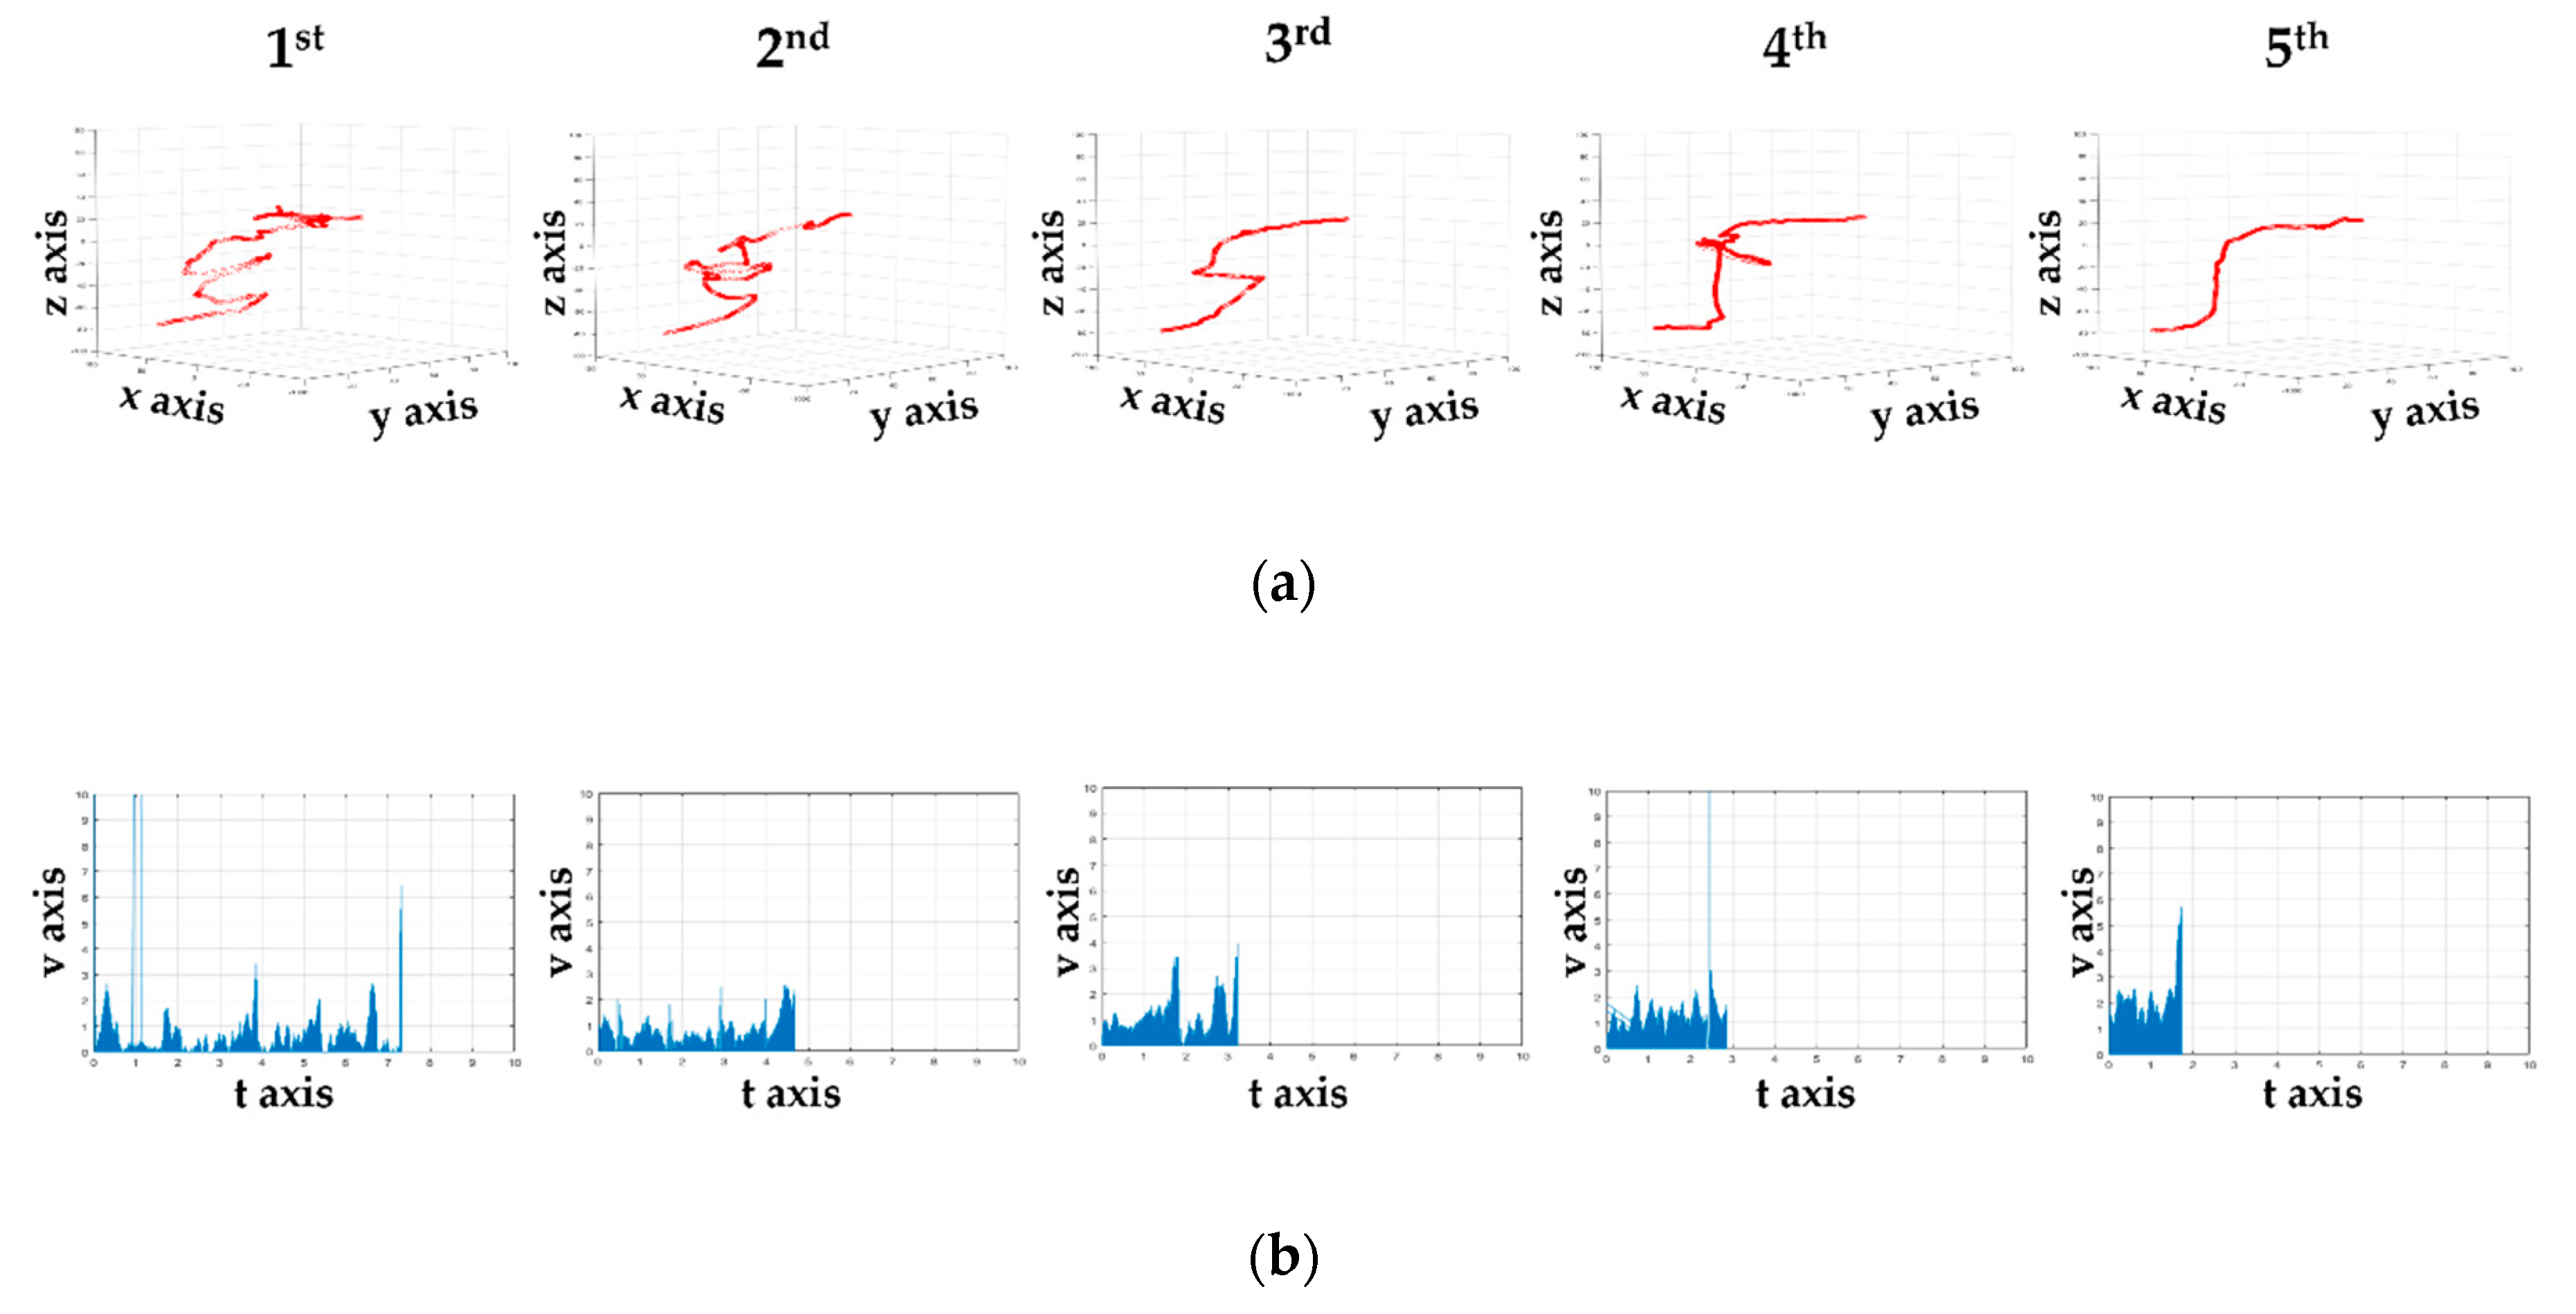
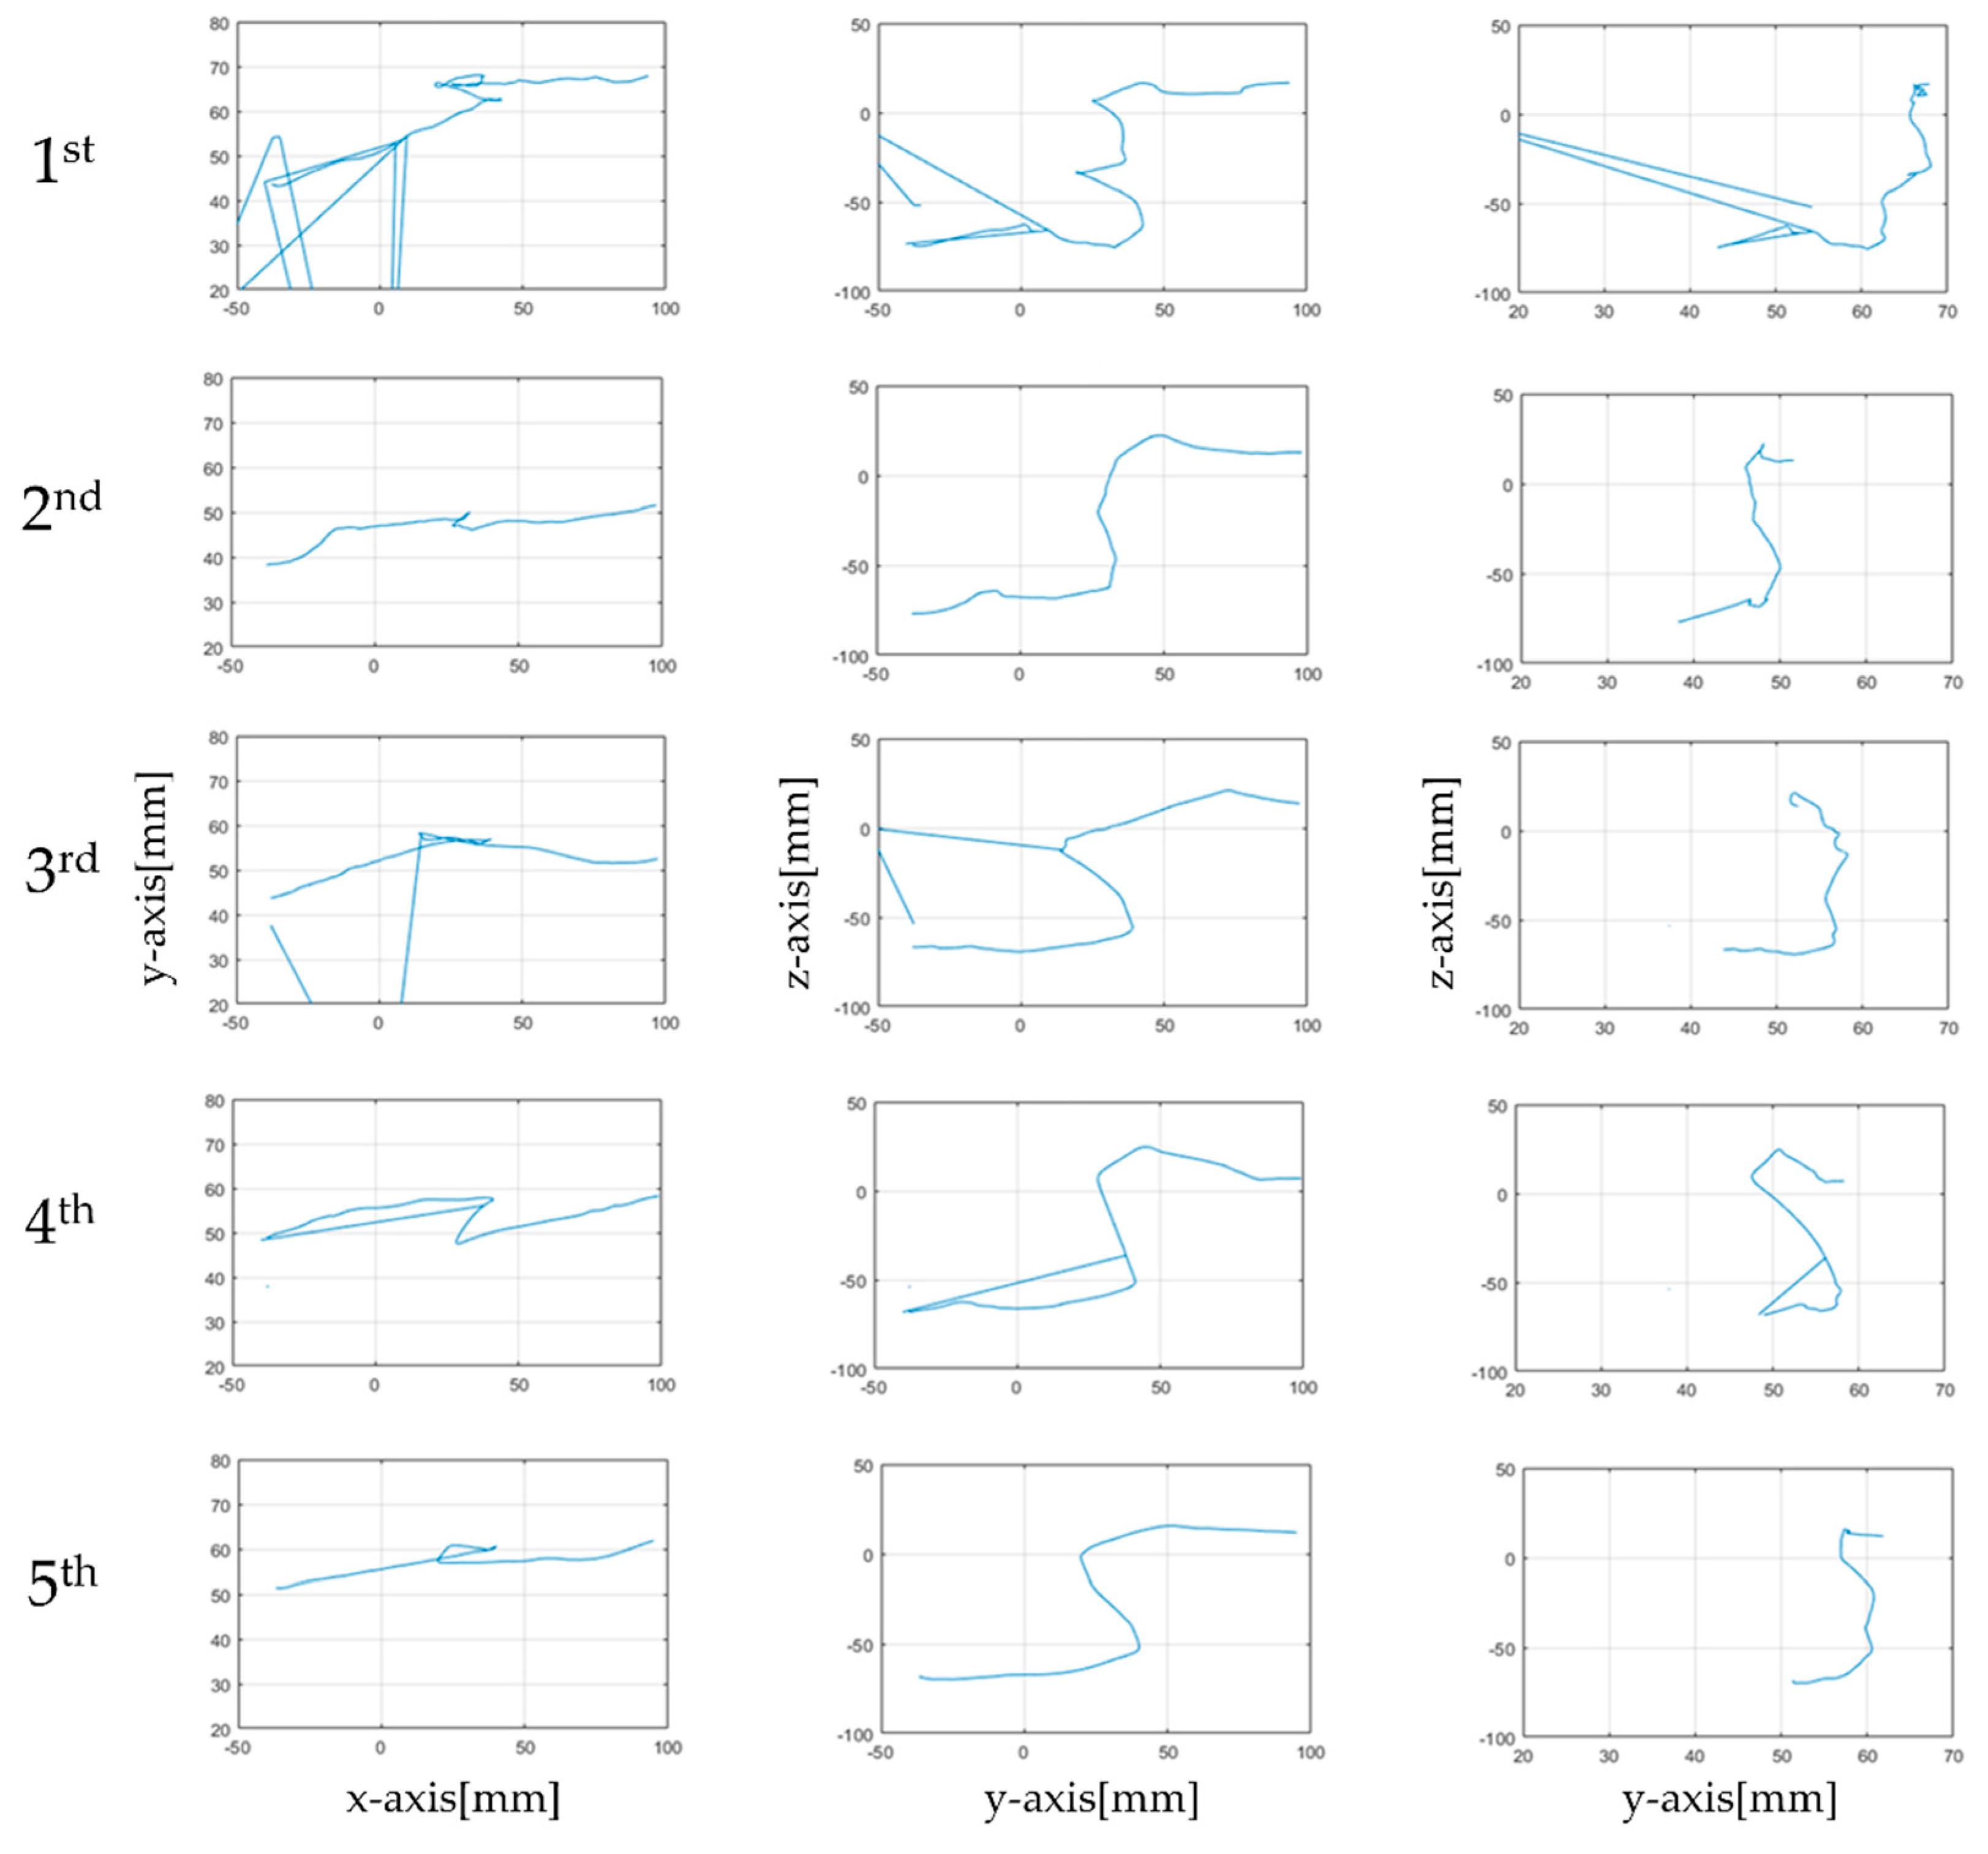
3.1. Visuality
3.1.1. Time Taken and the Number of Collisions
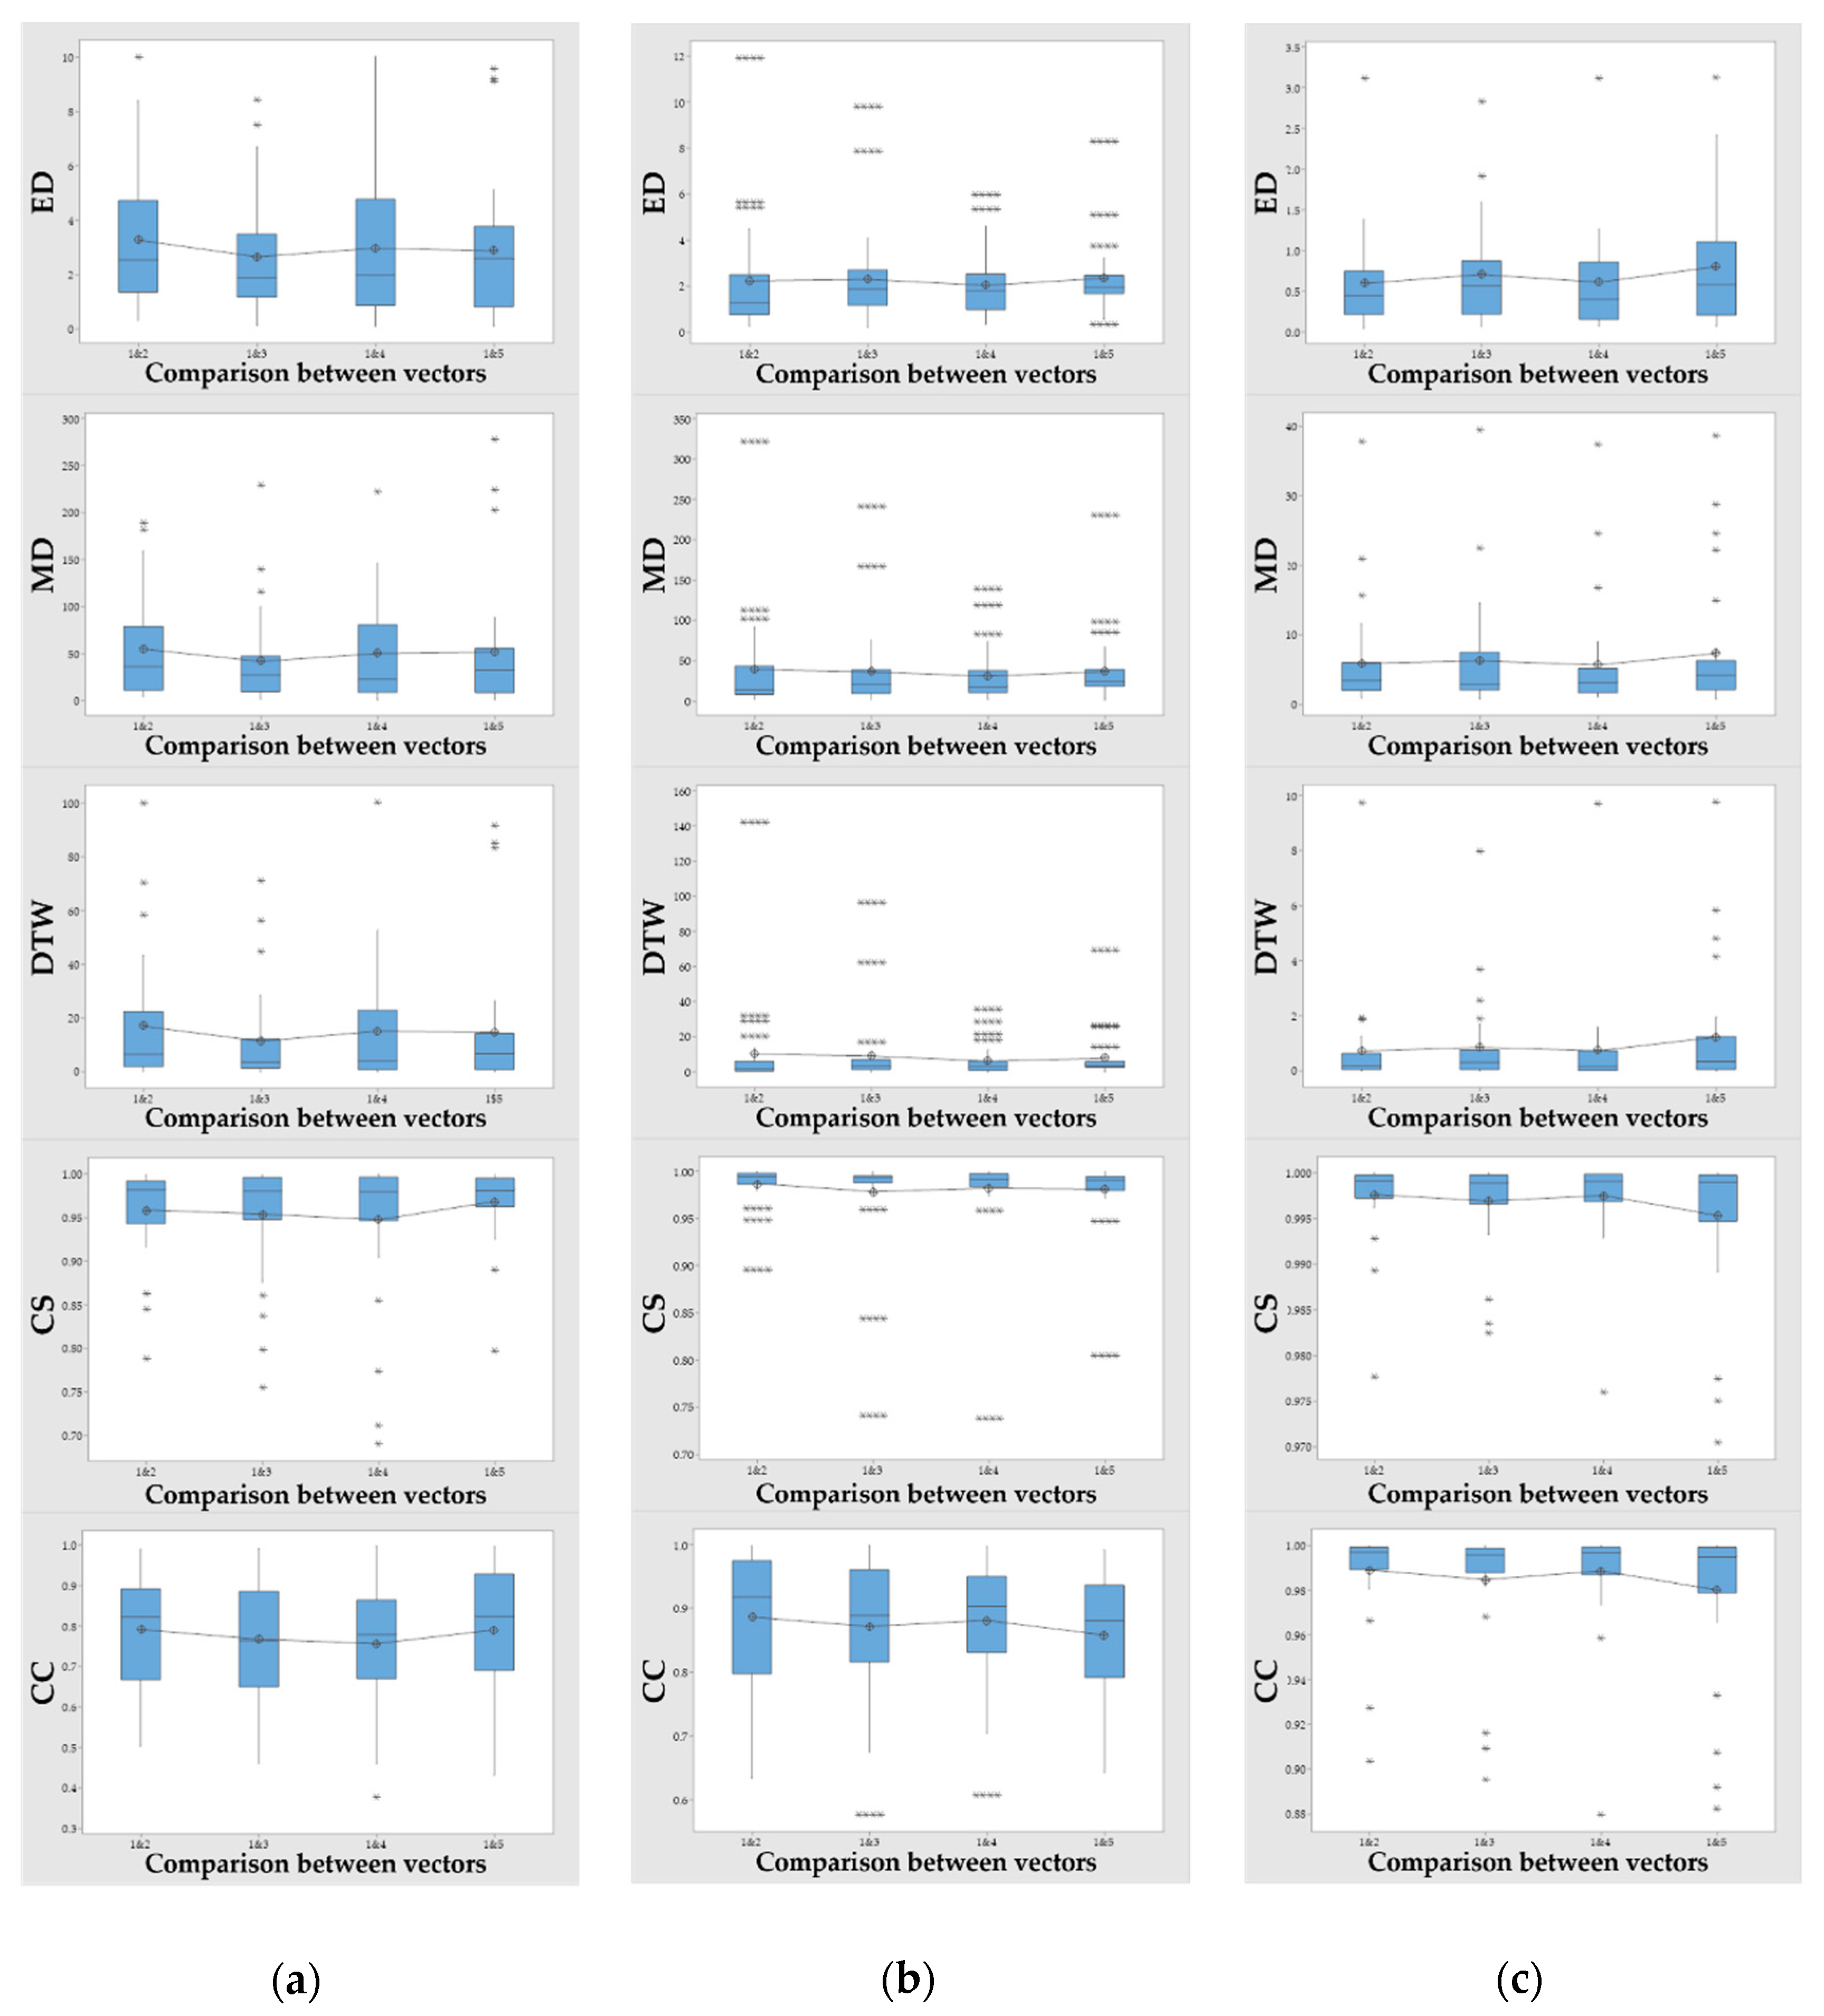
3.1.2. Similarity
3.2. Statistics
3.2.1. Time Taken and the Number of Collisions
3.2.2. Similarity
4. Discussion
5. Conclusions
Author Contributions
Funding
Institutional Review Board Statement
Informed Consent Statement
Data Availability Statement
Conflicts of Interest
References
- Garry, M.; Van Steenis, R.; Summers, J. Interlimb coordination following stroke. Hum. Mov. Sci. 2005, 24, 849–864. [Google Scholar] [CrossRef] [PubMed]
- Oyewole, O.O.; Ogunlana, M.O.; Oritogun, K.S.; Gbiri, C.A. Post-stroke disability and its predictors among nigerian stroke survivors. Disabil. Health J. 2016, 9, 616–623. [Google Scholar] [CrossRef]
- Widmer, M.; Held, J.P.; Wittmann, F.; Lambercy, O.; Lutz, K.; Luft, A.R. Does motivation matter in upper-limb rehabilitation after stroke? Armeosenso-reward: Study protocol for a randomized controlled trial. Trials 2017, 18, 580. [Google Scholar] [CrossRef] [PubMed] [Green Version]
- Seo, H.G.; Beom, J.; Oh, B.-M.; Han, T.R. Effects of robot-assisted upper limb training on hemiplegic patients. Brain Neurorehabilit. 2014, 7, 39–47. [Google Scholar] [CrossRef]
- Tsai, K.-H.; Yeh, C.-Y.; Lo, H.-C. A novel design and clinical evaluation of a wheelchair for stroke patients. Int. J. Ind. Ergon. 2008, 38, 264–271. [Google Scholar] [CrossRef]
- Chuluunbaatar, E.; Chou, Y.-J.; Pu, C. Quality of life of stroke survivors and their informal caregivers: A prospective study. Disabil. Health J. 2016, 9, 306–312. [Google Scholar] [CrossRef]
- Jeon, Y.-K.; Ha, C.-H.; Kim, J.-W. The effect of regular rehabilitation exercise program on duration of the range of motion, balance and gait ability in hemiplegia. Korean Soc. Sports Sci. 2013, 22, 955–966. [Google Scholar]
- Jo, E.-J.; Noh, D.-H.; Kam, K.-Y. Effects of contextual interference on feeding training in patients with stroke. Hum. Mov. Sci. 2020, 69, 102560. [Google Scholar] [CrossRef]
- Abubakar, S.; Isezuo, S. Health related quality of life of stroke survivors: Experience of a stroke unit. Int. J. Biomed. Sci. IJBS 2012, 8, 183. [Google Scholar] [PubMed]
- Lai, S.-M.; Studenski, S.; Duncan, P.W.; Perera, S. Persisting consequences of stroke measured by the stroke impact scale. Stroke 2002, 33, 1840–1844. [Google Scholar] [CrossRef] [Green Version]
- Ocampo, R.; Tavakoli, M. Improving user performance in haptics-based rehabilitation exercises by colocation of user’s visual and motor axes via a three-dimensional augmented-reality display. IEEE Robot. Autom. Lett. 2019, 4, 438–444. [Google Scholar] [CrossRef]
- Buyn, P.-S.; Chon, M.-Y. The effects of rehabilitation training using video game on improvement range of motion for upper-extremity, shoulder pain and stress in stroke patients with hemiplegia. J. Muscle Jt. Health 2012, 19, 46–56. [Google Scholar] [CrossRef] [Green Version]
- Yeh, S.-C.; Lee, S.-H.; Chan, R.-C.; Wu, Y.; Zheng, L.-R.; Flynn, S. The efficacy of a haptic-enhanced virtual reality system for precision grasp acquisition in stroke rehabilitation. J. Healthc. Eng. 2017, 2017. [Google Scholar] [CrossRef] [PubMed] [Green Version]
- Ellis, C. Stroke in young adults. Disabil. Health J. 2010, 3, 222–224. [Google Scholar] [CrossRef] [PubMed]
- Gilliaux, M.; Renders, A.; Dispa, D.; Holvoet, D.; Sapin, J.; Dehez, B.; Detrembleur, C.; Lejeune, T.M.; Stoquart, G. Upper limb robot-assisted therapy in cerebral palsy: A single-blind randomized controlled trial. Neurorehabilit. Neural Repair 2015, 29, 183–192. [Google Scholar] [CrossRef]
- Bhalerao, G.; Shah, H.; Bedekar, N.; Dabadghav, R. Perspective of neuro therapeutic approaches preferred for stroke rehabilitation by physiotherapists. Indian J. Physiother. Occup. Ther. 2016, 10, 47–50. [Google Scholar] [CrossRef]
- Dickstein, R.; Hocherman, S.; Pillar, T.; Shaham, R. Stroke rehabilitation: Three exercise therapy approaches. Phys. Ther. 1986, 66, 1233–1238. [Google Scholar] [CrossRef] [PubMed]
- Nair, K.; Taly, A. Stroke rehabilitation: Traditional and modern approaches. Neurol India 2002, 50, 85–93. [Google Scholar]
- De Luca, R.; Calabrò, R.S.; Gervasi, G.; De Salvo, S.; Bonanno, L.; Corallo, F.; De Cola, M.C.; Bramanti, P. Is computer-assisted training effective in improving rehabilitative outcomes after brain injury? A case-control hospital-based study. Disabil. Health J. 2014, 7, 356–360. [Google Scholar] [CrossRef]
- Brown, E.V.D.; Dudgeon, B.J.; Gutman, K.; Moritz, C.T.; McCoy, S.W. Understanding upper extremity home programs and the use of gaming technology for persons after stroke. Disabil. Health J. 2015, 8, 507–513. [Google Scholar] [CrossRef] [Green Version]
- Leconte, P.; Stoquart, G.; Lejeune, T.; Ronsse, R. Rhythmic robotic training enhances motor skills of both rhythmic and discrete upper-limb movements after stroke: A longitudinal pilot study. Int. J. Rehabil. Res. 2019, 42, 46–55. [Google Scholar] [CrossRef] [PubMed]
- Kim, M.W. New therapeutic approaches in upper extremity rehabilitation. Brain Neurorehabilit. 2008, 1, 20–25. [Google Scholar] [CrossRef]
- Levin, M.F.; Weiss, P.L.; Keshner, E.A. Emergence of virtual reality as a tool for upper limb rehabilitation: Incorporation of motor control and motor learning principles. Phys. Ther. 2015, 95, 415–425. [Google Scholar] [CrossRef] [PubMed] [Green Version]
- Munih, M.; Bardorfer, A.; Ceru, B.; Bajd, T.; Zupan, A. Force exertion capacity measurements in haptic virtual environments. Int. J. Rehabil. Res. 2010, 33, 34–42. [Google Scholar] [CrossRef]
- Scalona, E.; Hayes, D.; Del Prete, Z.; Palermo, E.; Rossi, S. Perturbed point-to-point reaching tasks in a 3d environment using a portable haptic device. Electronics 2019, 8, 32. [Google Scholar] [CrossRef] [Green Version]
- Zhang, K.; Chen, X.; Liu, F.; Tang, H.; Wang, J.; Wen, W. System framework of robotics in upper limb rehabilitation on poststroke motor recovery. Behav. Neurol. 2018, 2018, 6737056. [Google Scholar] [CrossRef] [PubMed] [Green Version]
- Driels, M.; Spain, H. Perception of two-dimensional shapes using haptic feedback. Int. J. Ind. Ergon. 1991, 7, 93–101. [Google Scholar] [CrossRef]
- Osafo-Yeboah, B.; Jiang, S.; Delpish, R.; Jiang, Z.; Ntuen, C. Empirical study to investigate the range of force feedback necessary for best operator performance in a haptic controlled excavator interface. Int. J. Ind. Ergon. 2013, 43, 197–202. [Google Scholar] [CrossRef]
- Lee, H.K.; Kim, Y.T.; Takahashi, Y.; Miyoshi, T.; Suzuki, K.; Komeda, T. Basic experiment on rehabilitation of upper-limb motor function using haptic-device system. Trans. Korean Soc. Mech. Eng. A 2011, 35, 459–467. [Google Scholar] [CrossRef]
- Bardorfer, A.; Munih, M.; Zupan, A.; Primozic, A. Upper limb motion analysis using haptic interface. Ieee/Asme Trans. Mechatron. 2001, 6, 253–260. [Google Scholar] [CrossRef] [Green Version]
- Scalona, E.; Martelli, F.; Del Prete, Z.; Palermo, E.; Rossi, S. A novel protocol for the evaluation of motor learning in 3d reching tasks using novint falcon. In Proceedings of the 2018 7th IEEE International Conference on Biomedical Robotics and Biomechatronics (Biorob), Enschede, Netherlands, 26–29 August 2018; IEEE: Piscataway, NJ, USA, 2018; pp. 268–272. [Google Scholar]
- Metcalfe, A.B.; Lawes, N. A modern interpretation of the rood approach. Phys. Ther. Rev. 1998, 3, 195–212. [Google Scholar] [CrossRef]
- Calabrò, R.S.; De Cola, M.C.; Leo, A.; Reitano, S.; Balletta, T.; Trombetta, G.; Naro, A.; Russo, M.; Bertè, F.; De Luca, R. Robotic neurorehabilitation in patients with chronic stroke: Psychological well-being beyond motor improvement. Int. J. Rehabil. Res. 2015, 38, 219–225. [Google Scholar] [CrossRef] [PubMed] [Green Version]
- Kümmel, J.; Kramer, A.; Gruber, M. Robotic guidance induces long-lasting changes in the movement pattern of a novel sport-specific motor task. Hum. Mov. Sci. 2014, 38, 23–33. [Google Scholar] [CrossRef] [PubMed] [Green Version]
- Lee, S.A.; Cha, H.G. The effect of motor imagery and mirror therapy on upper extremity function according to the level of cognition in stroke patients. Int. J. Rehabil. Res. 2019, 42, 330–336. [Google Scholar] [CrossRef]
- Bae, S.-S.; Gak, H.; Chung, H.; Choi, J.-W. The effects of motor control with active movement and passive movement. J. Korean Soc. Phtsical Ther. 1999, 11, 13–21. [Google Scholar]
- Viglialoro, R.M.; Turini, G.; Condino, S.; Ferrari, V.; Gesi, M. Proof of concept: Vr rehabilitation game for people with shoulder disorders. In Proceedings of the International Conference on Augmented Reality, Virtual Reality and Computer Graphics, Santa Maria al Bagno, Italy, 24–27 June 2019; Springer: Cham, Switzerland, 2019; pp. 344–350. [Google Scholar]
- Condino, S.; Turini, G.; Viglialoro, R.; Gesi, M.; Ferrari, V.J.E. Wearable augmented reality application for shoulder rehabilitation. Electronics 2019, 8, 1178. [Google Scholar] [CrossRef] [Green Version]
- Jo, D.; Hwang, S.; Baek, M. Literature analysis on telemedicine in korea: An exploratory study. Health Serv. Manag. Rev. 2019, 13, 35–51. [Google Scholar]
- Choi, Y.-S. A study on the introduction of telemedicine-coronavitus disease 2019 and the need for the introduction of telemedicine. Int. Law Rev. 2020, 12, 113–137. [Google Scholar]
- Maciejasz, P.; Eschweiler, J.; Gerlach-Hahn, K.; Jansen-Troy, A.; Leonhardt, S. A survey on robotic devices for upper limb rehabilitation. J. Neuroeng. Rehabil. 2014, 11, 3. [Google Scholar] [CrossRef] [Green Version]
- Lee, O.; Lee, K.; Oh, C.; Kim, K.; Kim, M. Prototype tactile feedback system for examination by skin touch. Ski. Res. Technol. 2014, 20, 307–314. [Google Scholar] [CrossRef]
- Maurel, W.; Thalmann, D. Human shoulder modeling including scapulo-thoracic constraint and joint sinus cones. Comput. Graph. 2000, 24, 203–218. [Google Scholar] [CrossRef] [Green Version]
- Nef, T.; Guidali, M.; Riener, R. Armin iii–arm therapy exoskeleton with an ergonomic shoulder actuation. Appl. Bionics Biomech. 2009, 6, 127–142. [Google Scholar] [CrossRef] [Green Version]
- Kim, E.B.; Kim, E.Y.; Lee, O. Meta-analyzing the writing process of structural language to develop new writing analysis elements. Appl. Sci. 2020, 10, 3479. [Google Scholar] [CrossRef]
- Molenaar, P.C.; Wang, Z.; Newell, K.M. Compressing movement information via principal components analysis (pca): Contrasting outcomes from the time and frequency domains. Hum. Mov. Sci. 2013, 32, 1495–1511. [Google Scholar] [CrossRef] [PubMed]
- Shlens, J. A tutorial on principal component analysis. arXiv 2014, arXiv:1404.1100. [Google Scholar]
- Kim, A.; Wang, C.; Seo, S.-H. Pca-cia ensemble-based feature extraction for bio-key generation. KSII Trans. Internet Inf. Syst. 2020, 14, 2919–2937. [Google Scholar]
- Hsieh, C.-H.; Li, Y.-S.; Hwang, B.-J.; Hsiao, C.-H.J.S. Detection of atrial fibrillation using 1d convolutional neural network. Sensors 2020, 20, 2136. [Google Scholar] [CrossRef] [Green Version]
- Arevalillo-Herráez, M.; Cobos, M.; Roger, S.; García-Pineda, M.J.S. Combining inter-subject modeling with a subject-based data transformation to improve affect recognition from eeg signals. Sensors 2019, 19, 2999. [Google Scholar] [CrossRef] [Green Version]
- Lee, T.; Cha, D.; Hong, J.; Han, K.; Hwang, C. Feature extraction using discrete wavelet transform and dynamic time-warped algorithms in wireless sensor networks for barbed wire entanglements surveillance. J. Korea Acad.-Ind. Coop. Soc. 2010, 11, 1342–1347. [Google Scholar]
- Song, Y.; Ren, M.J.S. A novel just-in-time learning strategy for soft sensing with improved similarity measure based on mutual information and pls. Sensors 2020, 20, 3804. [Google Scholar] [CrossRef]
- Nellore, K.; Hancke, G.P.J.S. Traffic management for emergency vehicle priority based on visual sensing. Sensors 2016, 16, 1892. [Google Scholar] [CrossRef] [Green Version]
- KU, K.; Nandhini, M. Gated recurrent unit architecture for context-aware recommendations with improved similarity measures. KSII Trans. Internet Inf. Syst. 2020, 14, 538–561. [Google Scholar]
- Sharma, A.; Sundaram, S.J.P.R.L. An enhanced contextual dtw based system for online signature verification using vector quantization. Pattern Recognit. Lett. 2016, 84, 22–28. [Google Scholar] [CrossRef]
- Parziale, A.; Diaz, M.; Ferrer, M.A.; Marcelli, A.J.P.R.L. Sm-dtw: Stability modulated dynamic time warping for signature verification. Pattern Recognit. Lett. 2019, 121, 113–122. [Google Scholar] [CrossRef]
- Kim, B.; Min, C.; Kim, H.; Cho, S.; Oh, J.; Ha, S.-H.; Yi, J.-h.J.S. Structural health monitoring with sensor data and cosine similarity for multi-damages. Sensors 2019, 19, 3047. [Google Scholar] [CrossRef] [PubMed] [Green Version]
- Chatterjee, A.; Gerdes, M.W.; Martinez, S.G.J.S. Statistical explorations and univariate timeseries analysis on covid-19 datasets to understand the trend of disease spreading and death. Sensors 2020, 20, 3089. [Google Scholar] [CrossRef]
- Li, C.; Hancock, C.M.; Hamm, N.A.; Veettil, S.V.; You, C.J.S. Analysis of the relationship between scintillation parameters, multipath and roti. Sensors 2020, 20, 2877. [Google Scholar] [CrossRef]
- Rea, L.M.; Parker, R.A. Designing and Conducting Survey Research: A Comprehensive Guide; John Wiley & Sons: Hoboken, NJ, USA, 2014. [Google Scholar]
- Stockmeyer, S.A. An interpretation of the approach of rood to the treatment of neuromuscular dysfunction. Am. J. Phys. Med. Rehabil. 1967, 46, 900–956. [Google Scholar]
- Hodge, M.M.J.P.o.N.; Speech, N.; Disorders, L. Nonspeech oral motor treatment approaches for dysarthria: Perspectives on a controversial clinical practice. Perspect. Neurophysiol. Neurogenic Speech Lang. Disord. 2002, 12, 22–28. [Google Scholar] [CrossRef]
- Gentile, P.; Guman, E.; Early, M. Neurotherapeutic approaches to treatment. In Physical Dysfunction Practice Skills for the Occupational Therapy Assistant; Mosby: Maryland Heights, MO, USA, 2013; pp. 408–432. [Google Scholar]
- Torrisi, M.; Maresca, G.; De Cola, M.C.; Cannavò, A.; Sciarrone, F.; Silvestri, G.; Bramanti, A.; De Luca, R.; Calabrò, R.S.J.I.J.o.R.R. Using telerehabilitation to improve cognitive function in post-stroke survivors: Is this the time for the continuity of care? Int. J. Rehabil. Res. 2019, 42, 344–351. [Google Scholar] [CrossRef] [PubMed]


| Warped Vectors | Similarity | x | y | z |
|---|---|---|---|---|
| 1 and 2 | ED | 3.27 ± 2.54 | 2.24 ± 2.34 | 0.59 ± 0.59 |
| MD | 54.81 ± 53.76 | 39.20 ± 62.20 | 5.92 ± 7.48 | |
| DTW | 17.02 ± 23.88 | 10.31 ± 26.35 | 0.72 ± 1.78 | |
| CS | 0.95 ± 0.04 | 0.98 ± 0.02 | 0.99 ± 0.00 | |
| CC | 0.79 ± 0.13 | 0.88 ± 0.10 | 0.98 ± 0.02 | |
| 1 and 3 | ED | 2.66 ± 2.10 | 2.30 ± 2.07 | 0.70 ± 0.61 |
| MD | 41.70 ± 49.14 | 36.13 ± 50.00 | 6.29 ± 7.86 | |
| DTW | 11.37 ± 17.41 | 9.25 ± 19.96 | 0.86 ± 1.58 | |
| CS | 0.94 ± 0.06 | 0.97 ± 0.50 | 0.99 ± 0.00 | |
| CC | 0.75 ± 0.13 | 0.87 ± 0.10 | 0.98 ± 0.02 | |
| 1 and 4 | ED | 2.98 ± 2.54 | 2.04 ± 1.48 | 0.61 ± 0.61 |
| MD | 50.00 ± 55.20 | 30.84 ± 33.54 | 5.71 ± 7.75 | |
| DTW | 15.13 ± 22.46 | 6.31 ± 8.79 | 0.73 ± 1.77 | |
| CS | 0.94 ± 0.08 | 0.98 ± 0.04 | 0.99 ± 0.00 | |
| CC | 0.75 ± 0.15 | 0.88 ± 0.09 | 0.98 ± 0.02 | |
| 1 and 5 | ED | 2.88 ± 2.58 | 2.35 ± 1.55 | 0.08 ± 0.77 |
| MD | 51.60 ± 67.50 | 36.50 ± 42.66 | 7.35 ± 9.21 | |
| DTW | 14.74 ± 25.34 | 7.90 ± 13.14 | 1.23 ± 2.19 | |
| CS | 0.96 ± 0.04 | 0.98 ± 0.03 | 0.99 ± 0.00 | |
| CC | 0.79 ± 0.15 | 0.85 ± 0.09 | 0.98 ± 0.03 |
| df | F | |
|---|---|---|
| Between Groups | 4 | 6.47 * |
| Within Groups | 145 | |
| 149 |
| Rounds (I) | Rounds (J) | Mean Difference (I − J) |
|---|---|---|
| 1 | 2 | 0.56 |
| 3 | 1.60 | |
| 4 | 2.73 * | |
| 5 | 3.00 * | |
| 2 | 1 | 0.56 |
| 3 | 1.03 | |
| 4 | 2.16 * | |
| 5 | 2.43 * | |
| 3 | 1 | 1.60 |
| 2 | 1.03 | |
| 4 | 1.13 | |
| 5 | 1.14 | |
| 4 | 1 | −2.73 * |
| 2 | −2.16 * | |
| 3 | 1.13 | |
| 5 | 0.26 | |
| 5 | 1 | −3.00 * |
| 2 | −2.43 * | |
| 3 | 1.40 | |
| 4 | 0.26 |
| df | F | |
|---|---|---|
| Between Groups | 4 | 1.17 |
| Within Groups | 145 | |
| 149 |
| Time Spent | Number of Collisions | ||
|---|---|---|---|
| Time spent | Correlation coefficient | 1 | 0.90 * |
| Number of collisions | Correlation coefficient | 0.90 * | 1 |
Publisher’s Note: MDPI stays neutral with regard to jurisdictional claims in published maps and institutional affiliations. |
© 2021 by the authors. Licensee MDPI, Basel, Switzerland. This article is an open access article distributed under the terms and conditions of the Creative Commons Attribution (CC BY) license (https://creativecommons.org/licenses/by/4.0/).
Share and Cite
Kim, E.B.; Kim, S.; Lee, O. Upper Limb Rehabilitation Tools in Virtual Reality Based on Haptic and 3D Spatial Recognition Analysis: A Pilot Study. Sensors 2021, 21, 2790. https://doi.org/10.3390/s21082790
Kim EB, Kim S, Lee O. Upper Limb Rehabilitation Tools in Virtual Reality Based on Haptic and 3D Spatial Recognition Analysis: A Pilot Study. Sensors. 2021; 21(8):2790. https://doi.org/10.3390/s21082790
Chicago/Turabian StyleKim, Eun Bin, Songee Kim, and Onseok Lee. 2021. "Upper Limb Rehabilitation Tools in Virtual Reality Based on Haptic and 3D Spatial Recognition Analysis: A Pilot Study" Sensors 21, no. 8: 2790. https://doi.org/10.3390/s21082790