Article

Investigation and Optimization of a Line-Locked Quartz Enhanced Spectrophone for Rapid Carbon Dioxide Measurement

1
State Key Laboratory of Applied Optics, Changchun Institute of Optics, Fine Mechanics and Physics, Chinese Academy of Sciences, Changchun 130033, China
2
University of Chinese Academy of Sciences, Beijing 100049, China
3
National Key Laboratory of Science and Technology on Tunable Laser, Harbin Institute of Technology, Harbin 150001, China
*
Author to whom correspondence should be addressed.
Sensors 2021, 21(15), 5225; https://doi.org/10.3390/s21155225
Submission received: 8 July 2021 / Revised: 28 July 2021 / Accepted: 29 July 2021 / Published: 2 August 2021
(This article belongs to the Special Issue State-of-the-Art Optical Sensors Technology in China)

Abstract

:
We have developed a rapid quartz enhanced spectrophone for carbon dioxide (CO2) measurement, in which the laser wavelength was tightly locked to a CO2 absorption line and a custom quartz tuning fork (QTF) operating at 12.5 kHz was employed. The intrinsic QTF oscillation-limited response time, as well as the optimal feedback interval, was experimentally investigated. By tightly locking the laser to the R(16) transition of CO2, we obtained a stable laser operation with its center wavelength variation kept within 0.0002 cm−1, merely three times the laser linewidth. The reported CO2 sensor achieved a detection limit of 7 ppm, corresponding to a normalized noise equivalent absorption coefficient (NNEA) of 4.7 × 10⁻⁹ W·cm−1·Hz−1/2, at a response time of 0.5 s. The detection limit can be further improved to 0.45 ppm at an integration time of 270 s, illustrating a good system stability. This spectrophone enables the realization of compact and fast-response gas sensors for many scenarios, where CO2 concentration from sub-ppm to hundreds of thousands of ppm is expected.

1. Introduction

Carbon dioxide (CO2) is an important component of the atmosphere that protects life on Earth via photosynthesis and heat preservation. However, its adverse impact, mainly the greenhouse effect, is emerging with massive emissions from increasingly extensive and intensive human activities in industrial, agricultural, and ecological fields [1]. In addition to our living environment, biological CO2 functions as a valuable biomarker for human disease predictions such as Helicobacter pylori infection, lung lesions, and liver malfunctions [2]. Moreover, CO2 abundance and its variation tendency are critical in many other applications, including combustion analysis, industrial process control, and deep-sea exploration [3,4,5]. Therefore, CO2 sensors with fast response, high sensitivity, and wide dynamic range are desirable across a broad range of fields.
Currently, commercially available instruments for CO2 detection include gas chromatography systems, electrochemical sensors, non-dispersing infrared analyzers, and infrared spectrometers. Suffering from bulky size, short service life and even poor selectivity, most of them are not well suited to scenarios where real-time and in situ CO2 measurement is highly needed. In contrast, the development of photoacoustic spectroscopy (PAS) is filling this gap [6,7,8]. PAS relies on the detection of acoustic waves induced by the process of optical heat deposition and thermal expansion. In particular, quartz-enhanced photoacoustic spectroscopy (QEPAS), exploiting a tiny quartz tuning fork (QTF) as an acoustic transducer, is one of the most attractive techniques, with high selectivity, high sensitivity, good immunity to environmental acoustic noise, and ultra-low gas consumption [9,10]. Since its invention by Kosterev et al. in 2002 [11], QEPAS has been demonstrated for detection of numerous organic and inorganic trace gases, including precise CO2 measurements by spectroscopy analysis at trace level, molecular relaxation investigations and interference studies on other gaseous species [12,13,14].
The commonly used standard QTFs were optimized for timing purposes, operating at ~32.7 kHz, instead of spectroscopic applications. On the other side, the energy transfer of CO2 cannot follow the fast molecular vibration excitation due to its relatively long relaxation time constant [13]. Thus, an inadequately generated acoustic wave results in a weaker signal. To date, most QEPAS CO2 sensors have a concentration detection limit of tens to hundreds of ppm, especially when the in situ excitation power is limited to merely mW level [15,16,17,18]. Following the radiation-to-sound conversion efficiency ε of photoacoustic process, i.e., ε = [1 + (2πf0τ)2]–1/2, where τ is the relaxation time [19], the CO2 QEPAS signal can benefit from a QTF with lower resonant frequency f0. Since the breakthrough of custom-made QTFs in 2013, QEPAS sensors have been capable of operating at a frequency much more suitable to low-relaxation-rate gas species [20,21].
Generally, QEPAS spectrophones are based on 2f wavelength modulation spectroscopy. A sub-Hertz wavelength scanning, along with a modulation at half of the QTF resonance frequency, is used to plot the 2f spectrum, whose maximum value always appears at the absorption line center, leading to a simple model to diagnose the analyte. However, the response time of scanning-assisted QEPAS can be extended up to tens of seconds due to its high-quality factor Q (10,000 to 13,000) [22]. That is still too slow to perform rapid gas measurements, especially when the information needs to be captured in real time. This issue could be mitigated if the absorption feature can be targeted without scanning. To prevent the laser frequency drift from the fluctuation of laser operation temperature and current, several rugged methods have been commonly applied to gas sensing, such as real-time wavelength stabilization using odd harmonics as the error signal [23,24] and quasi wavelength locking with a regular calibration by referring to the second harmonic maximum [25].
In this work, a LabVIEW-based servo loop was developed to perform the line-locked process, in which the laser wavelength was tightly locked to the target transition line of CO2. A sensitive and rapid CO2 sensor, combining the line-locked process and a custom QTF with a low resonant frequency of 12.5 kHz, was demonstrated. Averaging filtering was then fully exploited on data processing for lower system noise without sacrificing the response time. Response time limitation and the optimal feedback interval were investigated by experimental measurements. Ultimately, the sensor was validated to measure the ambient background and exhaled CO2 concentration, in a field application.

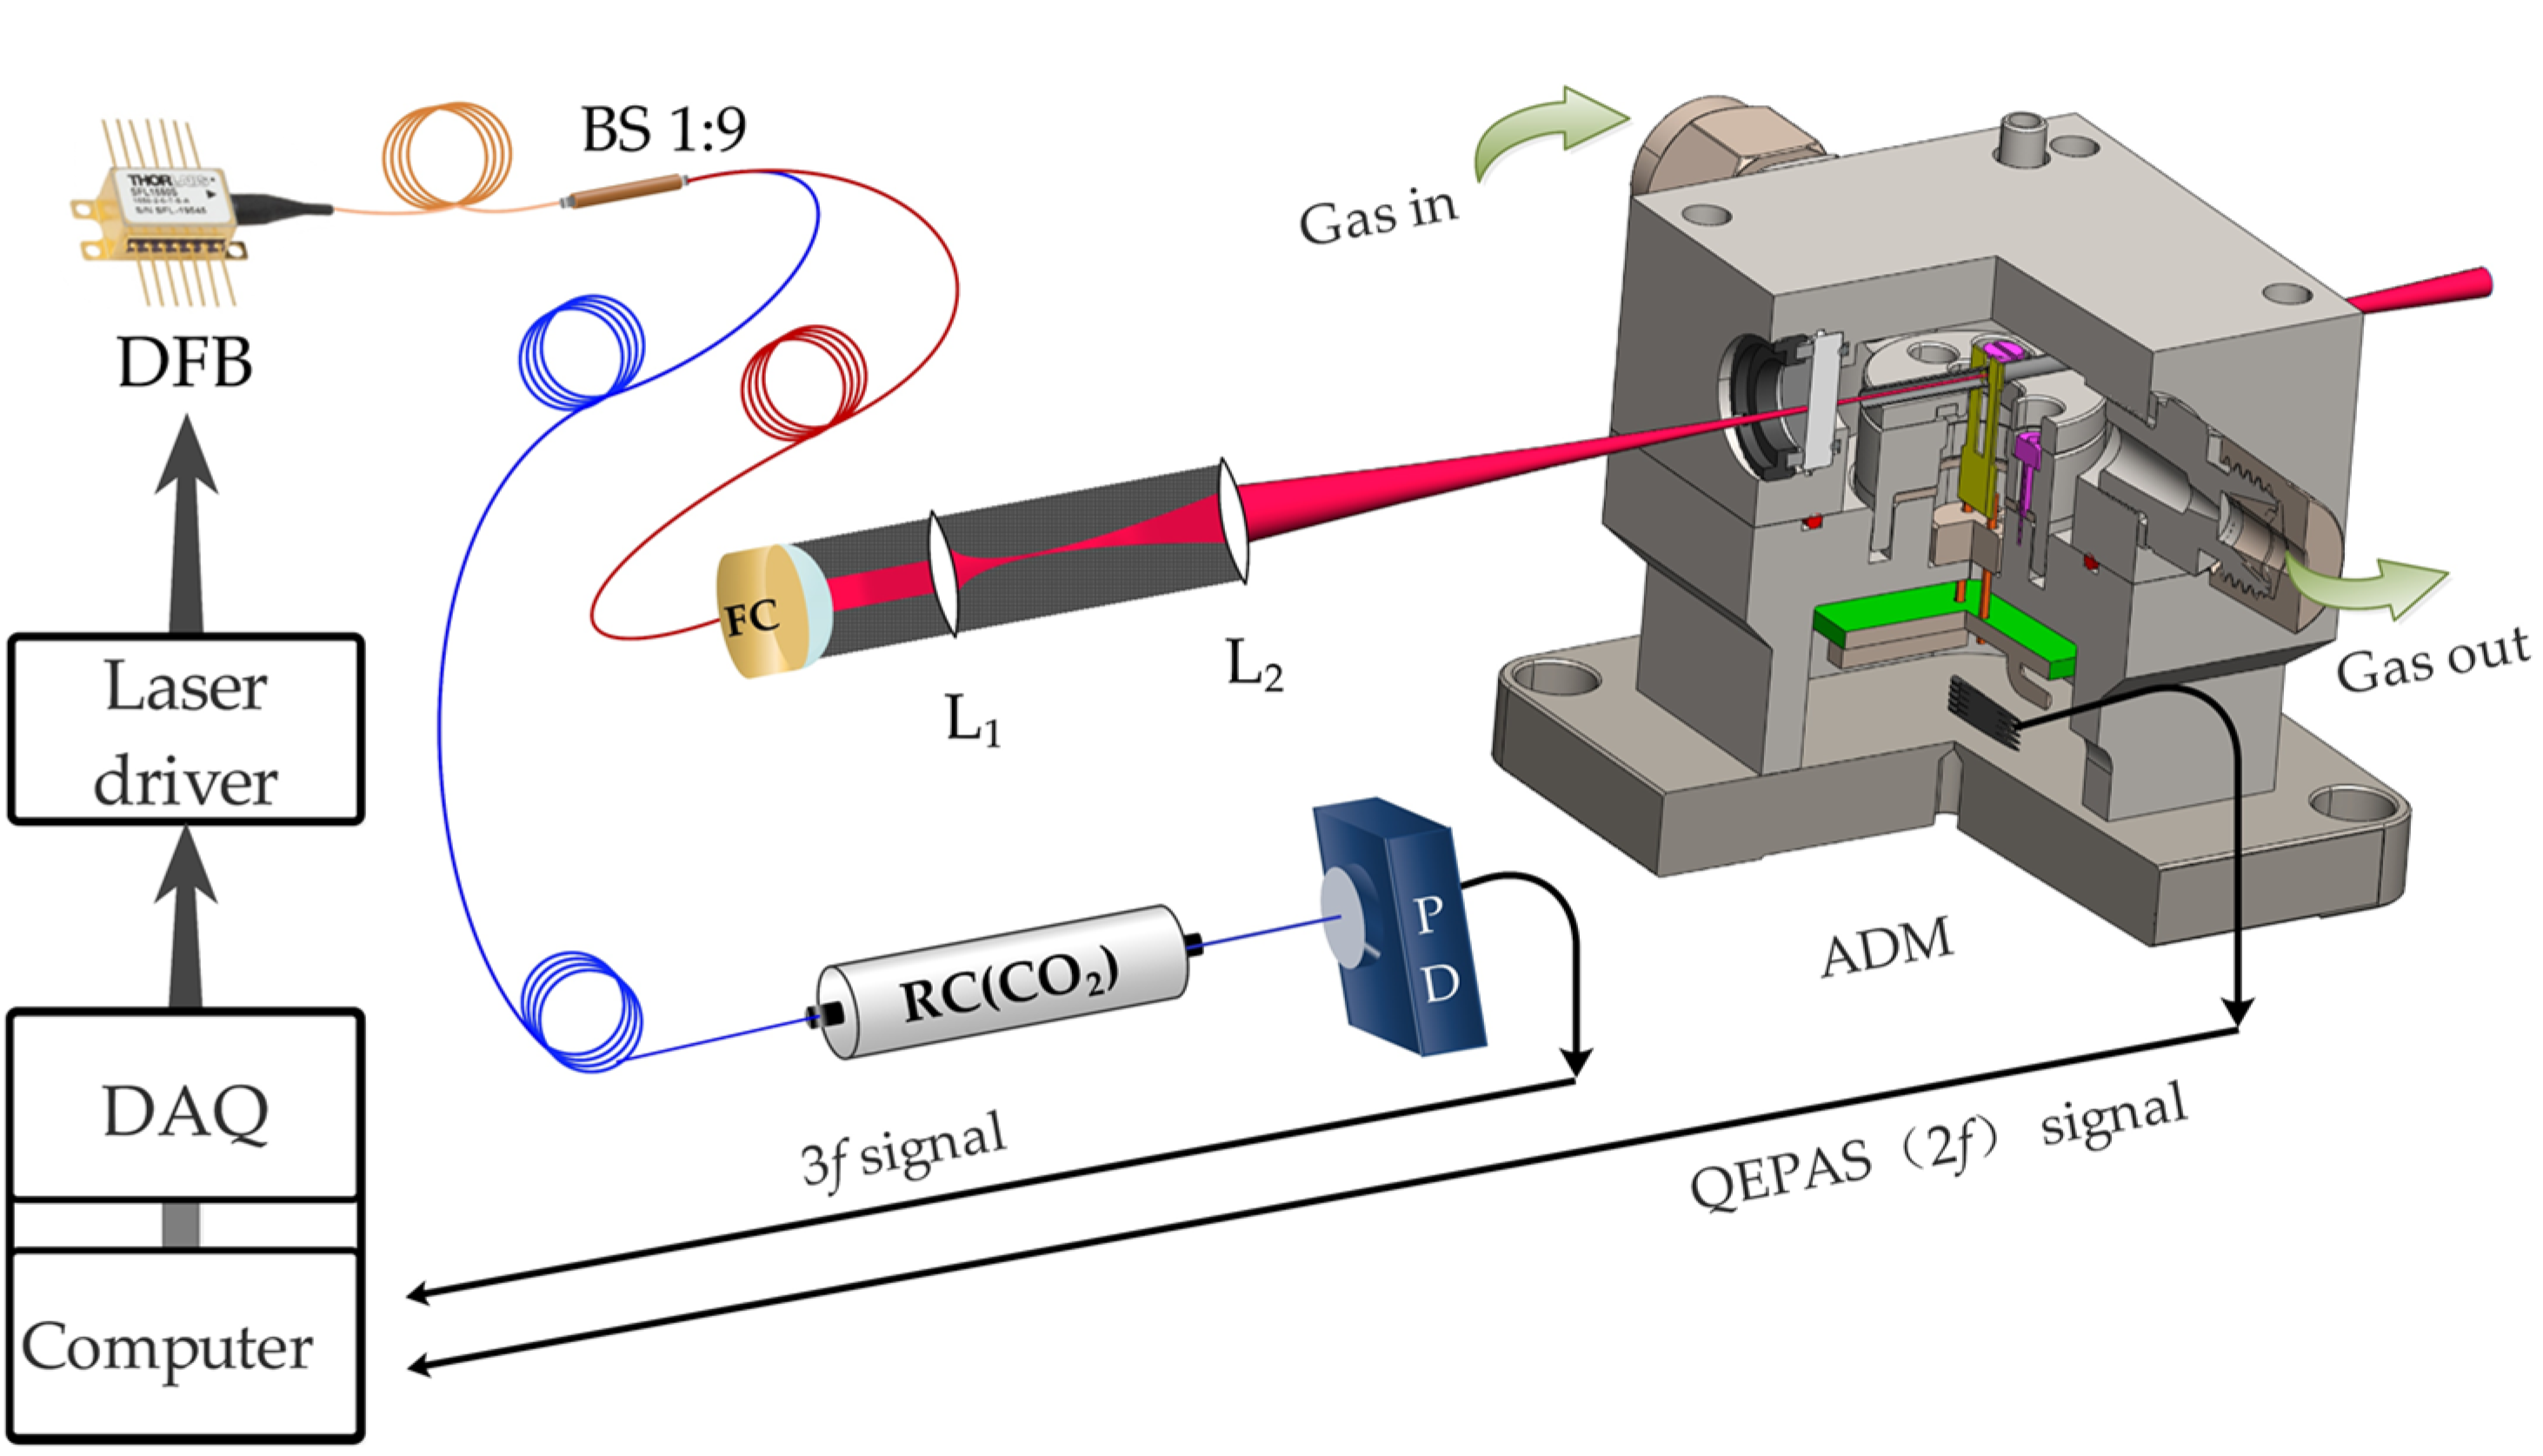
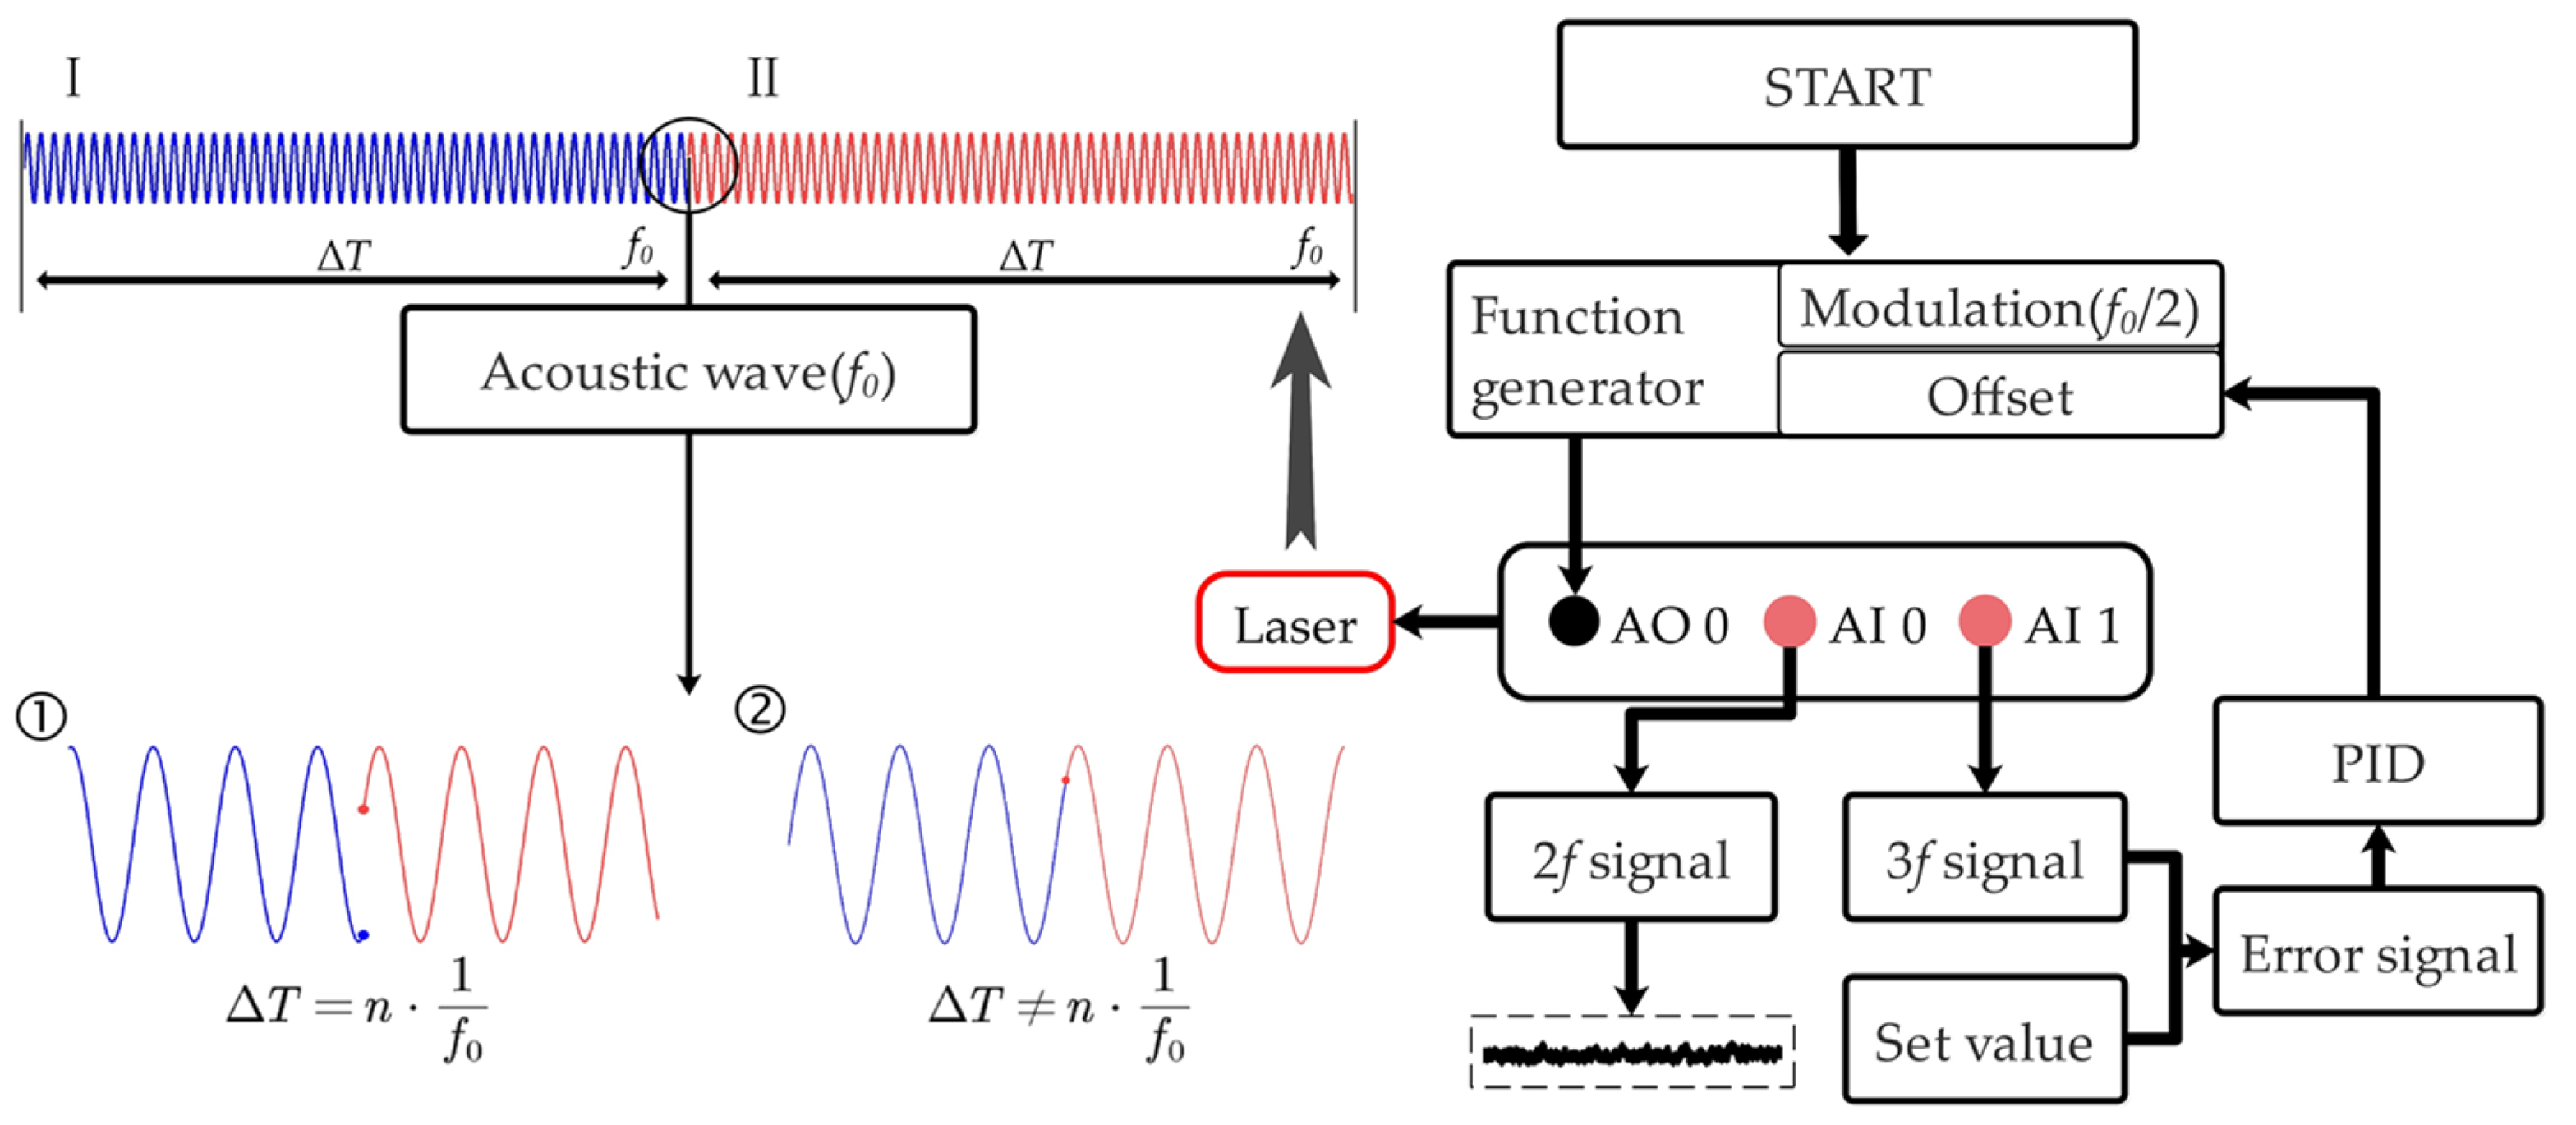
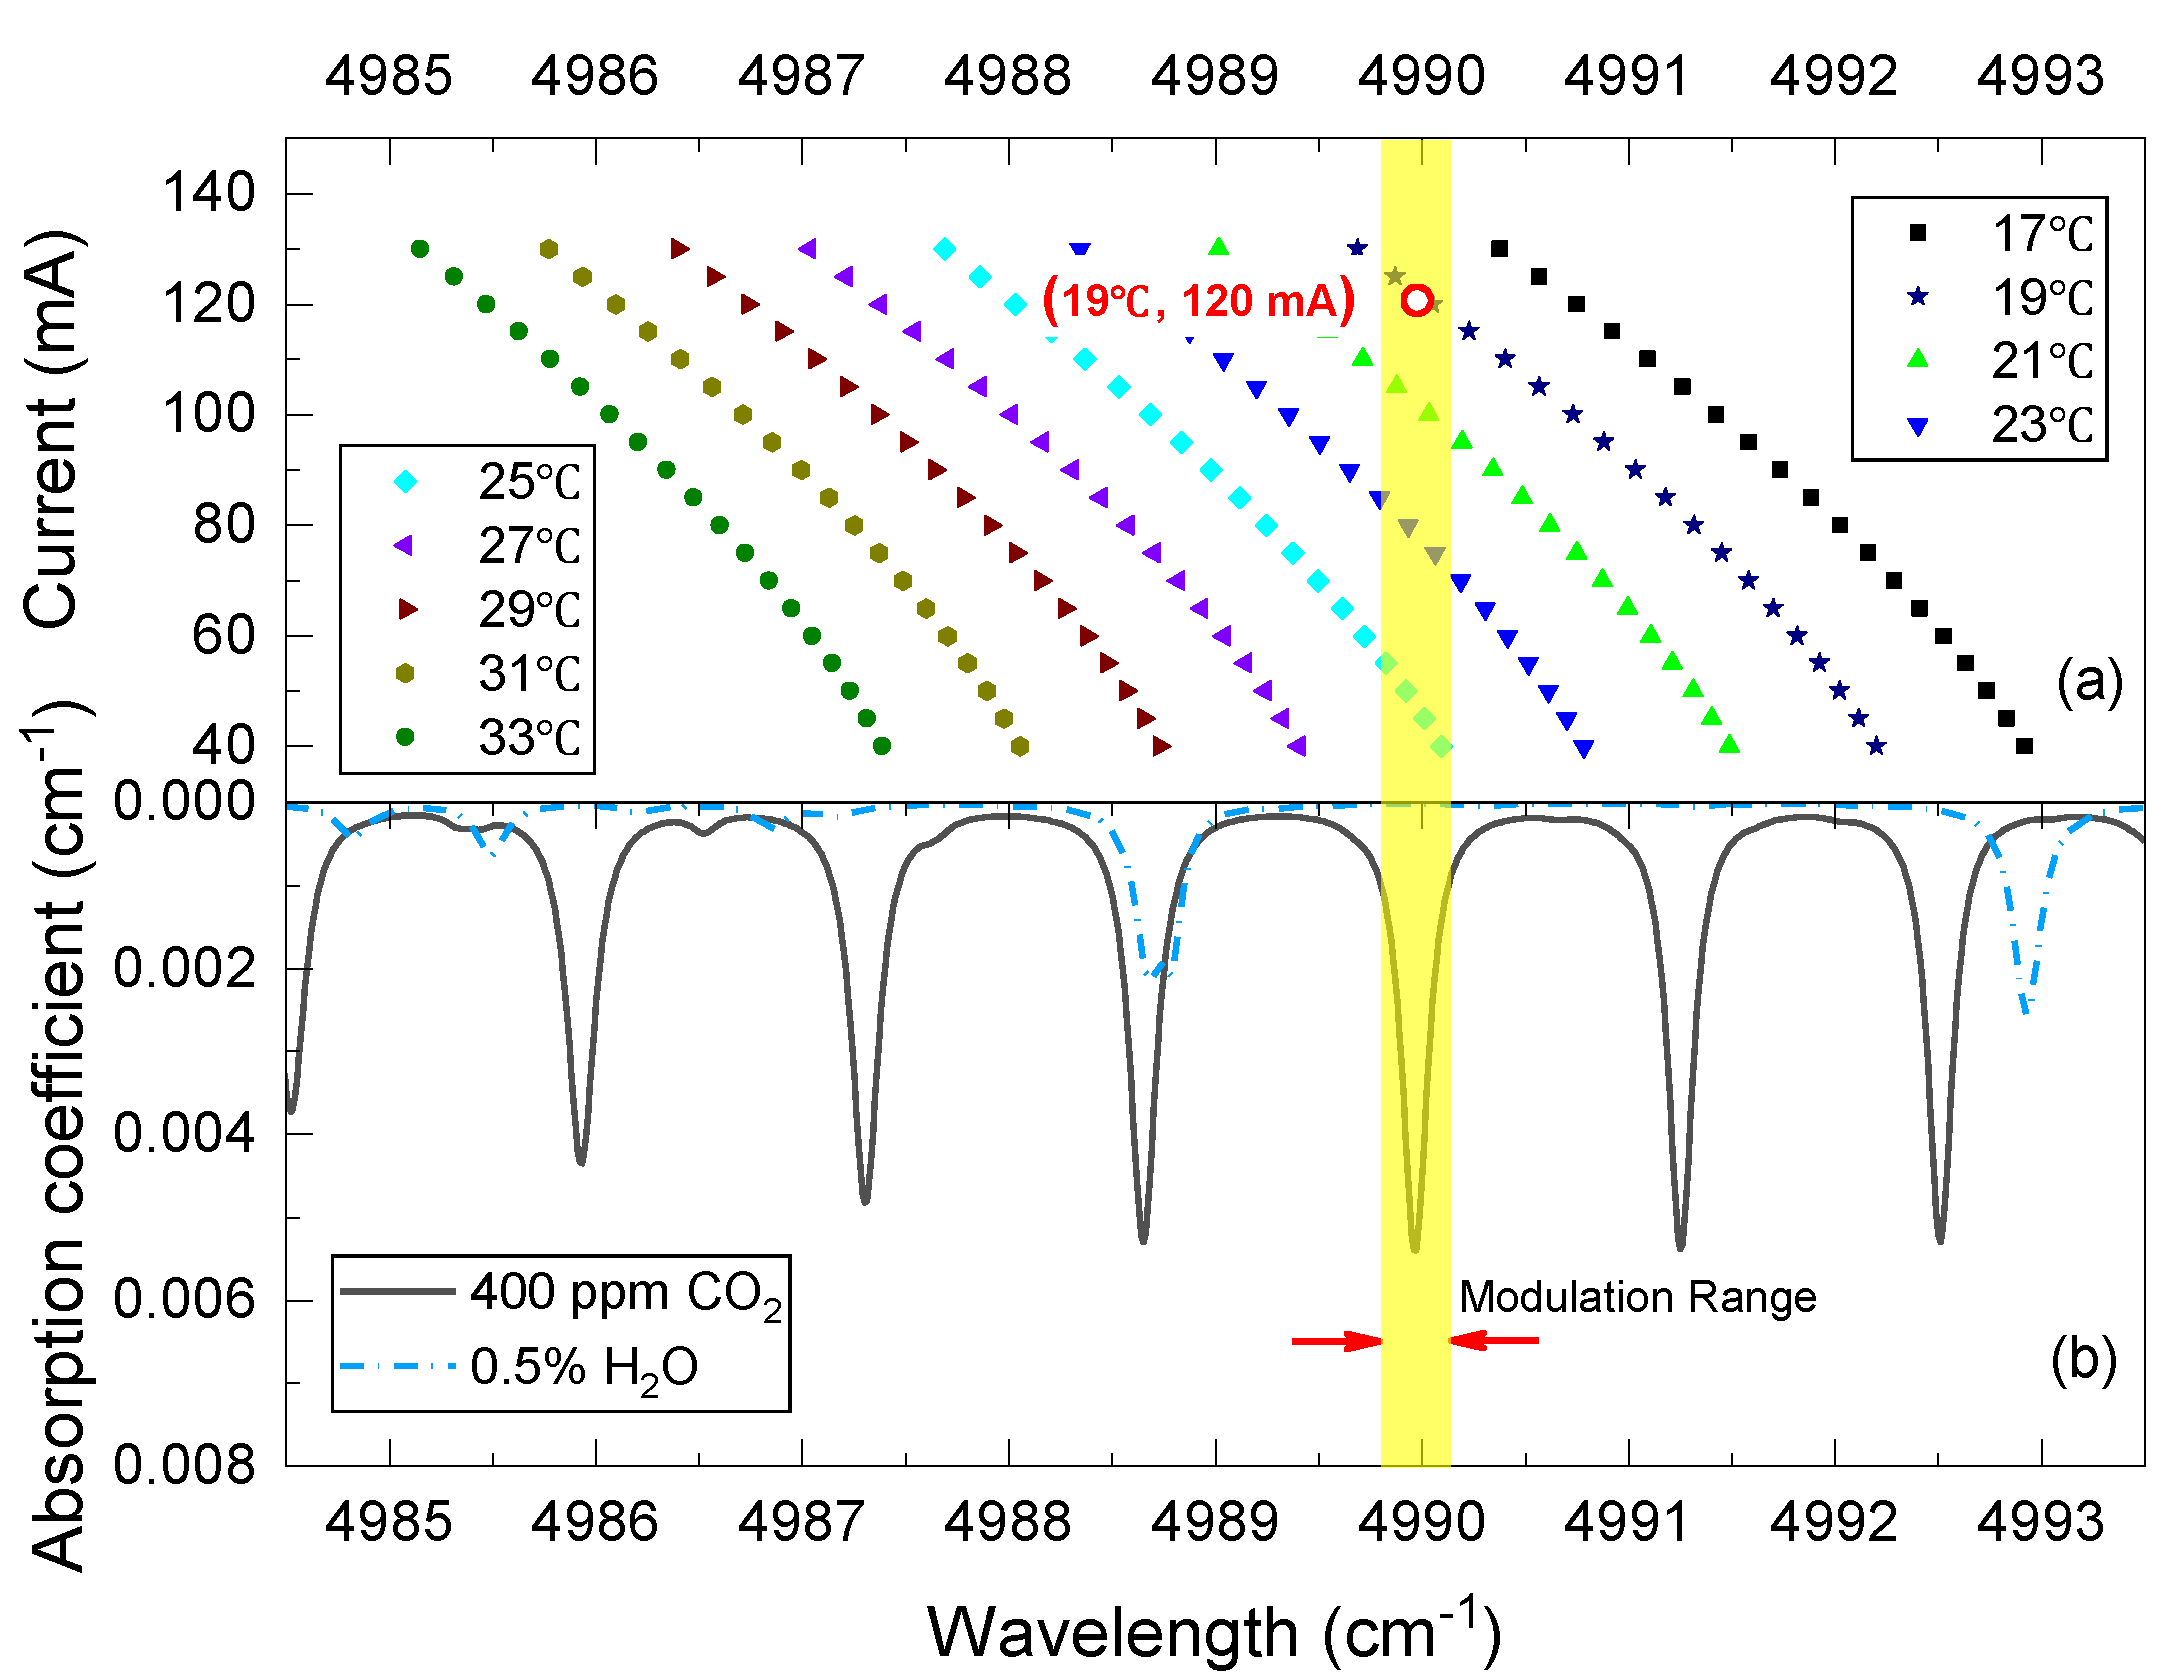
2. Sensor Configuration and Line-Locked Process

A line-locked quartz enhanced spectrophone system was built with the configuration shown in Figure 1. The sensing system consists of a wavelength locking part and a gas sensing part. A 2.004 μm DFB laser diode (KELD1G5BAAA, NTT Electronics, Yokohama-shi, Japan) is driven by a LabVIEW-based electrical control unit and a low noise laser driver (LDC501, Stanford Research Systems, Sunnyvale, CA, USA). After careful laser characterization, the driving temperature and bias current are selected as 19 °C and 120 mA, respectively. Laser radiation thus can be obtained to exploit the R(16) line of CO2 with less spectral overlap interference and high laser power (see Appendix A Figure A1). An acoustic detection module (ADM01, Thorlabs, Newton, NJ, USA) is used the perform CO2 measurement, this ADM consists of a custom QTF as the acoustic transducer, two acoustic resonators for acoustic amplification, and two wedged BaF2 windows for optical access. A small fraction of the DFB laser radiation, separated by a 1:9 fiber splitter, interrogates a pigtailed CO2 chamber (length 6 cm; pressure 50 Torr) for wavelength locking. The rest of the laser radiation (calibrated as 5 mW) propagates through the on-beam acoustic resonators (inner diameter: 1.6 mm; length: 12.4 mm) and the custom QTF (prong space: 800 μm) successively. Two mode-matching lenses, L1 and L2, allow adequate focalization of the excitation beam down to ~200 μm between QTF prongs without hitting them. With the laser modulated at half of the QTF resonance frequency f0, a photoacoustic wave is excited at the presence of the analyte. A trans-impedance preamplifier with a feedback resistance of 10 MΩ is used for signal amplification prior to demodulation by a lock-in amplifier (MFLI, Zurich Instruments, Zurich, Switzerland).
To perform tight wavelength locking to the absorption line, we developed a LabVIEW-based software platform with the flow chart shown in Figure 2. Usually, for wavelength modulation spectroscopy, the odd harmonics have centrosymmetric profiles about the absorption line center [23,24,25]. Hence, the third harmonic (3f signal) is used to generate an error signal for the following line-locked process. Firstly, a preset bias current, as well as the modulation signal at f0/2, is applied via a digital-analog converter (i.e., AO0) of the DAQ card (USB-6356, National Instruments, Austin, TX, USA), generating a radiant wavelength near the absorption line. Secondly, the CO2 absorption information inside the reference chamber is captured via the analog-digital converter (i.e., AI1) and then is demodulated as the 3f signal using a digital lock-in amplifier. Thirdly, a PID subprogram is employed to make the 3f signal closer to the set value (zero in this paper) by iterating the bias current. Thus, the CO2 measurement is conducted with the photoacoustic signal captured (via AI0) and averaged during the feedback interval.
Note that, the feedback interval (ΔT) cannot be discretionarily selected as it would have a significant influence on the tuning fork response. As shown in Figure 2, if the ending of modulation period I is not connected with the beginning of the successive modulation period II, the phase mismatch will break the energy accumulation process of QTF, leading to a weakened photoacoustic signal. Our hypothesis is confirmed by a detailed feedback interval investigation, which can be found in Experimental Results and Discussion section below. Thus, in the implementation of line-locked QEPAS, phase matching between successive modulation periods should be considered in selecting the feedback interval, which should be an integer multiple (n) of the QTF oscillation period as:
T = n / f 0

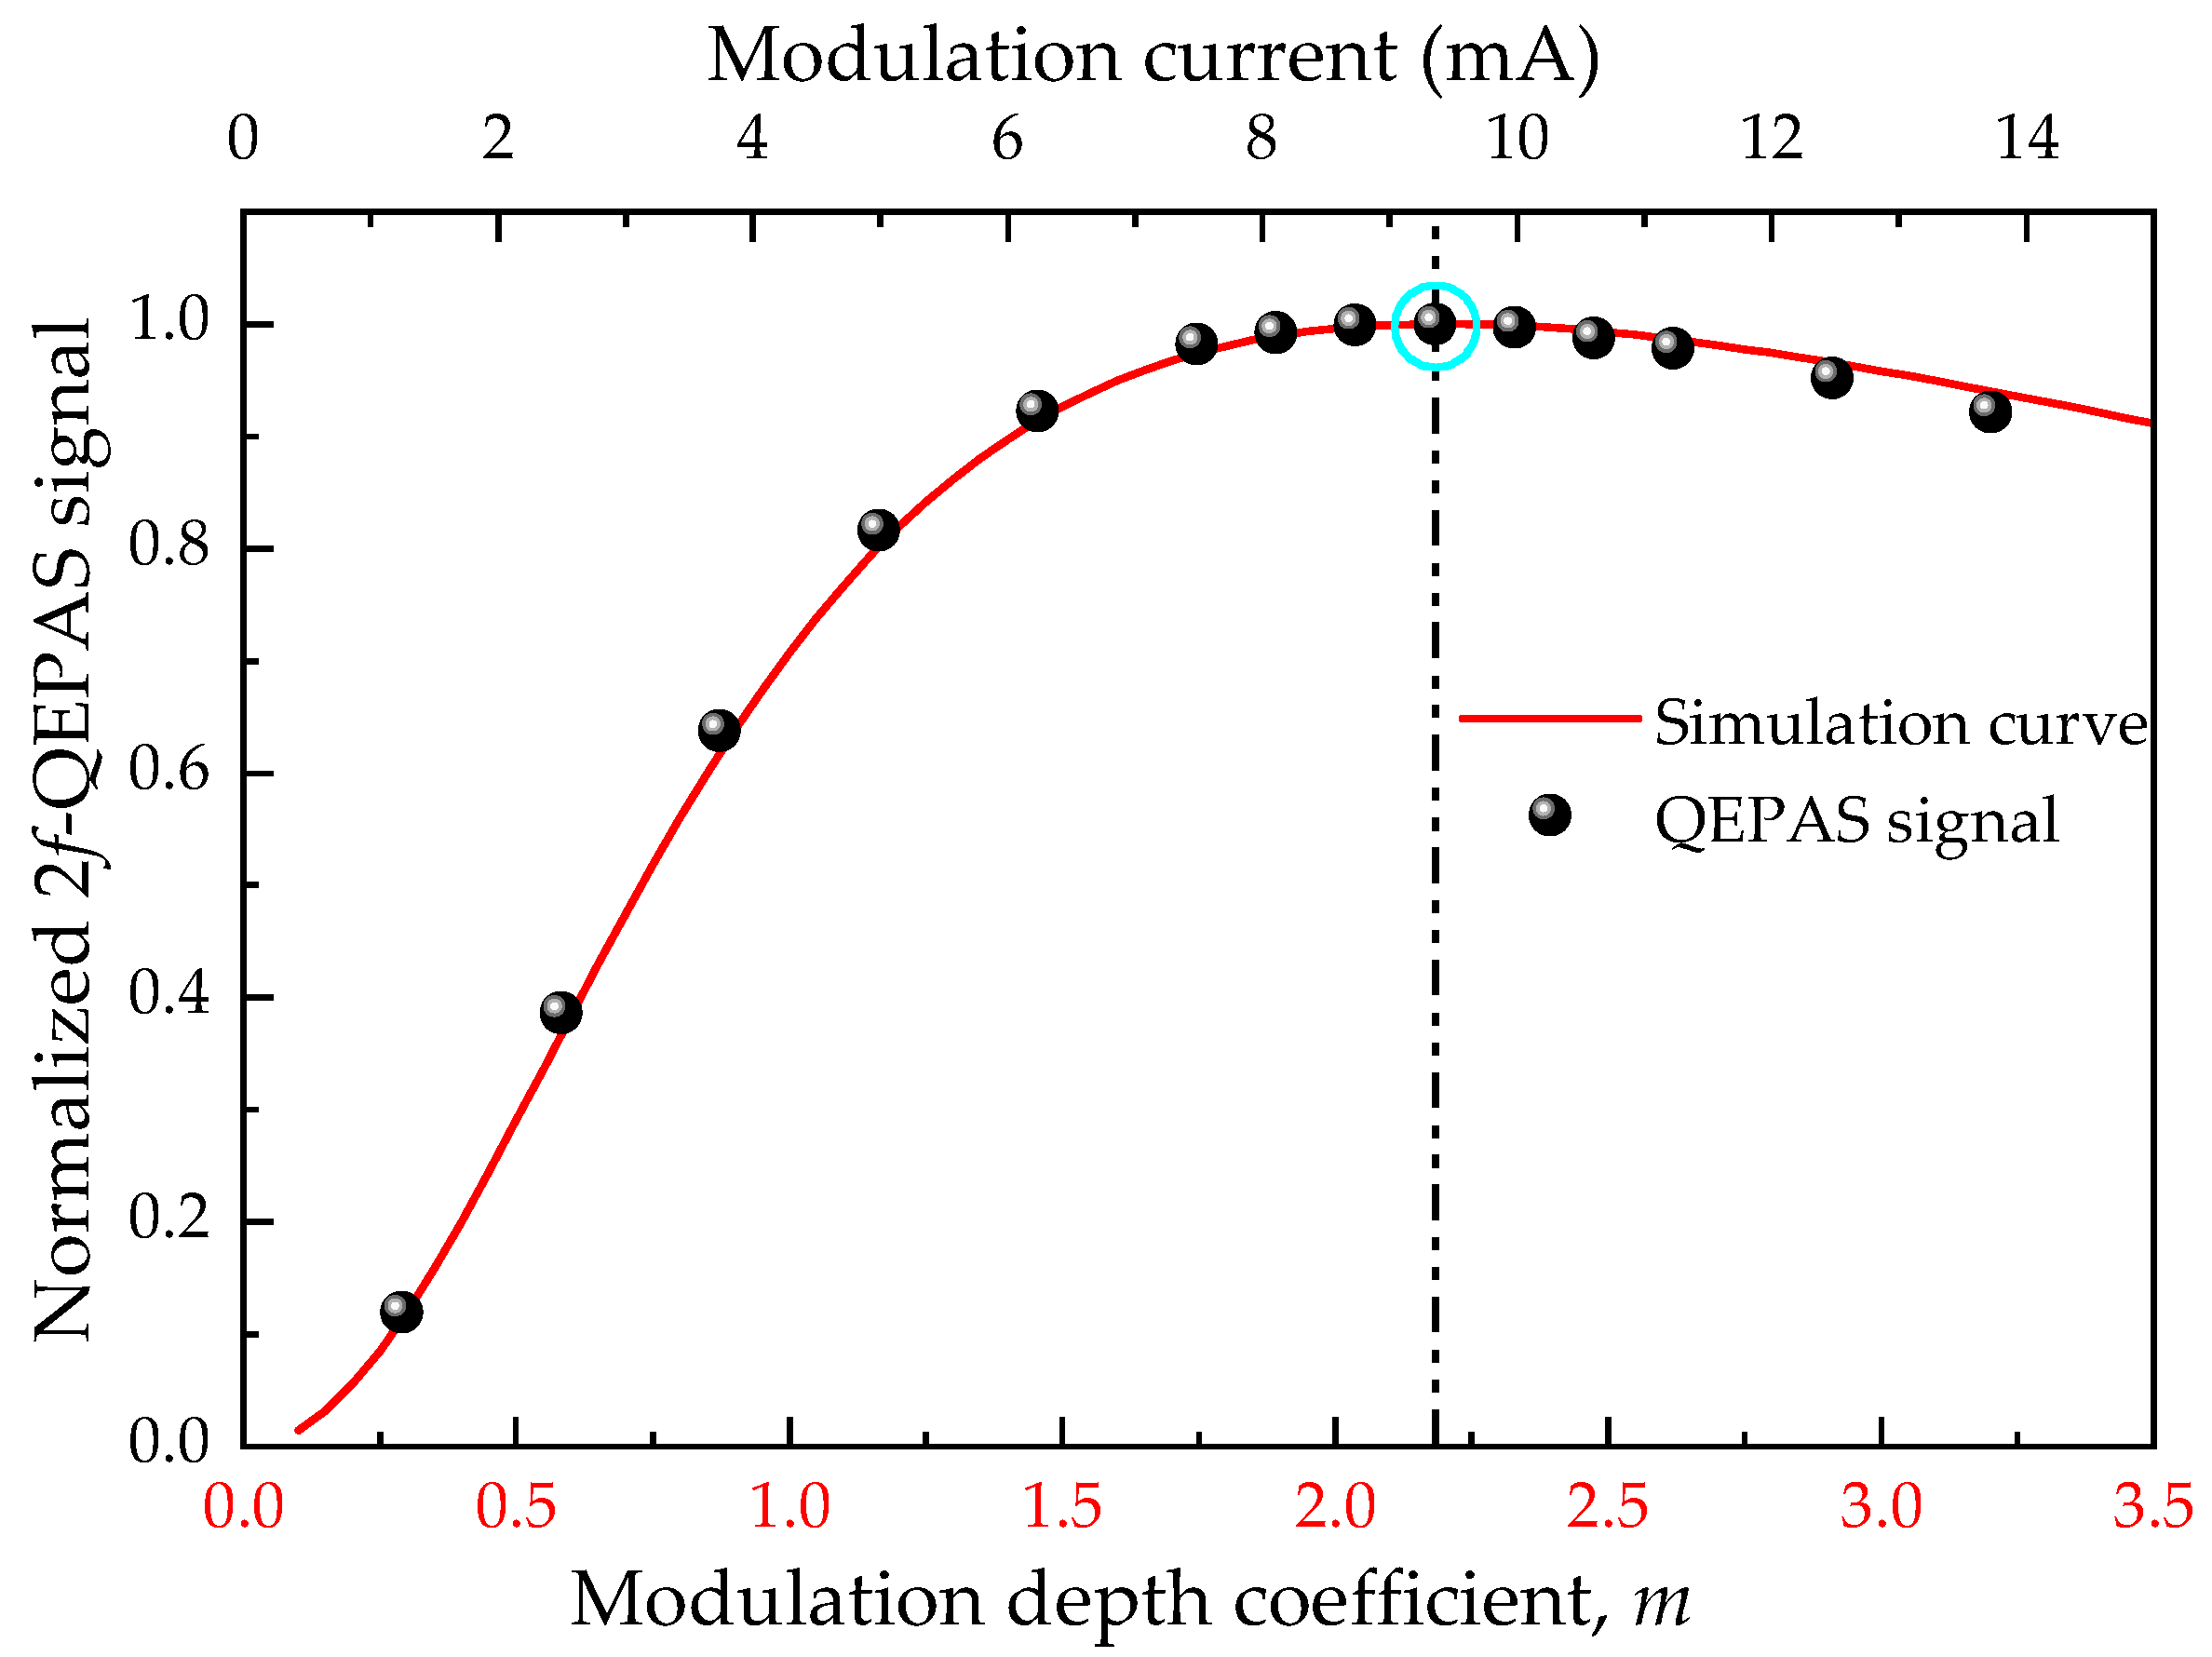
3. Experimental Results and Discussion

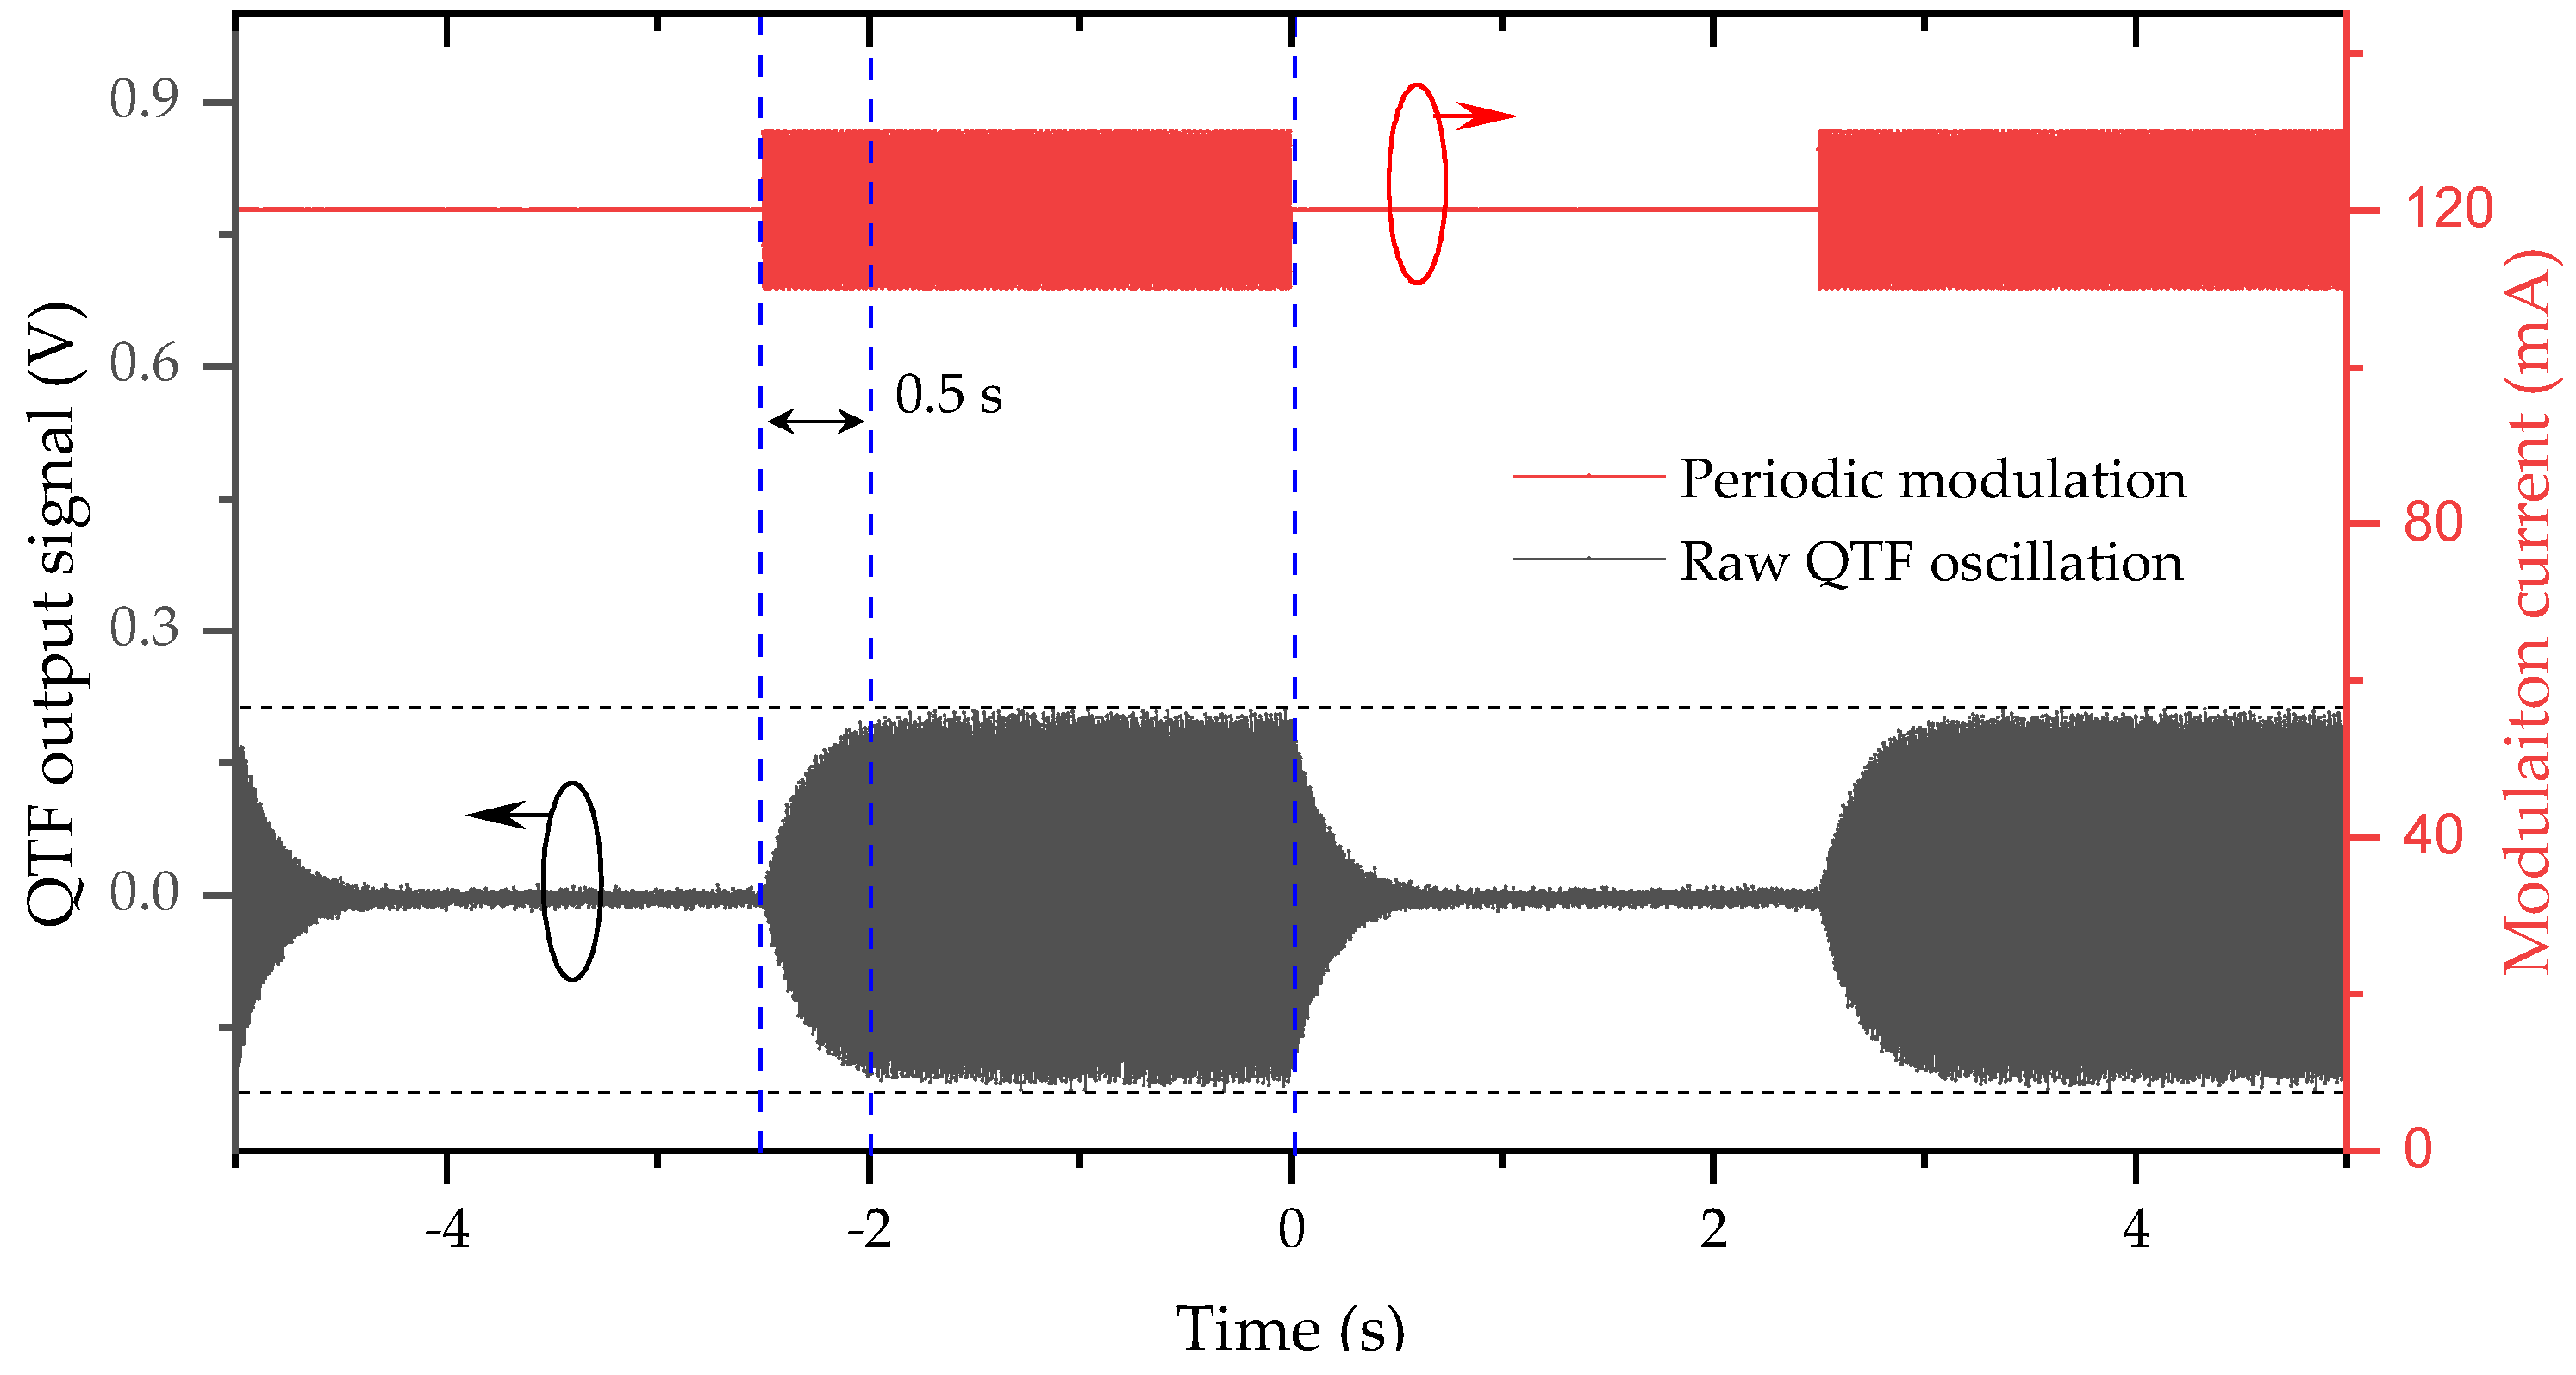
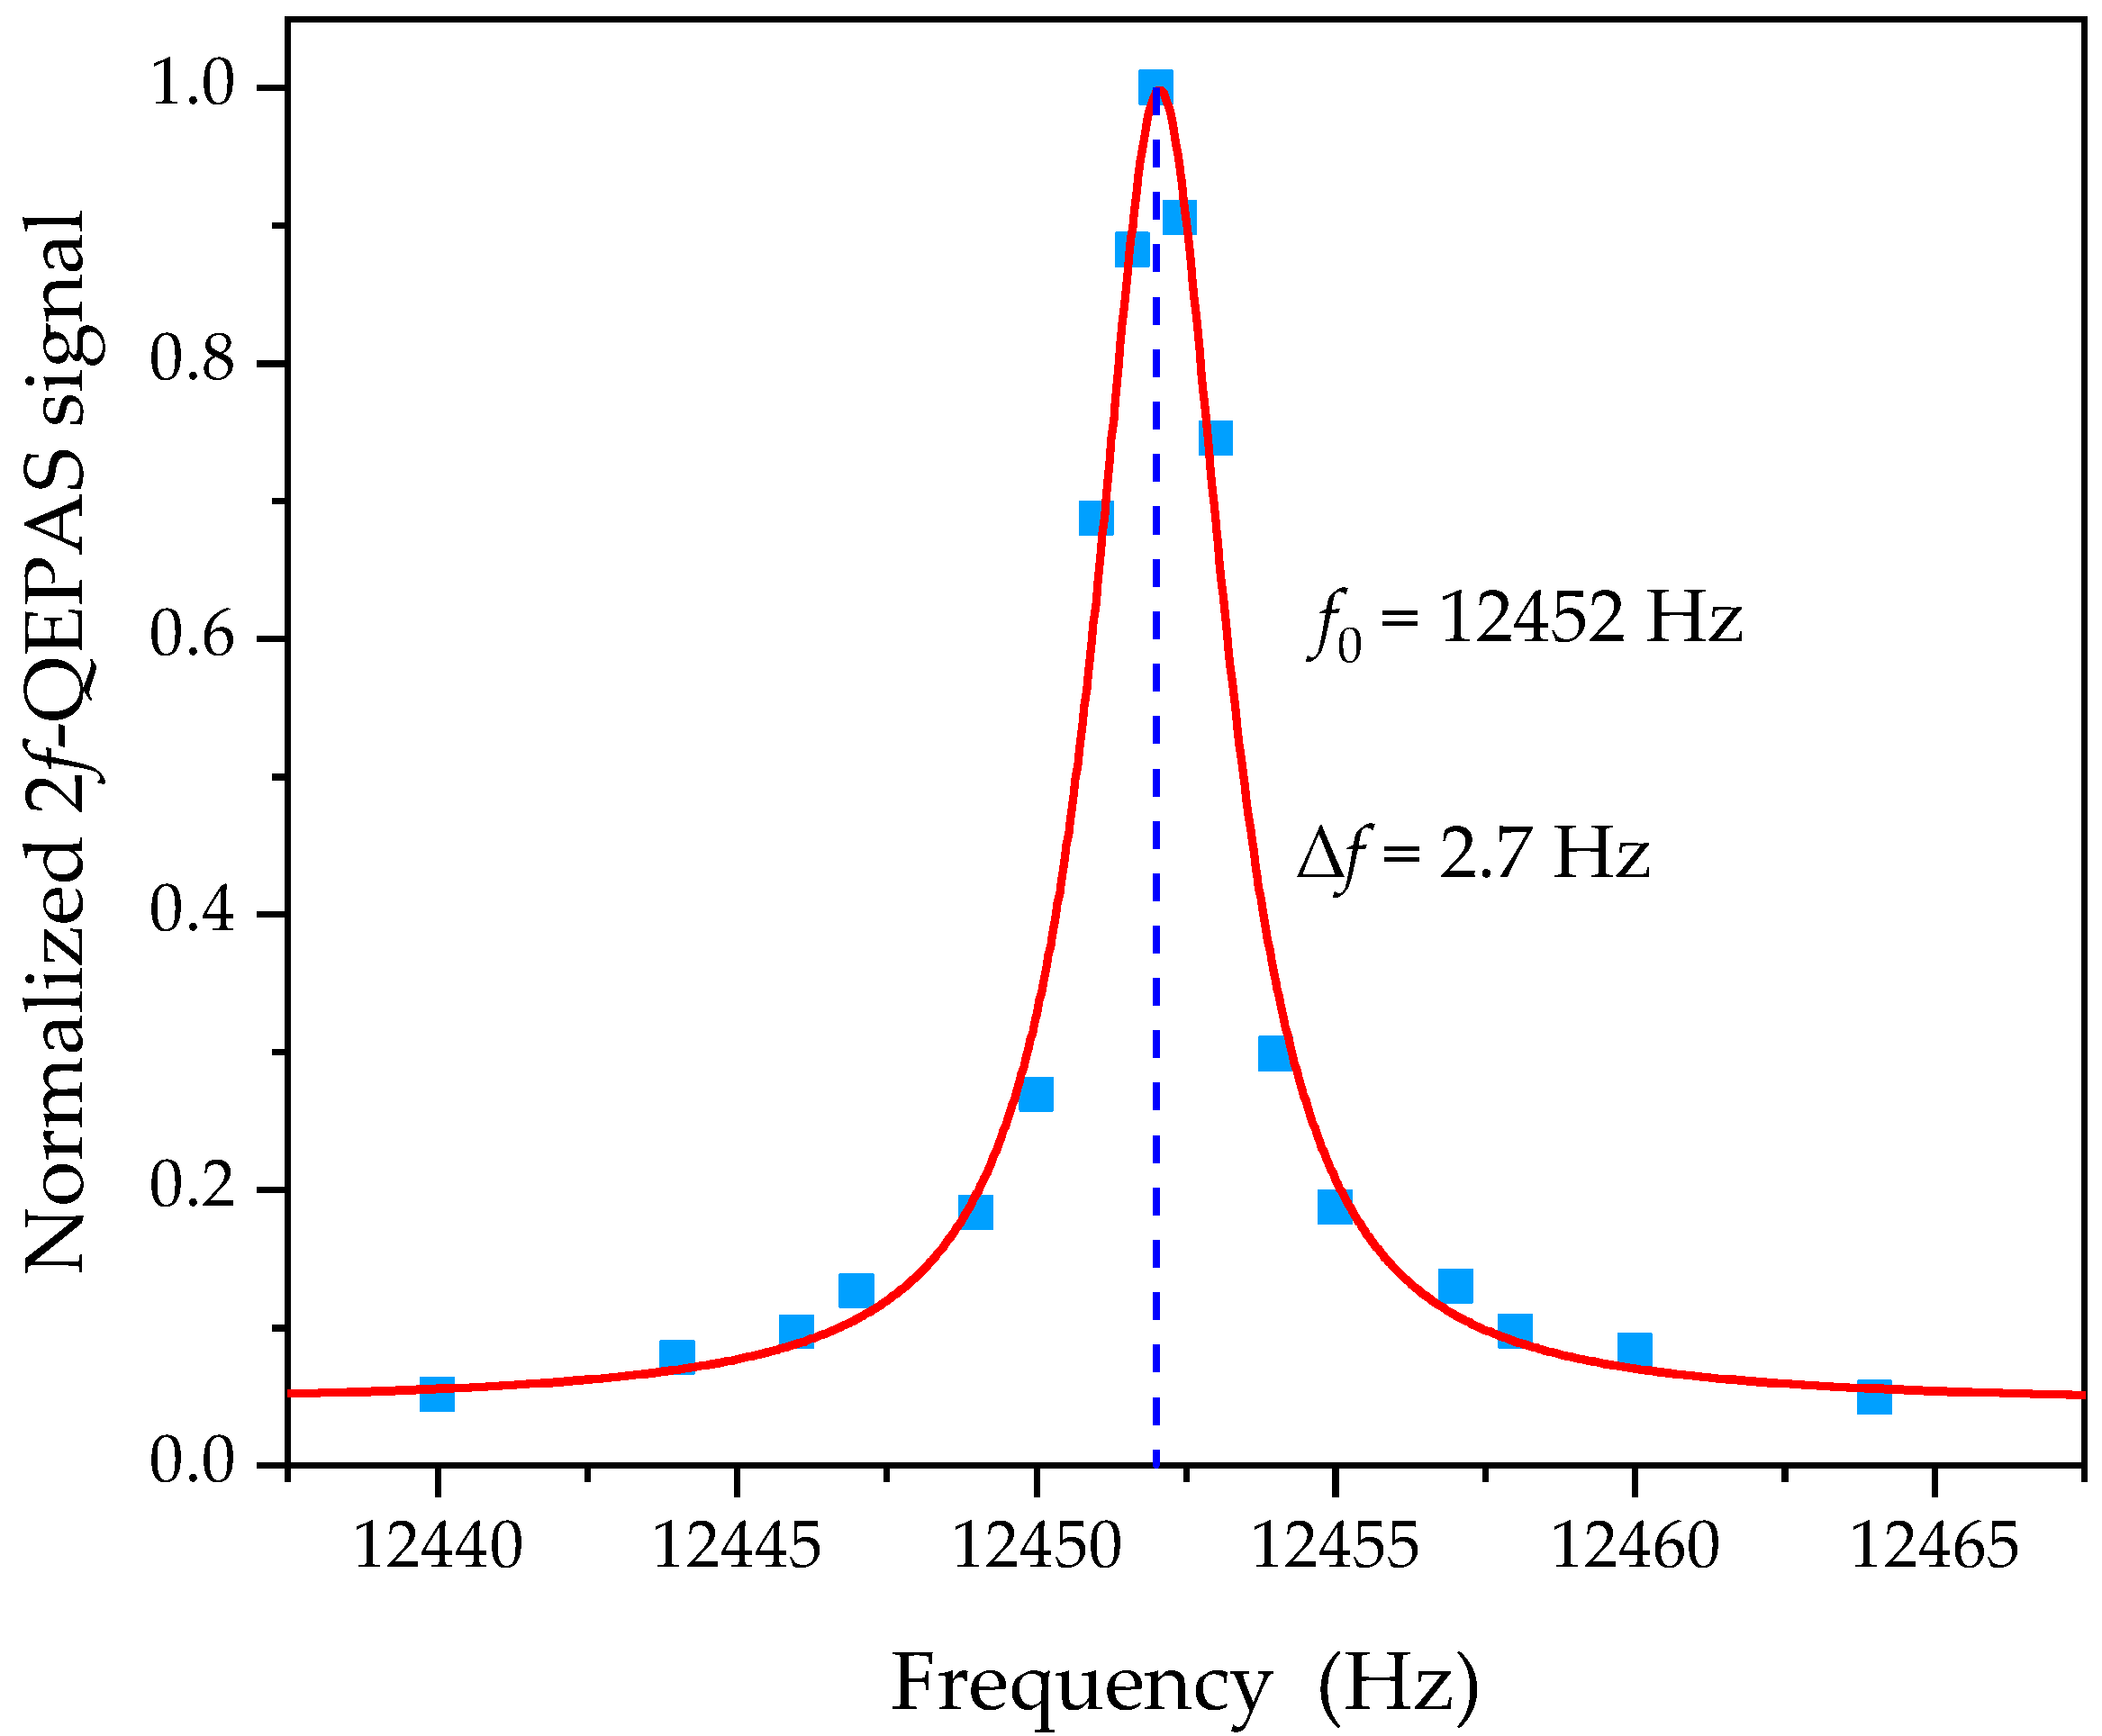
3.1. Response Time of the QTF Spectrophone

QEPAS acoustic wave detection strongly relies on sufficient energy accumulation in a QTF, which, in turn, limits the response time of the spectrophone. The effective QEPAS response to CO2 was experimentally determined by real-time monitoring of the QTF oscillation curve, in which acoustic stimulation was generated after sufficient QTF oscillation release (2.5 s). CO2 (1%) was filled into the ADM and the radiation wavelength was turned to the absorption line prior to the response time investigation. Figure 3 depicts the measured raw data of QTF oscillation response to the periodic stimulation. Based on the time it takes for signal amplitude increases from zero to a plateau level, the response time is determined to be 0.5 s, while the time it takes to reach 90% of the final level is 0.365 s, that is consistent with the theoretical model of τ = Q/f0 [11,26] using the calibrated quality factor Q and resonant frequency f0 (see Appendix B Figure A2). Note that Q and f0 depend on the operation temperature and gas pressure [27], all the following experiments are performed under room temperature and 1 bar.

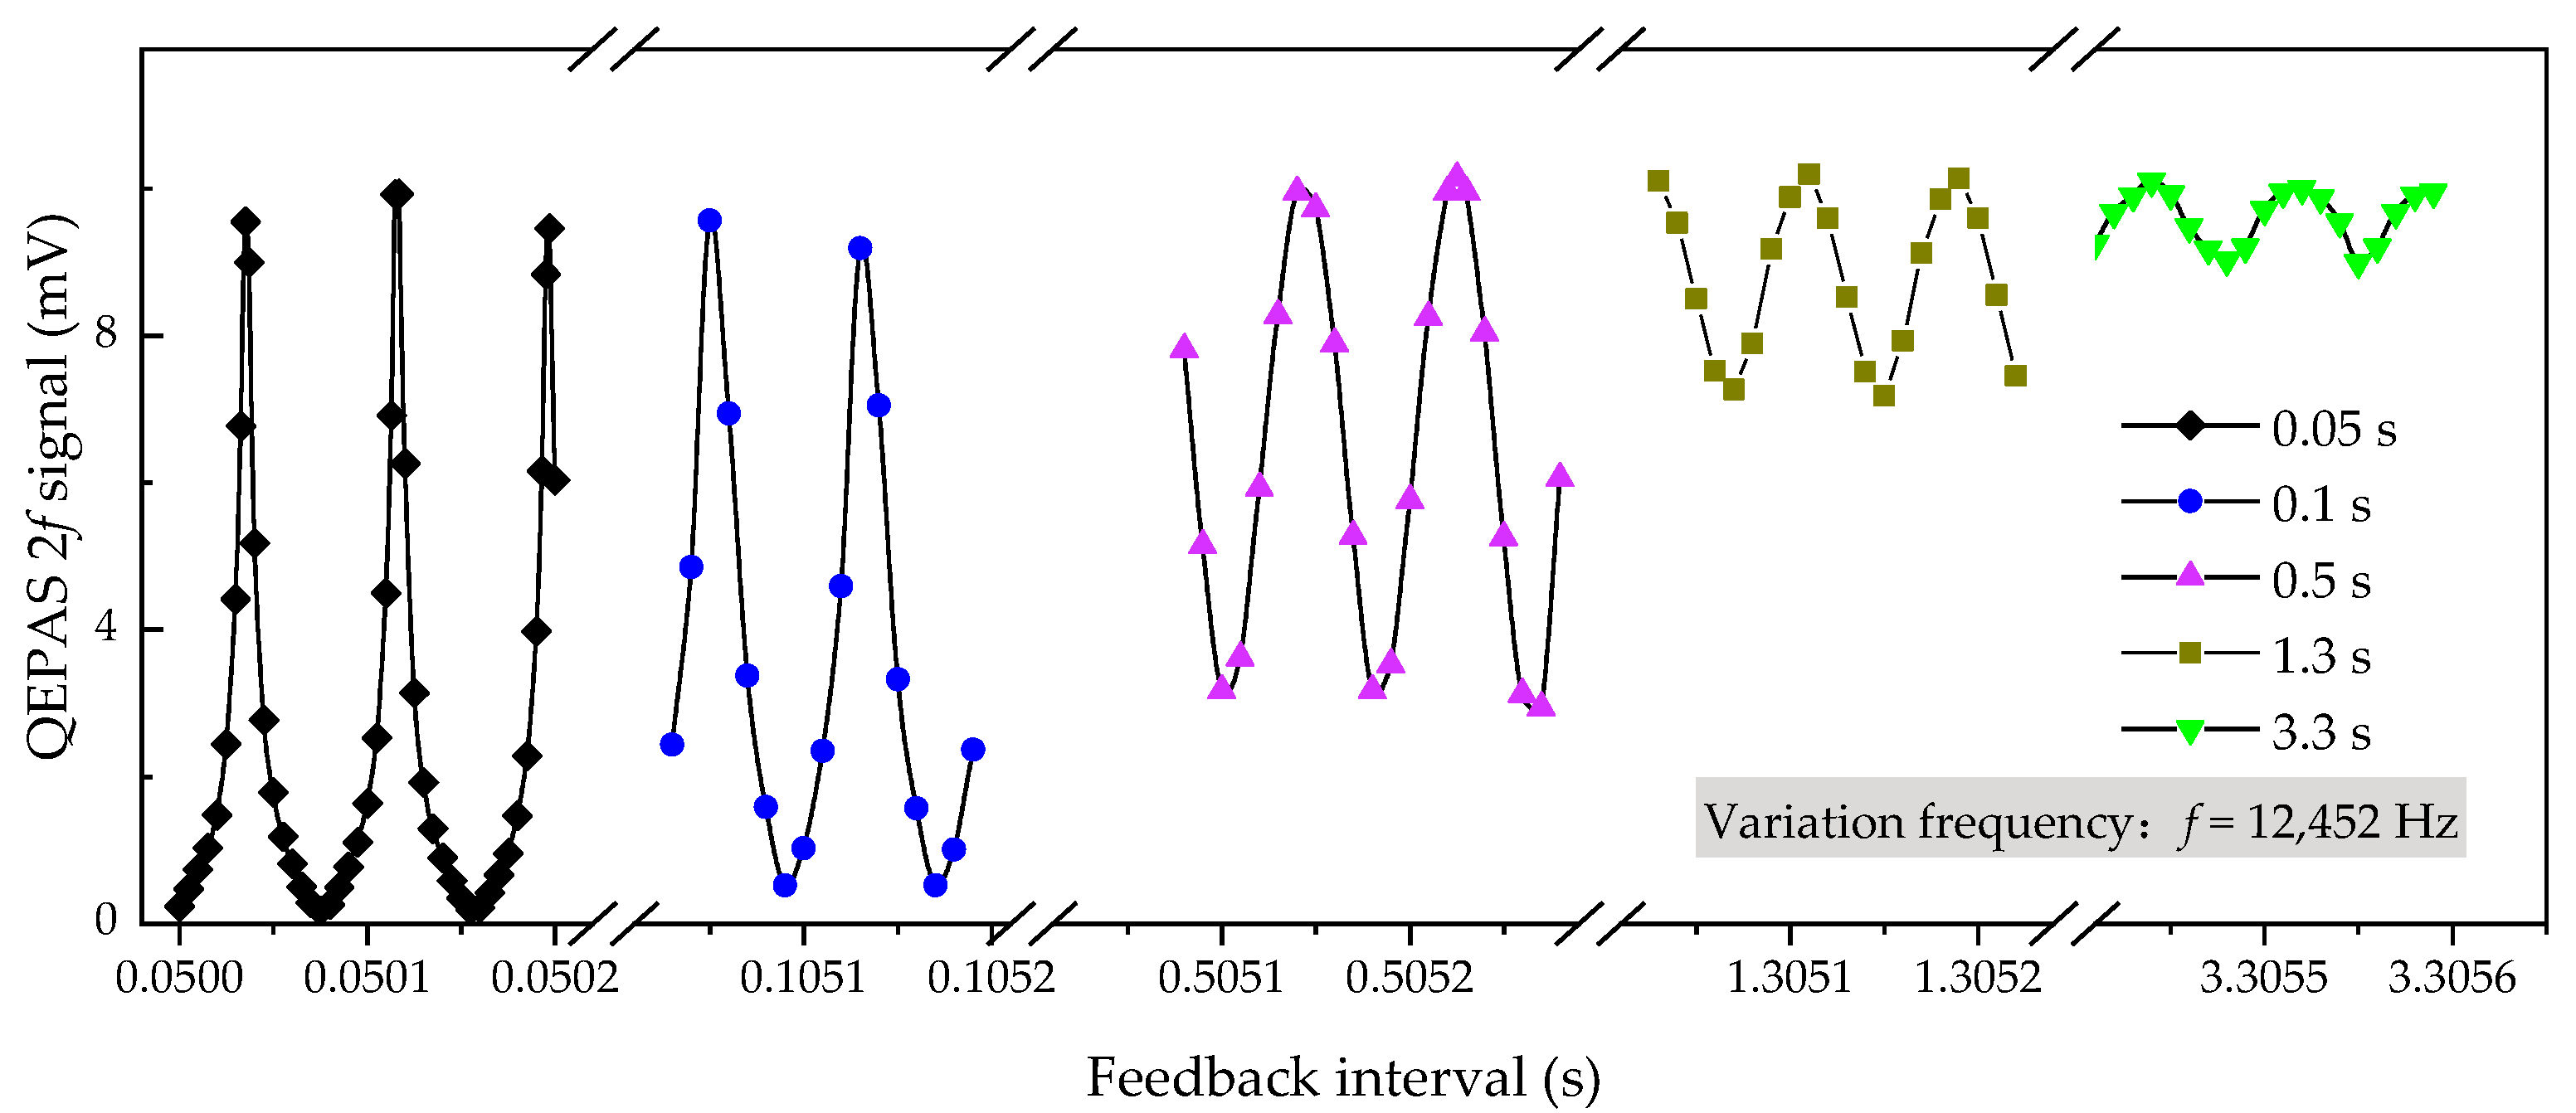
3.2. Feedback Interval Determination

The photoacoustic signal response to feedback interval was investigated to optimize the CO2 measurement with maximum amplitude. Sample gas with 1000-ppm CO2 diluted in N2 was sealed in the ADM and a modulation current (frequency: 6226 Hz; amplitude: 9.4 mA) was added on an iterated bias current. Figure 4 depicts the QEPAS signals with periodic variations around typical feedback intervals of 0.05 s, 0.1 s, 0.5 s, 1.3 s, and 3.3 s. As expected, the variation frequency, which is obtained by averaging the five oscillation periods, equals the resonant frequency of the custom QTF.
Interestingly, stronger variation amplitude exists around a shorter feedback interval. This is probably due to the short energy accumulate and limited accumulated energy can be easily counteracted down to almost zero by the successive phase-mismatched acoustic source. This issue can be mitigated with a longer feedback interval, e.g., oscillation amplitudes around 1.3 s and 3.3 s are alleviated and will become imperceptible over an interval over 8 s. Again, the hypothesis on phase matching in reasonable feedback interval selection has been confirmed. Although similar maxima, compared with feedback intervals of 0.5 s or longer, can be obtained at about 0.05 s and 0.1 s without interrupting energy accumulation, sharper oscillations would make the spectrophone need a rather stable electronic control unit. Any small fluctuations (e.g., clock jitter, time difference of data processing for each feedback interval etc.) would lead to a misinformation. Considering the response time of the QTF spectrophone shown in Figure 3 as well as the feedback interval investigation, we selected a feedback interval of 0.50514 s to perform tight wavelength locking for the following experiments, while maintaining sufficient energy accumulation.

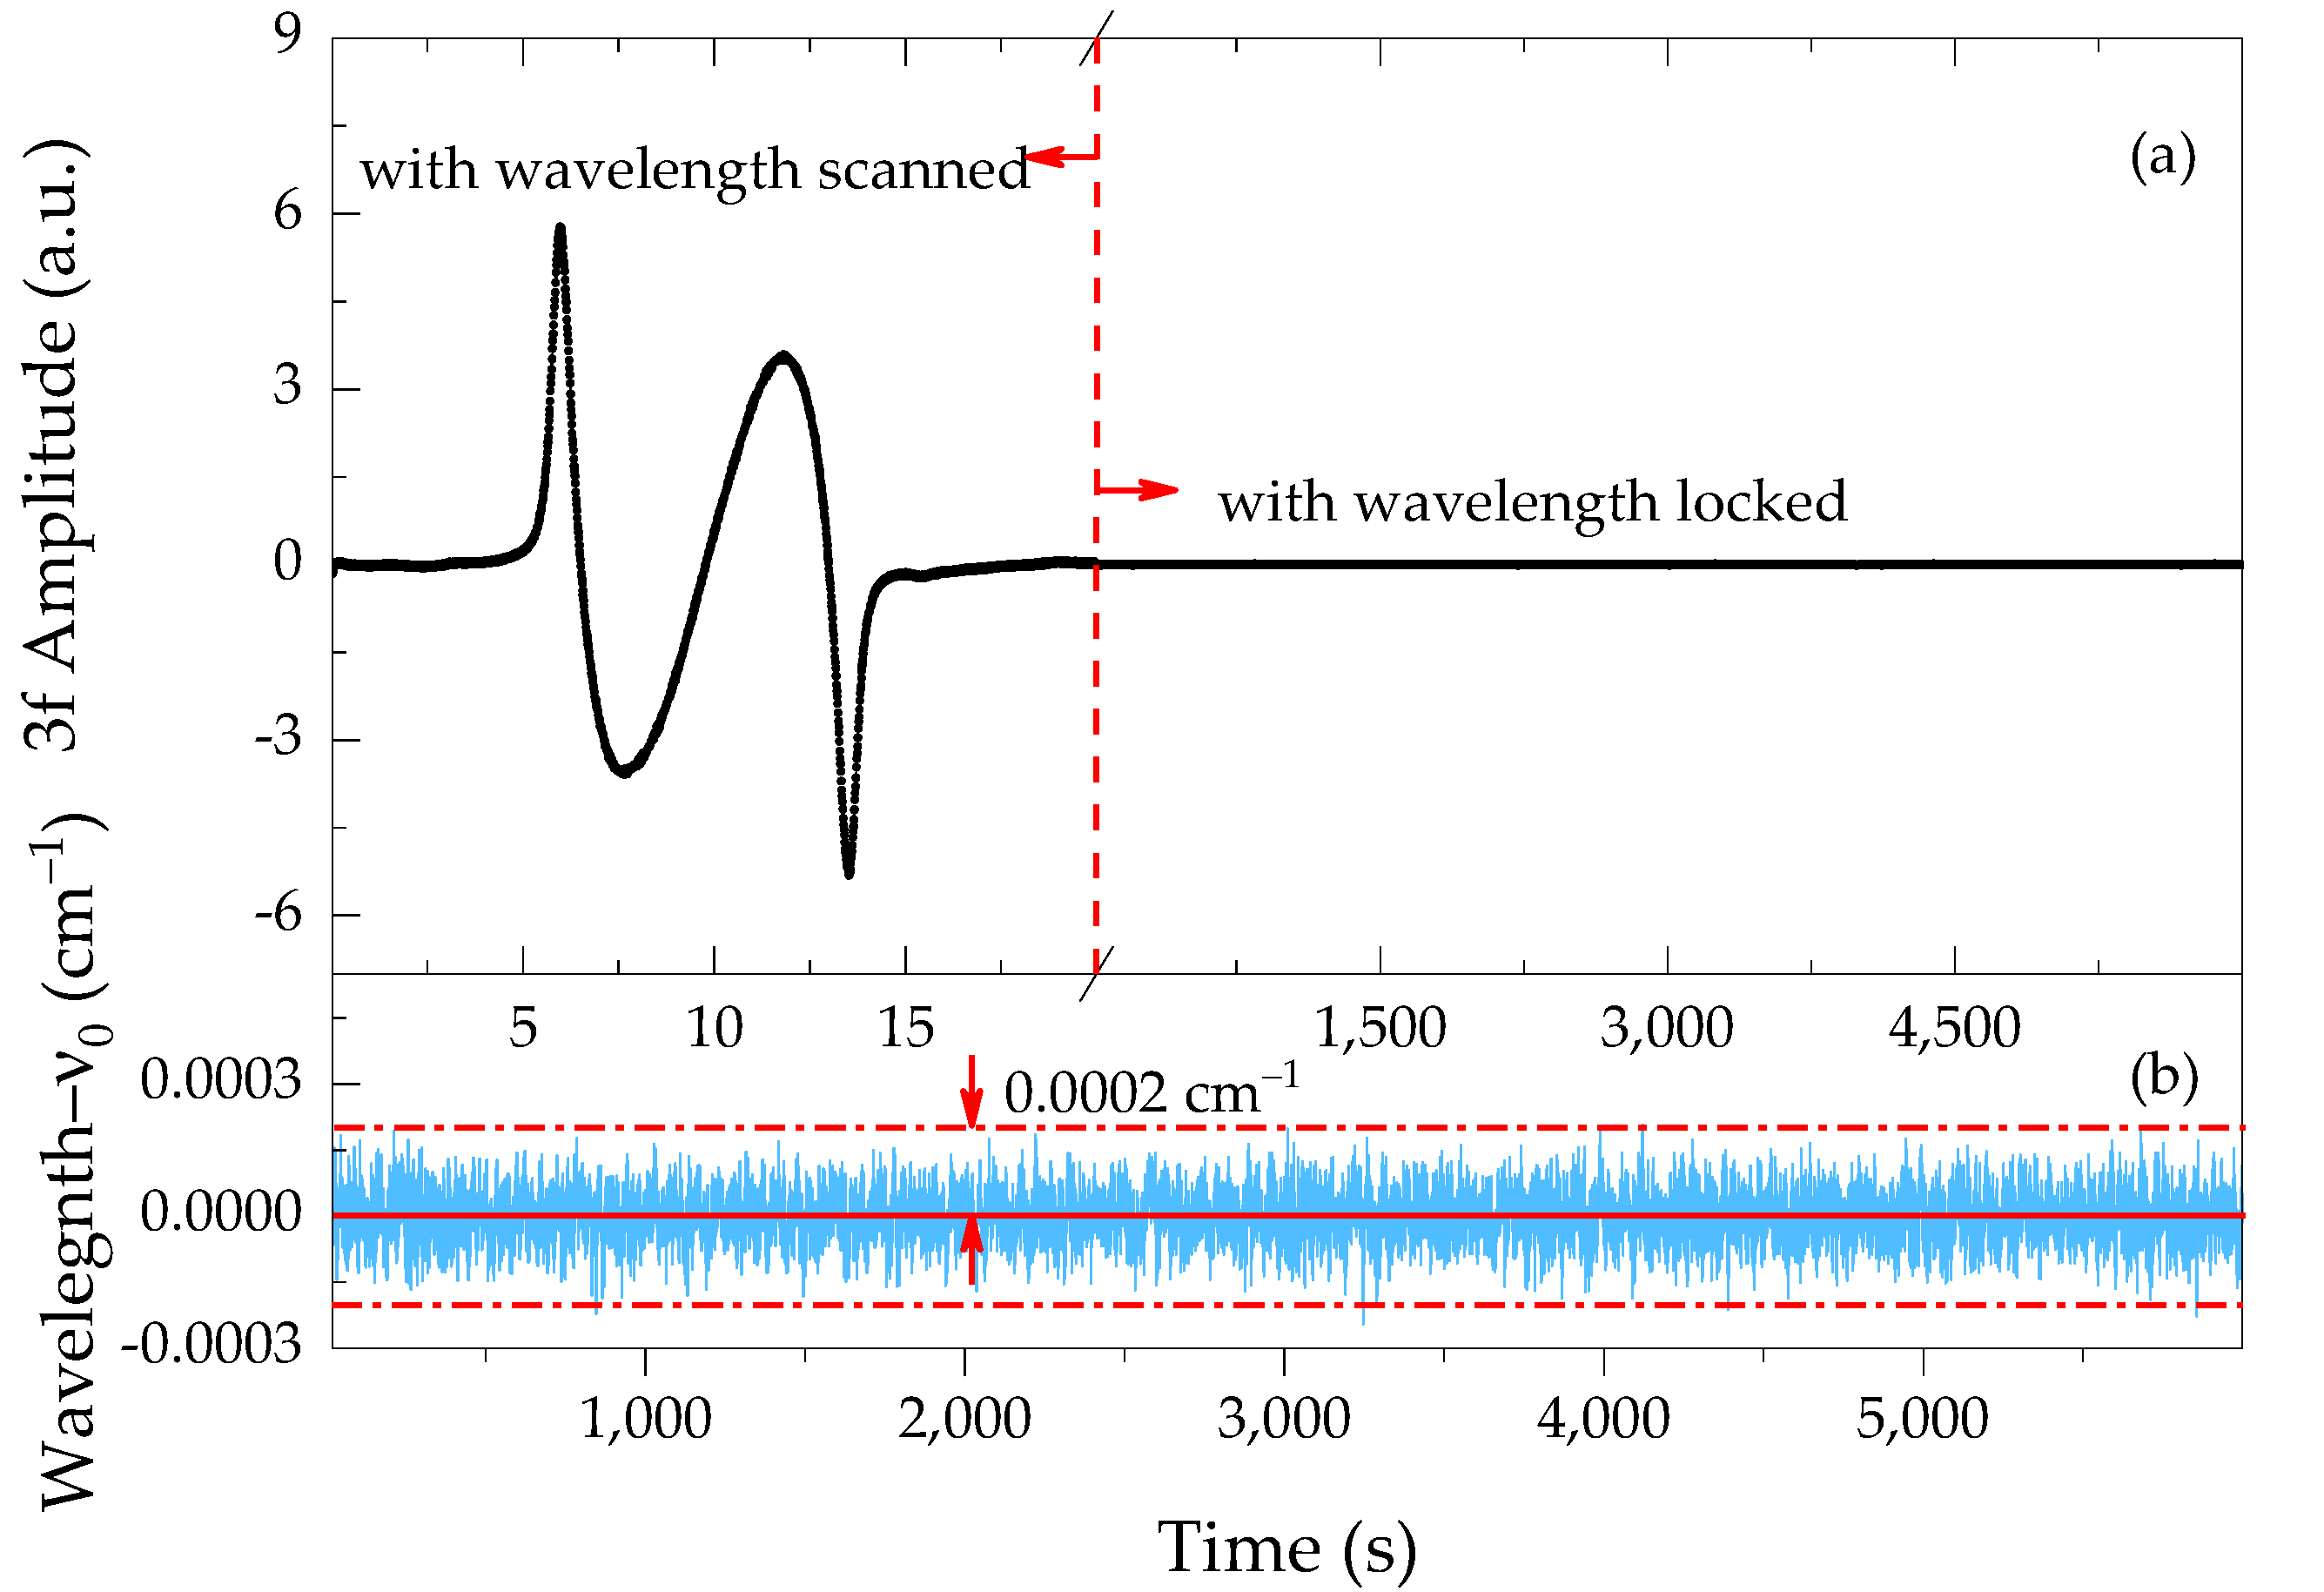
3.3. Line-Locked Wavelength Stabilization

The DFB laser wavelength was firstly scanned across the CO2 spectrum by superposing a 0.05 Hz ramp on a 6226 Hz sinusoidal modulation. The preset bias current, corresponding to the absorption line center ν0, was then figured out for the following line-locked process. The 3f component of the absorption feature was used as the error signal to compensate for the laser wavelength drift. With the PID feedback control started, as shown in Figure 5, the 3f reaches an approximately constant value with a small variation around zero for hours, meaning real-time wavelength locking to the absorption line during continuous operation. One might argue that when working at atmospheric pressure (ADM, 760 Torr) there is a shift of the CO2 line, with respect to the reference chamber (50 Torr). In this case, the shift is about 150 MHz [28], only 3% of the CO2 linewidth (4.4 GHz at 760 Torr). Its influence on the signal amplitude is evaluated to be within 0.5%. Besides, a narrower linewidth at low pressure can benefit the wavelength locking because the error signal is more sensitive to the laser frequency drift. The wavelength stabilization performance is evaluated by comparing the 3f amplitude fluctuation under line-locked operation with the scanning spectrum (i.e., wavelength scanned part in Figure 5a). The 3f amplitude over 6000 s is shown in Figure 5b with the wavenumber deviations evaluated to be within 0.0002 cm−1. Therefore, an improvement in stability, accuracy, and response time can be expected for QEPAS spectrophones.

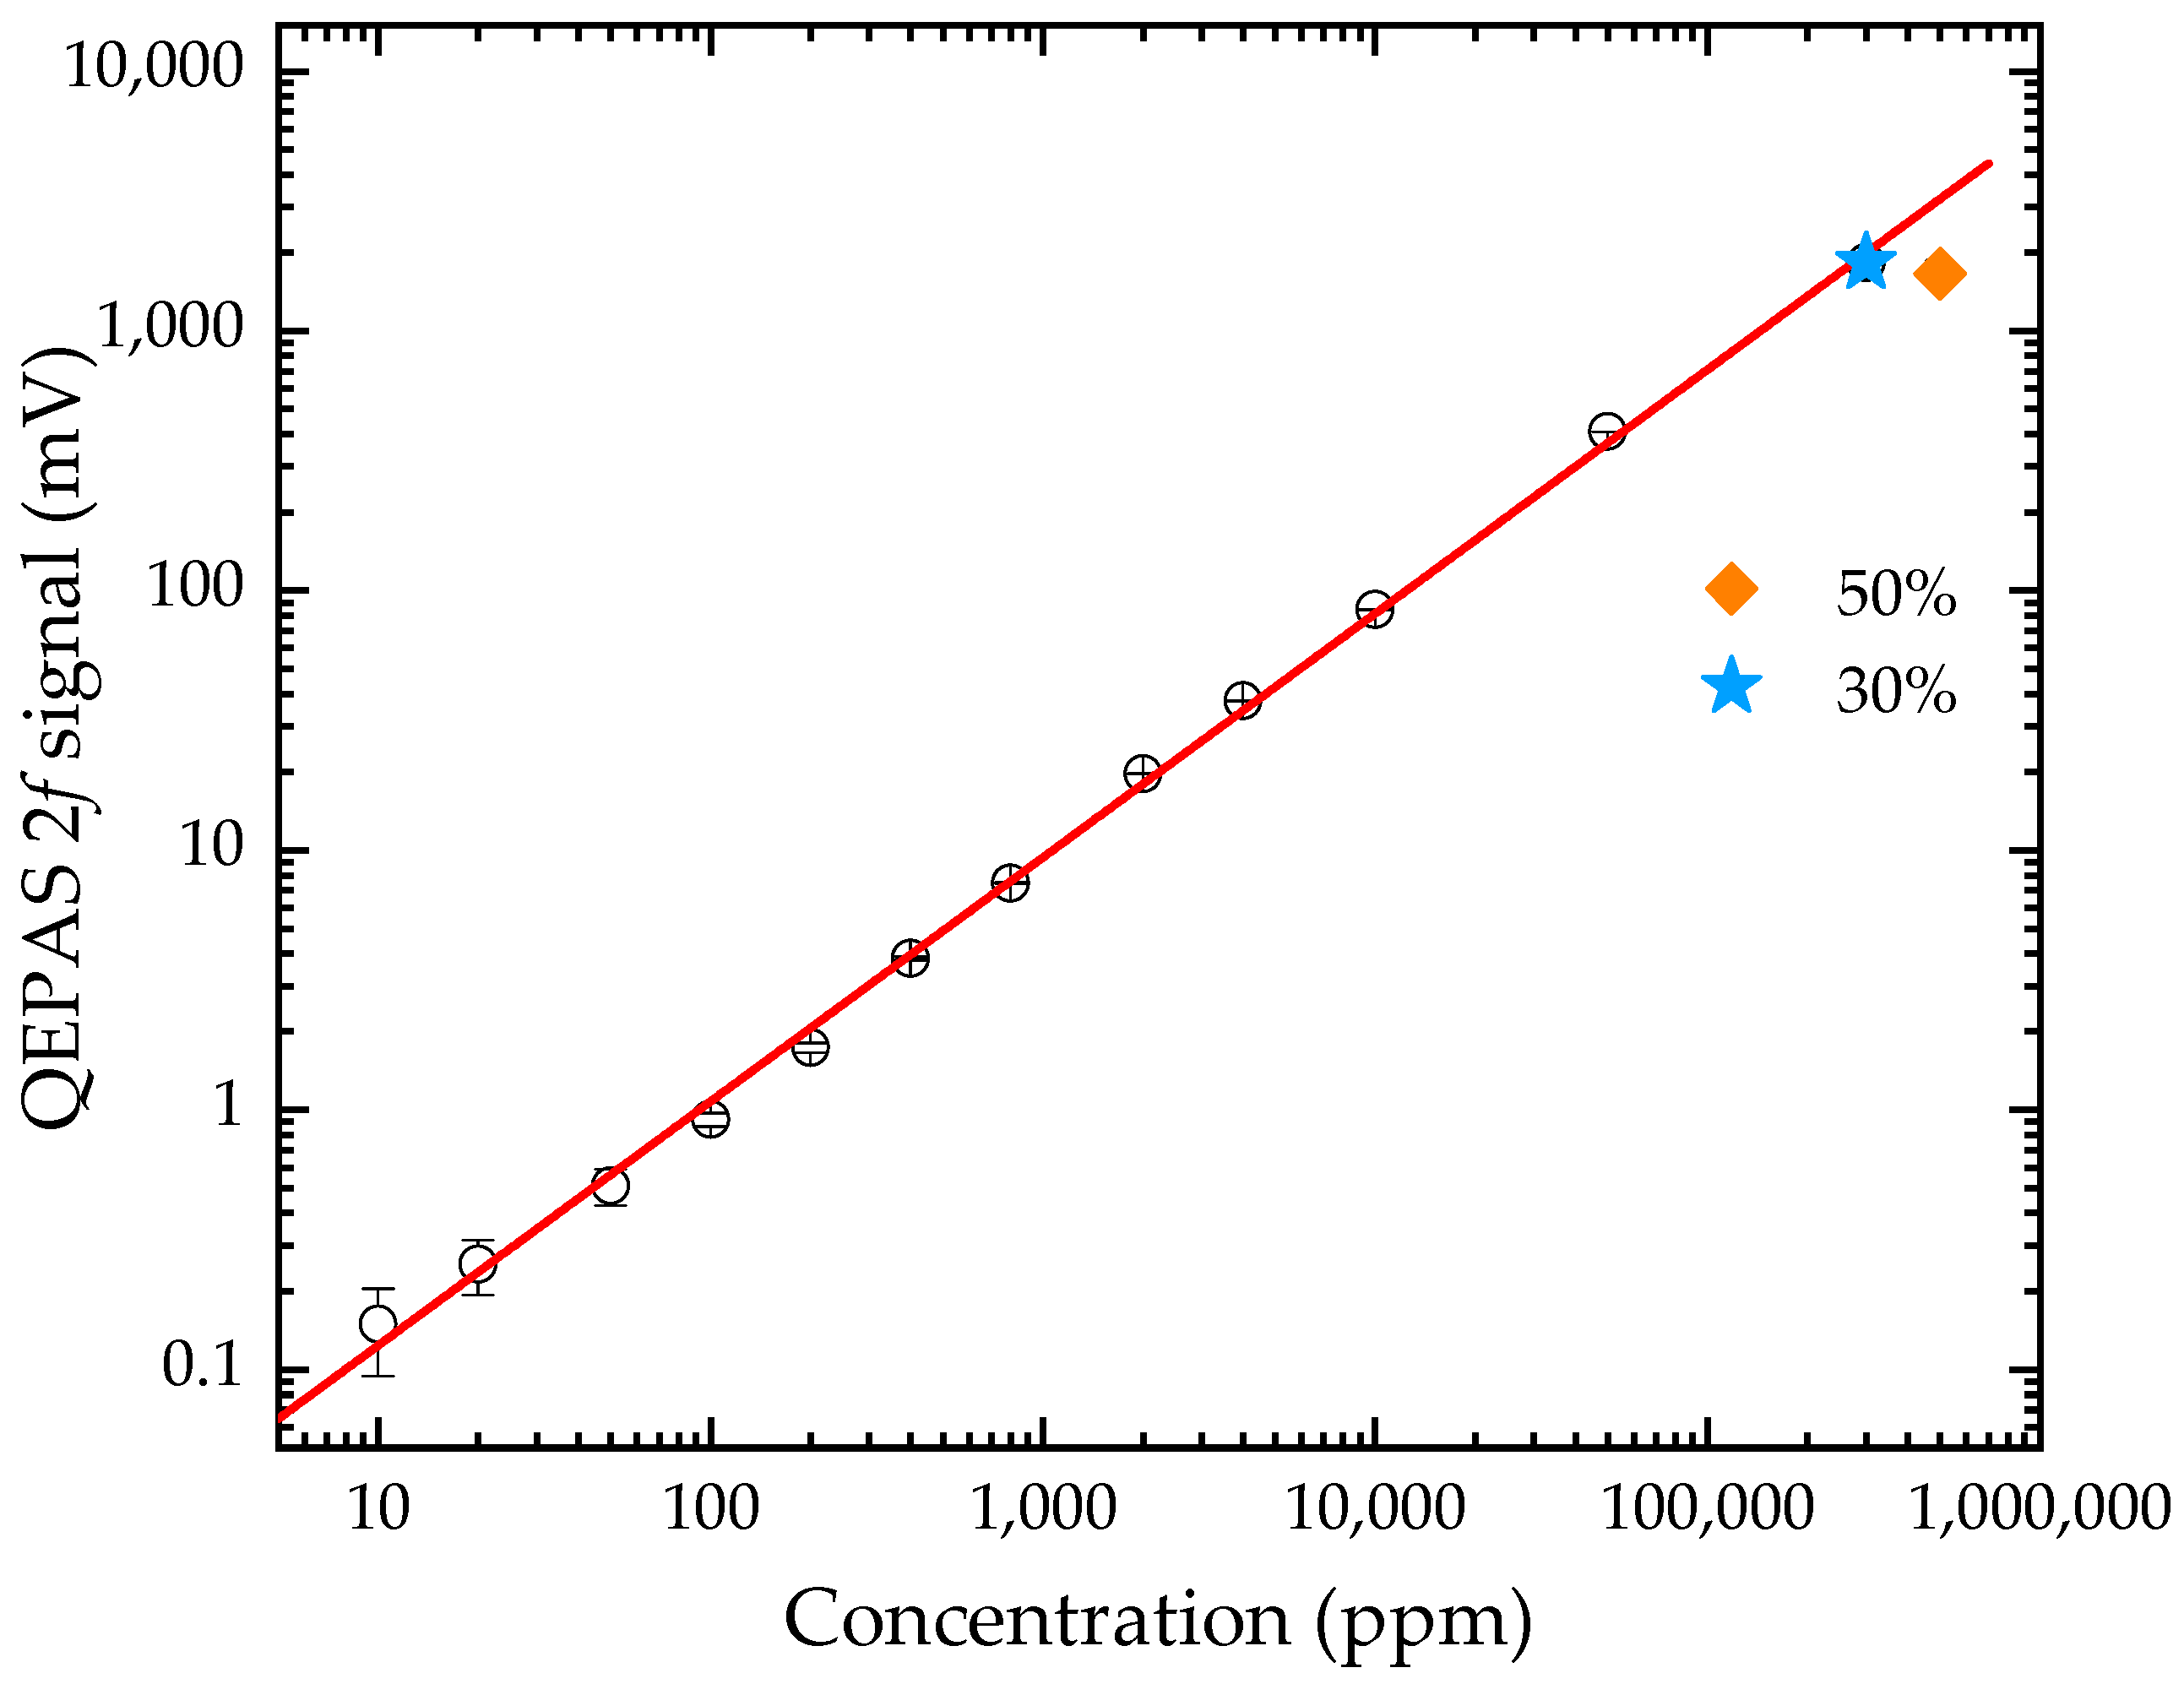
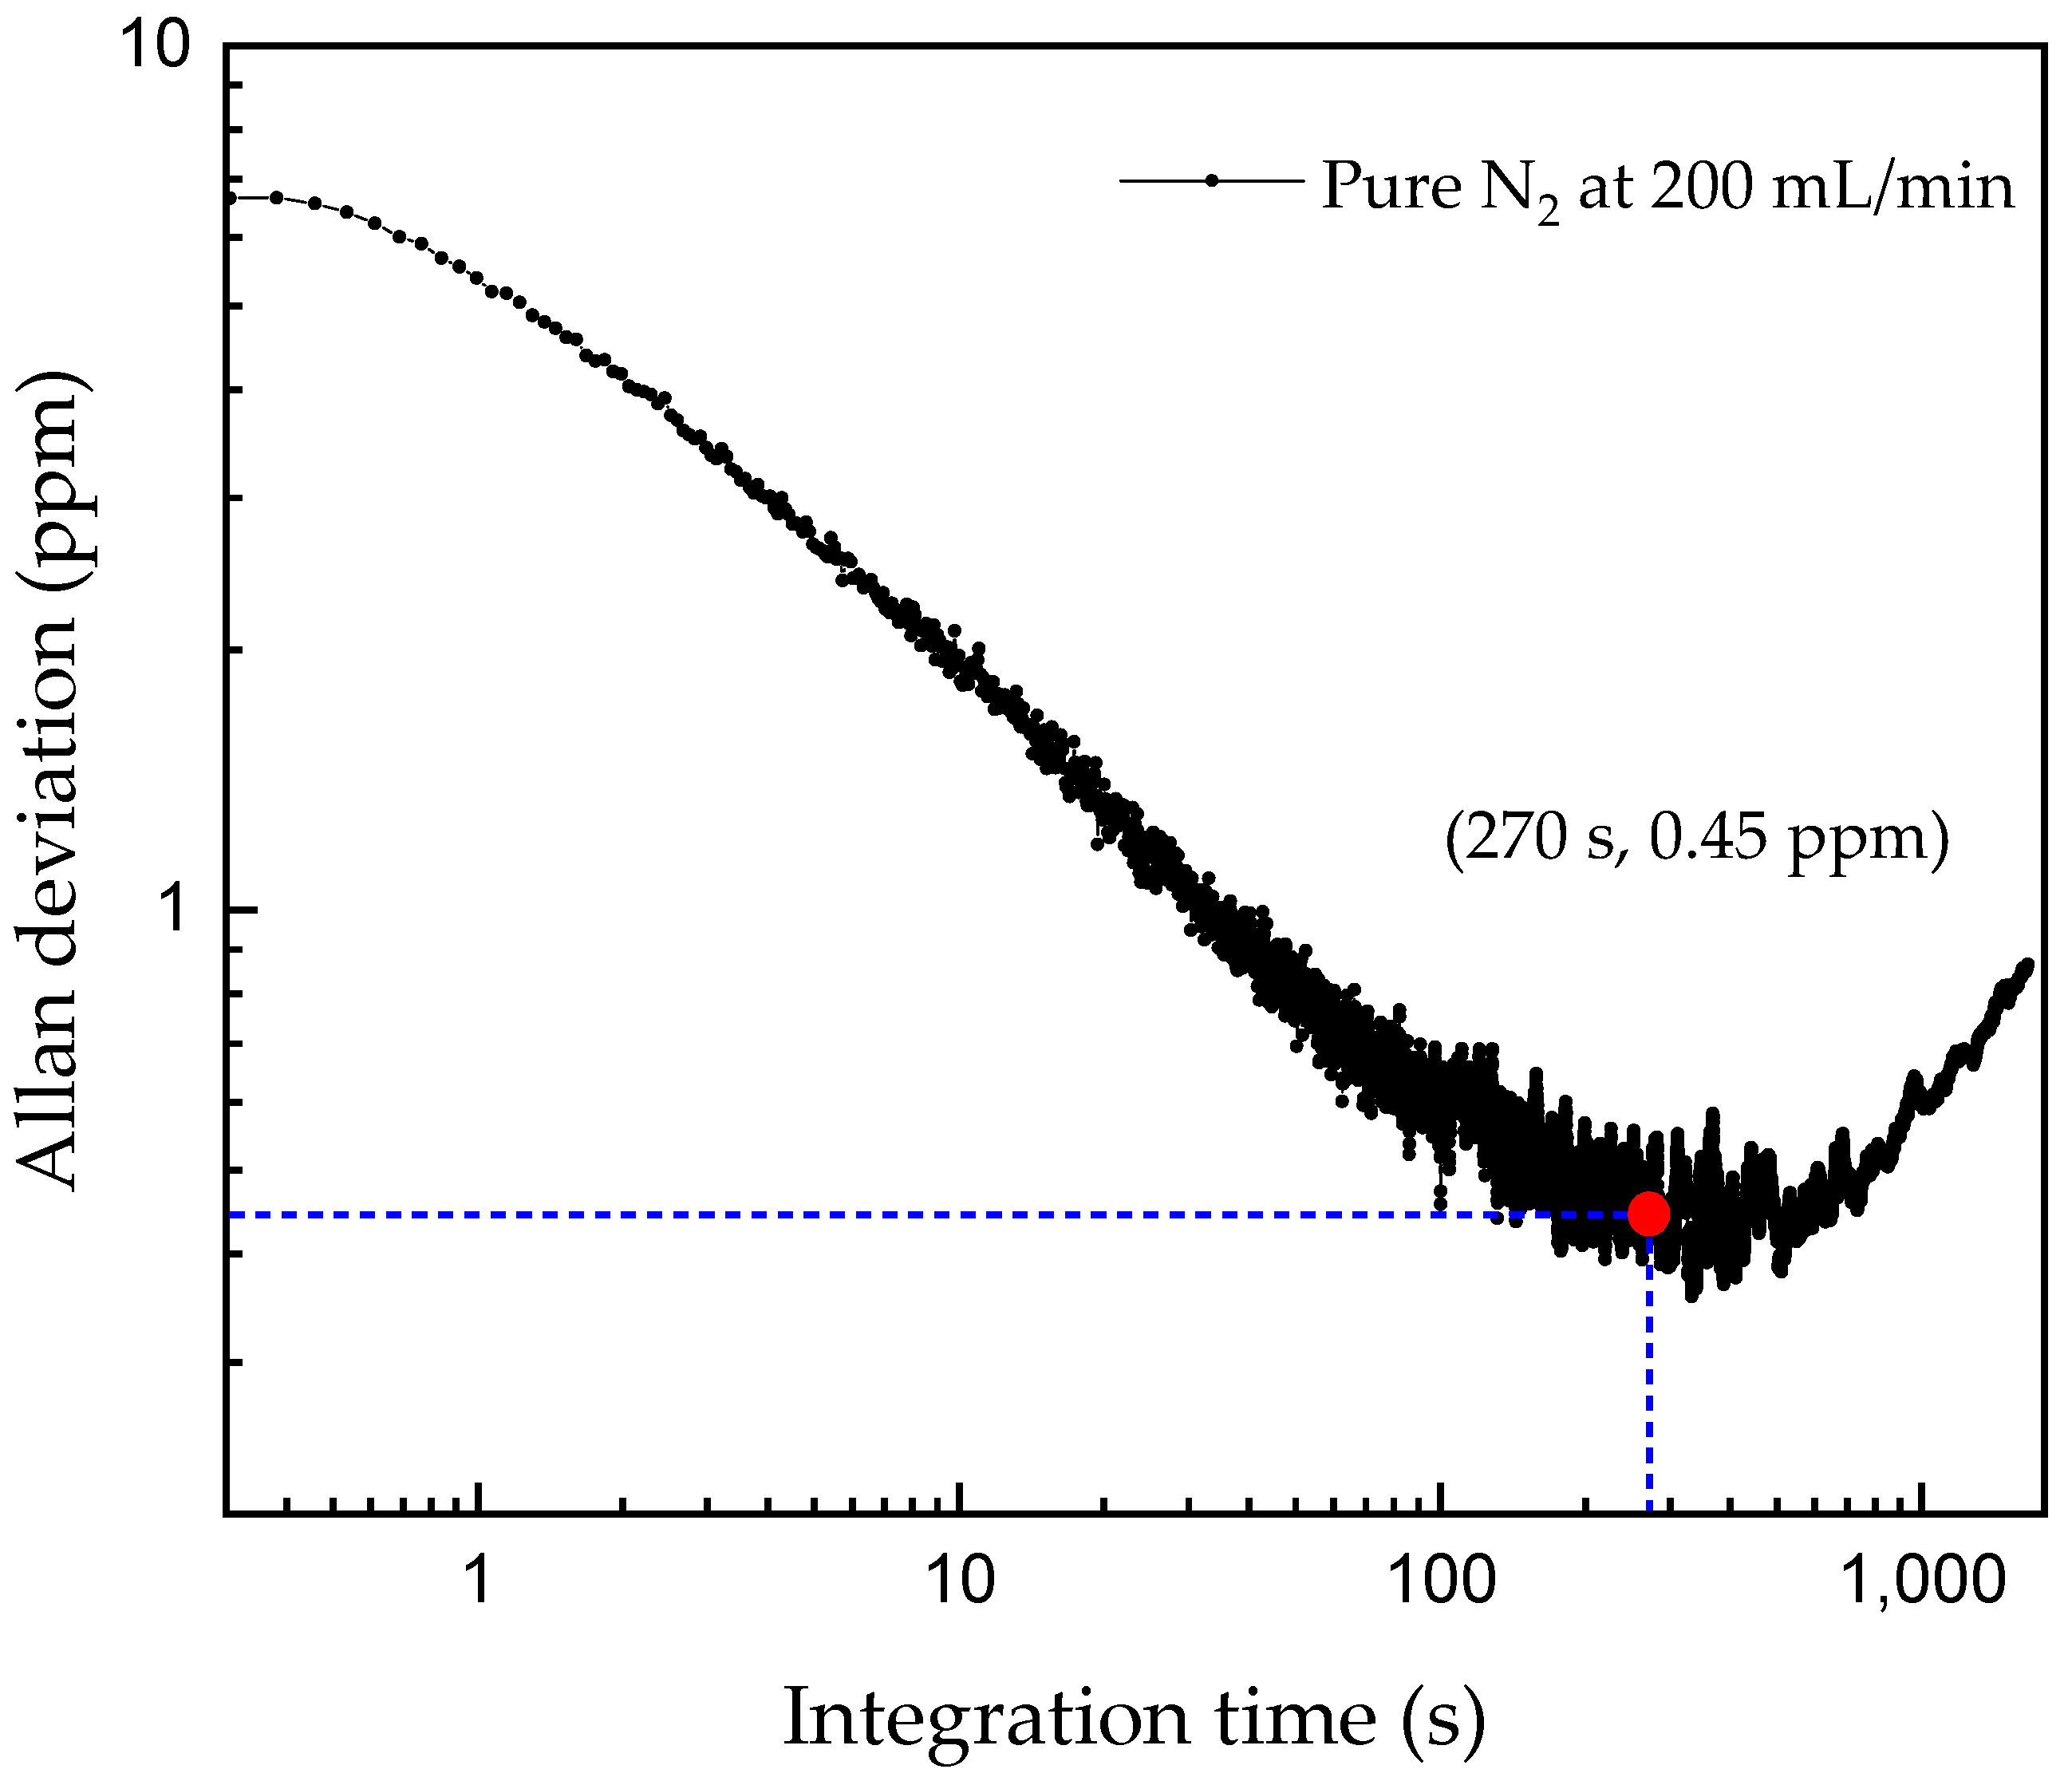
3.4. Sensor Performance

After completing the construction of the experimental system, we first optimized the laser wavelength modulation depth coefficient (i.e., m = α/Δν, where α is modulation depth and Δν is the HWHM of the absorption spectrum) to improve the 2f QEPAS signal amplitude (see Appendix C Figure A3). With the laser wavelength tightly locked to the absorption line, the sensor performance was further investigated at 1 bar and 296 ± 2 K. CO2/N2 mixtures were uniformly pumped through the ADM at a flow rate of 200 mL/min. The mixtures were prepared by diluting certified 1% and 100% CO2 with pure nitrogen (purity 99.999%) using a commercial gas mixer. The sensor response is illustrated in Figure 6 by plotting the photoacoustic 2f amplitude as a function of CO2 concentration, ranging from 10 ppm to 50%. The vertical error bars take into account the uncertainty of the measured signal amplitude (i.e., the standard deviation of measurement over 30 s). A linear fitting is performed to the measured data and an R-square value of 0.9985 is obtained, indicating a good linear response to the CO2 concentration. Above a CO2 concentration of 30%, the acoustic signal begins to decline. It is probably caused by the significant variation of gas components, which could change the QTF resonant frequency by a higher gas density, the optimal resonant tube length by a lower sound velocity, or the modulation depth coefficient by a broadened HWHM.
To evaluate the achievable minimum detection limit of the current QEPAS spectrophone, we performed an Allan deviation analysis, measuring and averaging the photoacoustic signal of continuous dry nitrogen at a flow rate of 200 mL/min. Meanwhile, the laser wavelength was locked to the absorption line of CO2. The Allan deviation plotted in Figure 7 reports a detection limit of 7 ppm at an integration time of ~0.5 s. The corresponding normalized noise equivalent absorption coefficient (NNEA) is calculated to be 4.7 × 10⁻⁹ W·cm−1·Hz−1/2. Furthermore, the detection limit can be improved to 0.45 ppm at an integration time of 270 s. This minimum detection limit together with the upper detection concentration of 30% in Figure 6 determines the linear dynamic range, i.e., 6.7 × 10⁵.

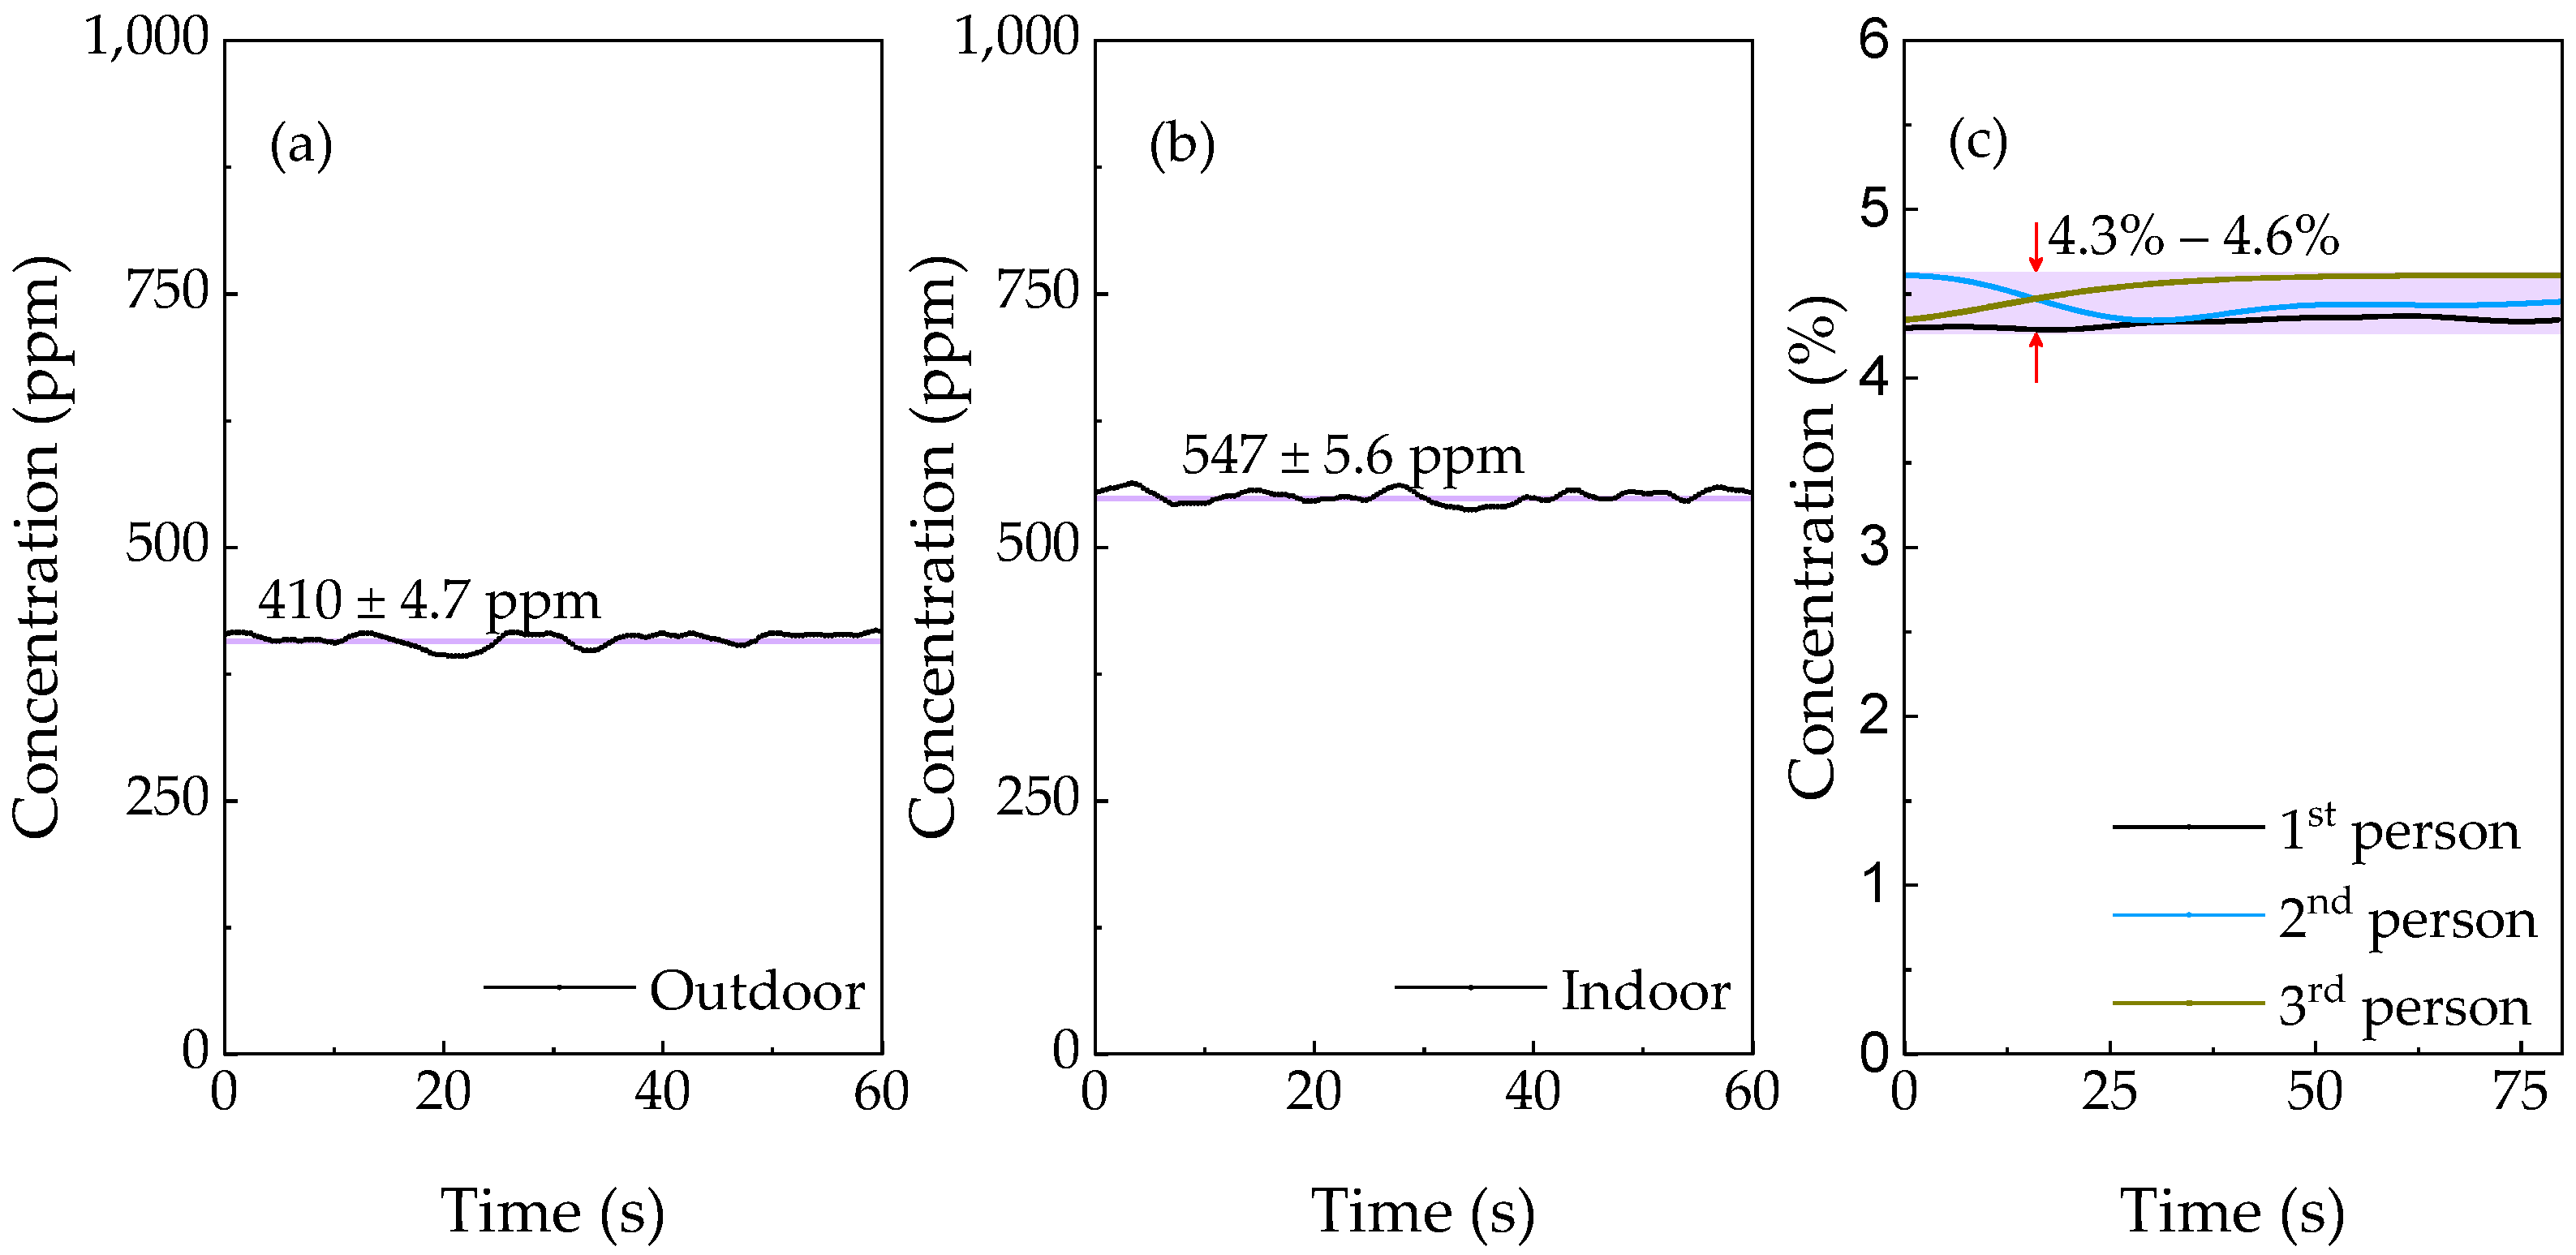
3.5. Field Applications for Atmospheric and Exhaled CO2 Measurement

The field performance of the spectrophone was evaluated by measuring the CO2 level in air (both indoors and outdoors) and exhalations of three researchers, successively. The gas samples were fully dehumidified before each measurement inside the ADM, otherwise CO2 molecular relaxation would be accelerated by the presence of humidity in the gas [13,29], leading to enhanced photoacoustic amplitude, however, at the expense of sensing reliability under an unstable water vapor concentration. The CO2 concentrations are determined using the calibration curve in Figure 6 with the results depicted in Figure 8. The observed outdoor CO2 concentration, 410 ± 4.7 ppm, is in good agreement with global greenhouse gas monitoring [30]. While the indoor CO2 concentration, 547 ± 4.6 ppm is a bit higher, mainly due to the contribution by people working in the laboratory. The observed exhaled CO2 concentrations of three people vary from 4.3 to 4.6%, which lie in a healthy and common range according to a number of breath analysis studies, reviewed in [31].

4. Conclusions

In summary, we have realized a quartz-enhanced spectrophone for rapid CO2 measurement. A custom QTF with a low resonant frequency of 12.5 kHz was used to increase the QEPAS response to the slow-relaxing CO2. A LabVIEW-based servo loop was developed for stable laser operation with its center wavelength variation kept within 0.0002 cm−1. Phase match between successive feedback intervals, as well as the response time limitation of the QTF, was experimentally investigated. Thus, the response time of the QEPAS sensor was enhanced to ~0.5 s for continuous CO2 measurements while maintaining sufficient energy accumulation. Compared with several typical QEPAS-based CO2 measurements, which achieved a detection limit of tens to hundreds ppm [16,18,26], a better detection limit of 7 ppm was achieved, notably with a much faster response time. The system stability was evaluated by performing Allan deviation analysis, achieving a minimum detection limit of 0.45 ppm at an integration time of 270 s. Besides, a linear dynamic range of 6 × 10⁵ was obtained and the implementations for atmospheric and exhaled CO2 measurements, in a field application, were demonstrated. Future work to investigate the details of H2O influence on CO2 measurement with a humidity range from 0 to saturation is planned. The real-time correction will be performed by monitoring H2O concentrations to fully explore the capacity of this integrated quartz enhanced spectrophone for in situ and rapid CO2 measurements in many different fields.

Author Contributions

H.Z.: Conceptualization, Data curation, Writing—Original draft preparation. W.J.: Investigation, Methodology. M.H. (Mengpeng Hu): Investigation, Data curation. M.H. (Mai Hu): Project administration. J.L.: Funding acquisition, Resources. Q.W.: Funding acquisition, Software, Validation, Writing—Review & editing. All authors have read and agreed to the published version of the manuscript.

Funding

This research was supported by the Strategic Priority Research Program of Chinese Academy of Sciences (XDA17040513, XDA22020502), National Natural Science Foundation of China (NSFC) (62005267), Scientific Instrument Developing Project of the Chinese Academy of Sciences (YJKYYQ20190037), and National Key Research and Development Project (2019YFB2006003).

Institutional Review Board Statement

Not applicable.

Informed Consent Statement

Not applicable.

Data Availability Statement

The data that support the plots within this paper are available from the corresponding author on request basis.

Conflicts of Interest

The authors declare no conflict of interest.

Appendix A

Figure A1. Optimization of driving temperature and bias current. (a) DFB laser specification, (b) absorption coefficient simulation for 400 ppm CO2 and 0.5% H2O at 296 K and 1 bar. Driving temperature and bias current were selected as 19 °C and 120 mA, respectively, to target the R(16) line of CO2 at 4989.97 cm−1 [32]. The yellow shadow depicts the modulation range of ~0.31 cm−1.
Sensors 21 05225 g0a1
The laser characteristic of a commercial DFB laser near 2.004 μm is shown in Figure A1a. A spectral range of 4985–4993 cm−1 can be accessed by adjusting the laser temperature (17–33 °C) and the injection current (40–140 mA). As depicted in Figure A1b, the absorption coefficient of 400 ppm CO2 and 0.5% H2O at 296 K and 1 bar are interrogated based on the HITRAN database. Bias current of 120 mA and temperature of 19 °C (labeled as a red circle) were selected to drive this DFB laser, and a modulation range of ~0.31 cm−1 (labeled as yellow shadow) was applied, as well. Therefore, the R(16) line of CO2 with a relatively strong intensity of 1.319 × 10⁻²¹ cm−1·(mol·cm−2)–1 can be interrogated with less spectral overlap interference, and be illuminated by a maximum laser power of about 5 mW, which was calibrated by a power meter after the ADM.

Appendix B

The response curve of the custom QTF was characterized to determine the wavelength modulation frequency. CO2 sample with a concentration of 5000 ppm was pumped into the acoustic detection module (ADM). With the laser wavelength locked to the absorption line, modulation frequency was scanned across half of the expected resonant frequency. The 2f signal data were collected accordingly with the results shown in Figure A2. By performing a Lorentz fitting, the resonant frequency and full width at half-maximum (FWHM) of the resonance curve are calibrated as 12.452 kHz and 2.7 Hz, respectively, which yields Q = 4600. Theoretical intrinsic QTF oscillation limited response time can be hence calculated as 370 ms when the spectrophone is operated at 1 bar and 296 ± 2 K.
Figure A2. Frequency response characteristics of the custom QTF at 1 bar and 296 ± 2 K. The investigation was performed with 5000-ppm CO2/N2 mixture filled into the ADM.
Sensors 21 05225 g0a2

Appendix C

The QEPAS spectrophone response to different modulation currents at a constant CO2 concentration of 1000 ppm (1 bar, 296 ± 2 K) is depicted in Figure A3. Photoacoustic signal amplitude increases with the modulation amplitude, but when the modulation current is higher than 9.4 mA, no further increase can be observed. The QEPAS response is consistent with the simulation result plotted as a red line and the optimized modulation current corresponds to a wavelength modulation depth coefficient of 2.2.
Figure A3. Normalized 2f QEPAS signal as a function of modulation current and simulated QEPAS response as a function of modulation depth coefficient m. In this case, the modulation current of 9.4 mA corresponds to the maximum 2f-QEPAS signal at m = 2.2.
Sensors 21 05225 g0a3

References

  1. Snyder, C.S.; Bruulsema, T.W.; Jensen, T.L.; Fixen, P.E. Review of Greenhouse Gas Emissions from Crop Production Systems and Fertilizer Management Effects. Agric. Ecosyst. Environ. 2009, 133, 247–266. [Google Scholar] [CrossRef]
  2. Wang, Z.; Wang, Q.; Ching, J.Y.-L.; Wu, J.C.-Y.; Zhang, G.; Ren, W. A Portable Low-Power QEPAS-Based CO2 Isotope Sensor Using a Fiber-Coupled Interband Cascade Laser. Sens. Actuators B Chem. 2017, 246, 710–715. [Google Scholar] [CrossRef]
  3. Delli Santi, M.G.; Bartalini, S.; Cancio, P.; Galli, I.; Giusfredi, G.; Haraldsson, C.; Mazzotti, D.; Pesonen, A.; De Natale, P. Biogenic Fraction Determination in Fuel Blends by Laser-Based 14CO2 Detection. Adv. Photonics Res. 2021, 2, 2000069. [Google Scholar] [CrossRef]
  4. Willer, U.; Saraji, M.; Khorsandi, A.; Geiser, P.; Schade, W. Near- and Mid-Infrared Laser Monitoring of Industrial Processes, Environment and Security Applications. Opt. Lasers Eng. 2006, 44, 699–710. [Google Scholar] [CrossRef]
  5. Zhang, H.; Wen, M.; Li, Y.; Wan, P.; Chen, C. High-Precision 13CO2/12CO2 Isotopic Ratio Measurement Using Tunable Diode Laser Absorption Spectroscopy at 4.3 μm for Deep-Sea Natural Gas Hydrate Exploration. Appl. Sci. 2019, 9, 3444. [Google Scholar] [CrossRef] [Green Version]
  6. Bozóki, Z.; Pogány, A.; Szabó, G. Photoacoustic Instruments for Practical Applications: Present, Potentials, and Future Challenges. Appl. Spectrosc. Rev. 2011, 46, 1–37. [Google Scholar] [CrossRef]
  7. Hodgkinson, J.; Tatam, R.P. Optical Gas Sensing: A Review. Meas. Sci. Technol. 2013, 24, 012004. [Google Scholar] [CrossRef] [Green Version]
  8. Palzer, S. Photoacoustic-Based Gas Sensing: A Review. Sensors 2020, 20, 2745. [Google Scholar] [CrossRef]
  9. Patimisco, P.; Sampaolo, A.; Dong, L.; Tittel, F.K.; Spagnolo, V. Recent Advances in Quartz Enhanced Photoacoustic Sensing. Appl. Phys. Rev. 2018, 5, 011106. [Google Scholar] [CrossRef]
  10. Ma, Y. Recent Advances in QEPAS and QEPTS Based Trace Gas Sensing: A Review. Front. Phys. 2020, 8, 268. [Google Scholar] [CrossRef]
  11. Kosterev, A.A.; Bakhirkin, Y.A.; Curl, R.F.; Tittel, F.K. Quartz-Enhanced Photoacoustic Spectroscopy. Opt. Lett. 2002, 27, 1902. [Google Scholar] [CrossRef] [Green Version]
  12. Borri, S.; Patimisco, P.; Galli, I.; Mazzotti, D.; Giusfredi, G.; Akikusa, N.; Yamanishi, M.; Scamarcio, G.; De Natale, P.; Spagnolo, V. Intracavity Quartz-Enhanced Photoacoustic Sensor. Appl. Phys. Lett. 2014, 104, 91114. [Google Scholar] [CrossRef]
  13. Wysocki, G.; Kosterev, A.A.; Tittel, F.K. Influence of Molecular Relaxation Dynamics on Quartz-Enhanced Photoacoustic Detection of CO2 at λ =2 μm. Appl. Phys. B 2006, 85, 301–306. [Google Scholar] [CrossRef]
  14. Rück, T.; Bierl, R.; Matysik, F.-M. NO2 Trace Gas Monitoring in Air Using Off-Beam Quartz Enhanced Photoacoustic Spectroscopy (QEPAS) and Interference Studies towards CO2, H2O and Acoustic Noise. Sens. Actuators B Chem. 2018, 255, 2462–2471. [Google Scholar] [CrossRef]
  15. Lewicki, R.; Wysocki, G.; Kosterev, A.A.; Tittel, F.K. Carbon Dioxide and Ammonia Detection Using 2 μm Diode Laser Based Quartz-Enhanced Photoacoustic Spectroscopy. Appl. Phys. B 2007, 87, 157–162. [Google Scholar] [CrossRef]
  16. Zheng, H.; Liu, Y.; Lin, H.; Kan, R.; Dong, L.; Zhu, W.; Fang, J.; Yu, J.; Tittel, F.K.; Chen, Z. Quartz-Enhanced Photoacoustic Spectroscopy Exploiting a Fast and Wideband Electro-Mechanical Light Modulator. Opt. Express 2020, 28, 27966. [Google Scholar] [CrossRef]
  17. Yang, G.; Xu, L.; Liang, H.; Li, J. Quartz-Tuning-Fork-Enhanced Spectroscopy Based on Fast Fourier Transform Algorithm. Front. Phys. 2020, 8, 582503. [Google Scholar] [CrossRef]
  18. Xu, L.; Zhou, S.; Liu, N.; Zhang, M.; Liang, J.; Li, J. Multigas Sensing Technique Based on Quartz Crystal Tuning Fork-Enhanced Laser Spectroscopy. Anal. Chem. 2020, 92, 14153–14163. [Google Scholar] [CrossRef] [PubMed]
  19. Dello Russo, S.; Sampaolo, A.; Patimisco, P.; Menduni, G.; Giglio, M.; Hoelzl, C.; Passaro, V.M.N.; Wu, H.; Dong, L.; Spagnolo, V. Quartz-Enhanced Photoacoustic Spectroscopy Exploiting Low-Frequency Tuning Forks as a Tool to Measure the Vibrational Relaxation Rate in Gas Species. Photoacoustics 2021, 21, 100227. [Google Scholar] [CrossRef] [PubMed]
  20. Borri, S.; Patimisco, P.; Sampaolo, A.; Beere, H.E.; Ritchie, D.A.; Vitiello, M.S.; Scamarcio, G.; Spagnolo, V. Terahertz Quartz Enhanced Photo-Acoustic Sensor. Appl. Phys. Lett. 2013, 103, 021105. [Google Scholar] [CrossRef]
  21. Patimisco, P.; Sampaolo, A.; Dong, L.; Giglio, M.; Scamarcio, G.; Tittel, F.K.; Spagnolo, V. Analysis of the Electro-Elastic Properties of Custom Quartz Tuning Forks for Optoacoustic Gas Sensing. Sens. Actuators B Chem. 2016, 227, 539–546. [Google Scholar] [CrossRef]
  22. Kosterev, A.A.; Buerki, P.R.; Dong, L.; Reed, M.; Day, T.; Tittel, F.K. QEPAS Detector for Rapid Spectral Measurements. Appl. Phys. B 2010, 100, 173–180. [Google Scholar] [CrossRef]
  23. Wang, Q.; Wang, Z.; Ren, W. Wavelength-Stabilization-Based Photoacoustic Spectroscopy for Methane Detection. Meas. Sci. Technol. 2017, 28, 065102. [Google Scholar] [CrossRef]
  24. Wang, Z.; Yang, M.; Fu, L.; Chen, C.; You, R.; Ren, W. Rapid Field Measurement of Ventilation Rate Using a Quartz-Enhanced Photoacoustic SF6 Gas Sensor. Meas. Sci. Technol. 2020, 31, 085105. [Google Scholar] [CrossRef]
  25. Wang, Z.; Chang, J.; Yu, H.; Tian, C.; Zhang, H.; Zhang, X.; Tang, L.; Zhang, Q.; Feng, Y. Multi-Component and Multi-Point Trace Gas Sensing in Wavelength Modulation Spectroscopy Based on Wavelength Stabilization. Photonic Sens. 2019, 9, 376–387. [Google Scholar] [CrossRef] [Green Version]
  26. Patimisco, P.; Scamarcio, G.; Tittel, F.; Spagnolo, V. Quartz-Enhanced Photoacoustic Spectroscopy: A Review. Sensors 2014, 14, 6165–6206. [Google Scholar] [CrossRef] [PubMed] [Green Version]
  27. Wu, H.; Dong, L.; Zheng, H.; Yu, Y.; Ma, W.; Zhang, L.; Yin, W.; Xiao, L.; Jia, S.; Tittel, F.K. Beat frequency quartz-enhanced photoacoustic spectroscopy for fast and calibration-free continuous trace-gas monitoring. Nat. Commun. 2017, 8, 15331. [Google Scholar] [CrossRef] [Green Version]
  28. Li, J.; Durry, G.; Cousin, J.; Joly, L.; Parvitte, B.; Zeninari, V. Self-Induced Pressure Shift and Temperature Dependence Measurements of CO2 at 2.05μm with a Tunable Diode Laser Spectrometer. Spectrochim. Acta A. Mol. Biomol. Spectrosc. 2012, 85, 74–78. [Google Scholar] [CrossRef]
  29. Wu, H.; Dong, L.; Yin, X.; Sampaolo, A.; Patimisco, P.; Ma, W.; Zhang, L.; Yin, W.; Xiao, L.; Spagnolo, V. Atmospheric CH4 measurement near a landfill using an ICL-based QEPAS sensor with V-T relaxation self-calibration. Sens. Actuators B Chem. 2019, 297, 126753. [Google Scholar] [CrossRef]
  30. US Department of Commerce, N. Global Monitoring Laboratory—Carbon Cycle Greenhouse Gases. Available online: https://gml.noaa.gov/ccgg/ (accessed on 20 February 2021).
  31. Wang, C.; Sahay, P. Breath Analysis Using Laser Spectroscopic Techniques: Breath Biomarkers, Spectral Fingerprints, and Detection Limits. Sensors 2009, 9, 8230–8262. [Google Scholar] [CrossRef]
  32. Gordon, I.E.; Rothman, L.S.; Hill, C.; Kochanov, R.V.; Tan, Y.; Bernath, P.F.; Birk, M.; Boudon, V.; Campargue, A.; Chance, K.V.; et al. The HITRAN2016 molecular spectroscopic database. J. Quant. Spectrosc. Radiat. Transf. 2017, 203, 3–69. [Google Scholar] [CrossRef]
Figure 1. Line-locked quartz enhanced spectrophone. BS: beam splitter; FC: fiber collimator; L1 and L2: mode-matching lens; RC: reference chamber; PD: photoelectric detector; DAQ: data acquisition card; ADM: acoustic detection module.
Sensors 21 05225 g001
Figure 2. Right part: Flow chart for line-locked process based on a LabVIEW platform. Offset: a preset bias current corresponding to a wavelength near the absorption line; f0: resonant frequency of the custom QTF. Left part: Feedback interval ΔT should be selected as an integer multiple of the QTF oscillation period, thus phase matching between successive modulation periods I and II can be maintained for continuous measurement without counteraction.
Sensors 21 05225 g002
Figure 3. Real-time QTF oscillation response to a periodic stimulation. The stimulation was generated by applying driving current with and without modulation on the laser, successively. The repeat frequency was 0.2 Hz, in which the 2.5-s period without modulation was long enough for oscillation release prior to the following stimulation. Response time, from 0 to 100% oscillation, was determined to be 0.5 s.
Sensors 21 05225 g003
Figure 4. QEPAS response curves to feedback intervals around 0.05 s, 0.1 s, 0.5 s, 1.3 s, and 3.3 s respectively. The experiment was performed with 1000-ppm CO2 enclosed inside the ADM.
Sensors 21 05225 g004
Figure 5. (a) 3f amplitude of reference chamber under both laser wavelength slowly scanned mode and tightly locked mode. (b) Stable laser operation with its wavelength variation kept within 0.0002 cm−1 over 6000 s, meanwhile, a feedback interval of 0.50514 s was chosen.
Sensors 21 05225 g005
Figure 6. Linearity of the QEPAS 2f signal as a function of CO2 concentration at 1 bar and 296 ± 2 K. The linear fitting yields an R-square value of 0.9985 from 10 ppm to 30%.
Sensors 21 05225 g006
Figure 7. Allan deviation plot in ppm of the quartz enhanced spectrophone as a function of integration time. In the evaluation, basic parameters are analysis time, 140 min; detection bandwidth, 1 Hz; flow rate, 200 mL/min.
Sensors 21 05225 g007
Figure 8. CO2 measurements of (a) outdoor and (b) indoor air, and (c) expirations of three people.
Sensors 21 05225 g008
Publisher’s Note: MDPI stays neutral with regard to jurisdictional claims in published maps and institutional affiliations.

