
Development of an Intelligent Data-Driven System to Recommend Personalized Fashion Design Solutions

 ,
, 
Abstract
:1. Introduction
- Content-based filtering (CBF): The CBF technique parses an item’s description set to analyze the user’s profile by matching the mentioned description set into their profile. Previously, authors have developed the clothing recommendation model by analyzing the content based image and fashion keyword library for providing best out of garment knowledge base [5,6,7].
- Collaborative filtering (CF): Recommendations are usually generated by evaluating previous feedback so that set of similar users and items can be identified. Authors have applied the CF filtering technique to build fashion awareness personalized ranking function by evaluating user’s feedback [8,9]. Another system where an author presented the visually-aware recommendation system based on the implicit feedback and visual signals in the system like product images is linked to the recommendation task to improve the system by providing the matching styles of garments [10].
- Hybrid filtering (HF): Two or more filtering techniques are utilized to combine their benefits. The HF technique has been widely used in e-shopping platforms. Furthermore, HF resolves the well-known problem of cold-start, content over specialization of collaborative, and content-based filtering systems [11,12]. Further, in the literature, an advanced hybrid recommendation system where the authors of [13] presented a Dual hybrid recommendation systems that involved user ratings and user/item features being combined to generate the recommendation.
- Social media-based recommendation system: In addition to the traditional filtering techniques, social media-based recommendation systems have been developed by tracking the user’s implicit interaction over the social media platforms. Authors have mentioned in the literature that such systems bind the social networking activities with the user’s historical data and generates more accurate, trending, and useful suggestions [14,15]. Previous research work has clearly shown the integration of similar social media activities of users have the similar tendency to choose the items [16] and such system helps to track down the wearing habits of community.
- Design-oriented recommendation system: The existing literature has also shown many fashion design-oriented personalized recommendation systems. The authors of [17] developed a system to create the apparel item set by evaluating the attribute coordination of a different set of apparels based on a knowledge base using the Takagi–Sugeno fuzzy neural network (TSFNN), solving an inevitable decision-making problem. Another system used a interactive genetic algorithm-based design model to give functionality to the users to sketch their apparel with a user-friendly interface, enhancing the ease of designing own clothes without dealing with the garment pattern’s complicated parameters [18].
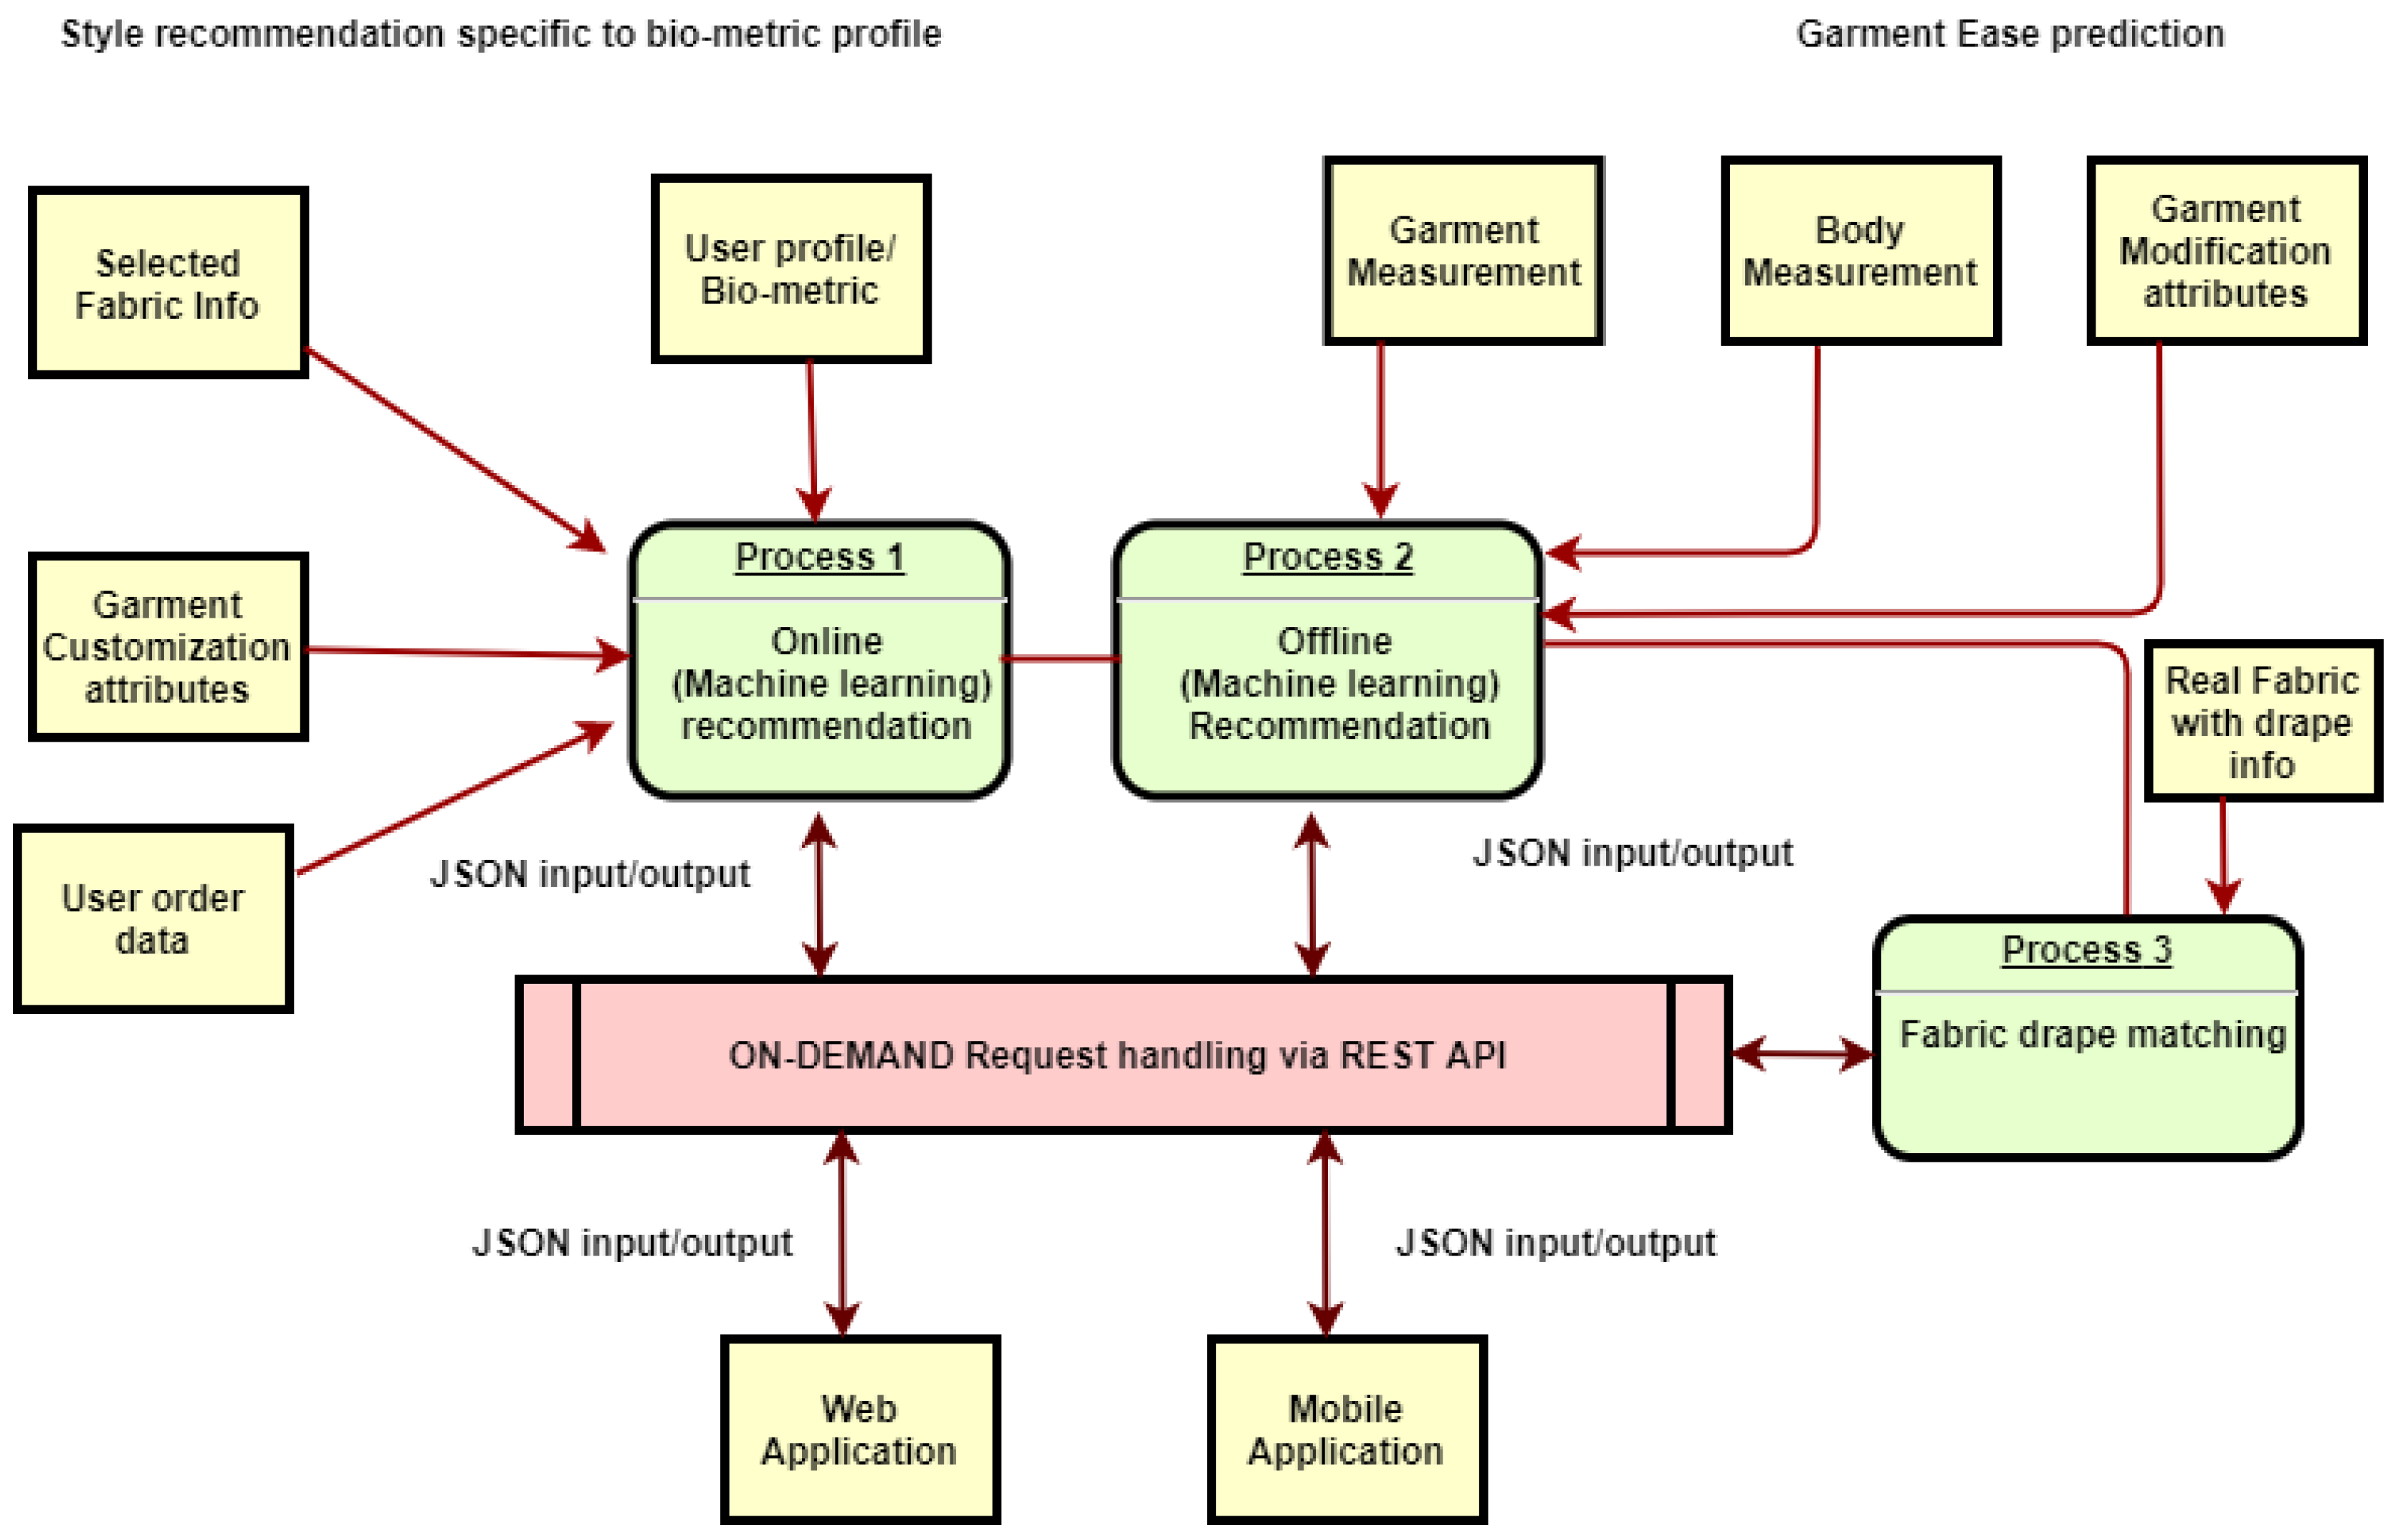
- The current designing tools or digital platforms are usually separated from each other because of their separate user base, i.e., some digital tools, like 3D computer-aided design (CAD), are only for designers and web-based design tools are for garment buyers. A lack of integration between these user bases hinders the efficiency of these tools in the whole design and manufacturing processes.
- Being a traditional industrial sector, much professional knowledge related to fashion products like technicality behind the design of product, designer’s experience, and perception plays a key role in fashion industry. However, this knowledge is rarely involved in the current computational tools where the garment buyer is the common user base.
- The relationship between different factors, especially between human perception on the finished product and technical parameters, is usually complex and cannot be mastered easily.
- User (garment buyers) knowledge base integration with a design knowledge base (professional designer’s activity).
- 3D ease knowledge base integration with 3D CAD tool using the proposed service architecture.
- Adjustment of proposed design solution based on the feedback from 3D garment fitting evaluation, in order to generate personalized design solution.
- Existing fashion recommendation systems where most of the solutions work with either the design elements, fitting, or ease preferences according to the garment buyers or professional designers, the proposed system originally combines these three factors of garment design process (design elements, fitting, and ease) preferences according to the professional designers as well as garment buyers’ point of view. This system easily enables more complete design solution where garment buyers and designers can easily evaluate the product and their preferences can be saved into system.
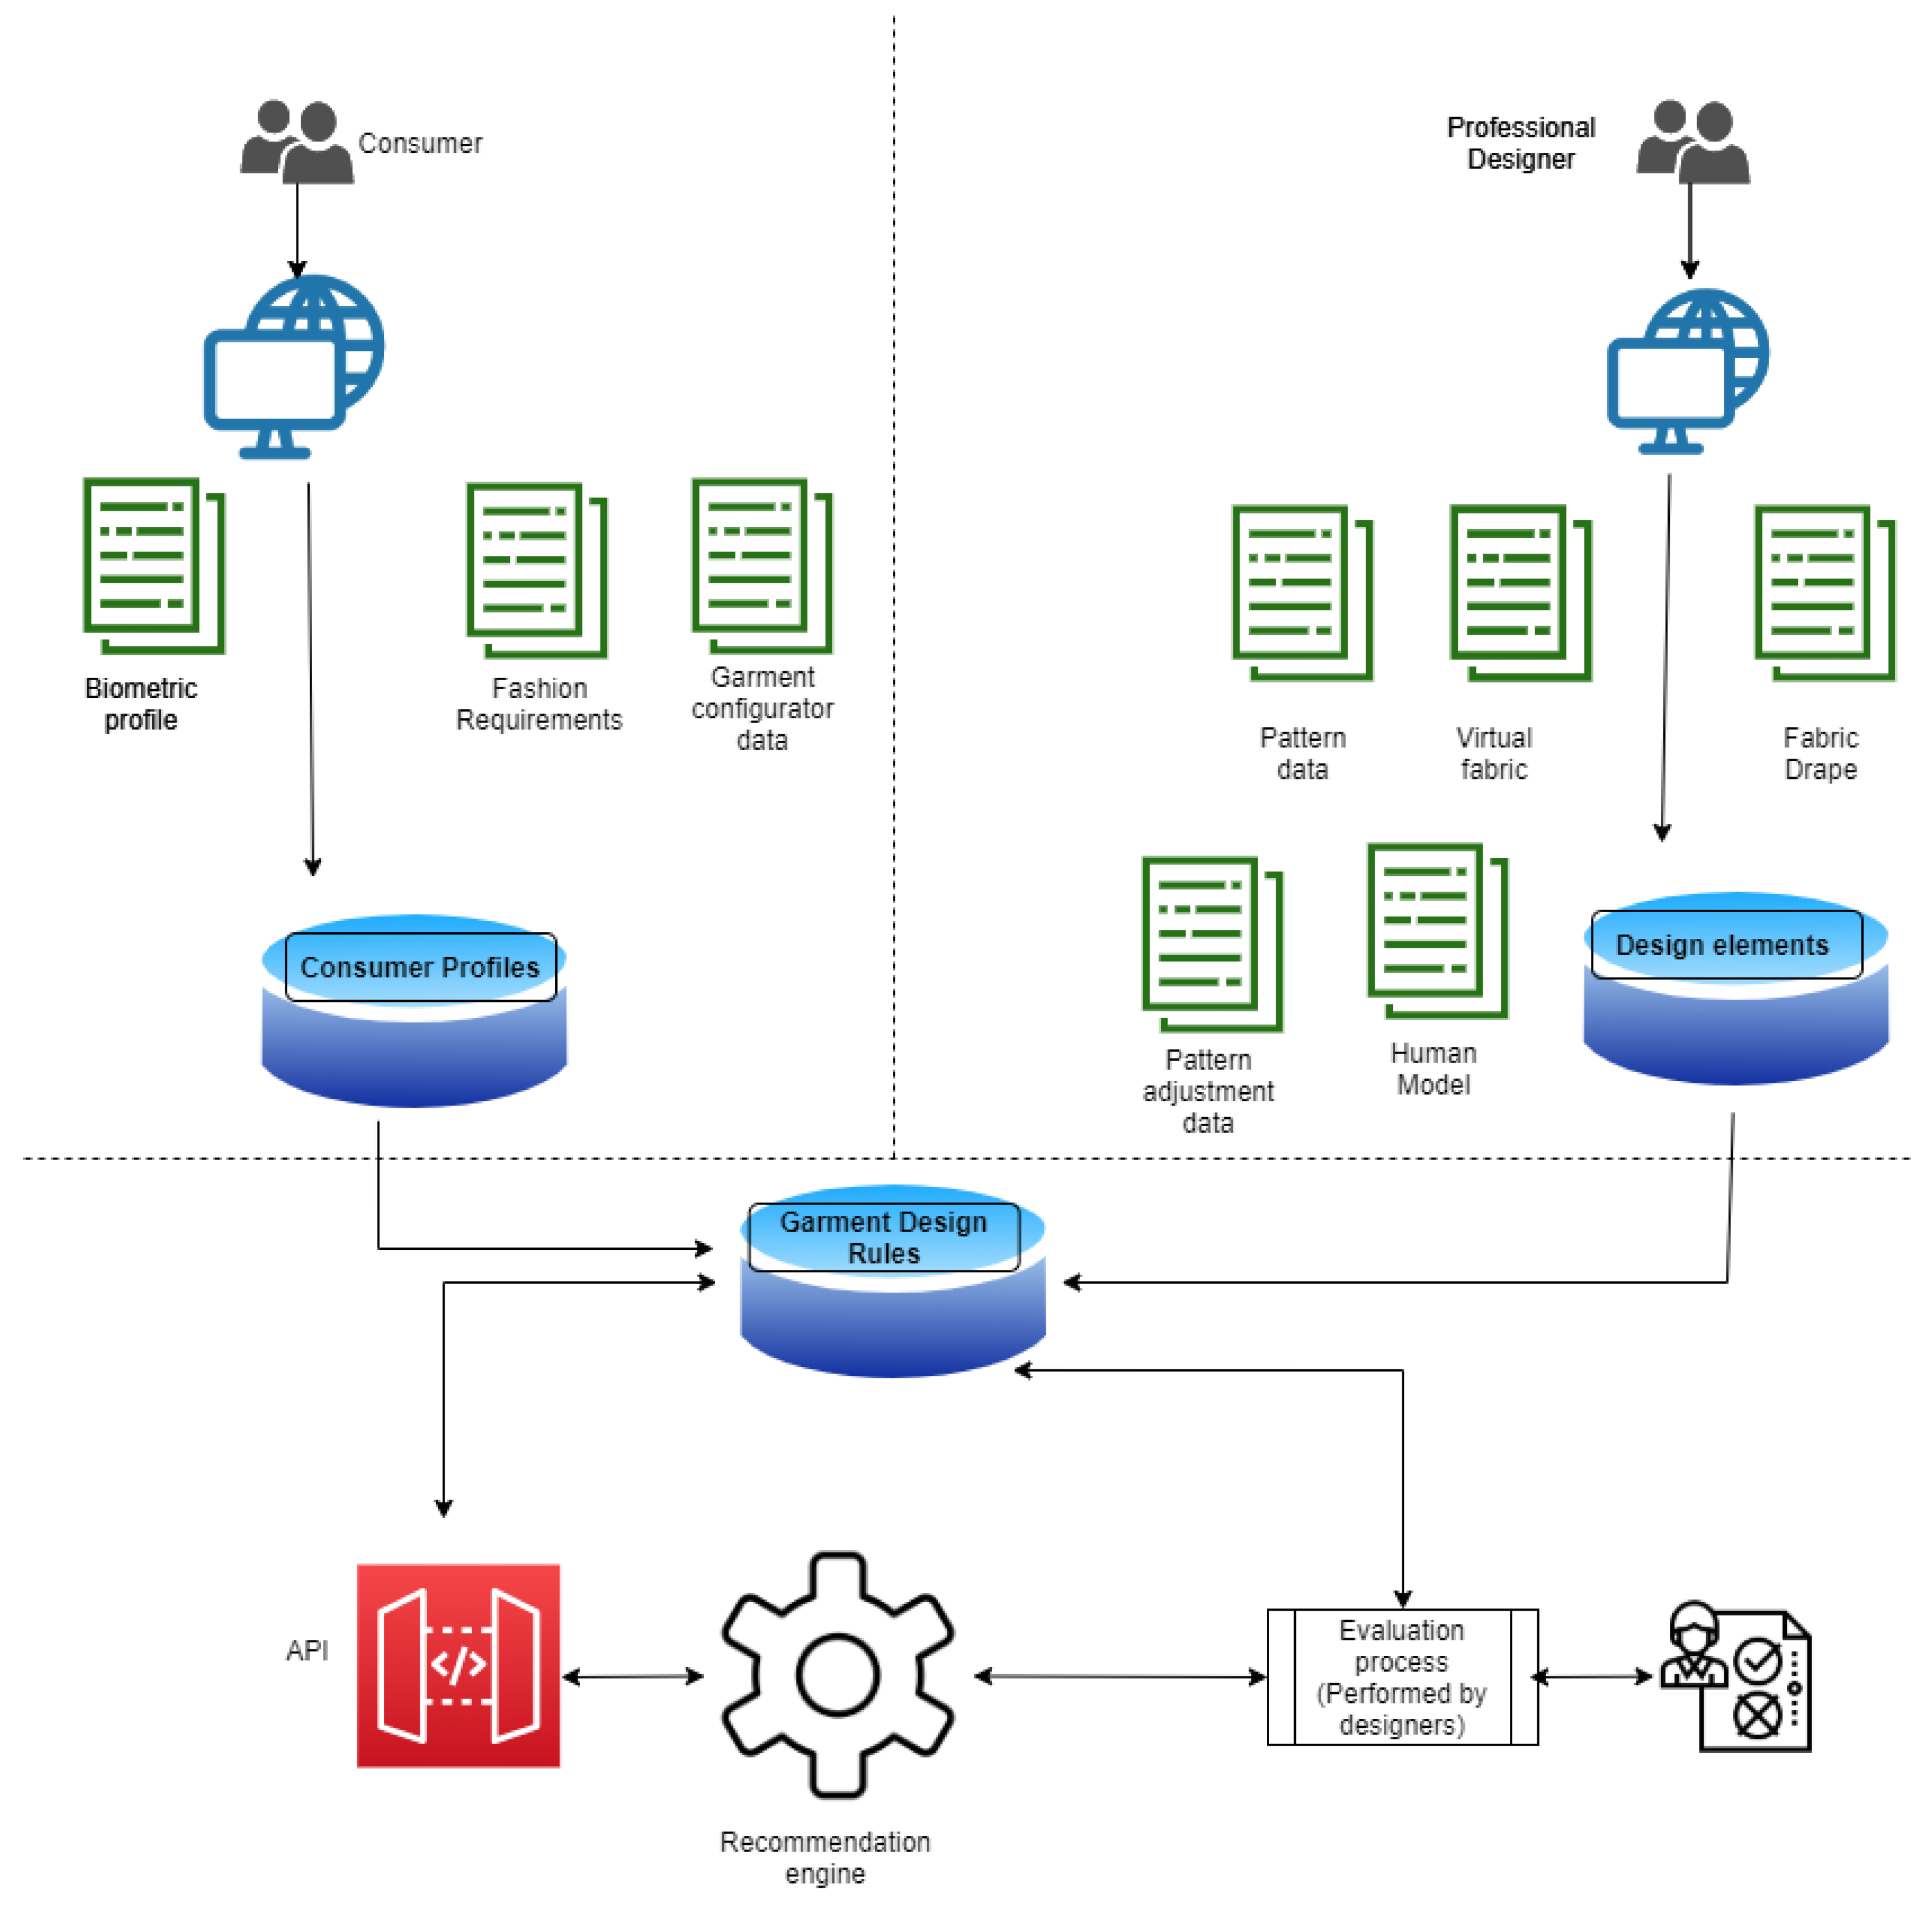
2. Garment Design Knowledge Base Creation
- Consumer profile dataset (biometric parameters related to customized garment, fashion requirements, and garment configurator data related to garment types to be selected by consumers).
- Garment design process dataset (garment patterns, parameters of real and virtual (digital) fabrics with various colors, 3D human models adapted to the target population, and pattern adjustment parameters).
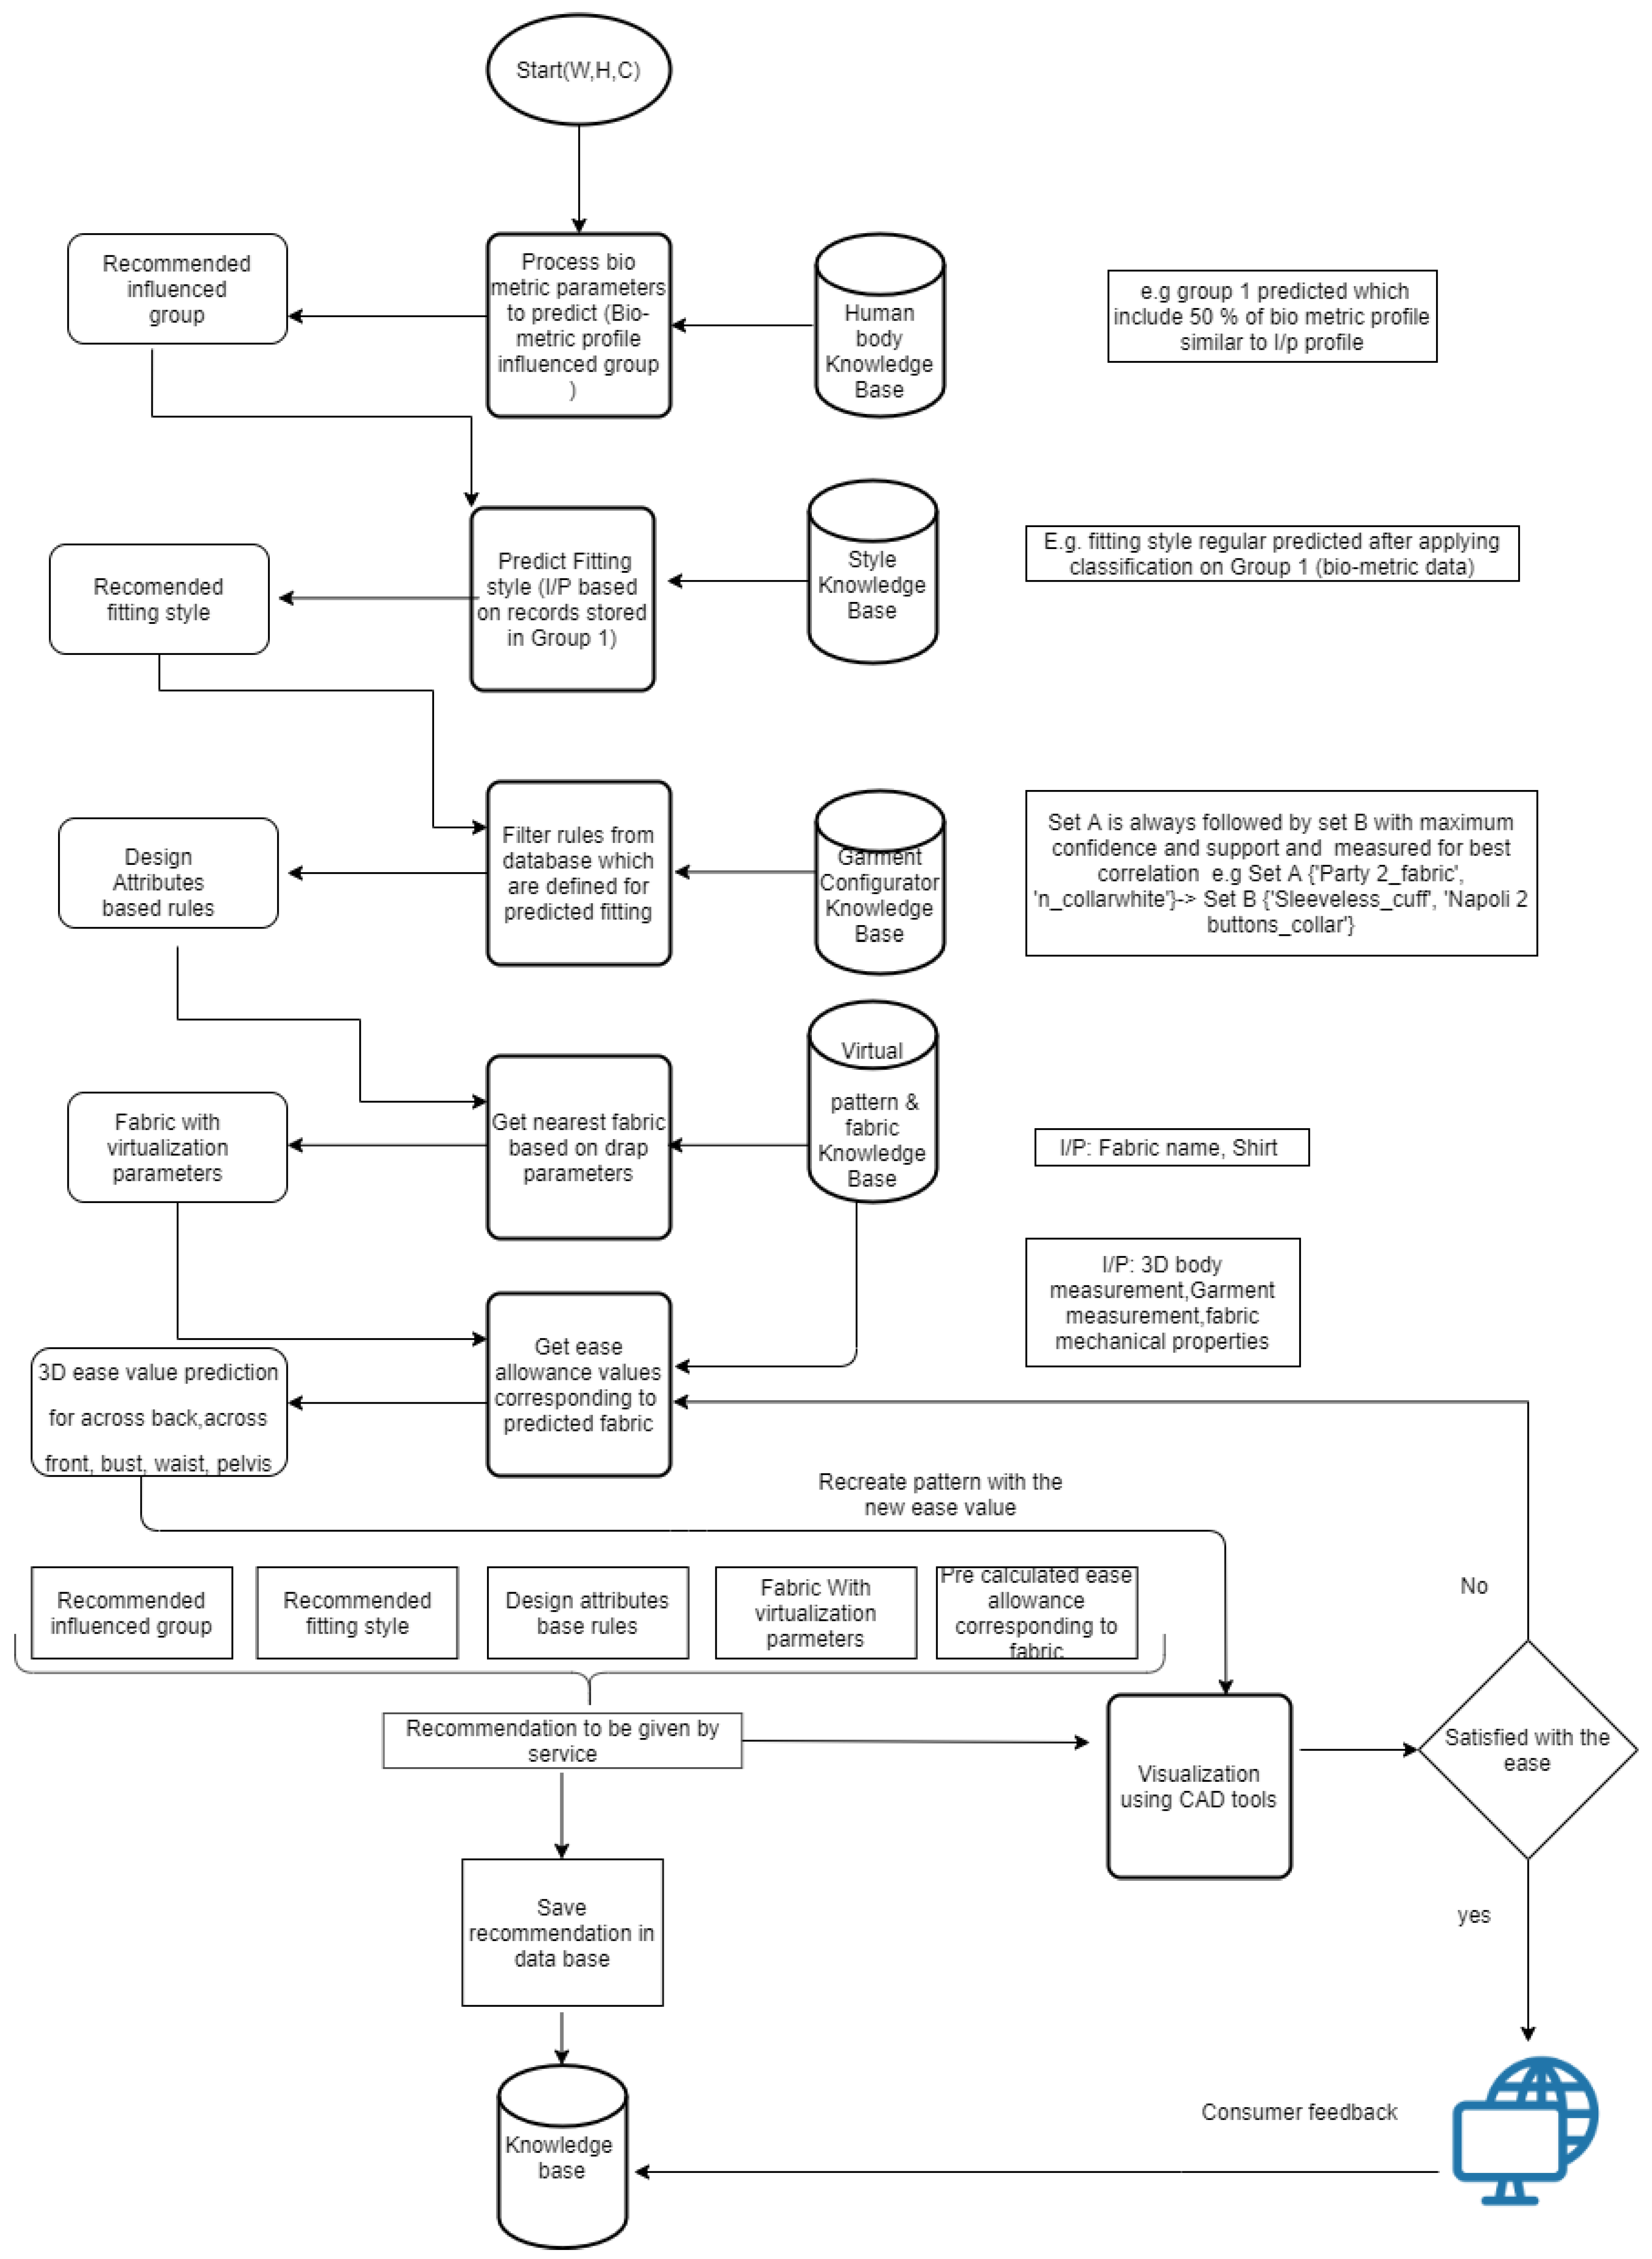
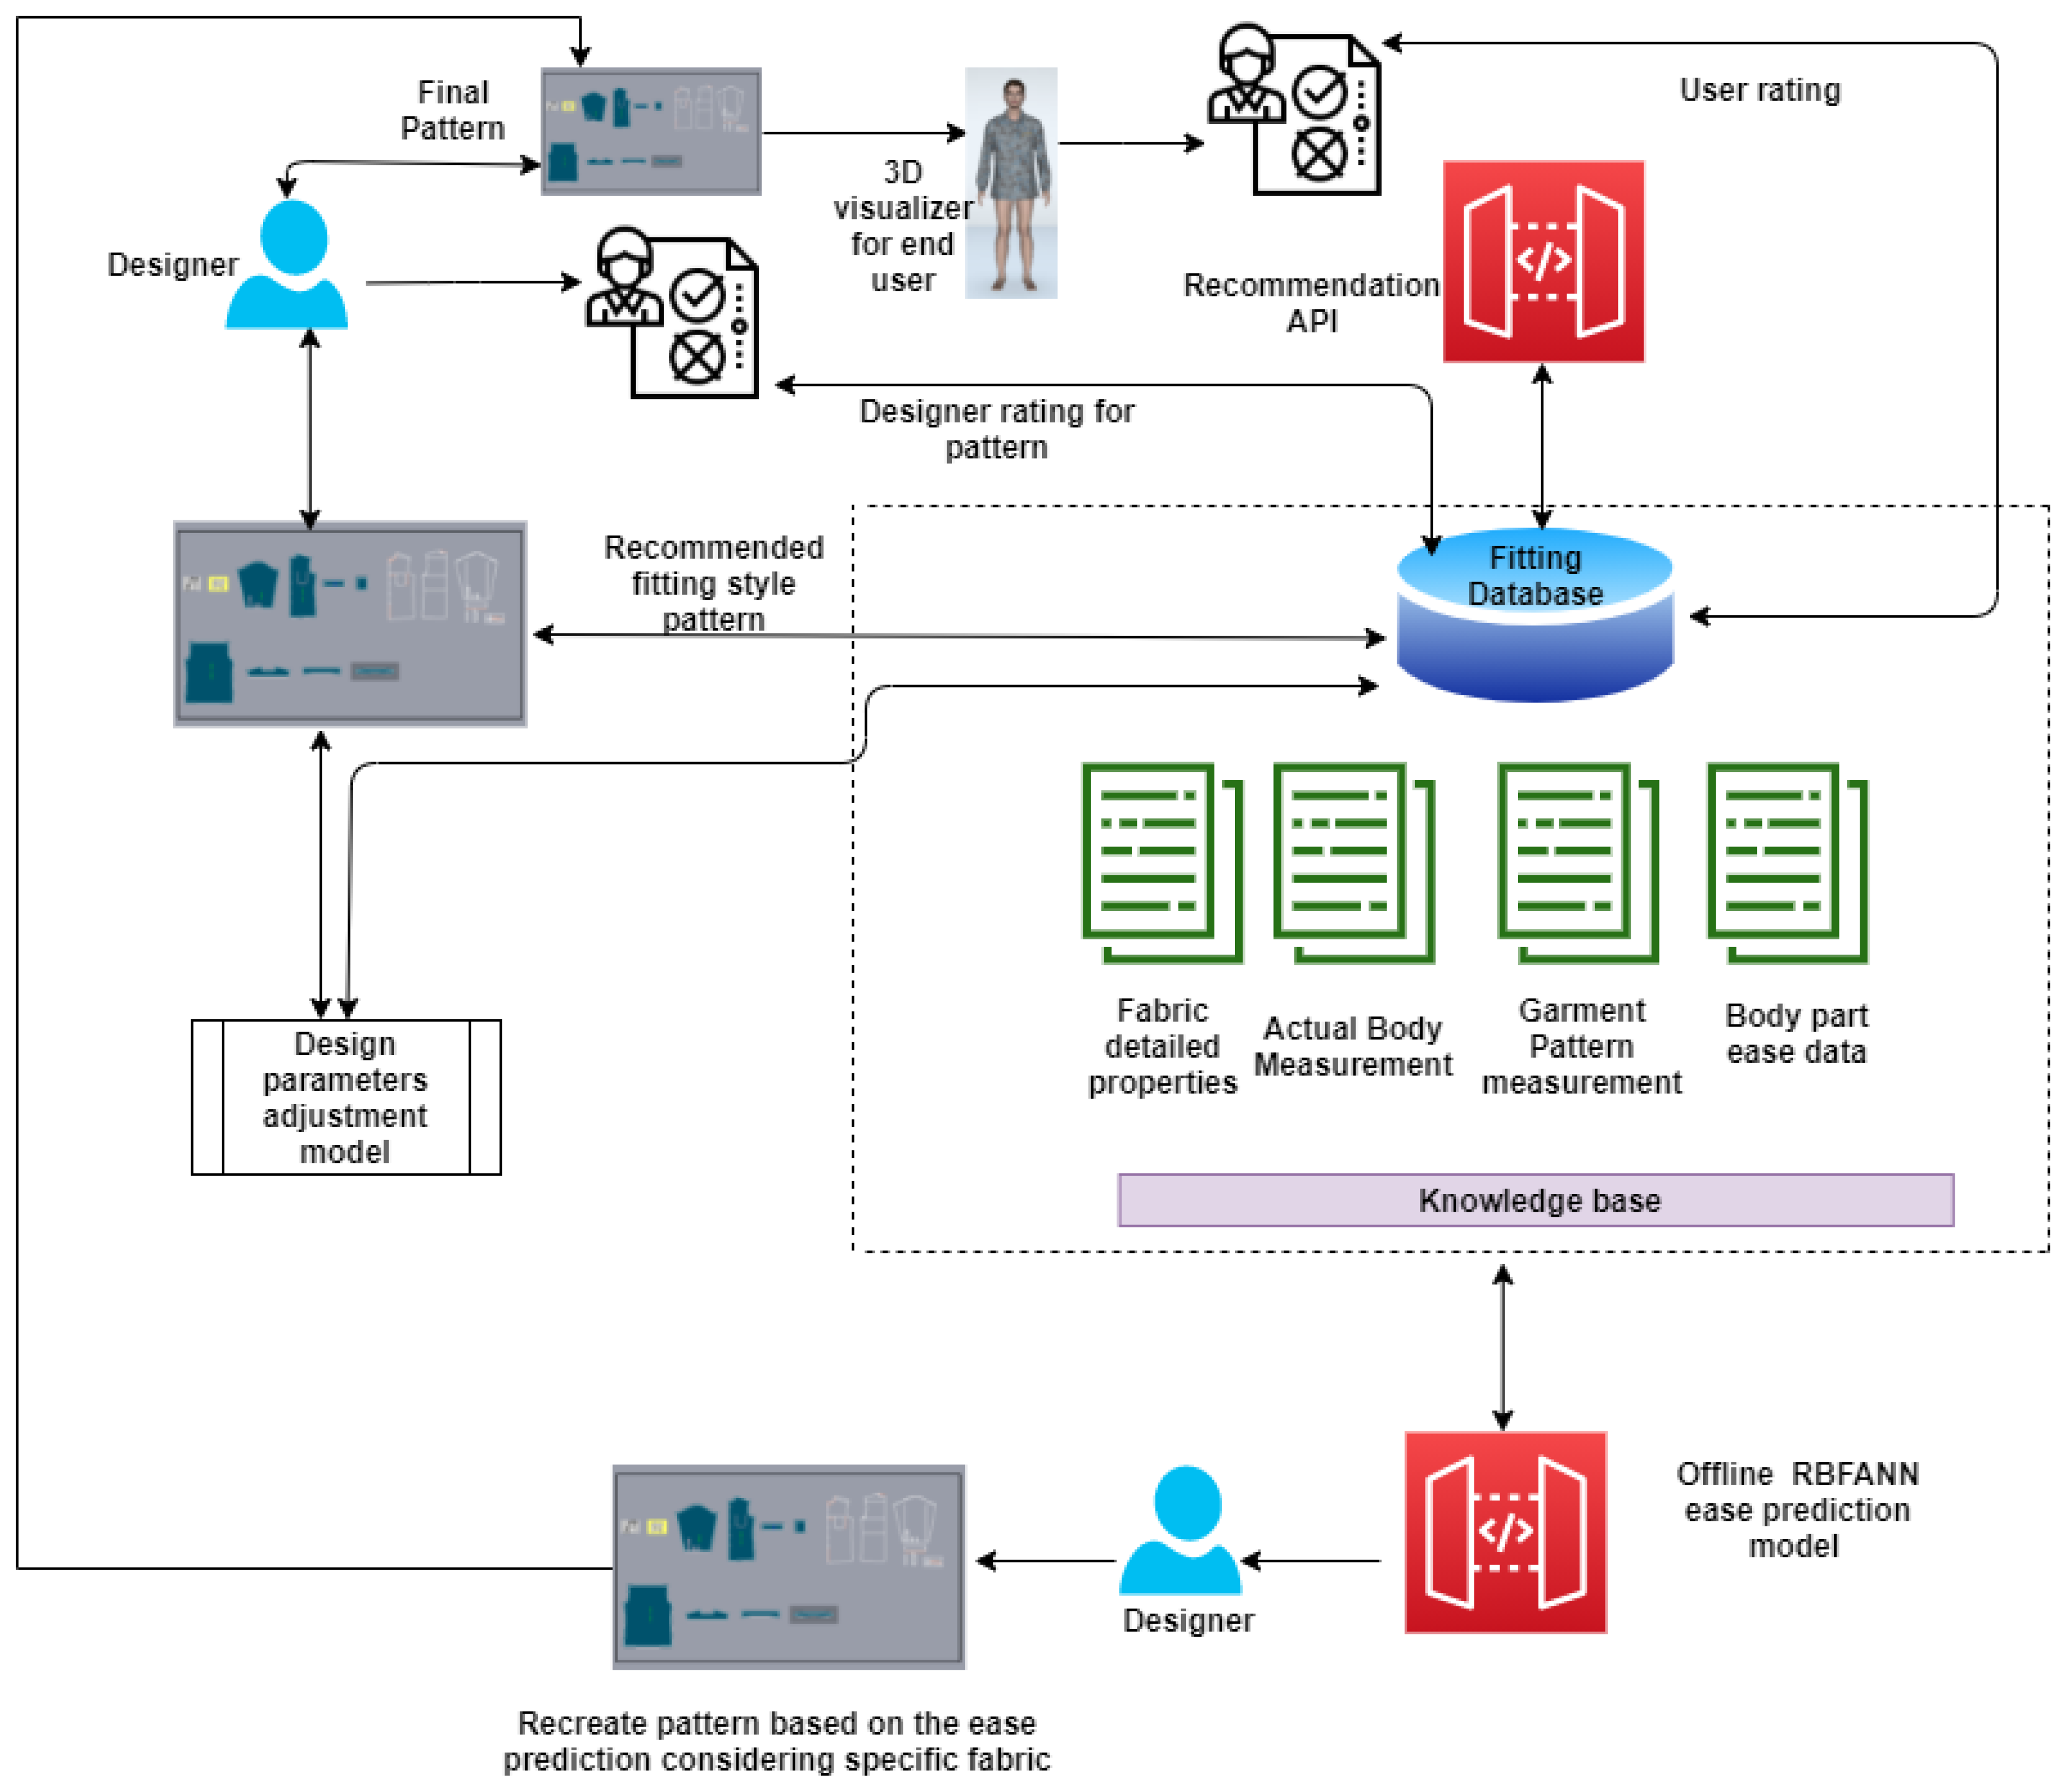
3. Flow Chart of Proposed Data-Driven Interactive Design System Architecture
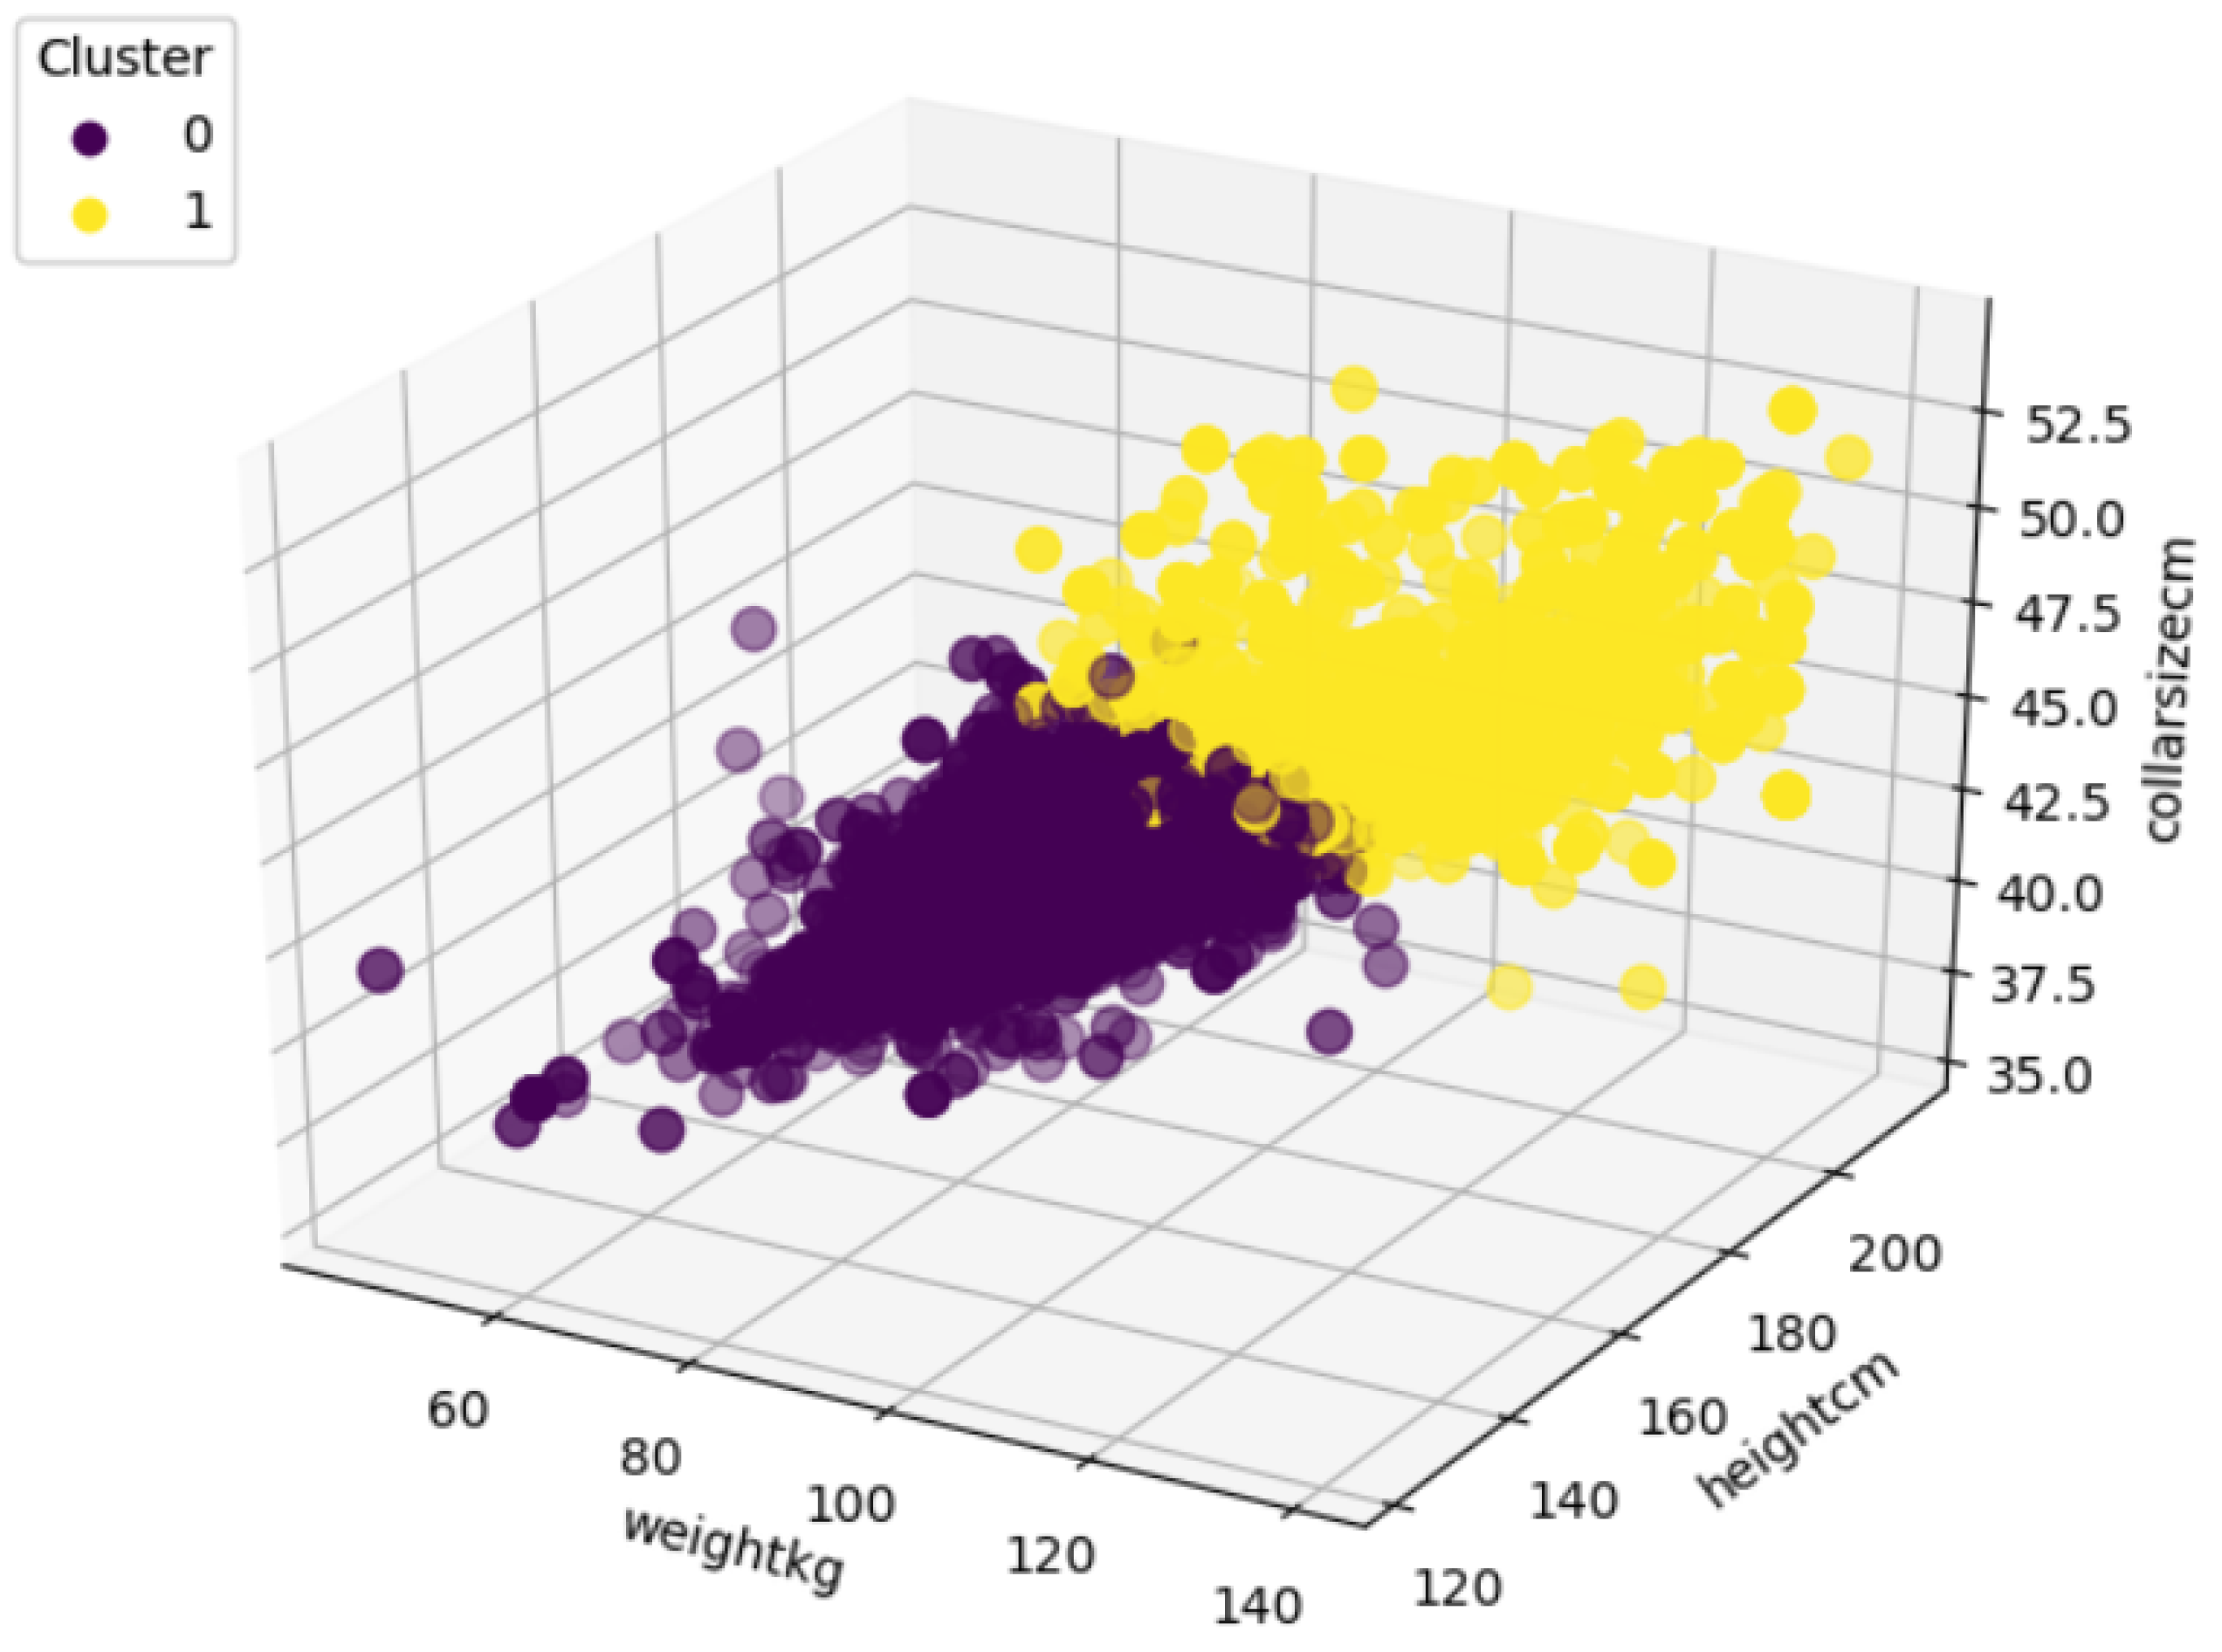
- Prediction of most relevant body shape group based on the user’s biometric profile. The similarity was found using the incremental clustering BIRCH algorithm.
- Prediction of the most relevant garment fitting style adapted to the identified human model, which is related to body measurements. Incremental classification model trained using adaptive random forest classifier to get the prediction.
- Identification of the most relevant garment style attribute combinations by filtering the association rules knowledge base. The association rule knowledge base has been created using the FP-growth algorithm.
- Identification of the most relevant fabric by finding the similarity between the drape image profile of real fabric and existing virtual fabric library, which is associated with the 3D CAD tool and Kd-tree algorithm has been utilized to find the nearest fabric from the existing knowledge base. This module will help to build insight in advance for manufactures and designers to judge new fabric’s performance based on its similarity with the existing similar fabric’s performance.
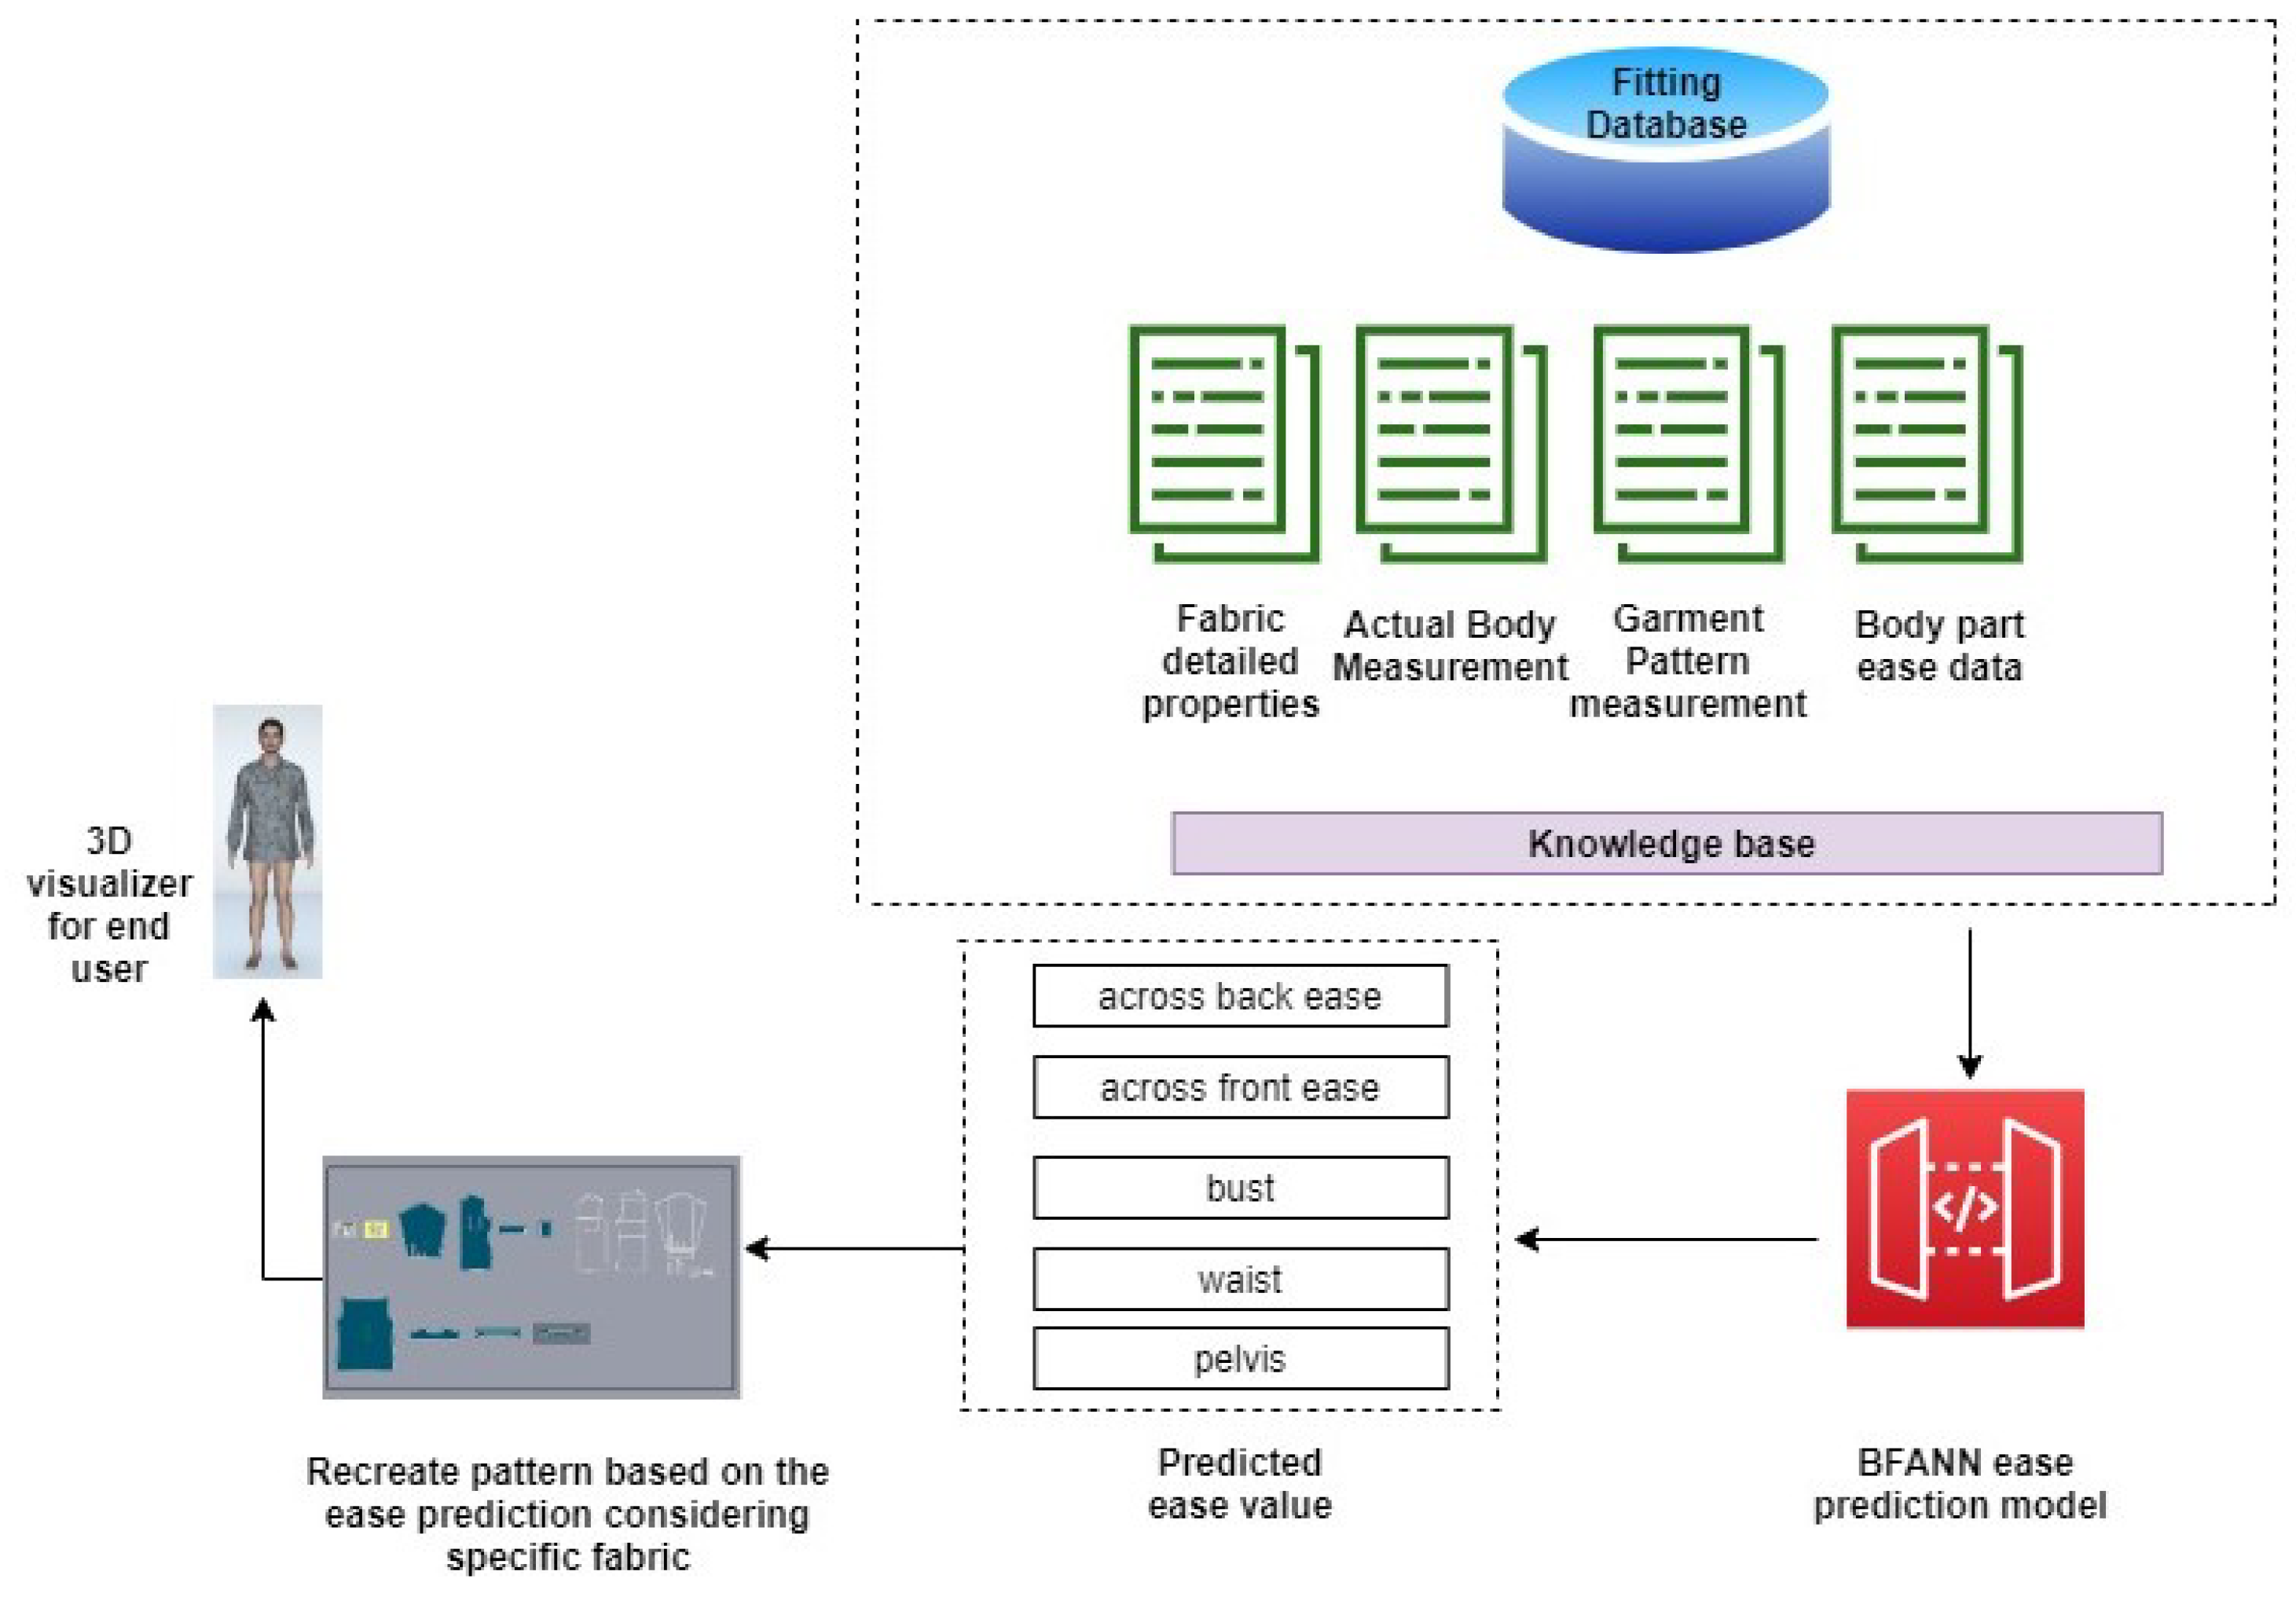
- Radial basis function neural network (RBFNN) has been utilized to build the 3D ease prediction model, which is trained over the body measurements, shirt pattern measurements, and fabric mechanical properties. This module will help the new designers to recreate the new shirt pattern.
4. Modeling of Data-Driven Interactive Design System
4.1. First Step: Prediction Model to Find Most Relevant Biometric Profile
4.1.1. Balanced Iterative Reducing and Clustering Using Hierarchies Clustering Theory
- Build the CF Tree: The first step is building the CF Tree and loading data into a cluster feature tree (CF Tree). The CF Tree represents or keeps data in a compressed form in memory. The BIRCH algorithm becomes highly efficient by using summary statistics for minimizing large data sets. The CF Tree is built with CFs and each CF is composed of three summary statistics [19]:
- -
- The N represents the number of data points in the cluster where i = 1, 2, …, N.
- -
- The linear sum is the sum of individual data points and helps to measure the location of the cluster where is a cluster.
- -
- The squared sum is the sum of squared data points and helps to measure the spread of the cluster, where is a cluster.
A cluster feature tree is a tree structure composed of CFs. A CF tree represents a compressed form of data, preserving any structure in the data. A CF tree has the following parameters:- -
- Branching Factor B. It determines the maximum children allowed for a non-leaf node.
- -
- Threshold. It gives the upper limit to the radius of a cluster in a leaf node.
- -
- Number of Entities in a leaf Node L.
- Global Clustering: The second step is clustering the sub-clusters. After the creation of the CF Tree, the existing clustering algorithm on the CF Tree Leaf nodes(sub-clusters) is applied to combine sub-cluster into clusters.
4.1.2. Building Prediction Model by Applying BIRCH Incremental Clustering Algorithm
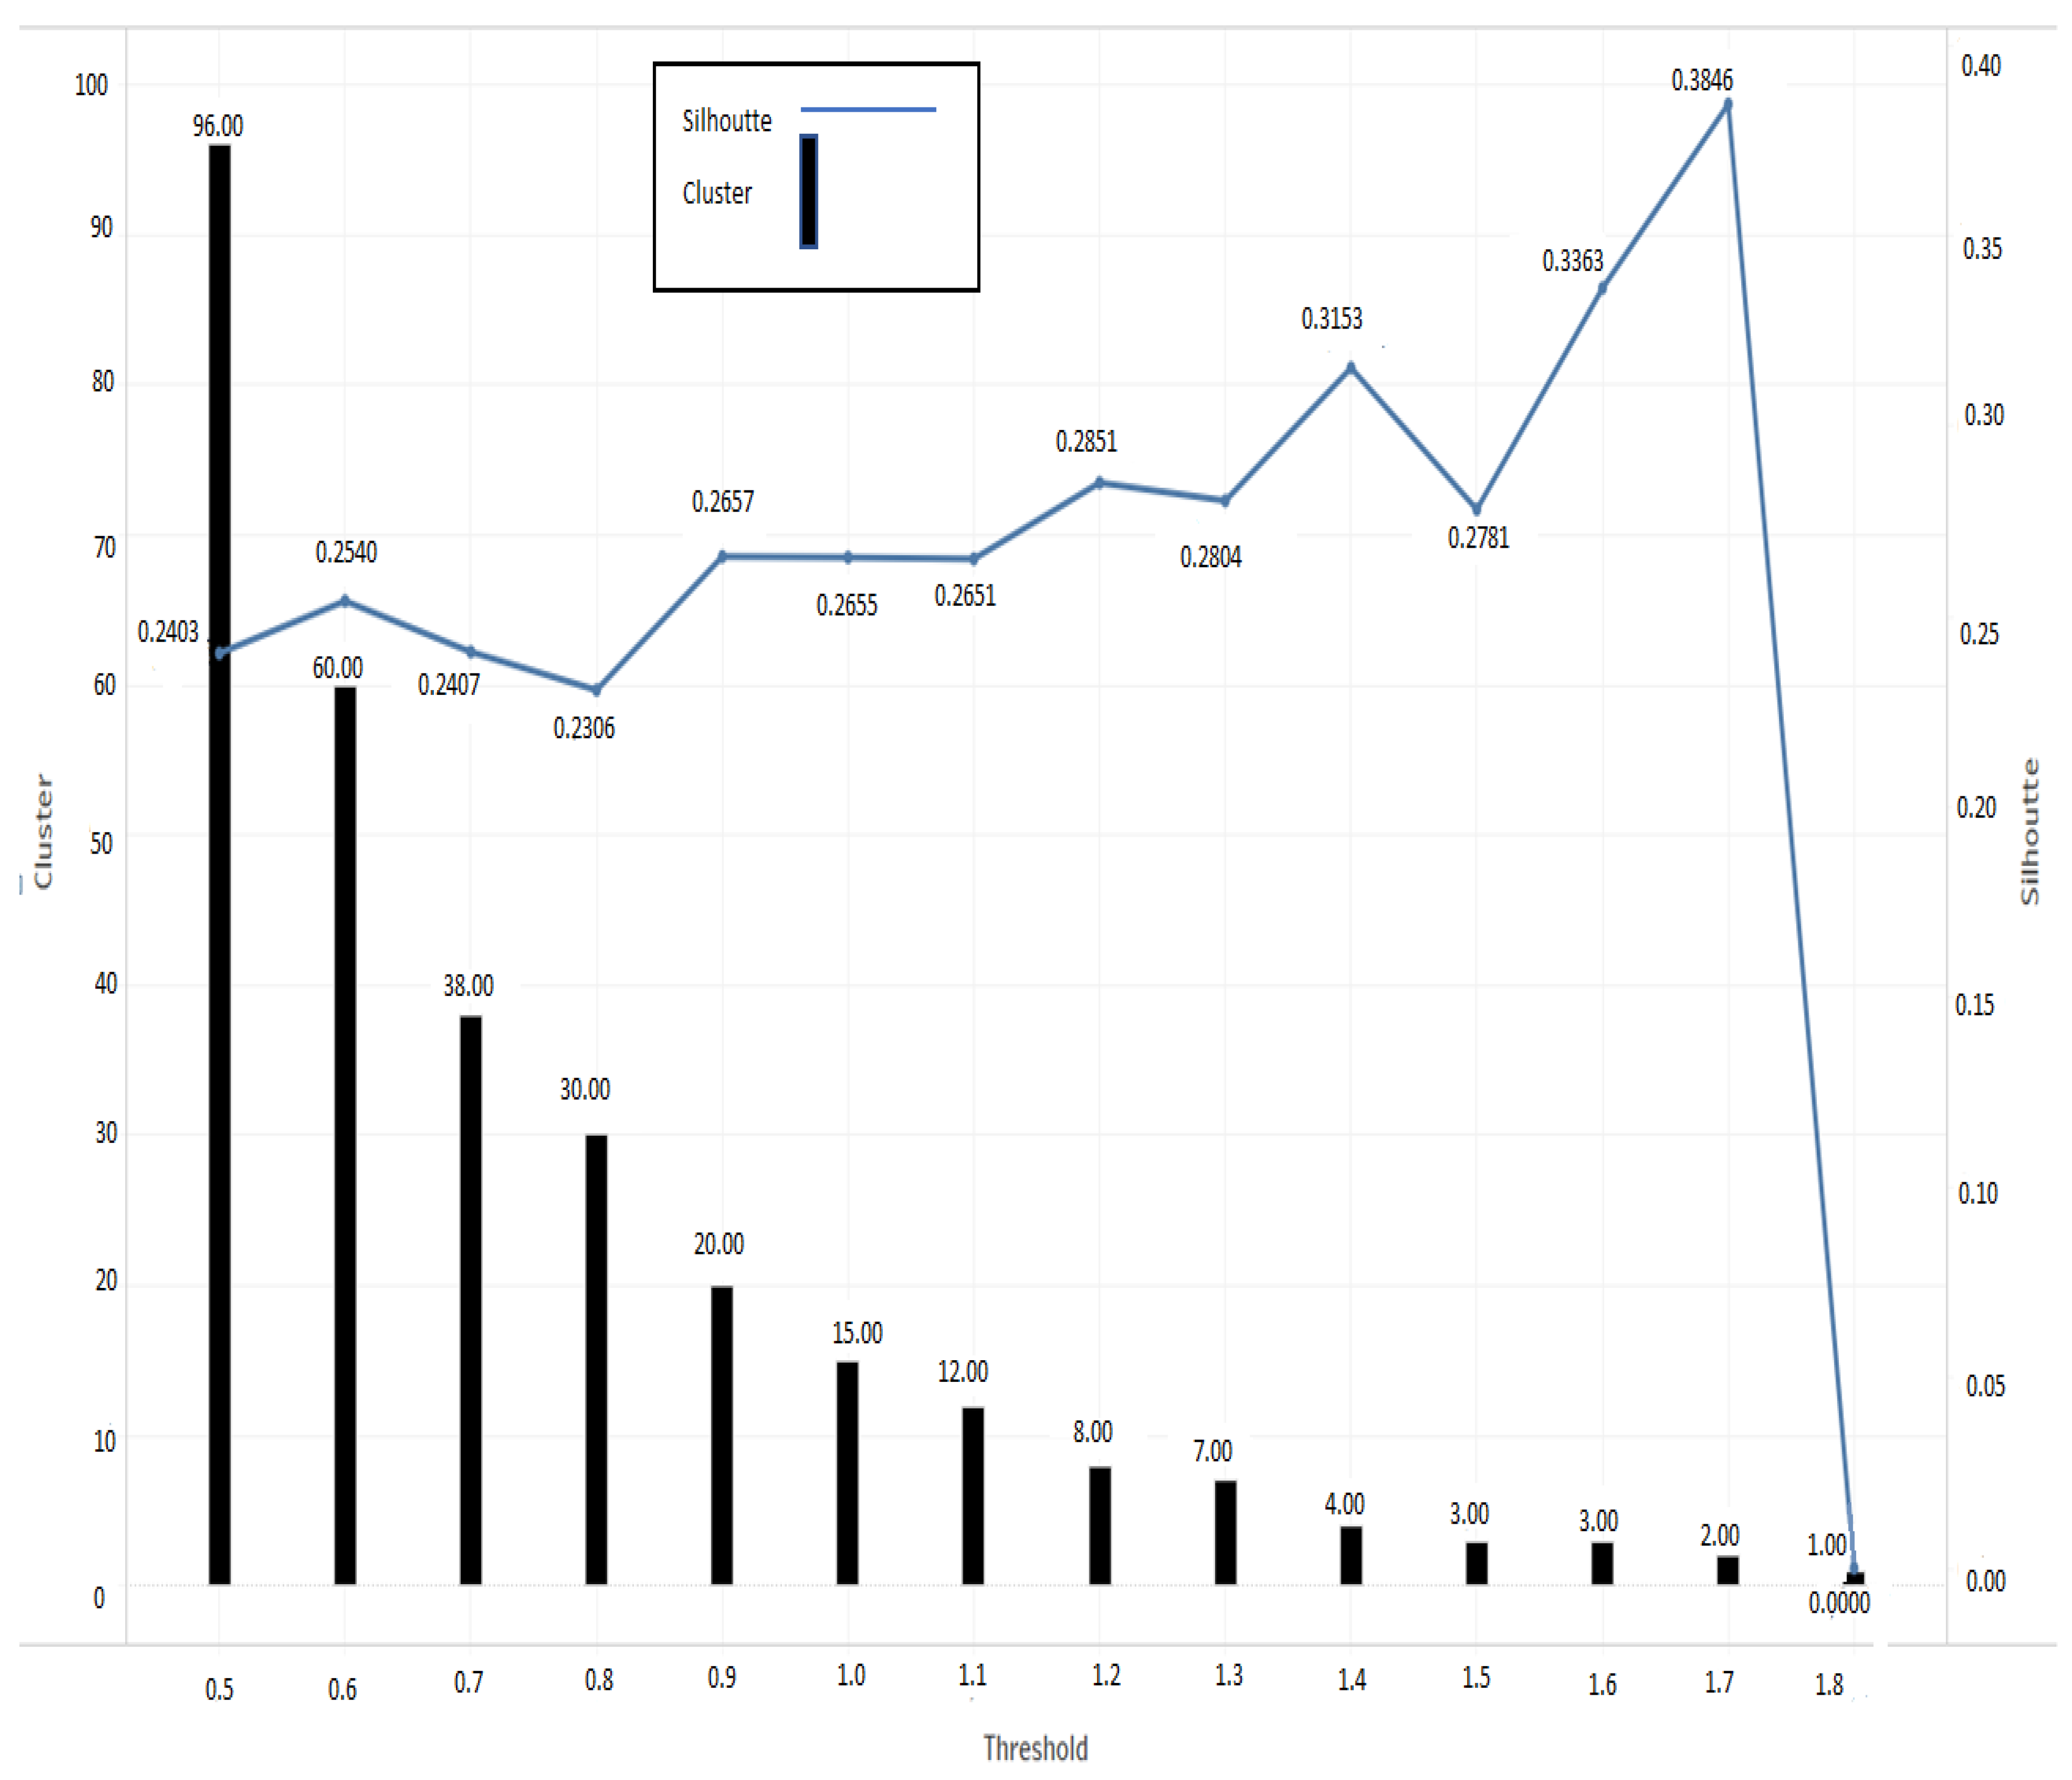
- First, selection of the appropriate threshold T value, where T is the upper limit to the radius of BIRCH cluster in a leaf node and radius is obtained by merging the new samples.
- The best value for threshold T has been selected based on the initial collected data and analyzing the silhouette score.
- Figure 4 shows silhouette score for choosing the best threshold value to setup initial model and to find the cluster of biometric profiles. silhouette score value ranges between (−1,1).
- The silhouette score was calculated to evaluate the cluster’s formation corresponding to threshold value. In Figure 4, it can be clearly seen that threshold value 1.7 predicts 2 cluster with maximum silhouette score 0.3846 which indicates better cluster formation. Therefore, threshold value 1.7 has chosen to set up biometric profile prediction model.
4.2. Second Step: Prediction Model to Find Most Relevant Fitting Style
4.2.1. Adaptive Random Forest (ARF) Classification
- Random forest classifier requires multiple passes over input data and it becomes infeasible if classifier is handling streaming data.
- Random forest to streaming data application requires an online bootstrap aggregating process; and limiting each leaf split decision to a subset of feature.
- ARF uses the drift detection method to cope with evolving data stream.
- Once the drift is detected ARF uses a threshold value to detect the warning and resultant create a background tree that a trained along the ensemble without affecting the existing ensemble’s prediction. Drift detection raises warning signal, which then replaces the respective background tree.
- In ARF votes are weighted using the test then train accuracy method.
4.2.2. Building Shirt Fitting Style Prediction Model
4.3. Third Step: Prediction for Most Relevant Fitting Style Rules
4.3.1. Association Mining
- Finding frequent attribute sets in data within the range of a defined support count value.
- Using the frequent item sets to generate the association rules. Only frequent attribute sets that fulfill the minimum threshold value are used to generate the association rules.
- Then, filtering the rules based on the threshold value assigned for support, confidence, and lift.
- Support (s) determines how often rule is applicable to a given dataset.
- Confidence (c) of the association rule is the measure of accuracy of rule, which is determined as the percentage of transaction in dataset containing A that also contains B.
- Lift (l) computes the ratio between the rule’s confidence and the support of the itemsets in the rule consequent [25].The authors of [25] have interpreted the lift measure as follows:
4.3.2. Implementation of Association Rule Mining to Extract Rules for Shirt Feature Sets
- Frequent item set generation process finds all item sets which satisfy the minimum support threshold value.
- The proposed system generates n tables for each cluster. Let proposed system receives different fitting type element with repetition. Let d be the number of distinct elements namely , and let these elements be . Finally, let be the count of . Thus represents total number of frequent pattern set tables generated by step 3. Similarly, in continuation, a similar number of table schema corresponding to each frequent pattern in the relational database management system are created via a service.
- From the frequent item sets generated in previous step, the rule generation step extracts the rules satisfying minimum support and confidence condition.
- Create frequent item sets by applying FP-growth to the shirt’s feature dataset with minimum support value 0.1 to cover most of the features in item sets.
- Read data from database D, which contains all the records of shirt’s feature transaction data. Corresponding to each fitting type (Comfort Fit, Regular, Super slim fit), which is considered as labels for the classification model let C contains distinct class; the FP-growth algorithm is applied to get the frequent item set corresponding to each fitting class.
- Using the frequent item sets, the system generates association rules satisfying the minimum support and minimum confidence (0.8) conditions.
- Rules extracted from database by matching the fabric name in antecedents to get the best shirt feature combination.
- Association rule’s usefulness and positive correlation has been measured using lift l, where l>1, which indicates positive correlation between the antecedent and consequent item or feature set.
- For a sample case, cluster 1 has been predicted for input vector , let these elements be , cluster 1 has been predicted for the given input vector and step 2 has predicted fitting type Regular, and step 3 has read data from association rules table for regular fitting. Table 4 shows the count of association rule table corresponding to each available fitting type in the system. Corresponding to regular fitting as it has been predicted in step 2 there has been 39 rules filtered from the knowledge base, which are then further used to build the best shirt feature combination for regular fitting. Then, the rules are further filtered by matching antecedents with a specific shirt feature. Let us say, the rules related to cuff extracted to know, which other feature of shirt “goes together”, like collar style, fabric type, and Collar white. Furthermore, evaluation metric confidence and lift utilized to get the strongest rules for the prediction, and only rules with confidence value greater than 0.80 and lift value greater than 1 considered. Matching rules for cuff are shown in Table 5.
- computational time for the complete step starting from the finding the suitable group for user as per his biometric profile then most relevant fitting style and then the combination of styling attribute combination for the predicted fitting style from the association rules is 558 ms per request.
4.4. Fourth Step: Acquisition of Real Fabric Data and Knowledge Base Integration
- Amplitude (A) is half the difference between maximum and minimum radii. It gives the depth of the drape profile with respect to the radius of draped fabric image [30]: AA in below equation represents average amplitudewhere is the maximum radius of the draped fabric image profile, is the minimum radius of the draped fabric image profile.
- Average distance: average distance from zero or mean of contour
- maximum peak: is the maximum radius of peak from center.
- maximum valley: is the maximum radius of valley from center.
- N is the number of peaks in the draped shadow.
- The Drape profile for each virtual fabric was created using the polar coordinate technique and extracted parametric information was added to the knowledge base; similarly, for the real fabric drape image profile and respective parameters added, average amplitude, average distance, maximum peak, minimum valley, and number of nodes of drape contour image.
- The system builds insights for new fabric from the existing virtual fabric knowledge base. Unsupervised kd-tree algorithm was trained over the fabric image profile parameters to get the nearest fabrics from the system.
4.5. Fifth Step: Acquisition of 3D Ease Allowance Parametric Information
4.5.1. General Scheme
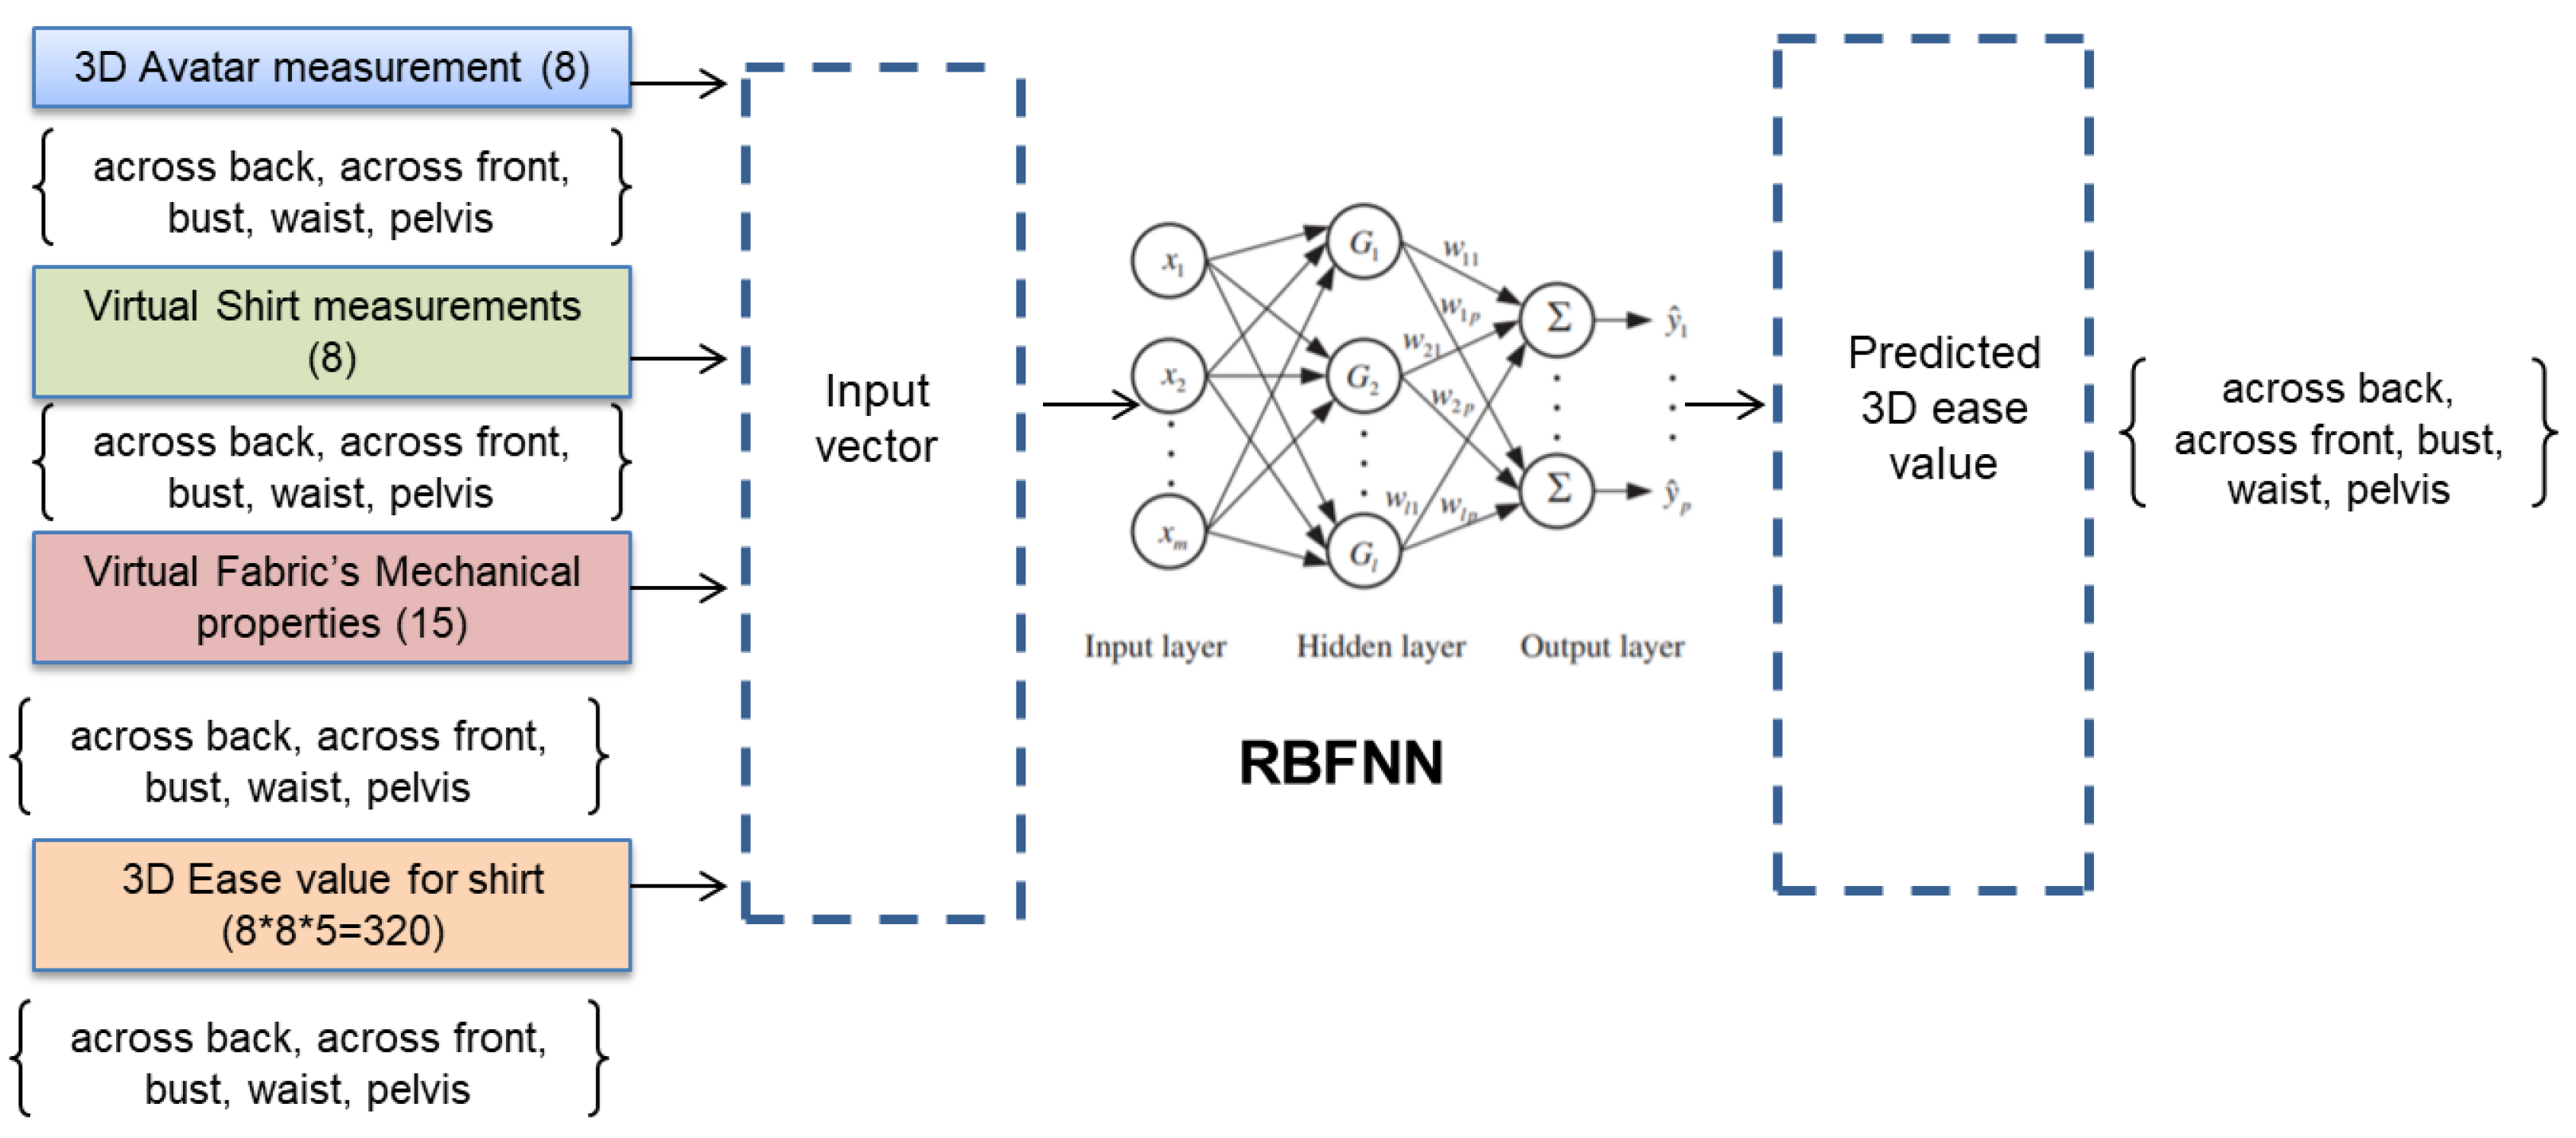
- A 3D garment ease prediction model has been developed using the RBFNN model. First input set to the model is key body parts (across back, across front, bust, waist, pelvis) of 3D avatar extracted from the lectra 3D CAD tool have been used, second input set to the model is garment measurement corresponding to each key body part of the actual garment, the third input set is the mechanical properties of fabric, and the output set contains ease allowance data corresponding to key body parts (across back, across front, bust, waist, pelvis).
- The proposed model tested and validated by splitting the initial data set into two subsets: First subset of data have been used to train RBFNN, second subset of data have been used to validate the trained model to evaluate the generalization ability of model.
4.5.2. Learning Data Acquisition
- Step 1: Eight different body measurements were considered to construct 3D mannequins using 3D lectra CAD tool and the key body parts measurements are collected and shown in Table 6.
- Step 2: Standard men’s shirt size chart shown in Table 7 has been utilized to construct the shirt pattern for the 3D mannequins constructed in step 1.
- Step 3: Each shirt pattern then further utilized to create the virtual shirt for the 3D avatar constructed in step 1 and the final shirt garment measurement data obtained as shown in Table 8.
- Step 5: After the construction of virtual shirts ease data collected for key body parts of shirt (across back, across front, bust, waist, and pelvis). Each key body part’s five ease values obtained corresponding to 5 chosen fabrics to see the influence of fabric on the garment ease.
- Step 6: All the 8 human body measurements, 8 different shirt sizes, and 5 fabrics with different fiber composition are utilized to evaluate the 3D ease of virtual shirt. This experiment resulted to 320 records to make the knowledge base, obtained records then further utilized to implement 3D ease non linear functional approximation prediction model.
4.5.3. Learning Data Formalization
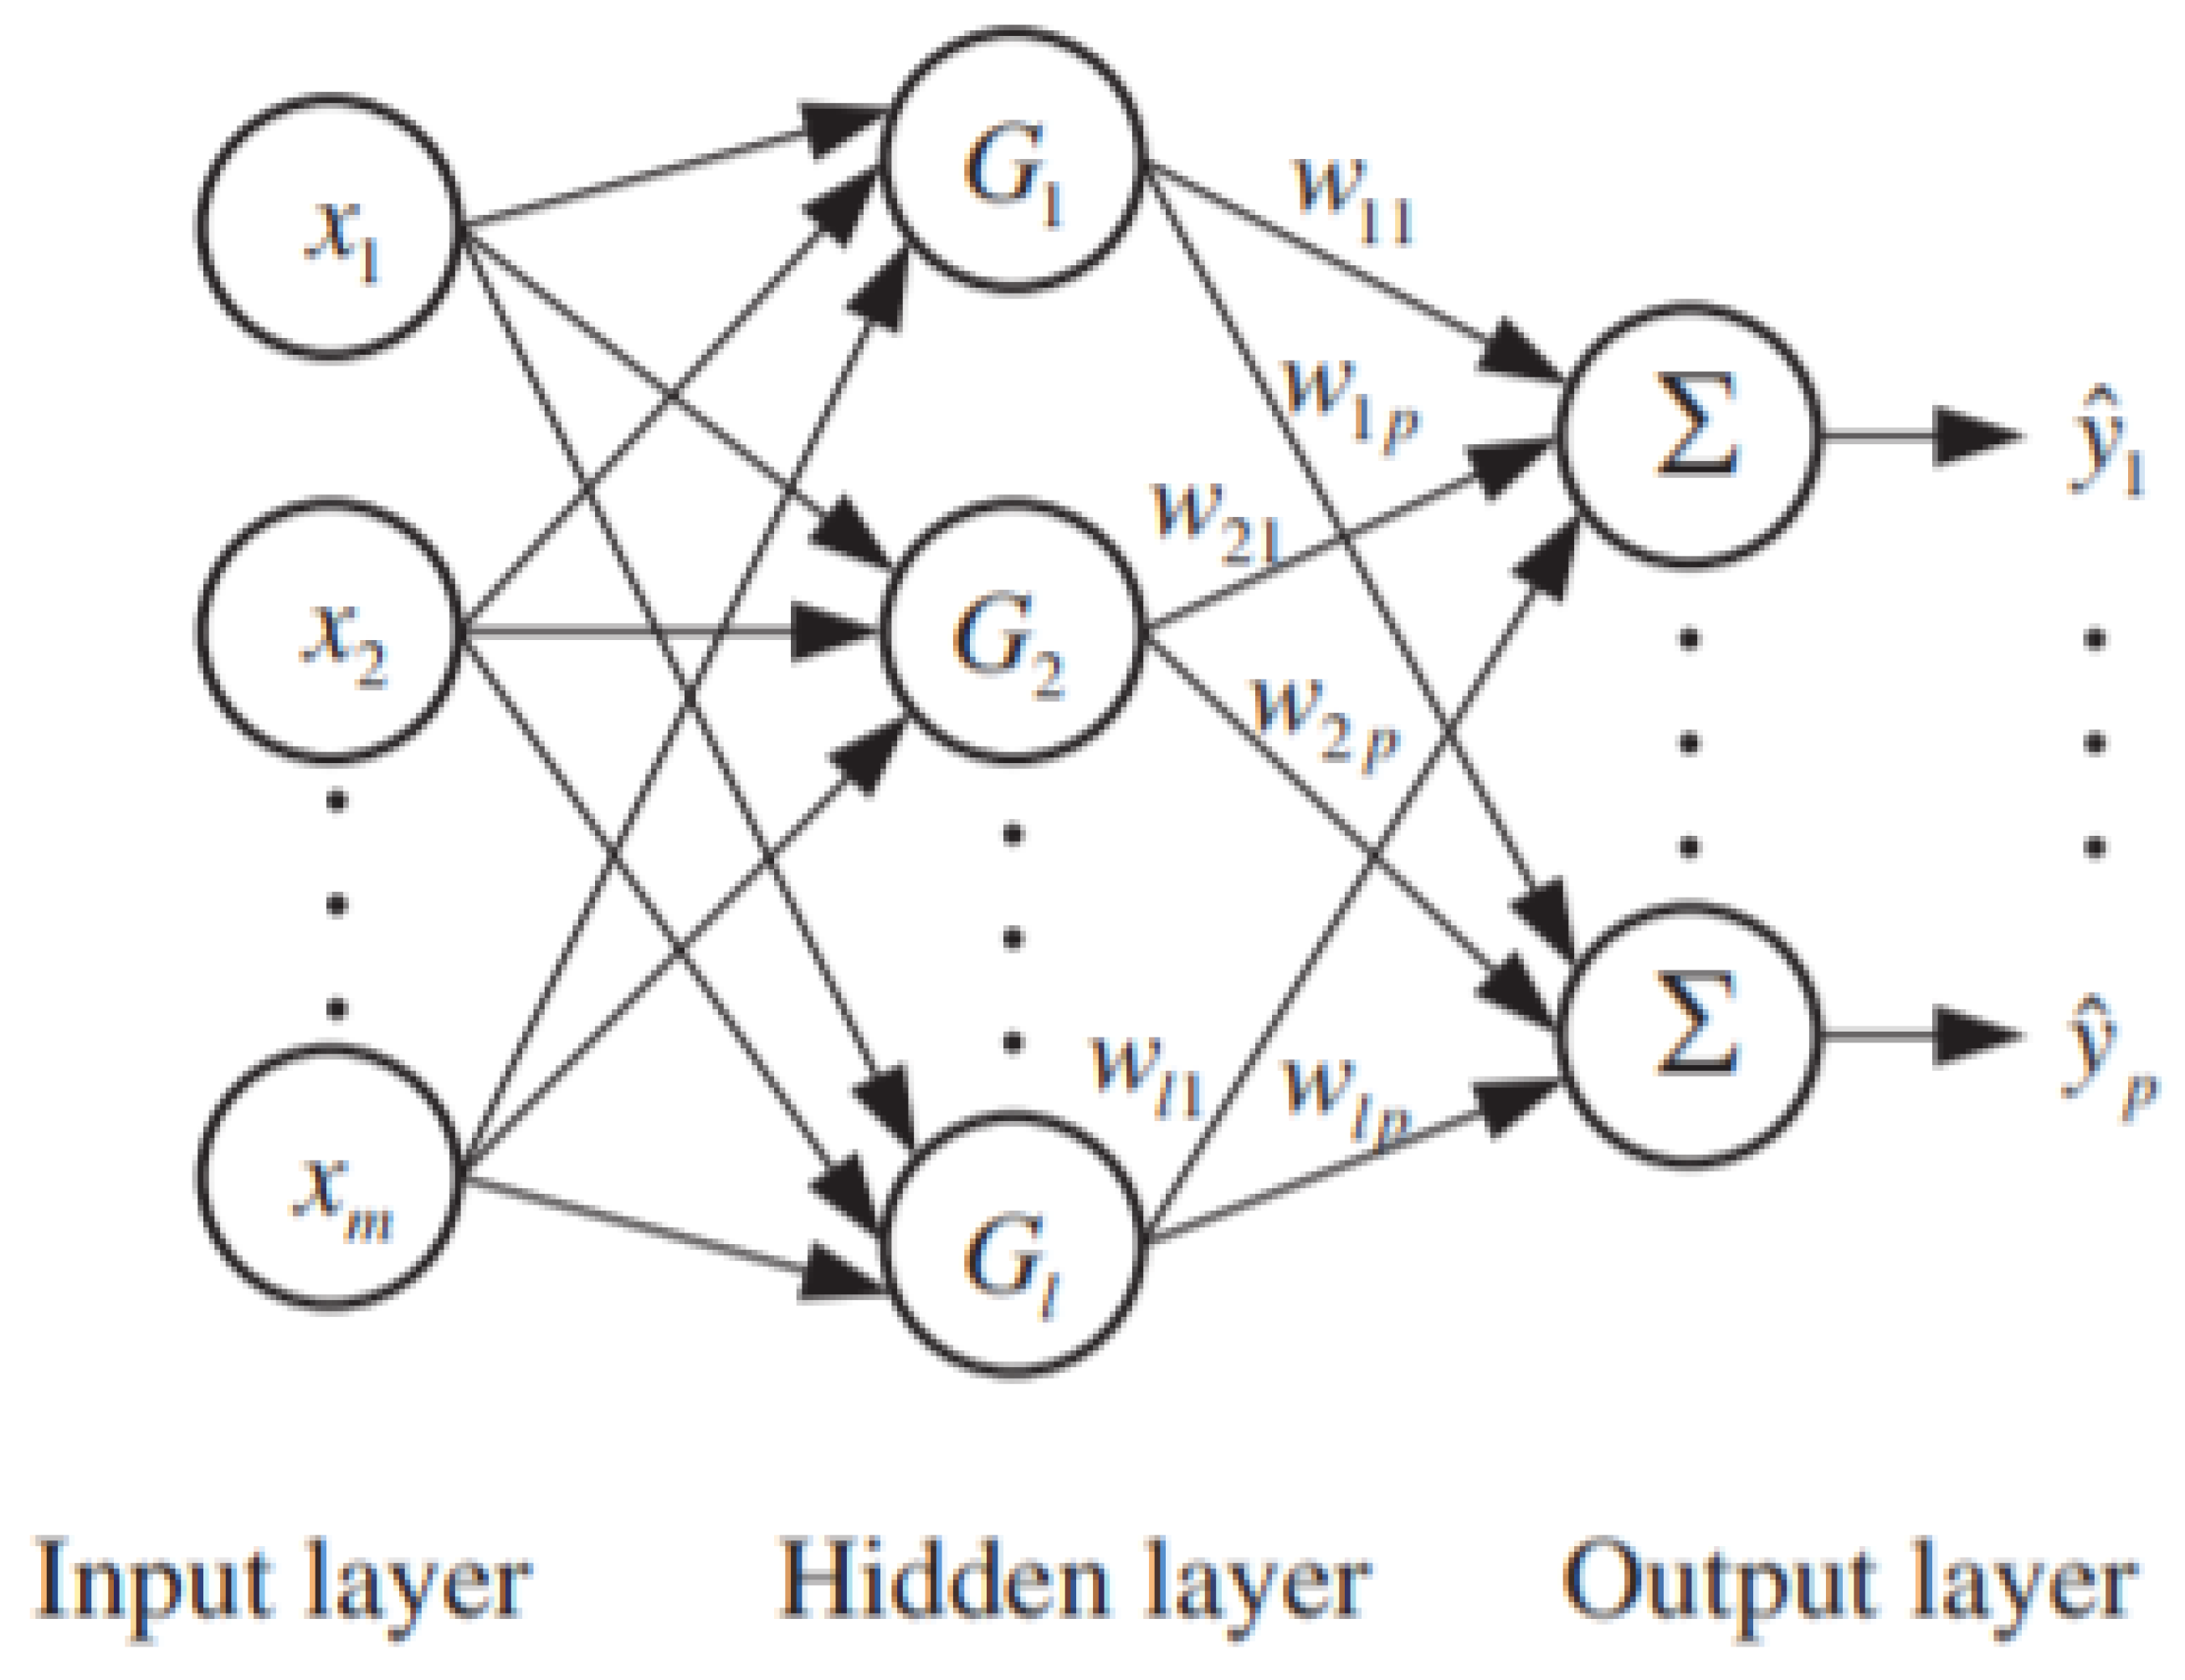
4.5.4. Implementation of Radial Basis Function Neural Network
- Step 1. Initial set of cluster center was supplied to the hidden layer.
- Step 2. Then based on the Euclidean distance metrics used to assign the closest cluster center for each input of the hidden layer.
- Step 3. New cluster center computed .
- Step 4. If the cluster center changed then repeat the step 2 and step 3; otherwise, stop.
4.5.5. Train, Validate, and Test RBFNN over Collected Data
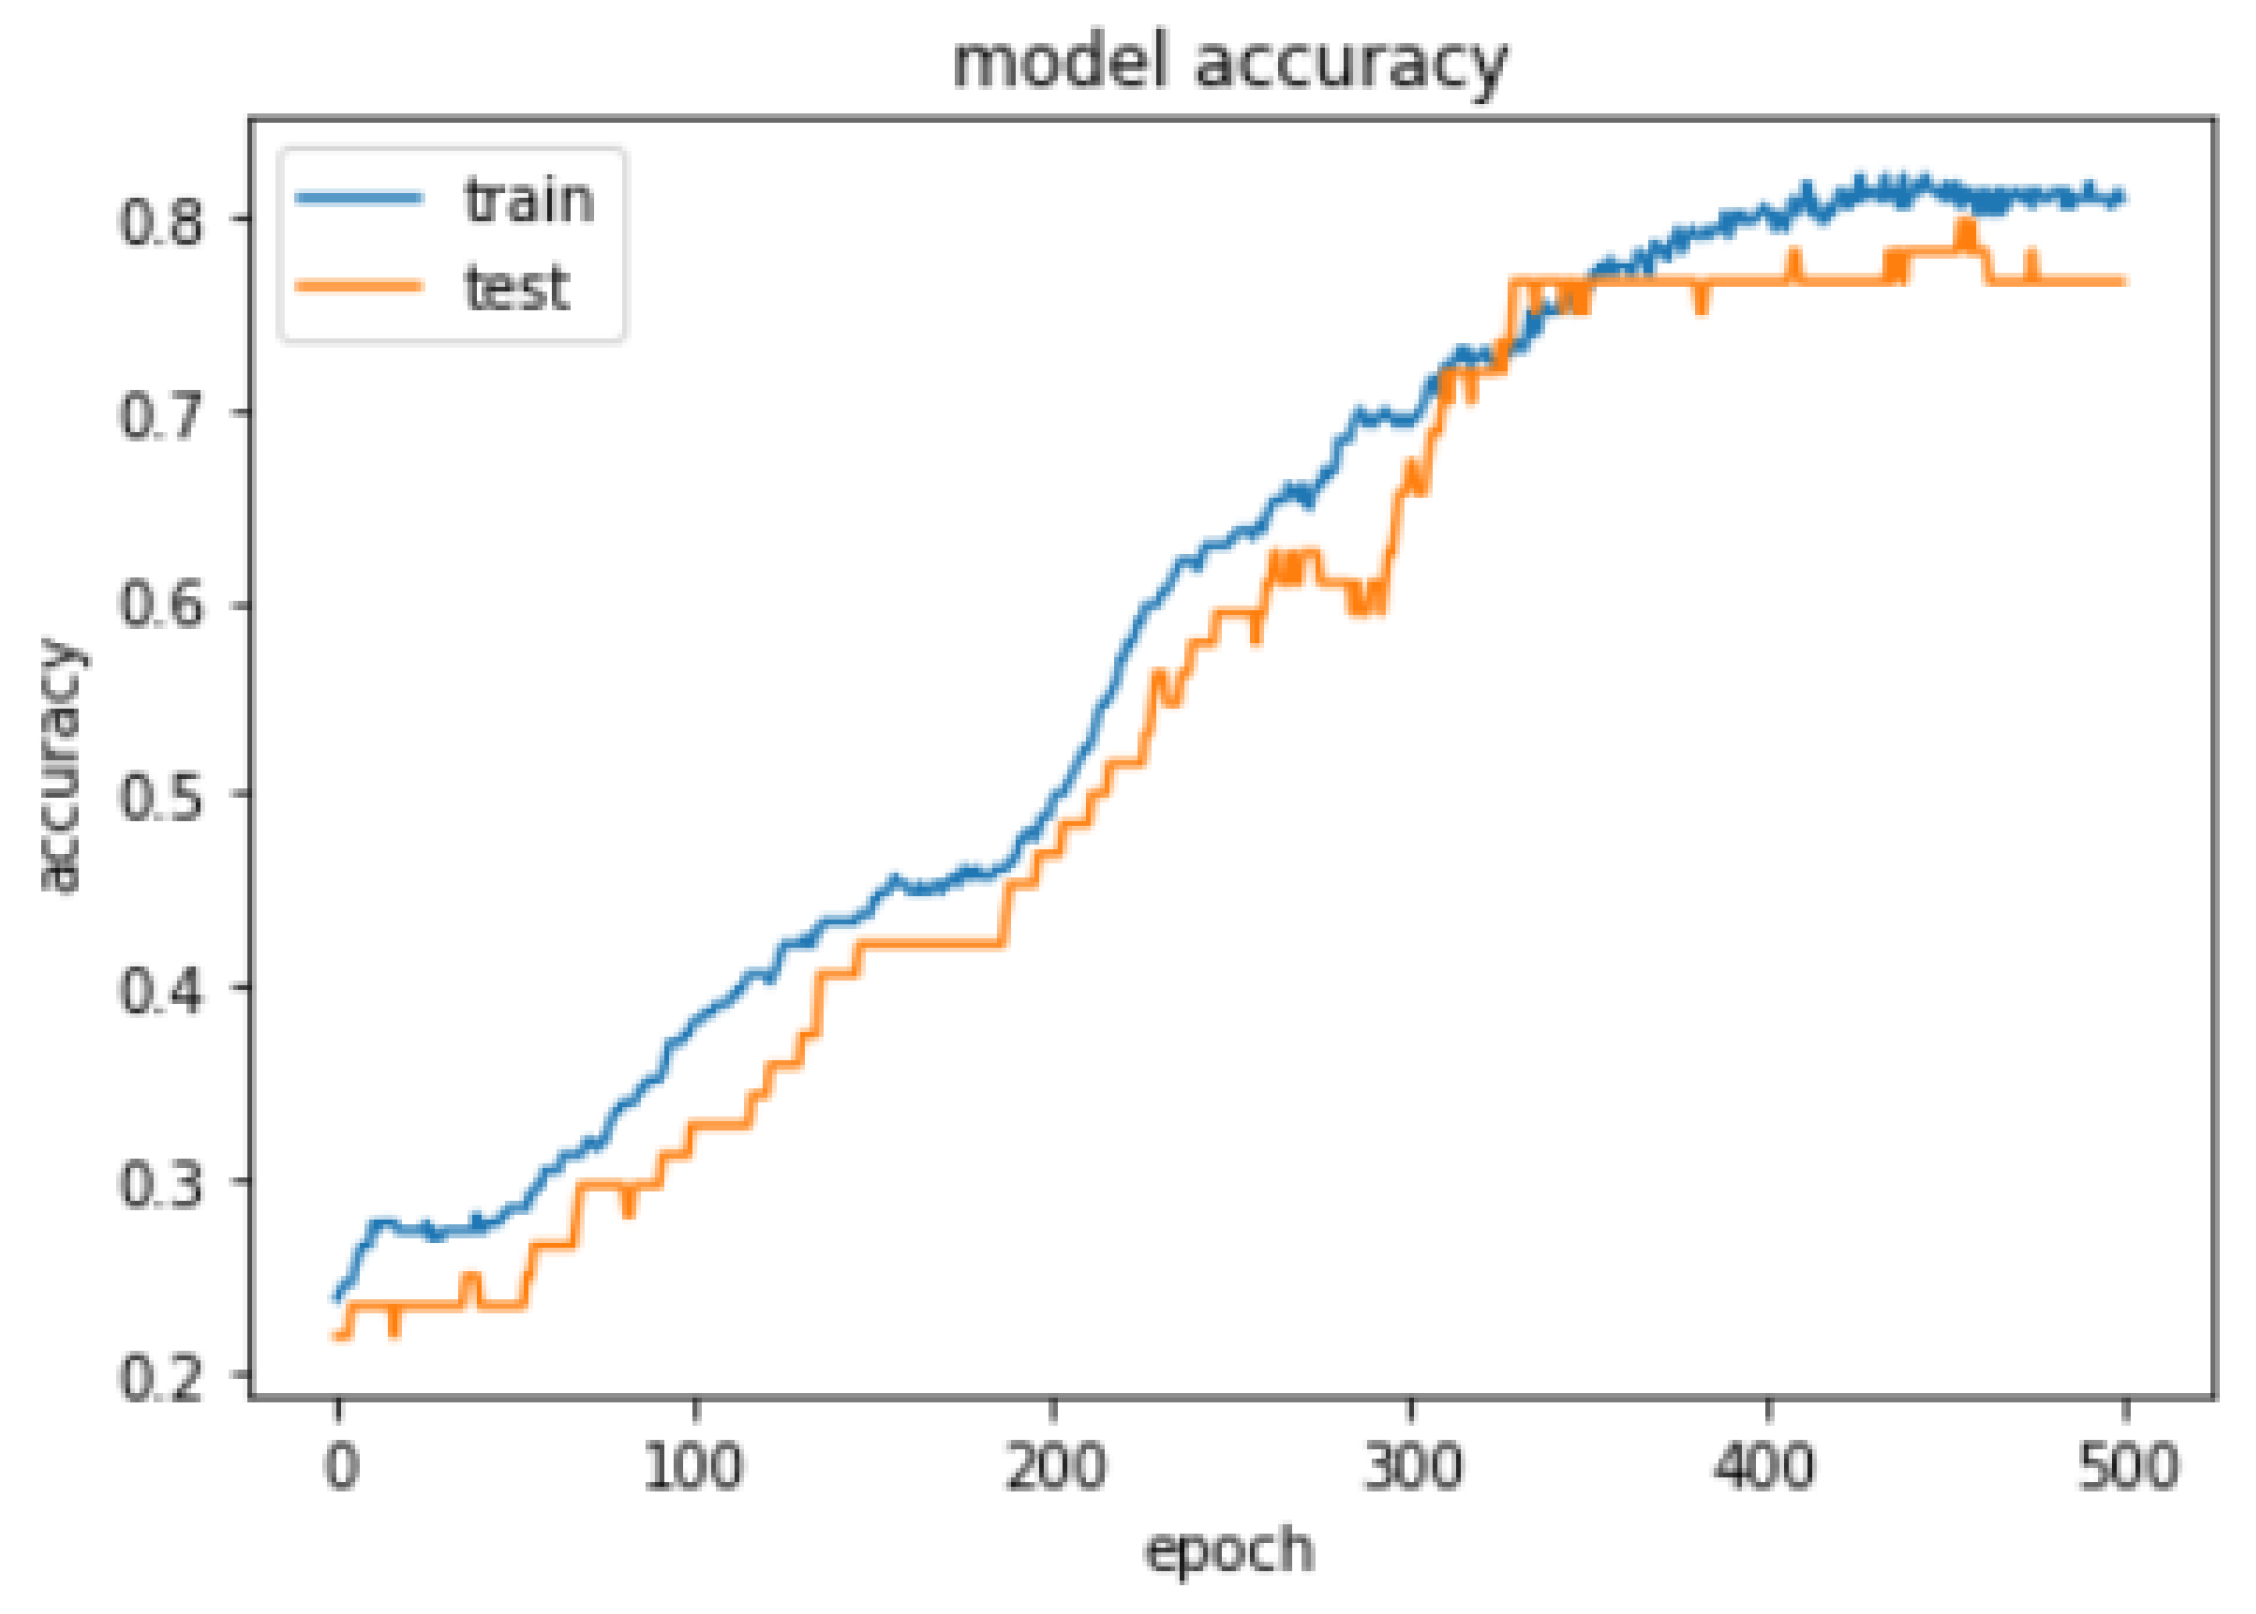
- Selection of value for the hidden layer has been identified by training the and validating model with 20% data, 500 epoch, beta value is 1, and momentum of RMSprop is 0.0, learning rate is 0.001 and 60 neurons in hidden layer with 12 different values as shown in Table 12. The model’s value insight has been taken based on the MSE value in the resultant table sigma value 0.1 to 1 has shown continuous decrease in the MSE values and gradual increase in the model’s accuracy after the sigma value 1 to 3 consistent decrease in the model’s accuracy and increase in the MSE value, except the sigma value 2.5 has shown slight increase but very low as compare to the 0 to 1 range of the sigma values. Therefore, has been utilized to build the RBFNN model.
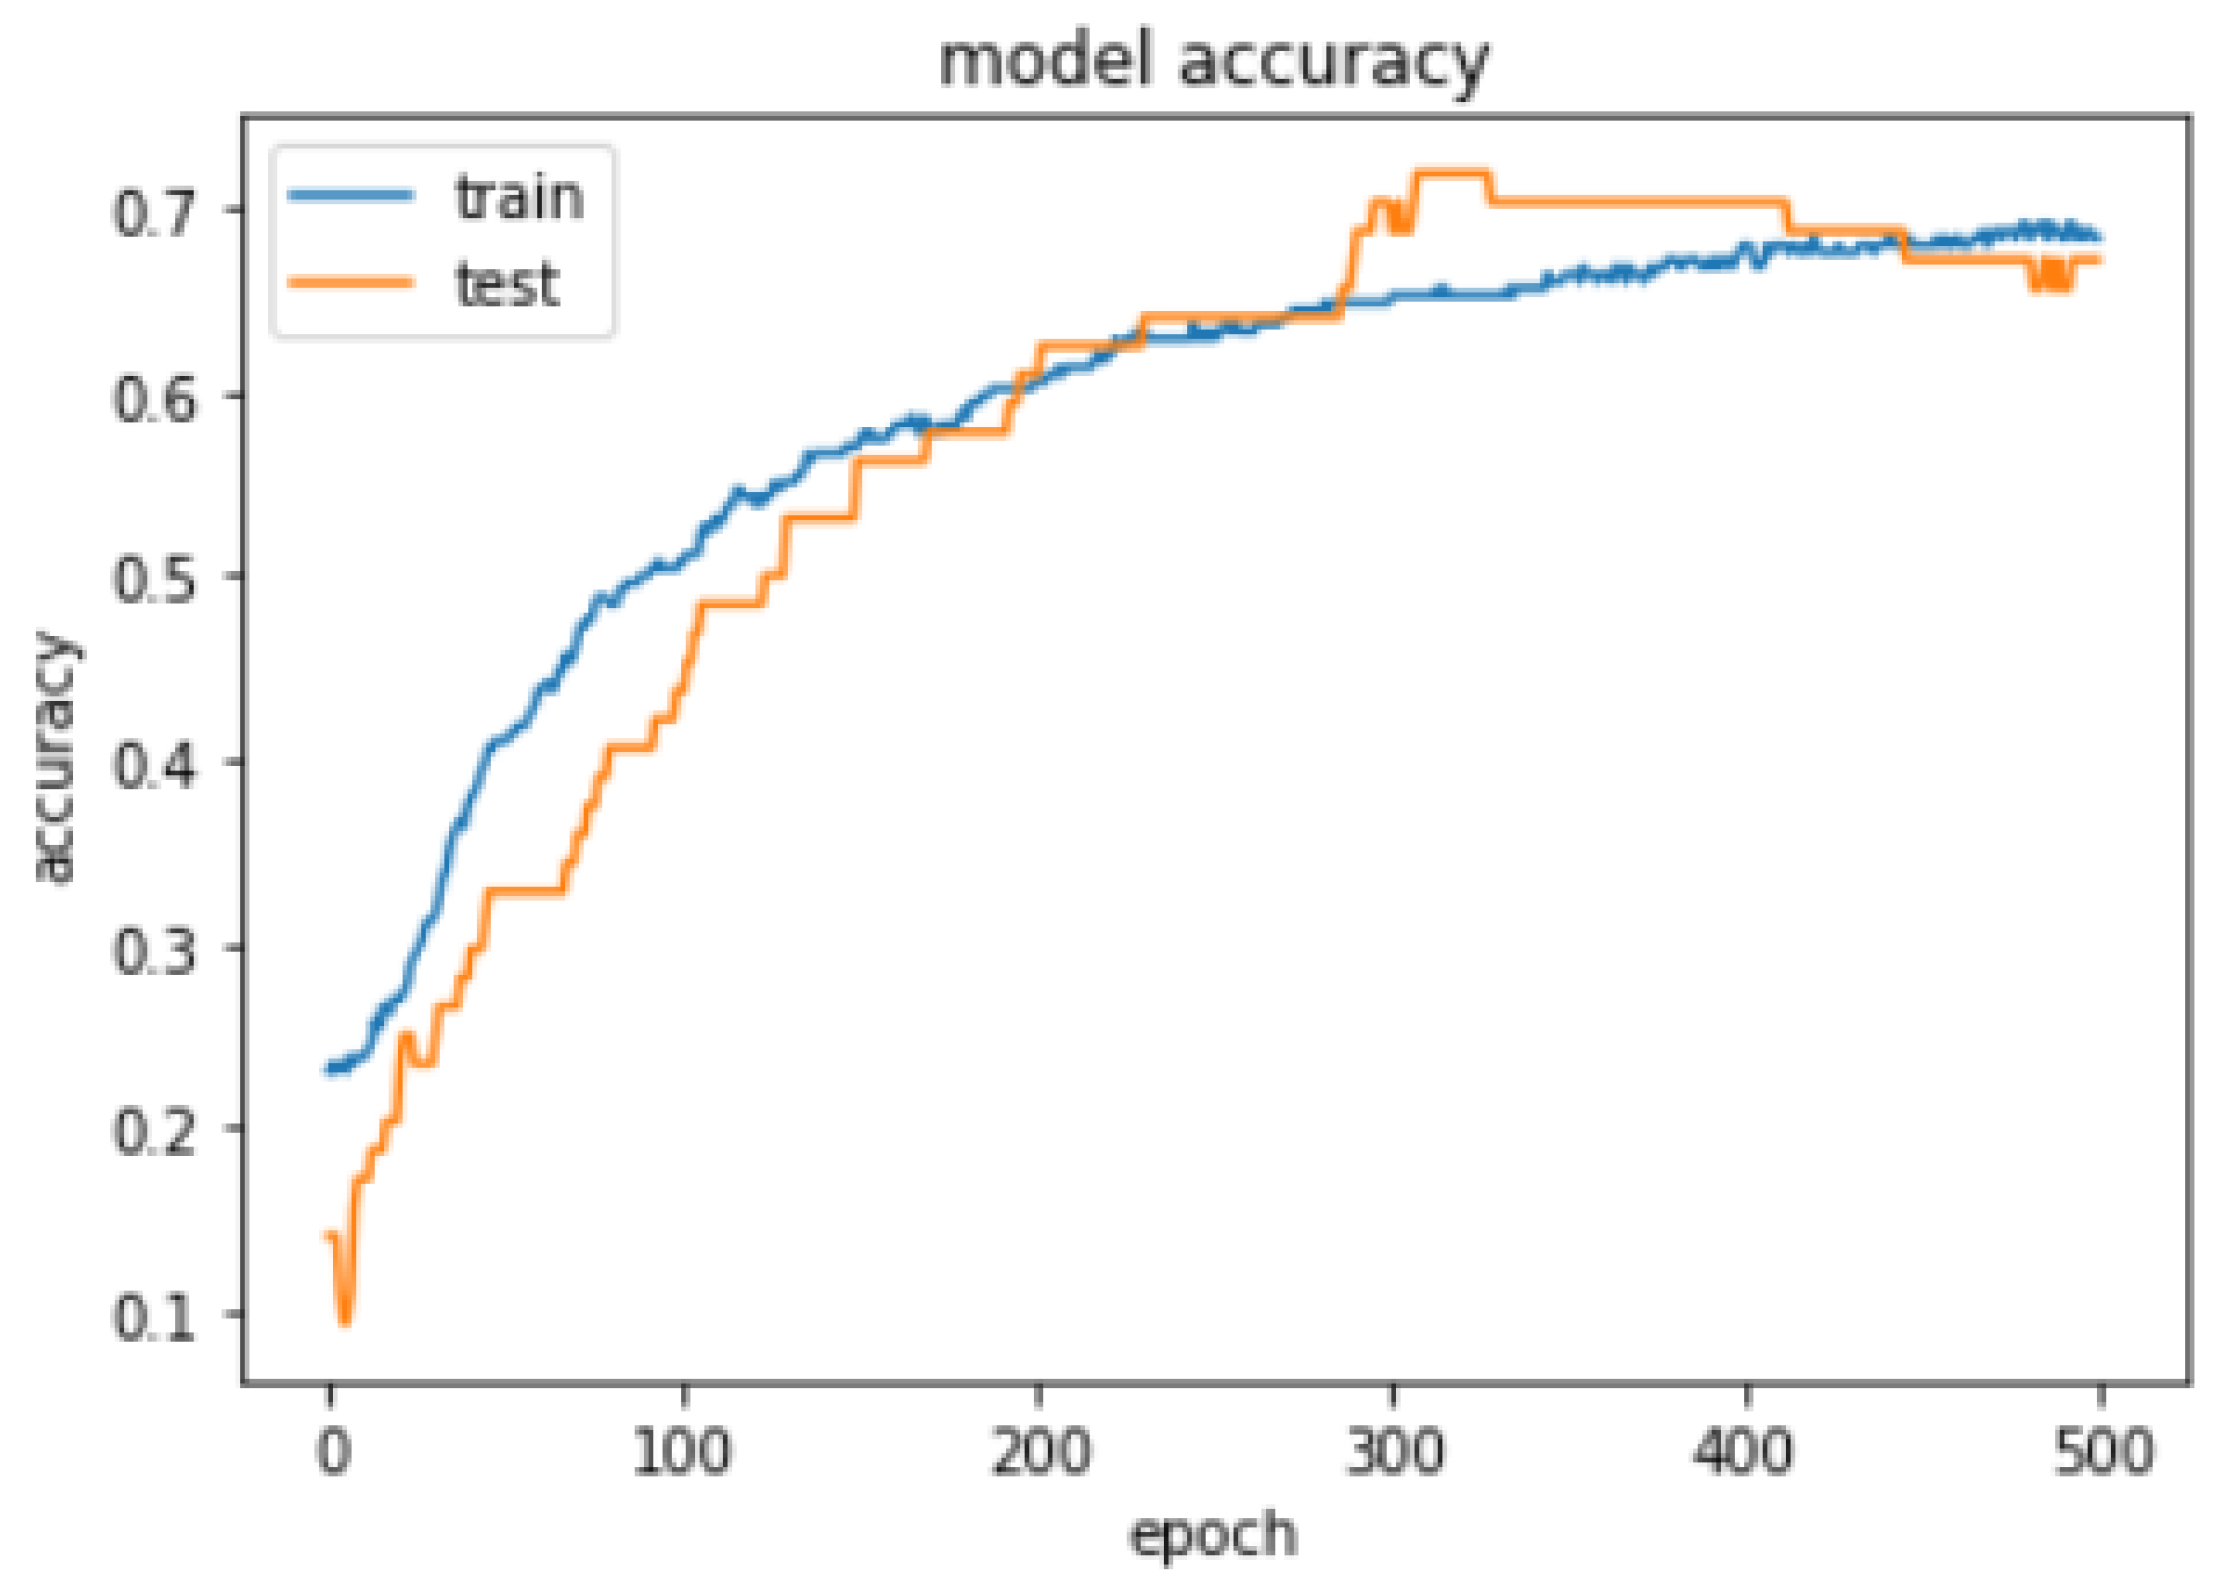
- Comparison of the RBFNN model with Backpropagation neural network (BPNN) and the difference between the two models on the same data sample with 20% of the validation set; the accuracy curve for train and validation set is created. Accuracy curve data for 500 epochs for RBFNN and BPNN is shown in Table 13 and Table 14. Figure 8 and Figure 9 clearly show that the RBFNN model’s accuracy curve corresponding to test set has more generalized accuracy curve unlike the BPNN accuracy curve against the validation set. RBFNN and BPNN model compared over the 500 epochs and result can be seen in Table 15.
- The application of ease prediction model has shown in Figure 10. Following sample record has been utilized to get the ease values for five key body parts of shirt across back, across front, bust, waist, pelvis. Input vector x = [34.71, 37.04, 86.98, 87.98, 73.89, 44.33, 44.69, 91.89, 103.88, 104.49, 95, 0.05, 5.89, 3.56, 2.85, 6.27, 0.76, 0.67, 5.3, 10.35, 0.81, 0.81, 14.72, 14.72] supplied to model and then resultant y vector returned y = [9.299779, 7.5186224, 4.83331, 15.186139, 30.181925], which represents ease of five key body parts across back, across front, bust, waist, pelvis. Further designers have utilized the predicted ease values to recreate the shirt pattern using the 3D CAD tool. This method gives quick insight by showing the variations in ease values due to the change in body measurement, fabric, and pattern size, without repeating the complete process in the 3D CAD tool.
- Computational time for the ease prediction model after deploying it as a service is 45 ms.
5. Service Architecture Validation
- The system creates a new BIRCH cluster object without affecting the old clustered data and should append the new data to the existing cluster, If new data do not form a new cluster.
- The system introduces a new adaptive random forest classifier object, if a new fitting type is introduced in the data.
- The system creates a frequent pattern table in the SQL Server database automatically corresponding to new fitting type, which may occur in new or old BIRCH cluster object.
- The system creates association rule table in SQL server corresponding to new fitting, which may occur in new or old BIRCH cluster object.
- The system integrates real fabric to existing knowledge base by parsing the fabric drape image, which is extracted from the drape meter and fabric drape image profile shall be created and saved into system.
- Updated shirt pattern measurements, body measurements, ease allowance value of key body parts and fabric details shall be saved into SQL server database table schema to retrain the RBFNN ease prediction model.
- Most relevant biometric profile influenced group for a specific consumer.
- Most relevant fitting style of shirt as per the biometric profile influenced group.
- Identification of the relevant style attributes for predicted fitting style.
- Identification of the closest fabric by comparing the drape.
- Identification of the parametric value of garment ease corresponding to predicted styles of shirt. Then pattern creation and evaluation of the pattern by the designers.
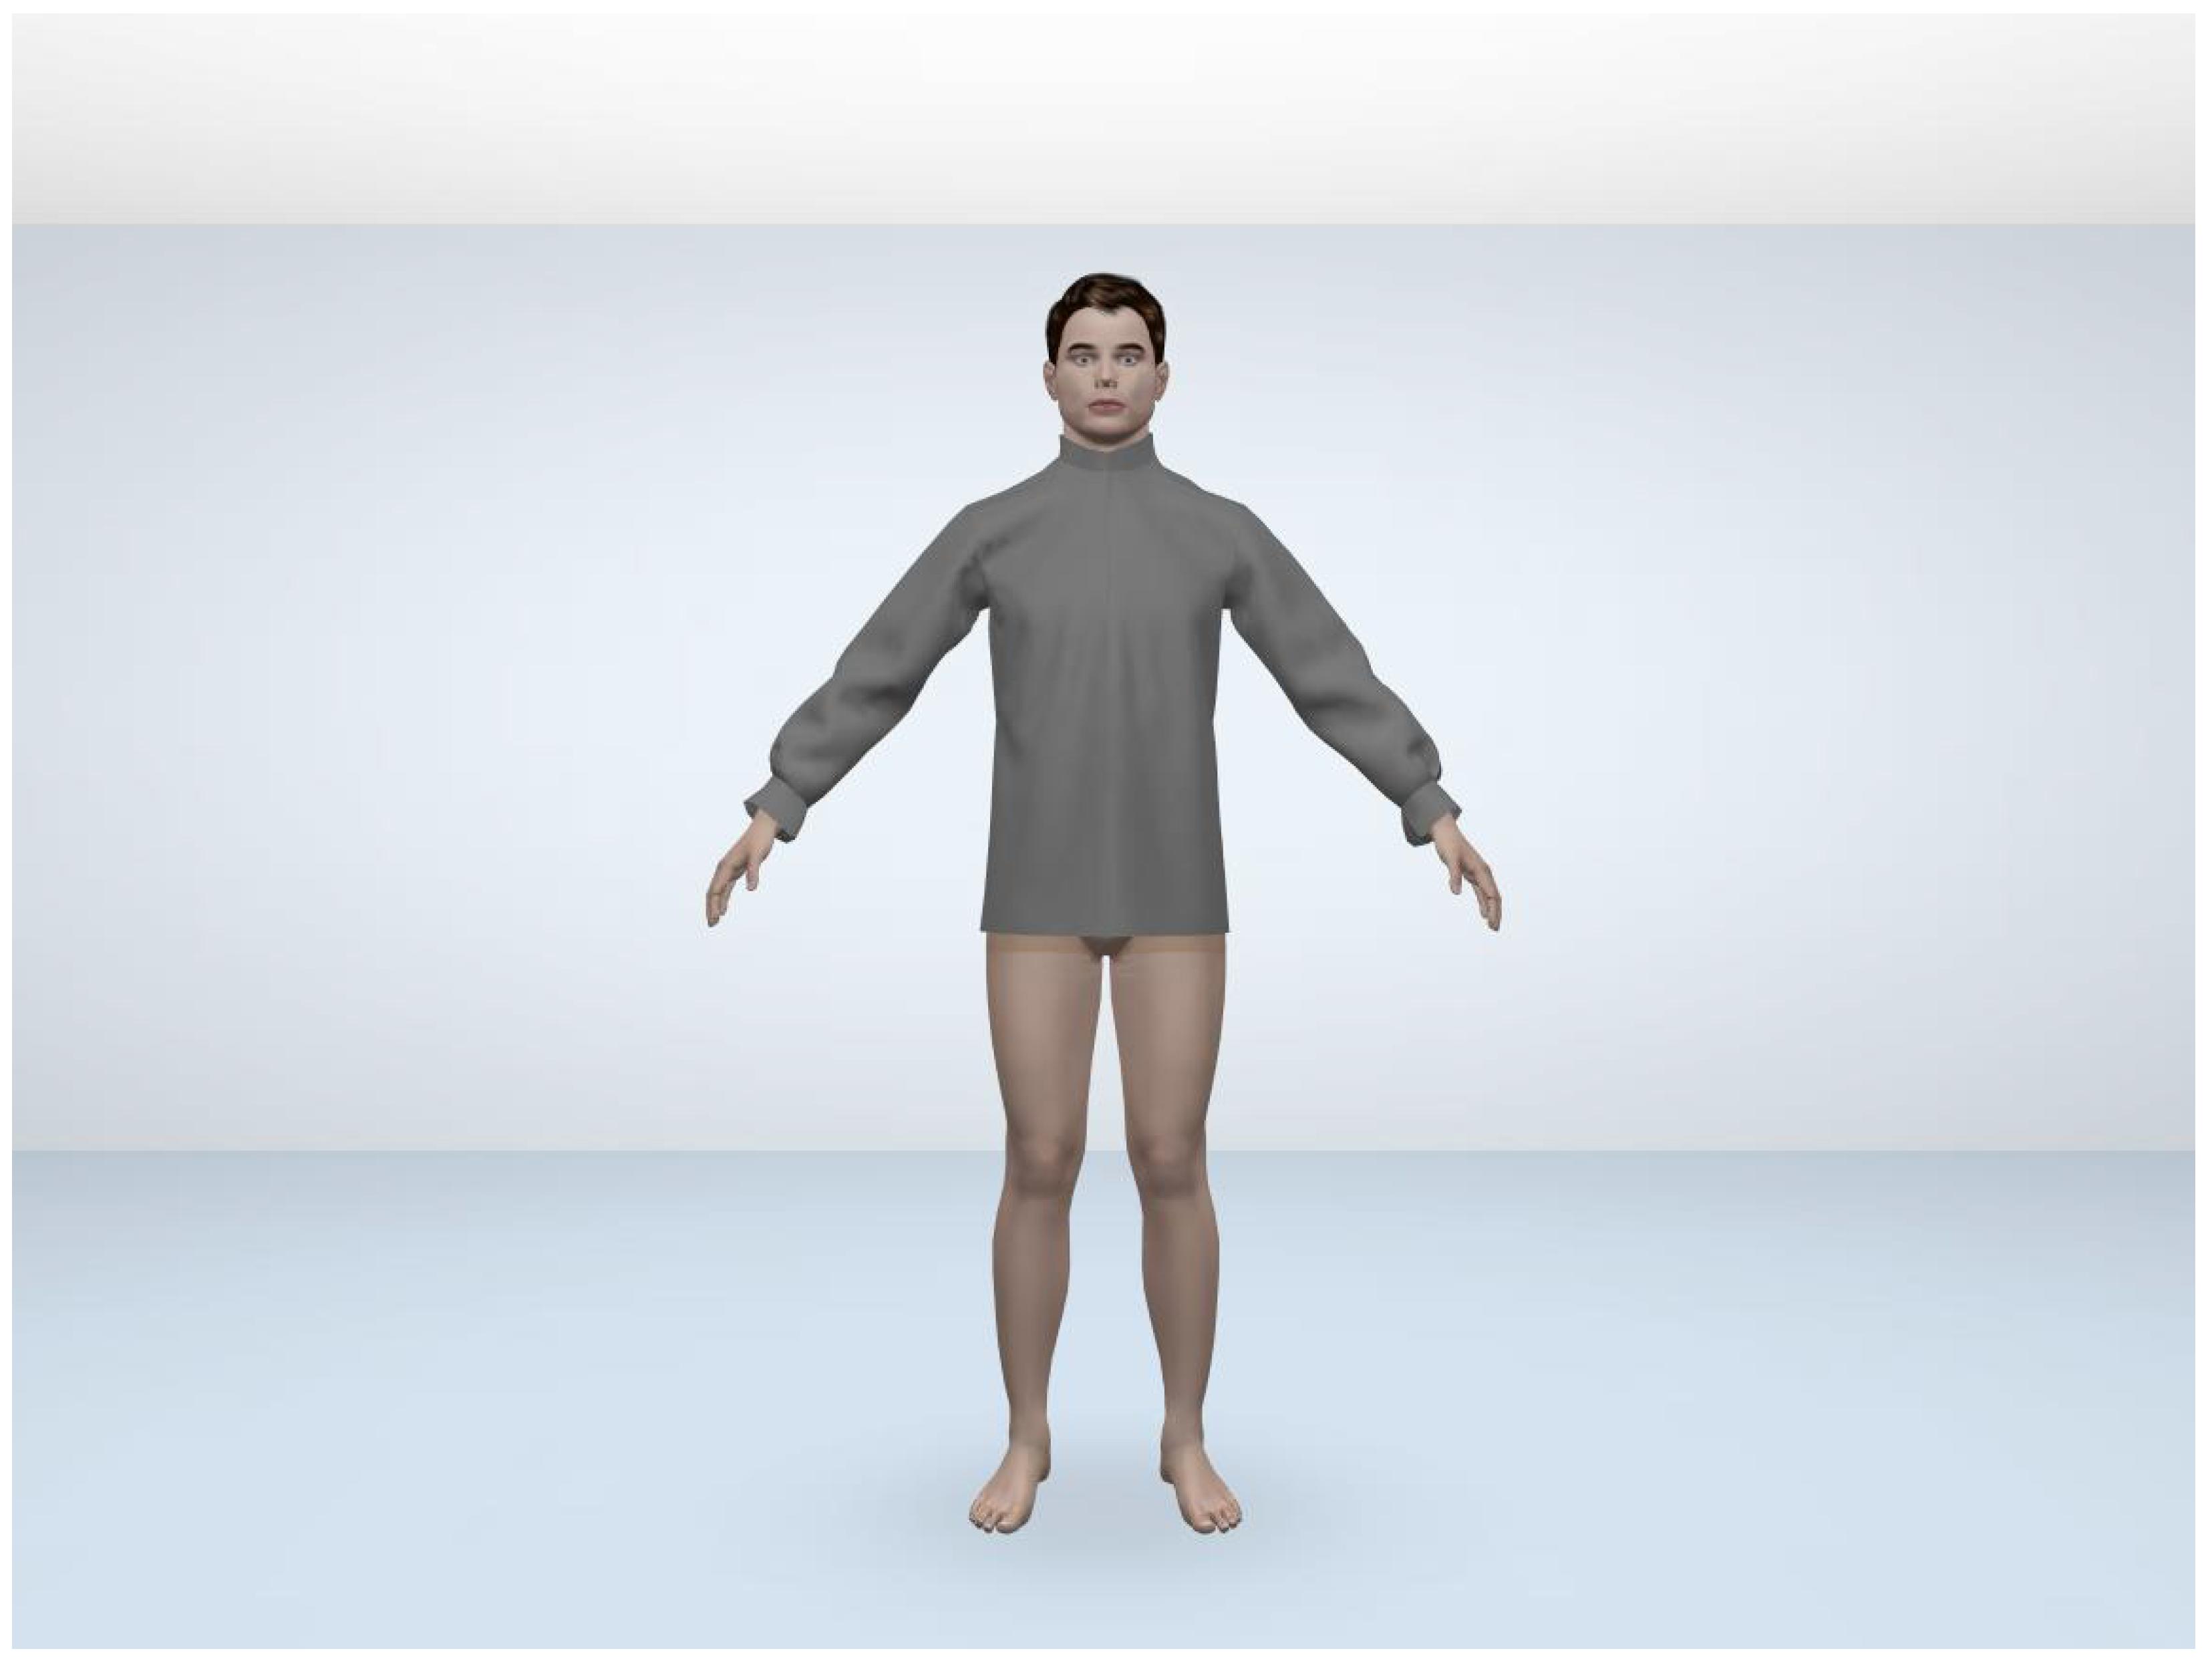
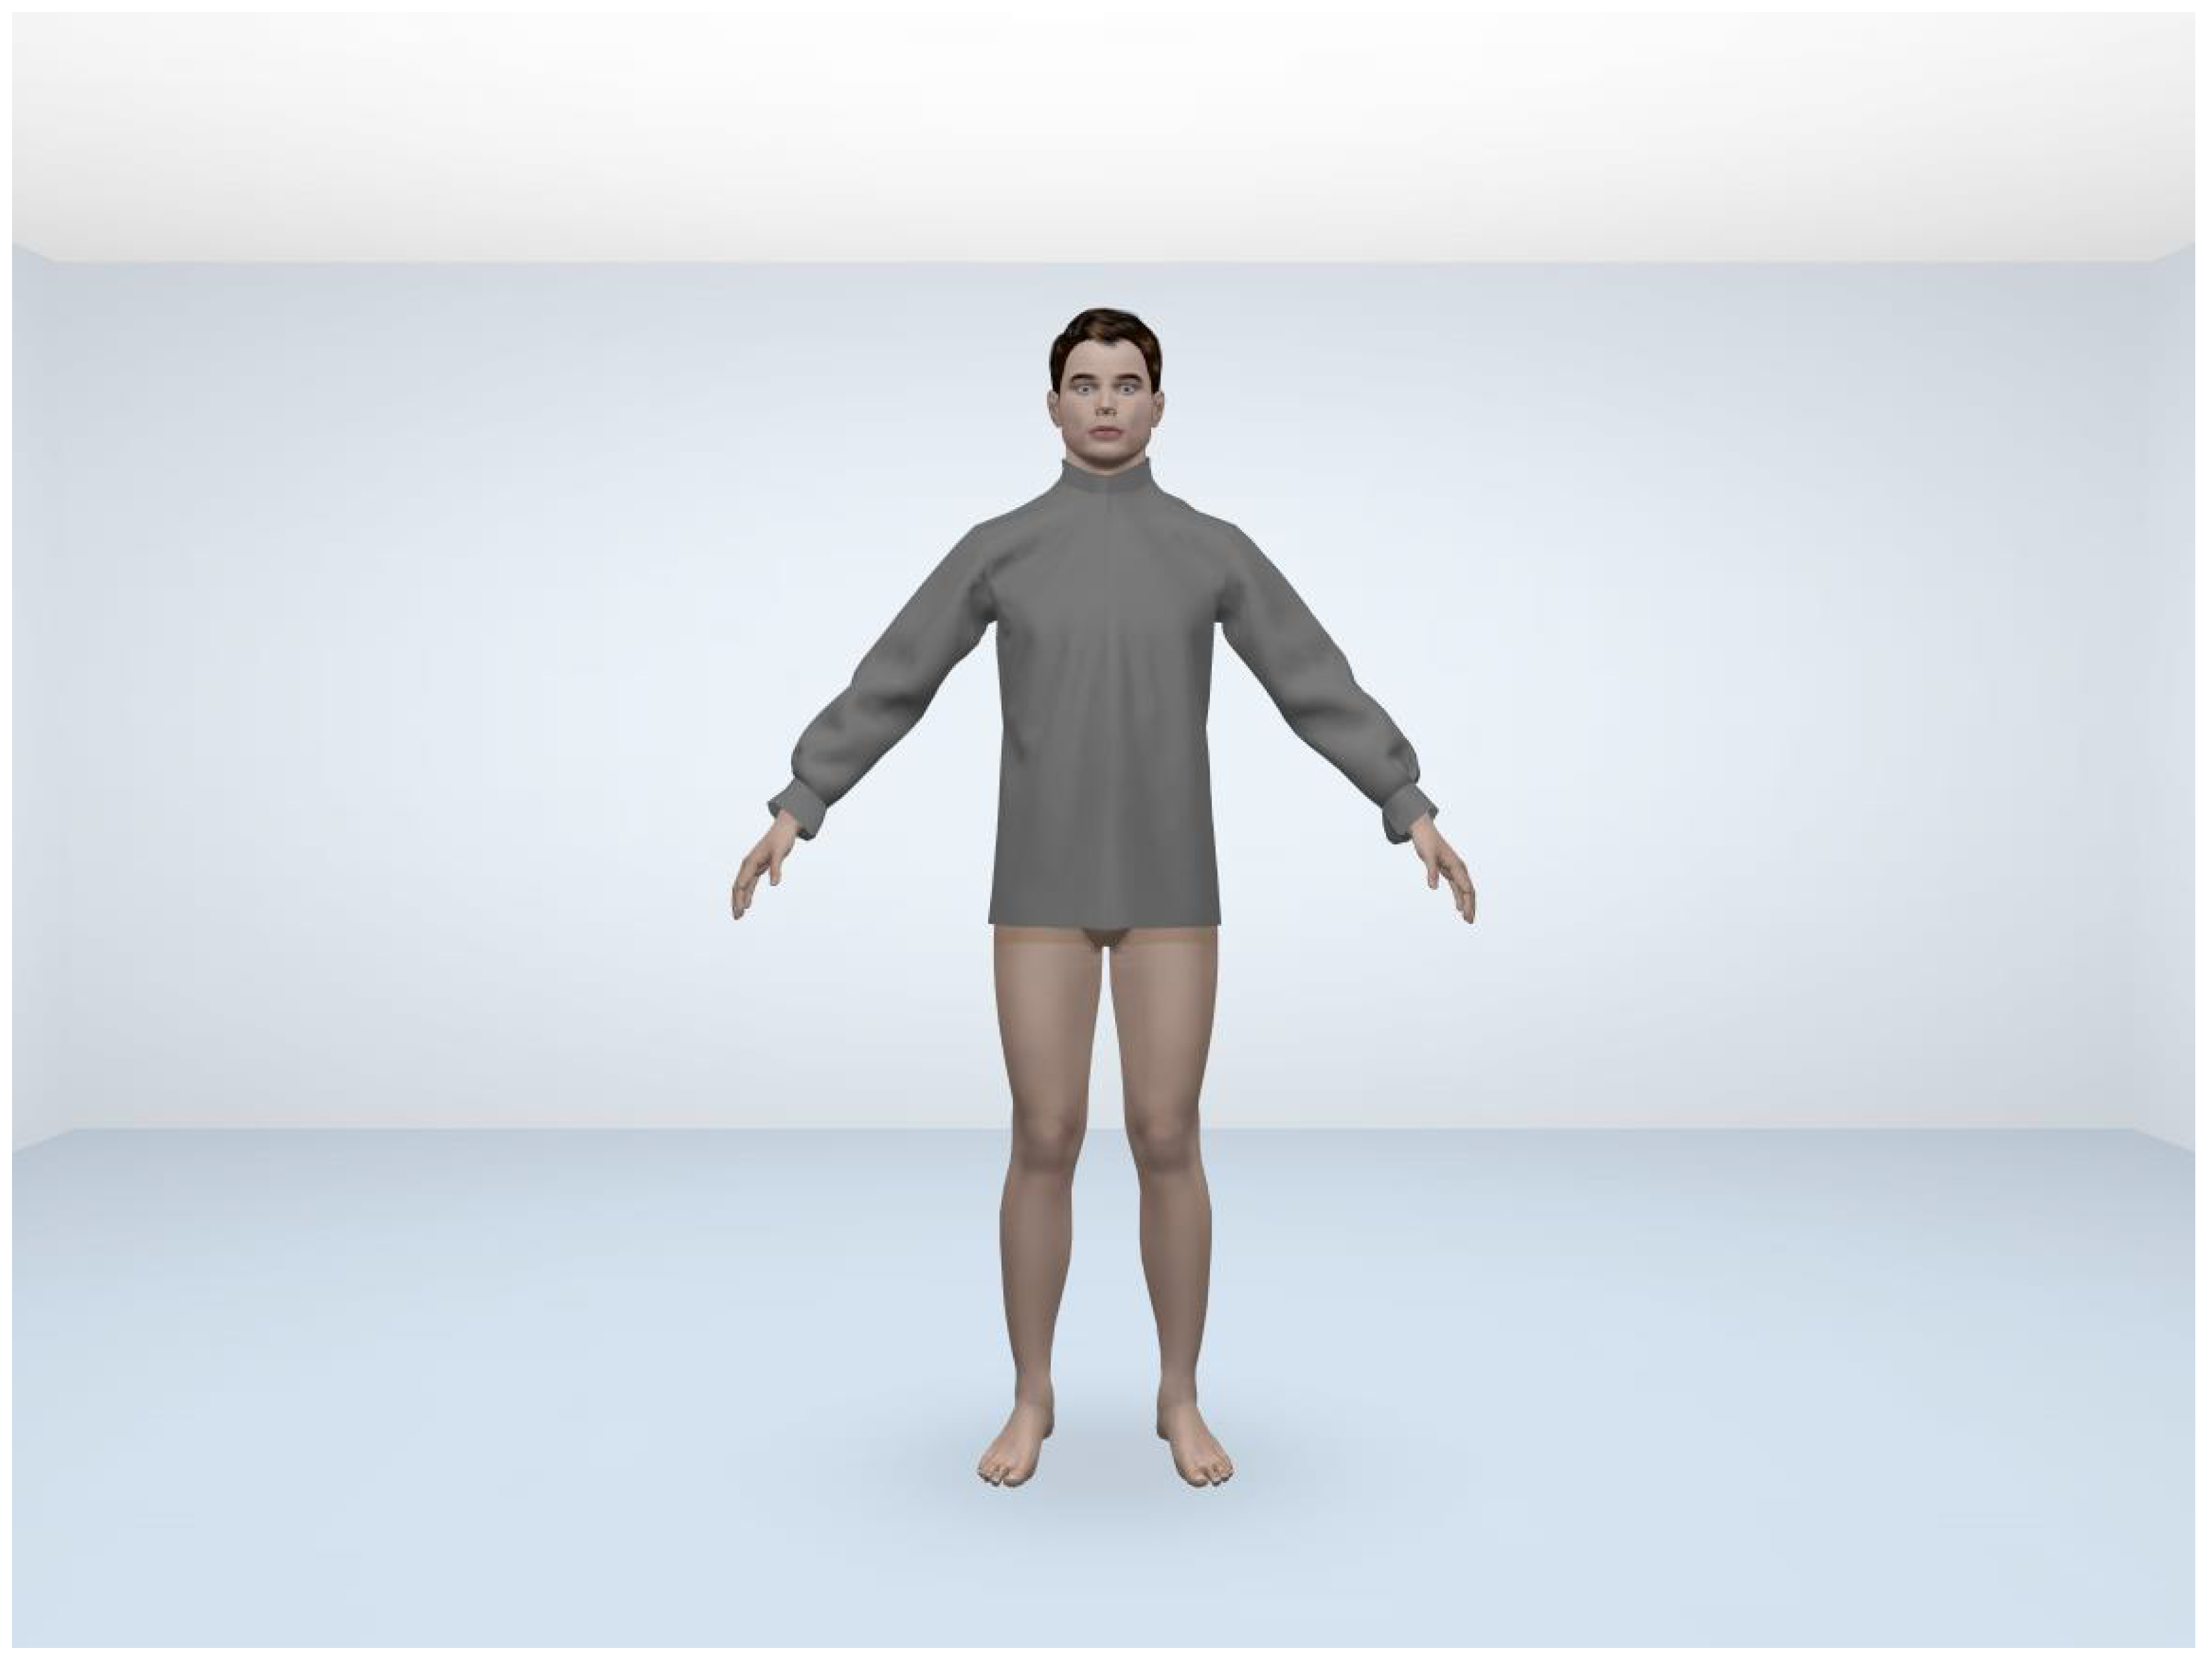
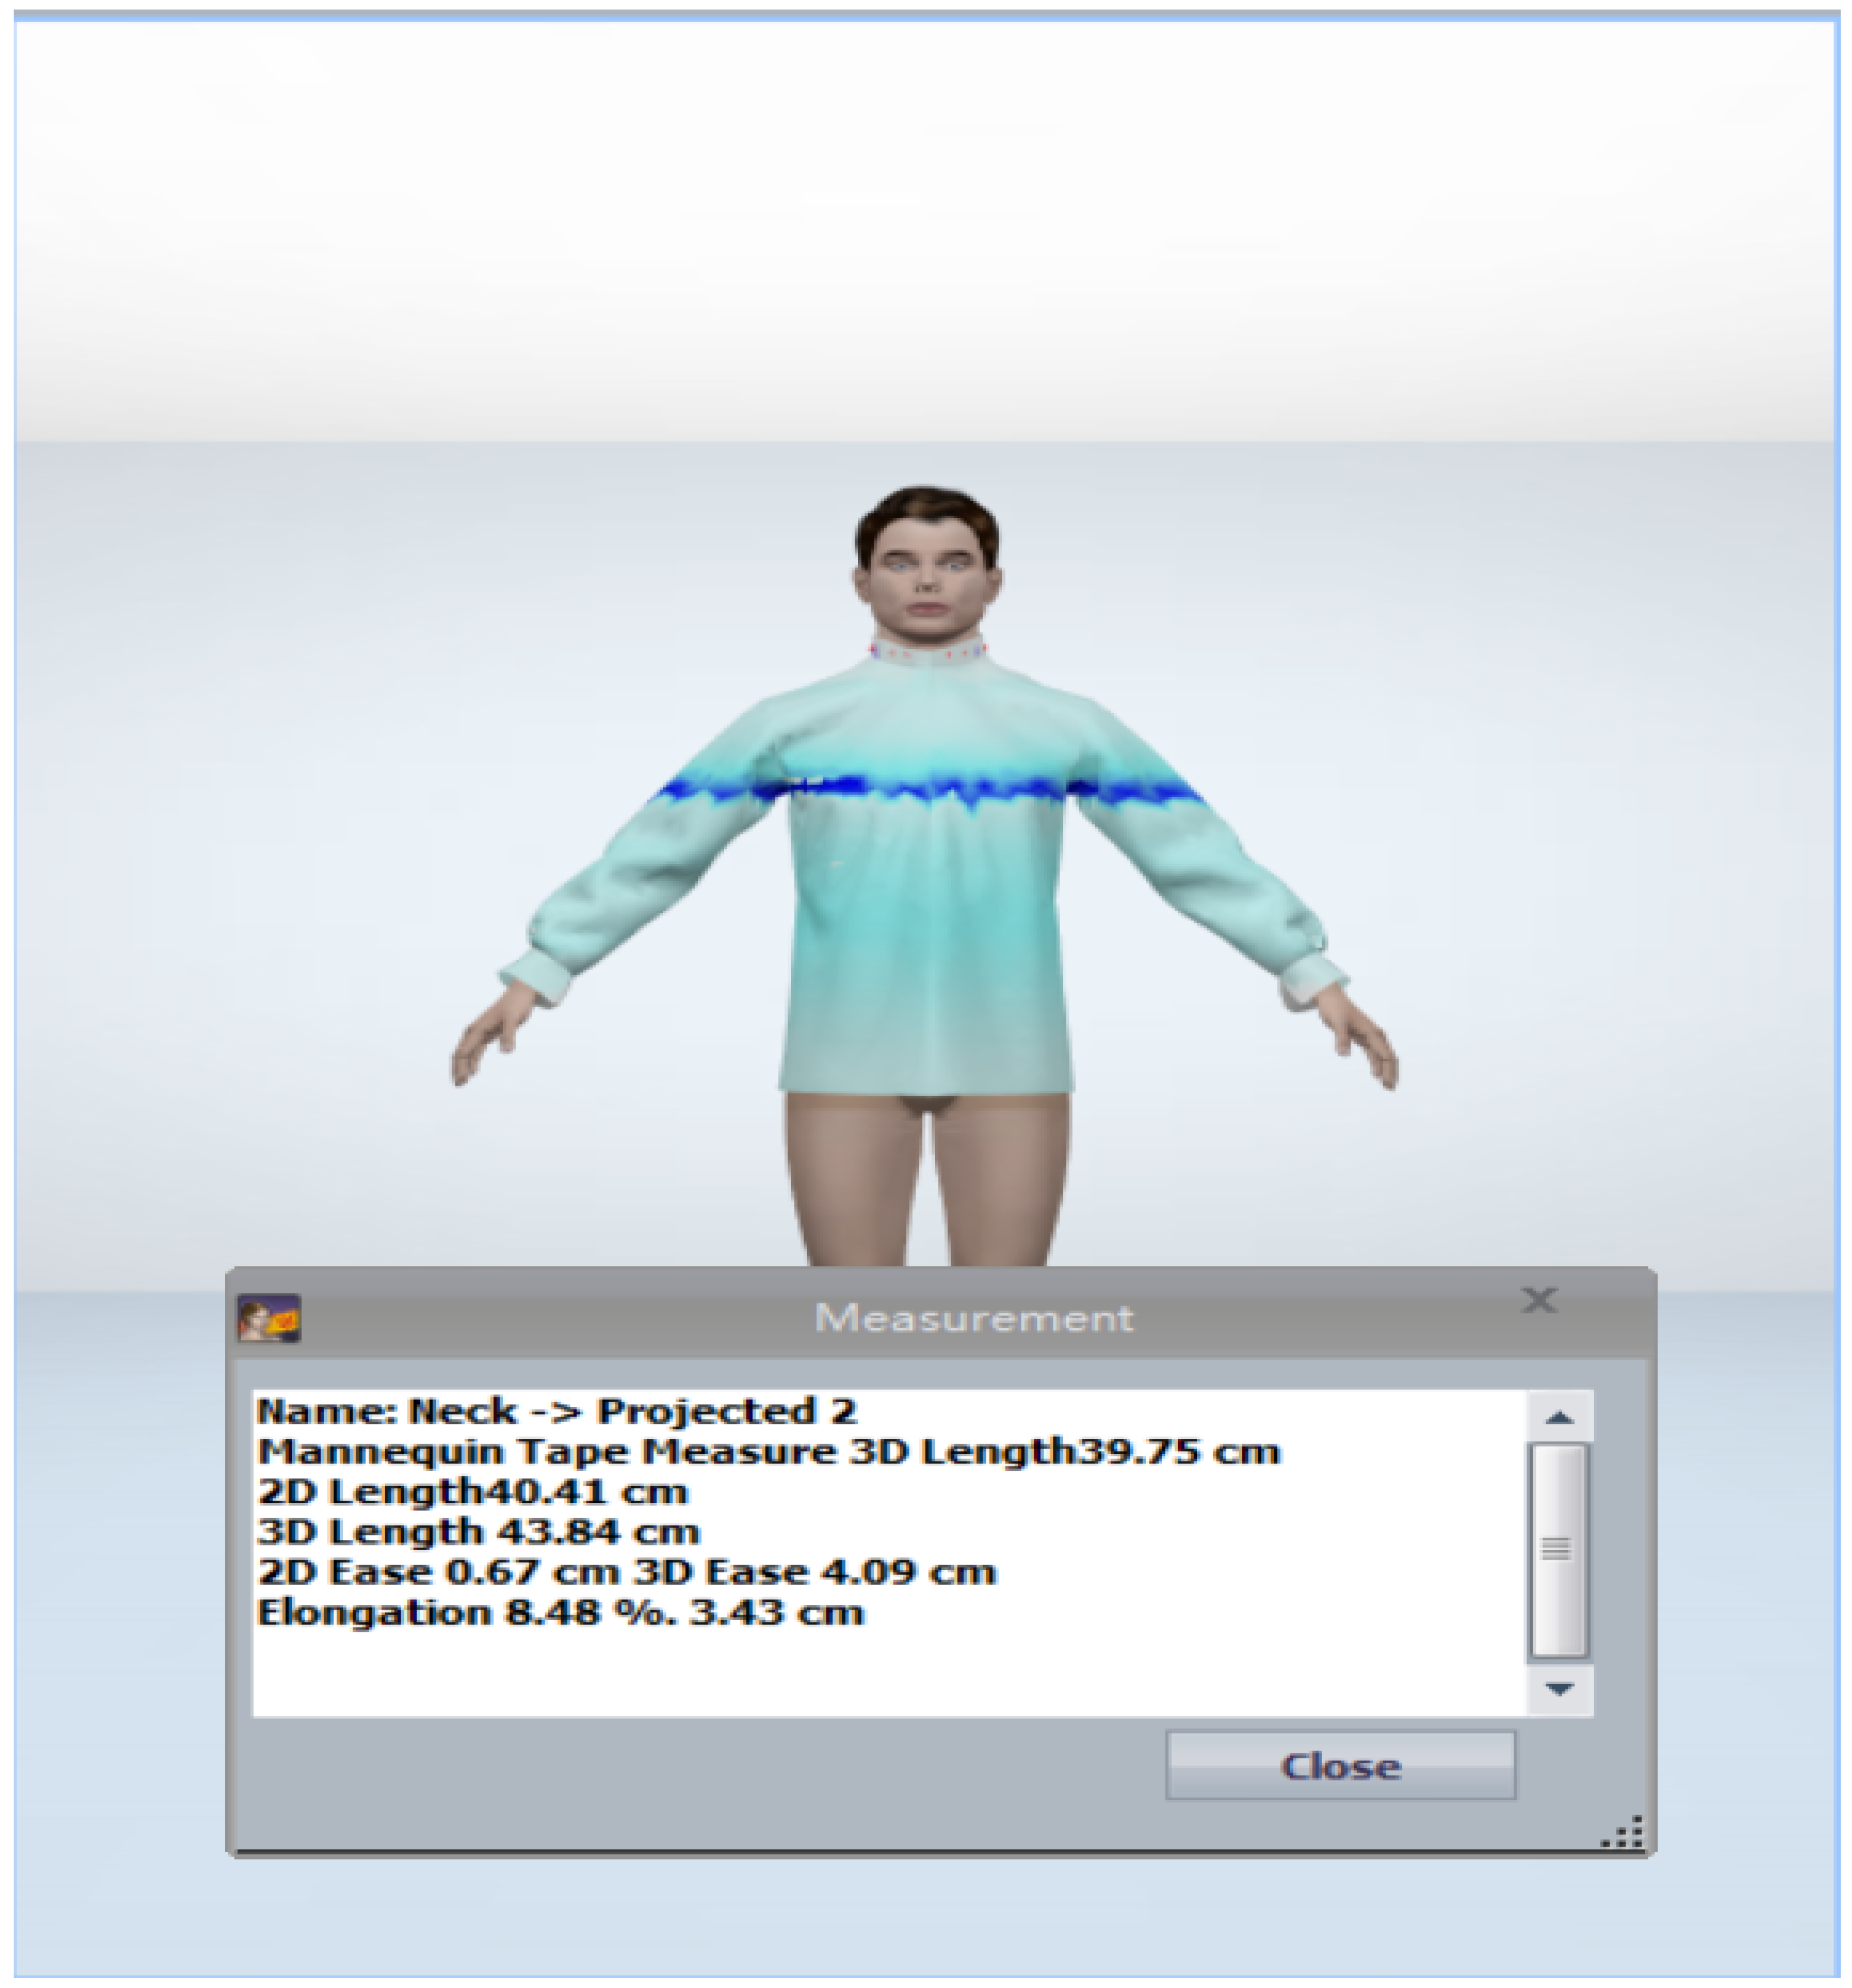
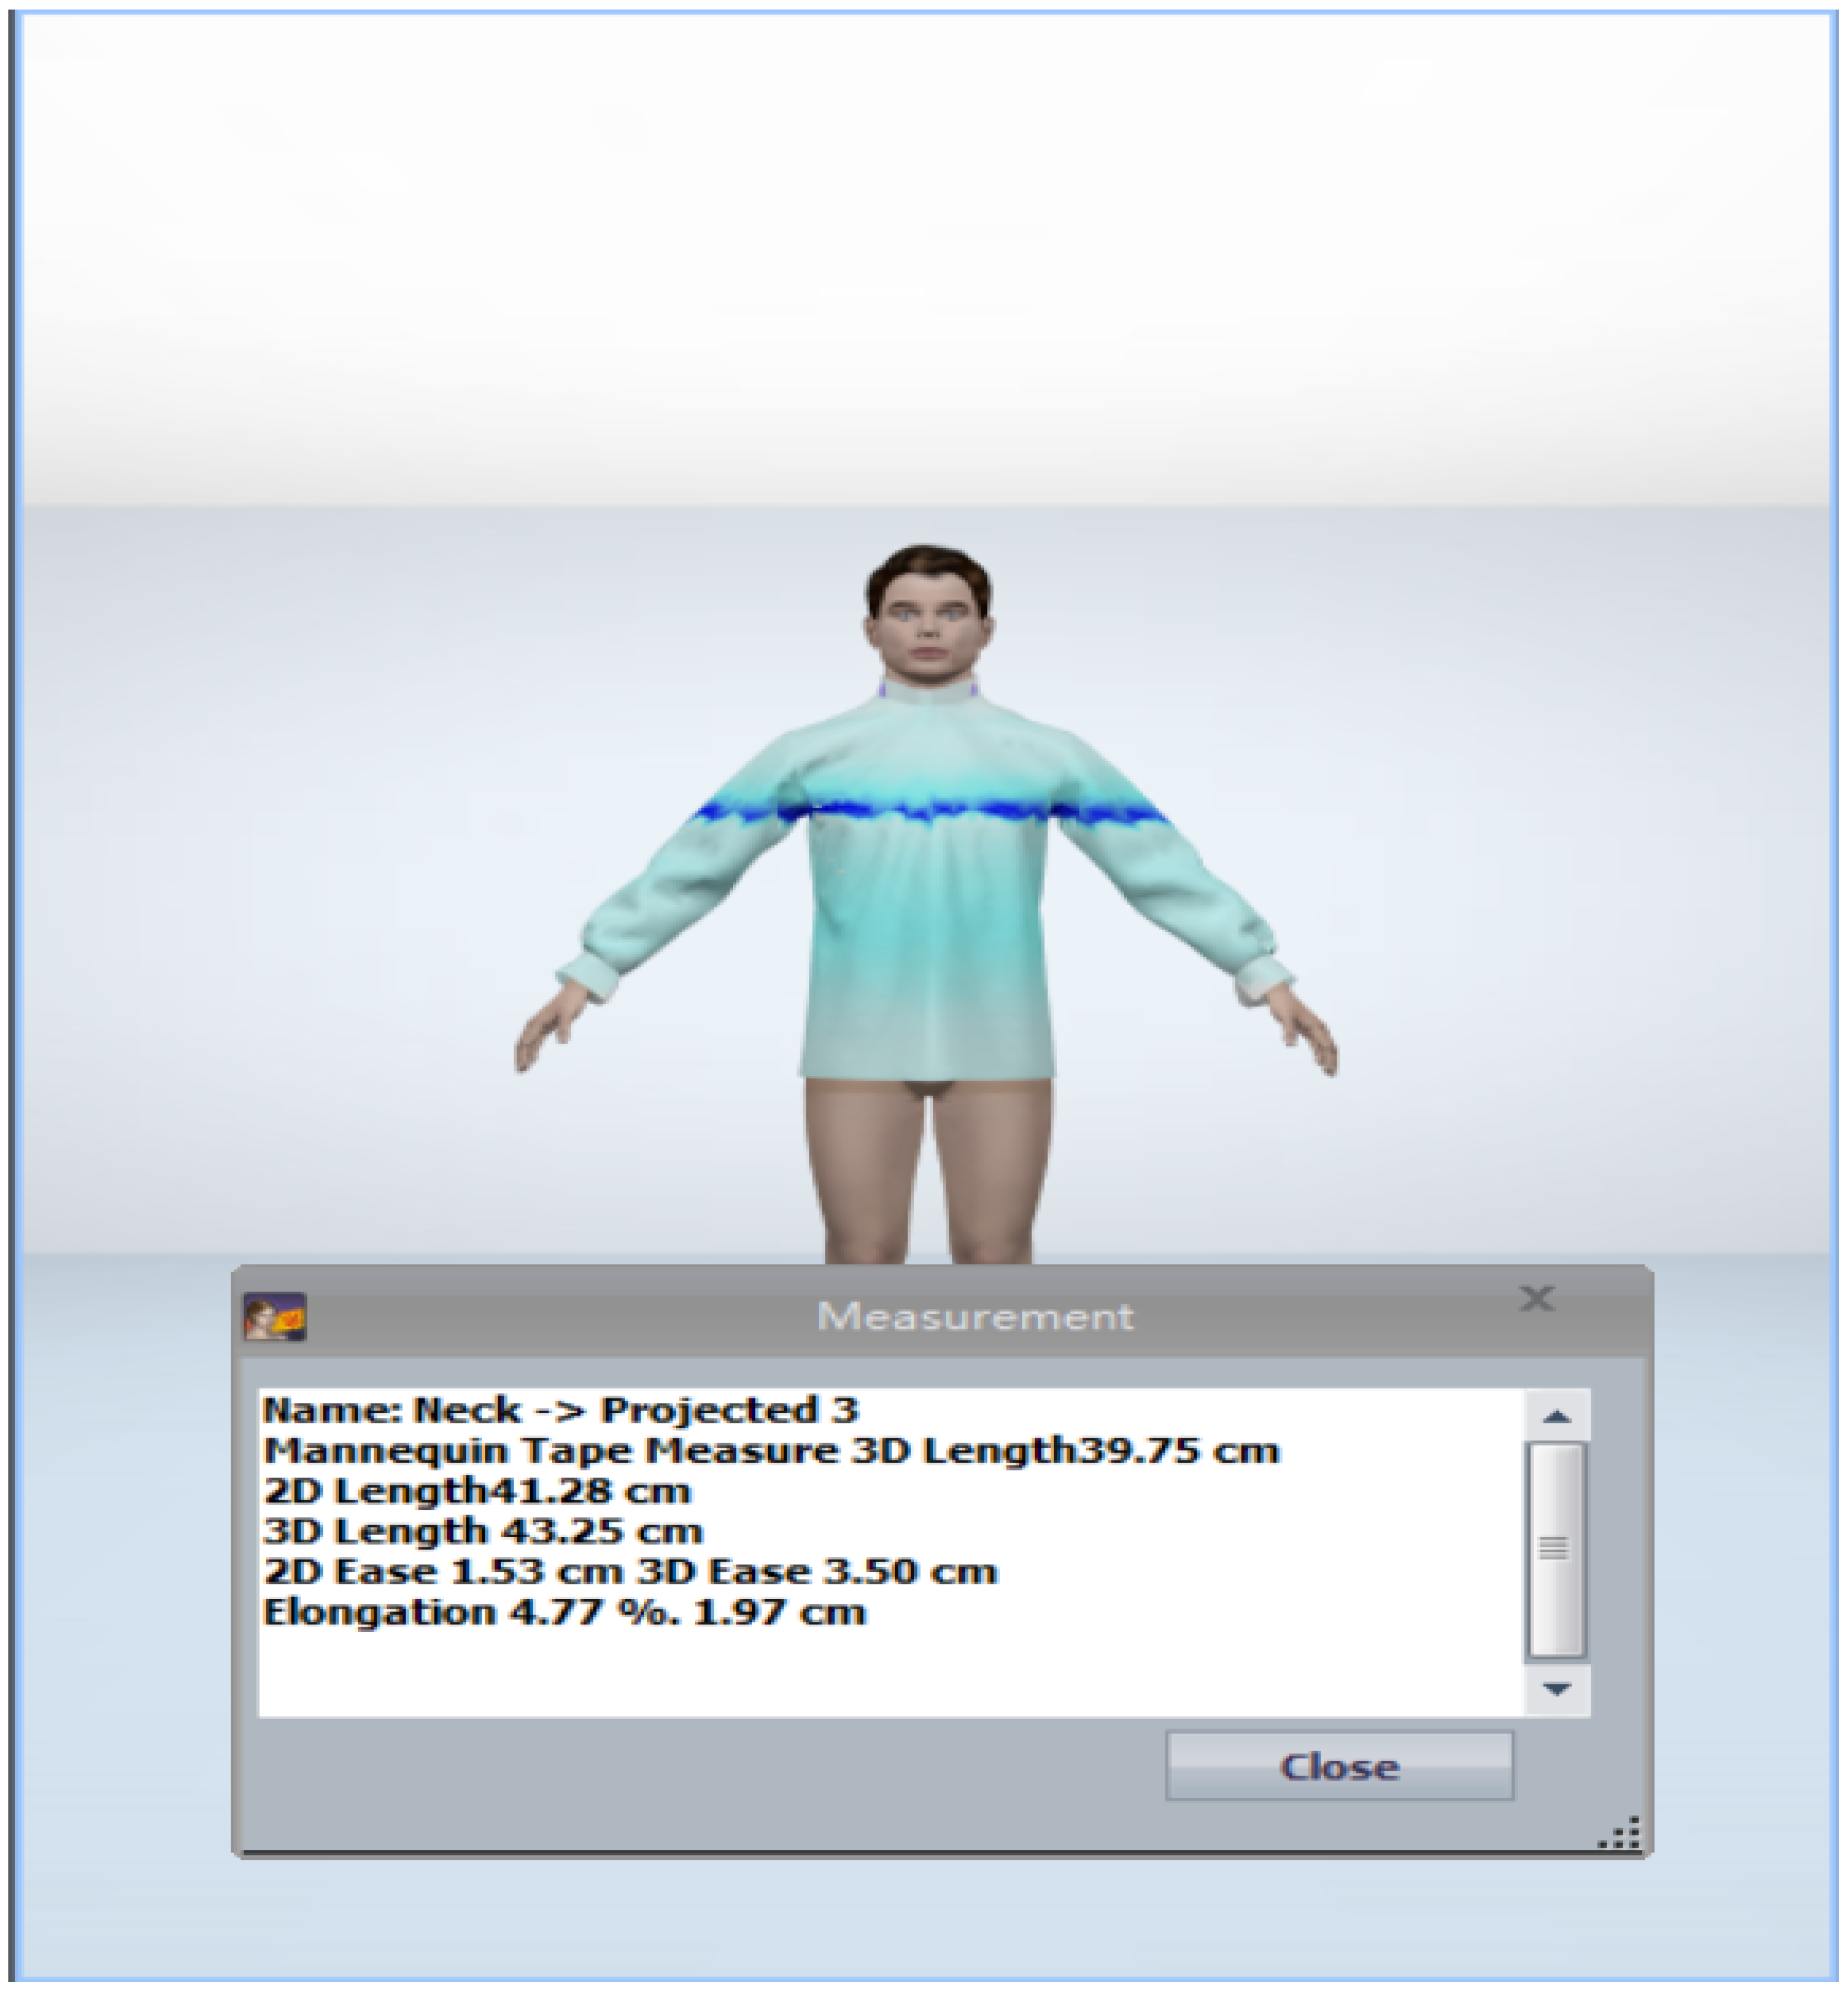
- In Section 4.3.2, point 7 set of the predicted values based on the user’s biometric profile has been carried further in Section 4.5.5, where point 3 is used to get the ease value for the key body parts specified by the professional designers. In this step, prediction values were generated using all the aforementioned five modules and has been carried further by designers to create the virtual garment in 3D CAD tool. The design solutions before and after the adjustment can be transformed into the 3D garment fitting effects and demonstrated in a virtual environment (see Figure 12 and Figure 13). In this case, the visual effects for these two design solutions are slight. However, we can see the difference by looking at the numerical parameters of the garment pressure images Figure 14 and Figure 15 that there is a difference at neck position. The neck length of the human model is 39.75 cm. The garment neck length is 43.84 cm before the adjustment and 43.25 cm after the adjustment (5 cm shorter). Its elongation value shows that the fabric has become a little tight. All these changes mean that the adjusted garment gives more fitting effects and closer to the wearer’s body surface. In the cases of tight style clothing such as legging, this change can be more evident.
- Further, we have in-cooperated the Likert scale method having rating level up to five which helps in the understanding the garment ease satisfaction level (statistics for eight shirt patterns over four body measurements and one single fabric 100% cotton). We realized after the basic pattern adjustments as shown in Table 16 that 60% of customers come under the satisfied range of the scale, out of which 21% are highly satisfied, 31% are satisfied, and 47% have no problems with the garment ease of the given design pattern. Only 40% of customers come under the dissatisfaction range of the scale for the garment ease of the given design pattern. These results, in comparison with those in Table 17, clearly show that continuous data update can clearly improve the satisfaction rate on system’s results and system’s capacity to learn from updated data, which can be evaluated effectively.
6. Conclusions
Author Contributions
Funding
Institutional Review Board Statement
Informed Consent Statement
Data Availability Statement
Acknowledgments
Conflicts of Interest
Sample Availability
References
- Vaidya, S.; Ambad, P.; Bhosle, S. Industry 4.0—A Glimpse. Procedia Manuf. 2018, 20, 233–238. [Google Scholar] [CrossRef]
- Made to Order: The Rise of Mass Personalisation|Deloitte Switzerland|Consumer Business. Available online: https://www2.deloitte.com/ch/en/pages/consumer-business/articles/made-to-order-the-rise-of-mass-personalisation.html (accessed on 29 August 2019).
- Hou, M.; Wu, L.; Chen, E.; Li, Z.; Zheng, V.W.; Liu, Q. Explainable Fashion Recommendation: A Semantic Attribute Region Guided Approach. In Proceedings of the Twenty-Eighth International Joint Conference on Artificial Intelligence. International Joint Conferences on Artificial Intelligence Organization, Macao, China, 10–16 August 2019; pp. 4681–4688. [Google Scholar] [CrossRef] [Green Version]
- Berg, A.; Amed, I.; Balchandani, A.; Andersson, J.; Hedrich, S.; Young, R. Fashion Industry Trends to Watch in 2019|McKinsey. Available online: https://www.mckinsey.com/industries/retail/our-insights/ten-trends-for-the-fashion-industry-to-watch-in-2019 (accessed on 28 August 2019).
- Viriato de Melo, E.; Nogueira, E.A.; Guliato, D. Content-Based Filtering Enhanced by Human Visual Attention Applied to Clothing Recommendation. In Proceedings of the 2015 IEEE 27th International Conference on Tools with Artificial Intelligence (ICTAI), Vietri sul Mare, Italy, 9–11 November 2015; pp. 644–651. [Google Scholar] [CrossRef]
- Zhou, W.; Zhou, Y.; Li, R.; Mok, P.Y. Fashion Recommendations Using Text Mining and Multiple Content Attributes; Václav Skala—UNION Agency: Plzen, Czech Republic, 2017. [Google Scholar]
- Isinkaye, F.; Folajimi, Y.; Ojokoh, B. Recommendation systems: Principles, methods and evaluation. Egypt. Inform. J. 2015, 16, 261–273. [Google Scholar] [CrossRef] [Green Version]
- Bennett, J.; Lanning, S.; Netflix, N. The Netflix Prize. In KDD Cup and Workshop in Conjunction with KDD. Available online: https://citeseerx.ist.psu.edu/viewdoc/download?doi=10.1.1.115.6998&rep=rep1&type=pdf (accessed on 29 August 2019).
- He, R.; McAuley, J. Ups and Downs: Modeling the Visual Evolution of Fashion Trends with One-Class Collaborative Filtering. In Proceedings of the 25th International Conference on World Wide Web—WWW ’16, Montreal, QC, Canada, 11–15 April 2016; ACM Press: New York, NY, USA, 2016; pp. 507–517. [Google Scholar] [CrossRef] [Green Version]
- Kang, W.C.; Fang, C.; Wang, Z.; McAuley, J. Visually-Aware Fashion Recommendation and Design with Generative Image Models. 2017. Available online: http://xxx.lanl.gov/abs/1711.02231 (accessed on 27 April 2021).
- Wei, J.; He, J.; Chen, K.; Zhou, Y.; Tang, Z. Collaborative Filtering and Deep Learning Based Hybrid Recommendation for Cold Start Problem. In Proceedings of the 2016 IEEE 14th International Conference on Dependable, Autonomic and Secure Computing, 14th International Conference on Pervasive Intelligence and Computing, 2nd International Conference on Big Data Intelligence and Computing and Cyber Science and Technology Congress (DASC/PiCom/DataCom/CyberSciTech), Auckland, New Zealand, 8–12 August 2016; pp. 874–877. [Google Scholar] [CrossRef] [Green Version]
- Balabanović, M.; Shoham, Y. Fab: Content-based, collaborative recommendation. Commun. ACM 1997, 40, 66–72. [Google Scholar] [CrossRef]
- Panagiotakis, C.; Papadakis, H.; Fragopoulou, P. A dual hybrid recommender system based on SCoR and the random forest. Comput. Sci. Inf. Syst. 2020, 18, 46. [Google Scholar] [CrossRef]
- Tsujita, H.; Tsukada, K.; Kambara, K.; Siio, I. Complete Fashion Coordinator: A Support System for Capturing and Selecting Daily Clothes with Social Networks. In Proceedings of the International Conference on Advanced Visual Interfaces, Roma, Italy, 26–28 May 2010; pp. 127–132. [Google Scholar]
- Jaradat, S. Deep cross-domain fashion recommendation. In Proceedings of the Eleventh ACM Conference on Recommender Systems, Como, Italy, 27–31 August 2017; pp. 407–410. [Google Scholar]
- He, J.; Chu, W.W. A social network-based recommender system (SNRS). In Data Mining for Social Network Data; Springer: Berlin/Heidelberg, Germany, 2010; pp. 47–74. [Google Scholar]
- Wong, W.K.; Zeng, X.; Au, W. A decision support tool for apparel coordination through integrating the knowledge-based attribute evaluation expert system and the T–S fuzzy neural network. Expert Syst. Appl. 2009, 36, 2377–2390. [Google Scholar] [CrossRef]
- Mok, P.; Xu, J.; Wang, X.; Fan, J.; Kwok, Y.; Xin, J.H. An IGA-based design support system for realistic and practical fashion designs. Comput. Aided Des. 2013, 45, 1442–1458. [Google Scholar] [CrossRef]
- Zhang, T.; Ramakrishnan, R.; Livny, M. BIRCH: An efficient data clustering databases method for very large. ACM SIGMOD Int. Conf. Manag. Data 1996, 1, 103–114. [Google Scholar] [CrossRef]
- Gomes, H.M.; Bifet, A.; Read, J.; Barddal, J.P.; Enembreck, F.; Pfharinger, B.; Holmes, G.; Abdessalem, T. Adaptive random forests for evolving data stream classification. Mach. Learn. 2017, 106, 1469–1495. [Google Scholar] [CrossRef]
- Krawczyk, B.; Minku, L.L.; Gama, J.; Stefanowski, J.; Woźniak, M. Ensemble learning for data stream analysis: A survey. Inf. Fusion 2017, 37, 132–156. [Google Scholar] [CrossRef] [Green Version]
- Sim, J.; Wright, C.C. The Kappa Statistic in Reliability Studies: Use, Interpretation, and Sample Size Requirements. Phys. Ther. 2005, 85, 257–268. [Google Scholar] [CrossRef] [PubMed] [Green Version]
- Ho, G.T.; Lau, H.C.; Lee, C.K.; Ip, A.W. An intelligent forward quality enhancement system to achieve product customization. Ind. Manag. Data Syst. 2005. [Google Scholar] [CrossRef]
- Larose, D.T. Data Mining and Predictive Analytics; John Wiley & Sons: Hoboken, NJ, USA, 2015. [Google Scholar]
- Tan, P.; Steinback, M.; Kumar, V. Association Analysis: Basic Concepts and Algorithms, Introduction to Data Mining. 2005. Available online: http://pzs.dstu.dp.ua/DataMining/assoc/bibl/IntroductiontoDataMing.pdf (accessed on 15 March 2021).
- Agrawal, R.; Srikant, R. Fast algorithms for mining association rules. In Proceedings of the 20th International Conference on Very Large Data Bases, San Jose, CA, USA, 12–15 September 1994; Volume 1215, pp. 487–499. [Google Scholar]
- Hu, J.; Chan, Y.F. Effect of fabric mechanical properties on drape. Text. Res. J. 1998, 68, 57–64. [Google Scholar] [CrossRef]
- Cui, F.; Zhang, X.; Wang, L. Study of the relationship between jacket-business wear fitness and fabric drape. In Proceedings of the 3rd International Symposium of Textile Bioengineering and Informatics, Shanghai, China, 28–30 May 2010; pp. 1299–1306. [Google Scholar]
- Lim, H.; Istook, C.L. Drape simulation of three-dimensional virtual garment enabling fabric properties. Fibers Polym. 2011, 12, 1077–1082. [Google Scholar] [CrossRef]
- Behera, B.K.; Hari, P. Woven Textile Structure: Theory and Applications; Elsevier: Amsterdam, The Netherlands, 2010. [Google Scholar]
- Thomassey, S.; Bruniaux, P. A template of ease allowance for garments based on a 3D reverse methodology. Int. J. Ind. Ergon. 2013, 43, 406–416. [Google Scholar] [CrossRef]
- Liu, K.; Zeng, X.; Bruniaux, P.; Tao, X.; Yao, X.; Li, V.; Wang, J. 3D interactive garment pattern-making technology. Comput. Aided Des. 2018, 104, 113–124. [Google Scholar] [CrossRef]
- Cho, Y.S.; Tsuchiya, K.; Takatera, M.; Inui, S.; Park, H.; Shimizu, Y. Computerized pattern making focus on fitting to 3D human body shapes. Int. J. Cloth. Sci. Technol. 2010. [Google Scholar] [CrossRef] [Green Version]
- Bianchini, M.; Frasconi, P.; Gori, M. Learning without local minima in radial basis function networks. IEEE Trans. Neural Netw. 1995, 6, 749–756. [Google Scholar] [CrossRef] [PubMed] [Green Version]
- Sun, T.Y.; Liu, C.C.; Lin, C.L.; Hsieh, S.T.; Huang, C.S. A Radial Basis Function Neural Network with Adaptive Structure via Particle Swarm Optimization. 2009. Available online: https://www.researchgate.net/profile/Tsung-Ying-Sun/publication/221787794_A_Radial_Basis_Function_Neural_Network_with_Adaptive_Structure_via_Particle_Swarm_Optimization/links/0912f50f7689d67cb5000000/A-Radial-Basis-Function-Neural-Network-with-Adaptive-Structure-via-Particle-Swarm-Optimization.pdf (accessed on 1 September 2020).
- PetraVidnerova. PetraVidnerova/rbf_keras. Available online: https://github.com/PetraVidnerova/rbf_keras (accessed on 2 September 2020).
- Ko, C.N.; Lee, C.M. Short-term load forecasting using SVR (support vector regression)-based radial basis function neural network with dual extended Kalman filter. Energy 2013, 49, 413–422. [Google Scholar] [CrossRef]
Not applicable |


| Fit | Cluster_0 | Cluster_1 |
|---|---|---|
| Super Slim Fit | 1112 | 136 |
| Comfort fit | 357 | 770 |
| Regular | 1752 | 771 |
| Total | 3221 | 1677 |
| Mean Performance | Cluster 1 | Cluster 2 |
|---|---|---|
| arf—Accuracy | 0.7298 | 0.7773 |
| arf—Kappa | 0.4405 | 0.587 |
| Cluster 1 | ||
|---|---|---|
| Fitting type | FrequentItemset count | support |
| ComfortFit | 16 | 10–87% |
| Regular | 58 | 10–100% |
| SuperSlimFit | 15 | 10–92% |
| Cluster 2 | ||
| ComfortFit | 23 | 10–89% |
| Regular | 58 | 10–100% |
| SuperSlimFit | 19 | 10–89% |
| Cluster 1 | |||
|---|---|---|---|
| Fitting type | Number of Rules count | support | confidence |
| ComfortFit | 5 | 11–46% | 91–97% |
| Regular | 39 | 11–50% | 87–100% |
| SuperSlimFit | 4 | 10–42% | 93–96% |
| Cluster 2 | |||
| ComfortFit | 7 | 10–27% | 89–95% |
| Regular | 35 | 12–35% | 80–100% |
| SuperSlimFit | 5 | 11–23% | 90–100% |
| Id | Antecedent | Consequent | Confidence | Lift |
|---|---|---|---|---|
| 1 | {’Square 2 Buttons _cuff’} | {’Classic Point _collar’} | 0.875 | 3.44 |
| 2 | {’Square 2 Buttons _cuff’, ’15_735.2BENGO2_20_fabric’} | {’Classic Point _collar’} | 0.875 | 3.44 |
| 3 | {’Square 2 Buttons _cuff’} | {’Classic Point _collar’, ’15_735.2BENGO2_20_fabric’} | 0.875 | 3.44 |
| 4 | {’Italian Semi-Spread_collar’, ’Round Single_cuff’} | {’n_collarwhite’} | 1 | 1.072 |
| 5 | {’Italian Semi-Spread_collar’, ’15_735.2BENGO2_20_fabric’, ’Round Single_cuff’} | {’n_collarwhite’} | 1 | 1.072 |
| 6 | {’Italian Semi-Spread_collar’, ’Round Single_cuff’} | {’n_collarwhite’, ’15_735.2BENGO2_20_fabric’} | 1 | 1.072 |
| 7 | {’Hai Cutaway_collar’, ’Round Single_cuff’} | {’n_collarwhite’} | 1 | 1.072 |
| 8 | {’Hai Cutaway_collar’, ’15_735.2BENGO2_20_fabric’, ’Round Single_cuff’} | {’n_collarwhite’} | 1 | 1.072 |
| 9 | {’Hai Cutaway_collar’, ’Round Single_cuff’} | {’n_collarwhite’, ’15_735.2BENGO2_20_fabric’} | 1 | 1.072 |
| 10 | {’Classic Point _collar’, ’Round Single_cuff’} | {’n_collarwhite’} | 1 | 1.072 |
| 11 | {’Classic Point _collar’, ’15_735.2BENGO2_20_fabric’, ’Round Single_cuff’} | {’n_collarwhite’} | 1 | 1.072 |
| 12 | {’Classic Point _collar’, ’Round Single_cuff’} | {’n_collarwhite’, ’15_735.2BENGO2_20_fabric’} | 1 | 1.072 |
| 13 | {’Double inc. Cufflinks_cuff’} | {’n_collarwhite’} | 1 | 1.072 |
| 14 | {’Double inc. Cufflinks_cuff’, ’15_735.2BENGO2_20_fabric’} | {’n_collarwhite’} | 1 | 1.072 |
| 15 | {’Double inc. Cufflinks_cuff’} | {’n_collarwhite’, ’15_735.2BENGO2_20_fabric’} | 1 | 1.072 |
| 16 | {’Round Single_cuff’} | {’n_collarwhite’} | 0.9677 | 1.038 |
| 17 | {’15_735.2BENGO2_20_fabric’, ’Round Single_cuff’} | {’n_collarwhite’} | 0.967 | 1.038 |
| 18 | {’Round Single_cuff’} | {’n_collarwhite’, ’15_735.2BENGO2_20_fabric’} | 0.967 | 1.038 |
| 19 | {’Classic Point_collar’, ’Round Single_cuff’} | {’n_collarwhite’} | 0.95 | 1.023 |
| 20 | {’Double inc. Cufflinks_cuff’} | {’n_collarwhite’} | 0.94 | 1.014 |
| 21 | {’Round Single_cuff’} | {’n_collarwhite’} | 0.93 | 1.00 |
| 3D Mannequin’s Key Body Measurement for Shirt | |||||
|---|---|---|---|---|---|
| No | Across Back | Across Front | Bust | Waist | Pelvis |
| 1 | 34.71 | 37.04 | 86.98 | 87.98 | 73.89 |
| 2 | 35.71 | 38.11 | 90.99 | 91.87 | 78 |
| 3 | 36.73 | 39.85 | 95 | 95.96 | 82.01 |
| 4 | 37.75 | 40.3 | 99.01 | 99.99 | 86.02 |
| 5 | 38.86 | 41.49 | 103 | 104 | 90.04 |
| 6 | 39.29 | 41.95 | 107 | 107.83 | 94 |
| 7 | 40.67 | 43.42 | 110.99 | 111.41 | 98.01 |
| 8 | 41.47 | 44.29 | 114.97 | 115 | 102.21 |
| Id | Size | Size Unit | Length | Breat Girth | Sleeve Length | Sleeve Opening |
|---|---|---|---|---|---|---|
| 1 | 38 | cm | 62.00 | 82.00 | 63.00 | 16.00 |
| 2 | 40 | cm | 64.00 | 86.00 | 64.00 | 17.20 |
| 3 | 42 | cm | 66.00 | 90.00 | 65.00 | 18.40 |
| 4 | 44 | cm | 68.00 | 94.00 | 66.00 | 19.60 |
| 5 | 46 | cm | 70.00 | 98.00 | 67.00 | 20.80 |
| 6 | 48 | cm | 72.00 | 102.00 | 68.00 | 22.00 |
| 7 | 50 | cm | 74.00 | 106.00 | 69.00 | 23.20 |
| 8 | 52 | cm | 76.00 | 110.00 | 70.00 | 24.40 |
| Key Body Parts Pattern Measurements for Shirt | |||||
|---|---|---|---|---|---|
| Across Back | Across Front | Bust | Waist | Pelvis | Size |
| 44.33 | 44.69 | 91.89 | 103.88 | 104.49 | 38 |
| 44.93 | 46.03 | 96.54 | 107.6 | 109.12 | 40 |
| 46 | 47.46 | 96.47 | 111.29 | 112.39 | 42 |
| 47.11 | 48.09 | 98.31 | 115.07 | 116.27 | 44 |
| 48.36 | 49.53 | 100.12 | 118.82 | 120.42 | 46 |
| 49.48 | 50.65 | 102.02 | 122.87 | 122.96 | 48 |
| 50.71 | 51.49 | 104.4 | 126.2 | 127.16 | 50 |
| 52.09 | 52.59 | 107.78 | 130.53 | 131.09 | 52 |
| Id | W | C | TH | BR1 | BR2 | TREMT1 | TREMT2 | TRLT1 |
|---|---|---|---|---|---|---|---|---|
| 1 | 95.00 | 100% Cotton | 0.05 | 5.89 | 3.56 | 2.85 | 6.27 | 0.76 |
| 2 | 288.00 | 100% Wool | 0.07 | 17.66 | 11.77 | 5.80 | 3.94 | 0.69 |
| 3 | 32.00 | 100% Silk | 0.05 | 0.74 | 0.34 | 4.35 | 16.70 | 0.80 |
| 4 | 342.00 | 100% Cotton | 0.05 | 34.64 | 21.46 | 9.23 | 5.18 | 0.69 |
| 5 | 192.00 | 94% Cotton 5% Polymid 1% Elasthane | 0.06 | 9.93 | 8.71 | 4.73 | 27.23 | 0.65 |
| Id | TRLT2 | TRWT1 | TRWT2 | SRG1 | SRG2 | SRT1 | SRT2 |
|---|---|---|---|---|---|---|---|
| 1 | 0.67 | 5.30 | 10.35 | 0.81 | 0.81 | 14.72 | 14.72 |
| 2 | 0.70 | 9.76 | 6.77 | 1.72 | 1.53 | 14.72 | 14.72 |
| 3 | 0.81 | 0.85 | 3.33 | 0.17 | 0.17 | 9.81 | 9.81 |
| 4 | 0.66 | 15.65 | 8.39 | 3.37 | 3.01 | 49.05 | 49.05 |
| 5 | 0.53 | 7.51 | 36.94 | 1.84 | 1.35 | 15.00 | 15.00 |
| Abbreviation | Description | Abbreviation | Description |
|---|---|---|---|
| W | Weight | TR LT2 | TensileResistanceLTWeft |
| C | Composition | TR WT1 | TensileResistanceWTWarp |
| Th | Thickness (unit cm) | TR WT2 | TensileResistanceWTWeft |
| BR1 | BendingResistanceWarp | SR G1 | ShearingResistanceGWarp |
| BR2 | BendingResistanceWeft | SR G2 | ShearingResistanceGWeft |
| TR EMT1 | TensileResistanceEMTWarp | SR T1 | ShearingResistanceTWarp |
| TR EMT2 | TensileResistanceEMTWeft | SR T2 | ShearingResistanceTWeft |
| TR LT1 | TensileResistanceLTWarp |
| Epoch | Sigma | Mse | Accuracy |
|---|---|---|---|
| 500 | 0.1 | 0.0188 | 0.7578 |
| 500 | 0.25 | 0.0079 | 0.793 |
| 500 | 0.5 | 0.0058 | 0.793 |
| 500 | 1 | 0.0028 | 0.8047 |
| 500 | 1.25 | 0.0027 | 0.7969 |
| 500 | 1.5 | 0.0070 | 0.7617 |
| 500 | 1.75 | 0.0153 | 0.7383 |
| 500 | 2 | 0.0418 | 0.6562 |
| 500 | 2.25 | 0.1161 | 0.4883 |
| 500 | 2.5 | 0.2044 | 0.5234 |
| 500 | 2.75 | 0.3204 | 0.4531 |
| 500 | 3 | 0.3391 | 0.3711 |
| Epoch | Loss | Accuracy | Mse | Val_loss | Val_accuracy | Val_mse |
|---|---|---|---|---|---|---|
| 0 | 1.025581 | 0.191406 | 1.025581 | 0.876186 | 0.171875 | 0.876186 |
| 1 | 1.020244 | 0.195312 | 1.020244 | 0.873400 | 0.171875 | 0.873400 |
| 2 | 1.016299 | 0.199219 | 1.016299 | 0.870802 | 0.171875 | 0.870802 |
| 3 | 1.012945 | 0.199219 | 1.012945 | 0.868433 | 0.171875 | 0.868433 |
| 4 | 1.009710 | 0.207031 | 1.009710 | 0.866253 | 0.171875 | 0.866253 |
| .. | ... | ... | ... | ... | ... | ... |
| 495 | 0.002823 | 0.808594 | 0.002823 | 0.012917 | 0.765625 | 0.012917 |
| 496 | 0.002815 | 0.804688 | 0.002815 | 0.012571 | 0.781250 | 0.012571 |
| 497 | 0.002913 | 0.808594 | 0.002913 | 0.012797 | 0.765625 | 0.012797 |
| 498 | 0.002861 | 0.804688 | 0.002861 | 0.012664 | 0.765625 | 0.012664 |
| 499 | 0.002823 | 0.804688 | 0.002823 | 0.012685 | 0.781250 | 0.012685 |
| BPNN | ||||||
|---|---|---|---|---|---|---|
| Epoch | Loss | Accuracy | Mse | Val_loss | Val_accuracy | Val_mse |
| 0 | 1.255189 | 0.230469 | 1.255189 | 0.973620 | 0.140625 | 0.973620 |
| 1 | 1.065259 | 0.234375 | 1.065259 | 0.823501 | 0.140625 | 0.823501 |
| 2 | 0.909692 | 0.230469 | 0.909692 | 0.702508 | 0.140625 | 0.702508 |
| 3 | 0.780366 | 0.234375 | 0.780366 | 0.598431 | 0.109375 | 0.598431 |
| 4 | 0.669734 | 0.234375 | 0.669734 | 0.511944 | 0.093750 | 0.511944 |
| .. | ... | ... | ... | ... | ... | ... |
| 495 | 0.005829 | 0.683594 | 0.005829 | 0.006387 | 0.671875 | 0.006387 |
| 496 | 0.005823 | 0.687500 | 0.005823 | 0.006382 | 0.671875 | 0.006382 |
| 497 | 0.005820 | 0.687500 | 0.005820 | 0.006380 | 0.671875 | 0.006380 |
| 498 | 0.005809 | 0.683594 | 0.005809 | 0.006372 | 0.671875 | 0.006372 |
| 499 | 0.005803 | 0.683594 | 0.005803 | 0.006365 | 0.671875 | 0.006365 |
| RBFNN | ||||||
|---|---|---|---|---|---|---|
| Epoch | Loss | Accuracy | Mse | Val_loss | Val_accuracy | Val_mse |
| 499 | 0.002823 | 0.804688 | 0.002823 | 0.012685 | 0.781250 | 0.012685 |
| BPNN | ||||||
| Epoch | Loss | Accuracy | Mse | Val_loss | Val_accuracy | Val_mse |
| 499 | 0.005803 | 0.683594 | 0.005803 | 0.006365 | 0.671875 | 0.006365 |
| Average High Satisfaction Range | 60% | Average Lower Satisfaction Range | 40% |
| Extremely satisfied | 21% | Slightly satisfied | 69% |
| Very satisfied | 31% | Not at all satisfied | 30% |
| Satisfied | 41% |
| Average High Satisfaction Range | 53% | Average Lower Satisfaction Range | 46% |
| Extremely satisfied | 35% | Slightly satisfied | 40% |
| Very satisfied | 30% | Not at all satisfied | 60% |
| Satisfied | 35% |
Publisher’s Note: MDPI stays neutral with regard to jurisdictional claims in published maps and institutional affiliations. |
© 2021 by the authors. Licensee MDPI, Basel, Switzerland. This article is an open access article distributed under the terms and conditions of the Creative Commons Attribution (CC BY) license (https://creativecommons.org/licenses/by/4.0/).
Share and Cite
Sharma, S.; Koehl, L.; Bruniaux, P.; Zeng, X.; Wang, Z. Development of an Intelligent Data-Driven System to Recommend Personalized Fashion Design Solutions. Sensors 2021, 21, 4239. https://doi.org/10.3390/s21124239
Sharma S, Koehl L, Bruniaux P, Zeng X, Wang Z. Development of an Intelligent Data-Driven System to Recommend Personalized Fashion Design Solutions. Sensors. 2021; 21(12):4239. https://doi.org/10.3390/s21124239
Chicago/Turabian StyleSharma, Shukla, Ludovic Koehl, Pascal Bruniaux, Xianyi Zeng, and Zhujun Wang. 2021. "Development of an Intelligent Data-Driven System to Recommend Personalized Fashion Design Solutions" Sensors 21, no. 12: 4239. https://doi.org/10.3390/s21124239