Bidirectional, Bimodal Ultrasonic Lamb Wave Sensing in a Composite Plate Using a Polarization-Maintaining Fiber Bragg Grating


Abstract
:1. Introduction
2. Overview of Lamb Waves and Polarization-Maintaining Fiber Bragg Grating
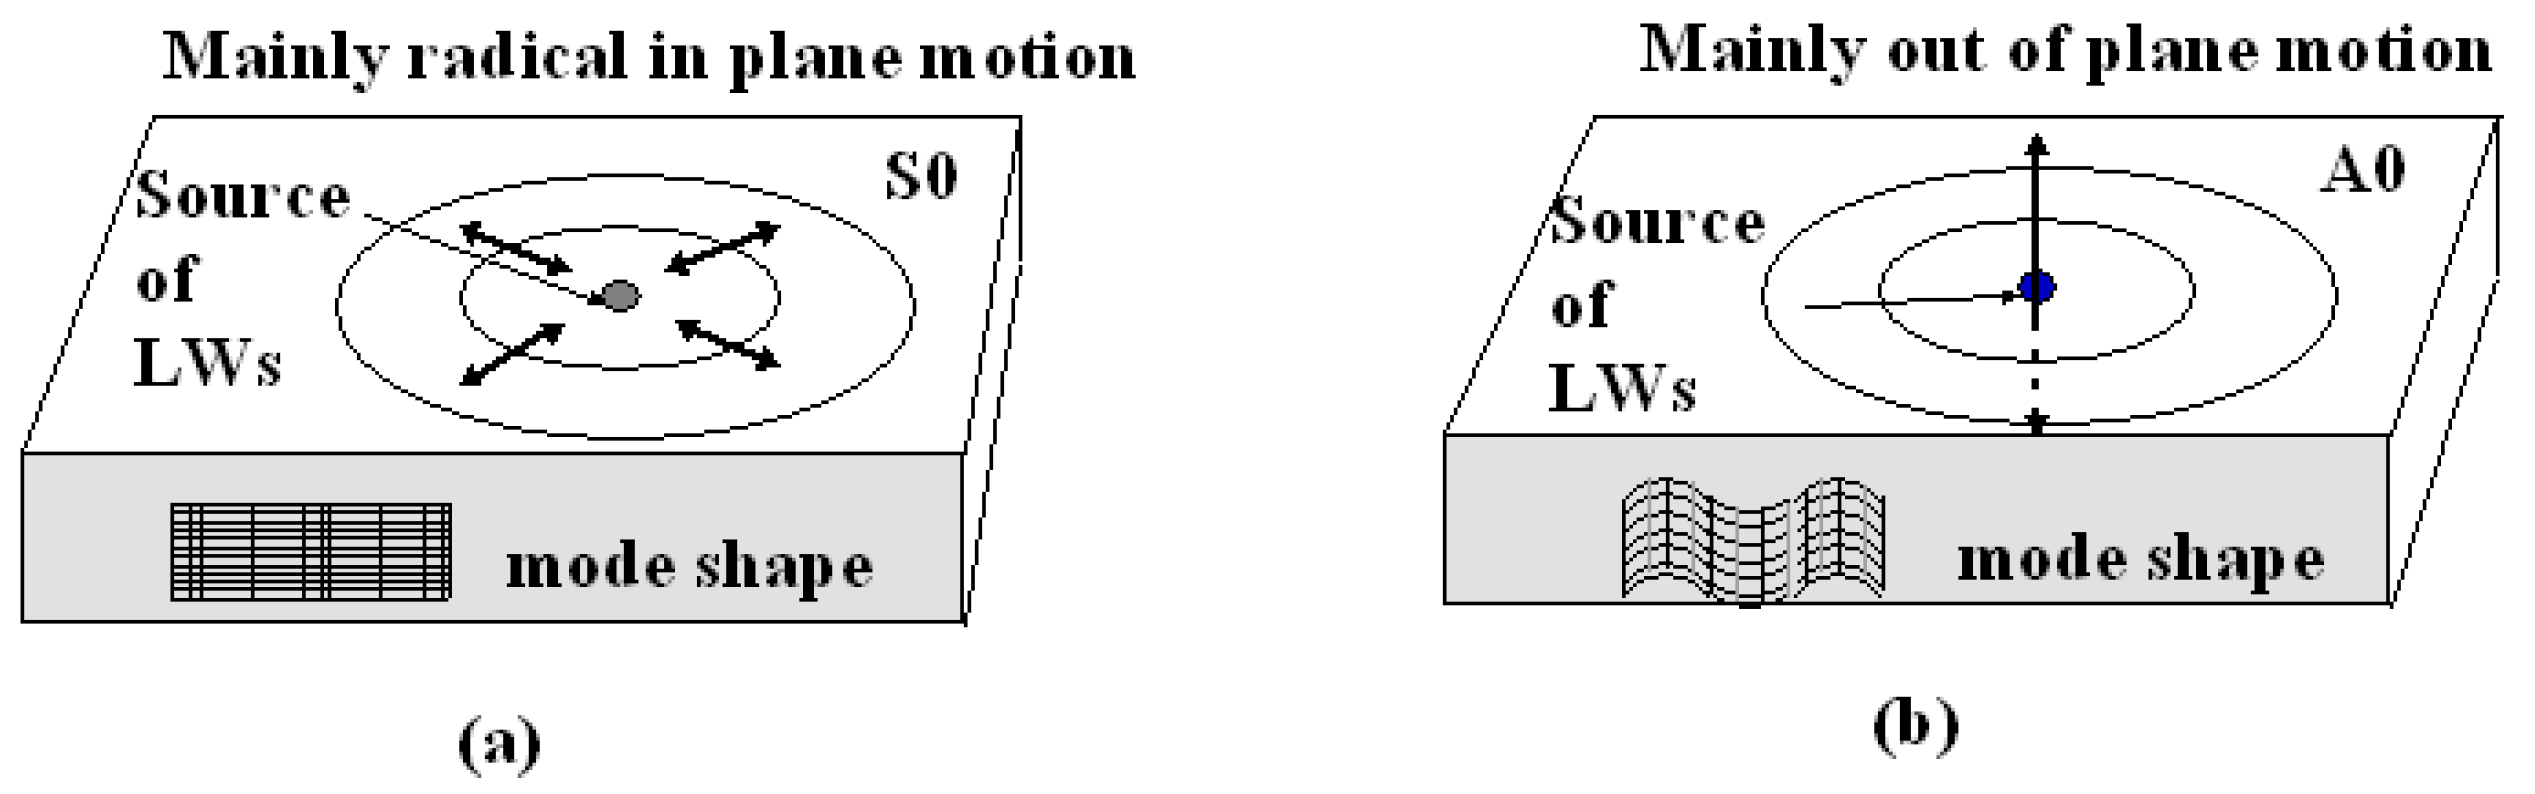
2.1. Ultrasonic Lamb Waves in Composite
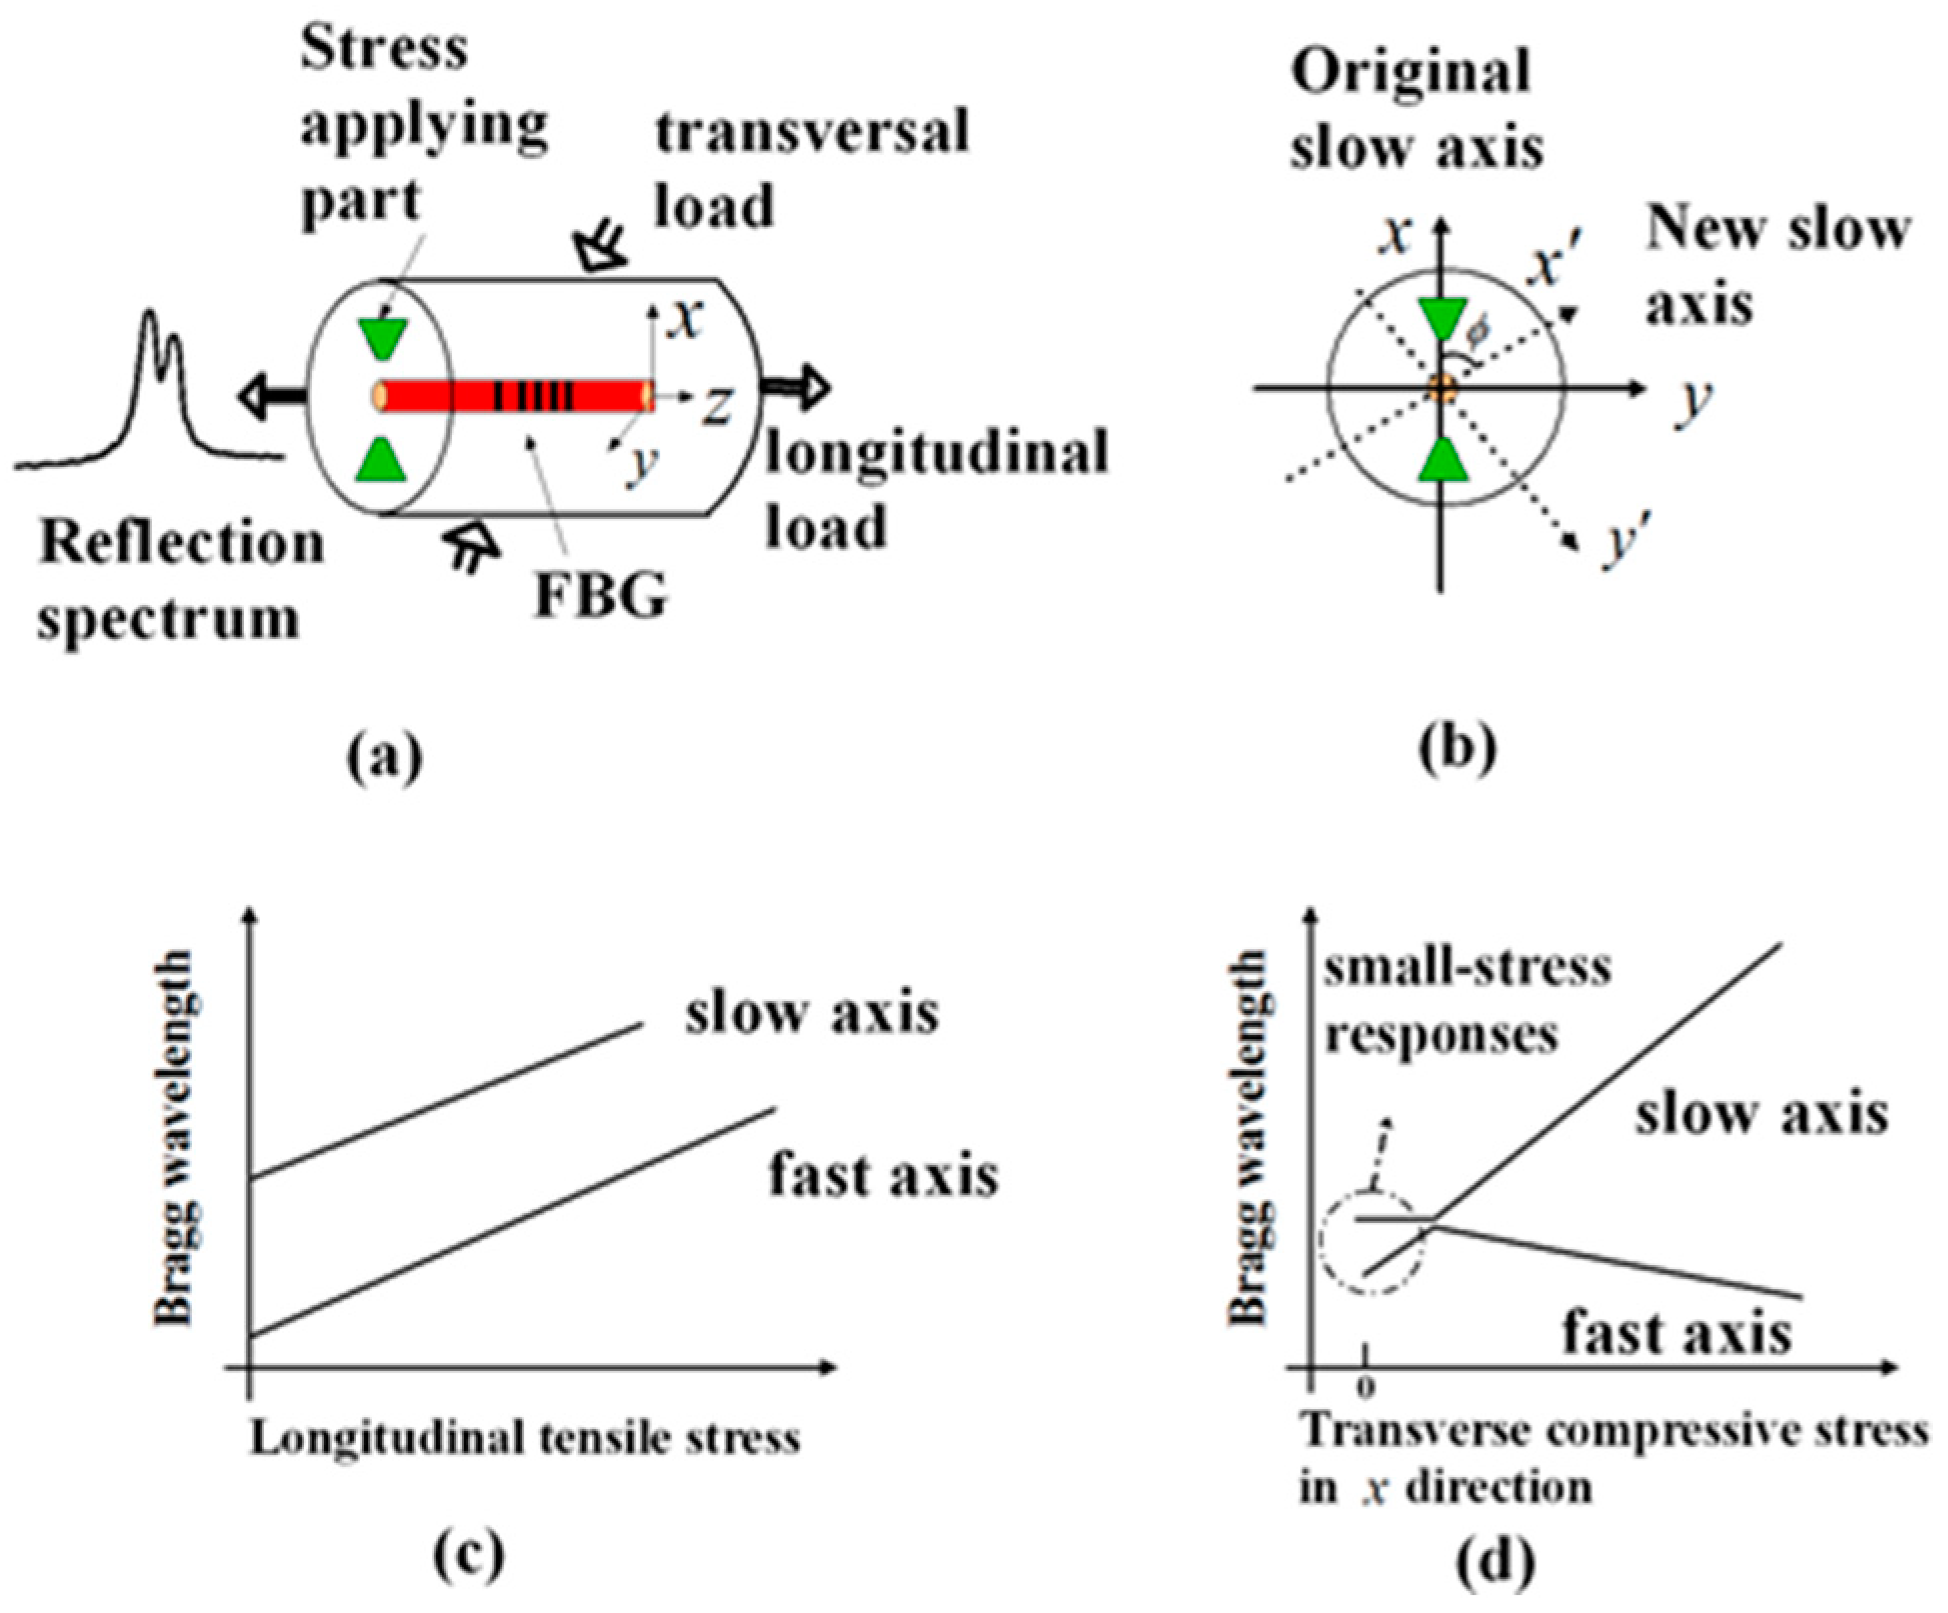
2.2. PM-FBG-Based Strain Sensors
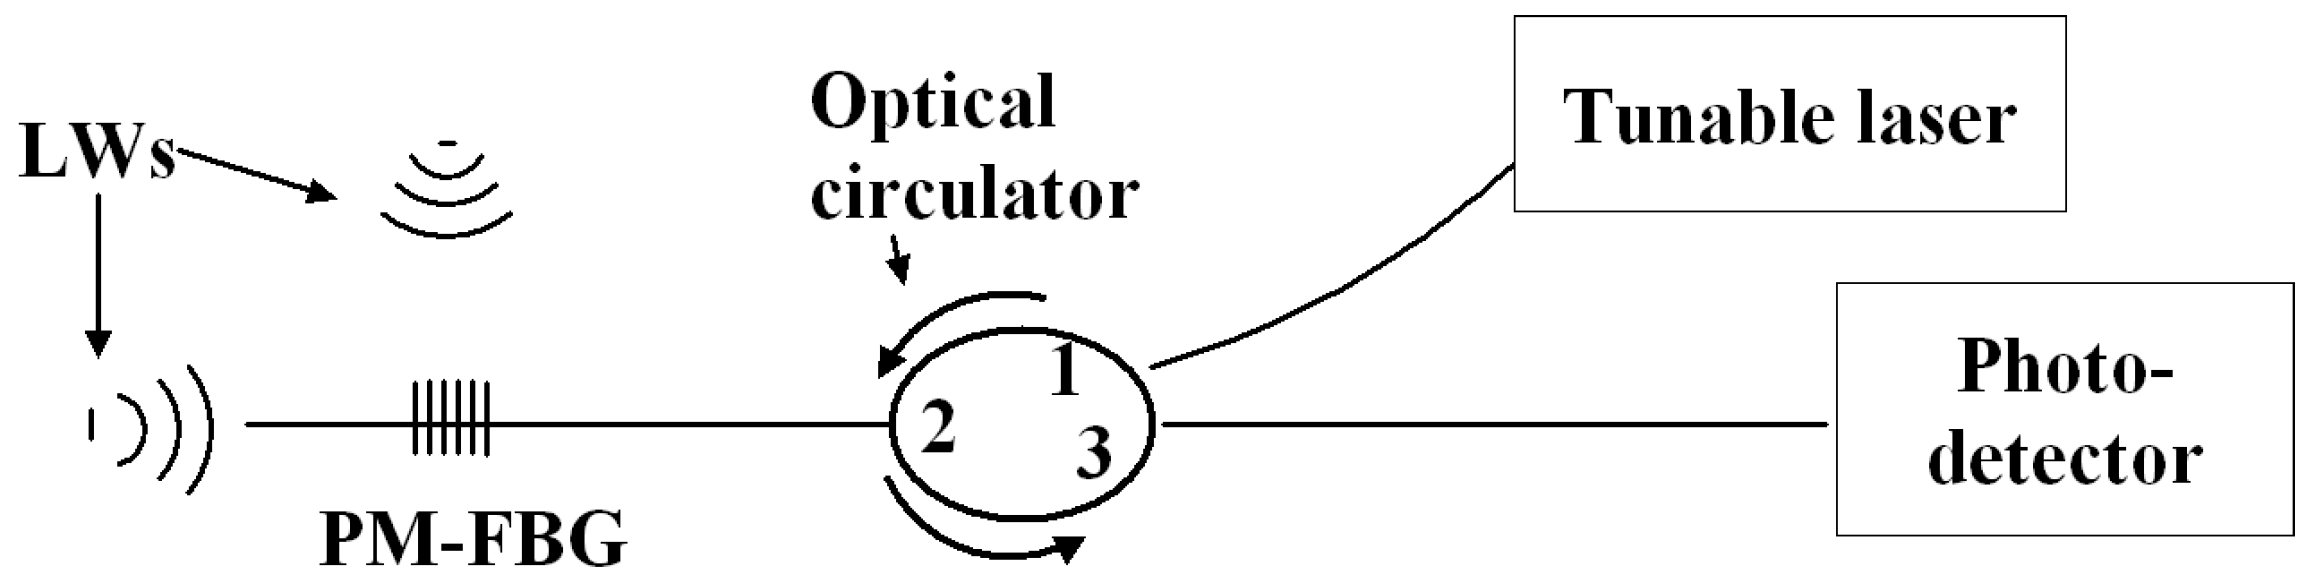
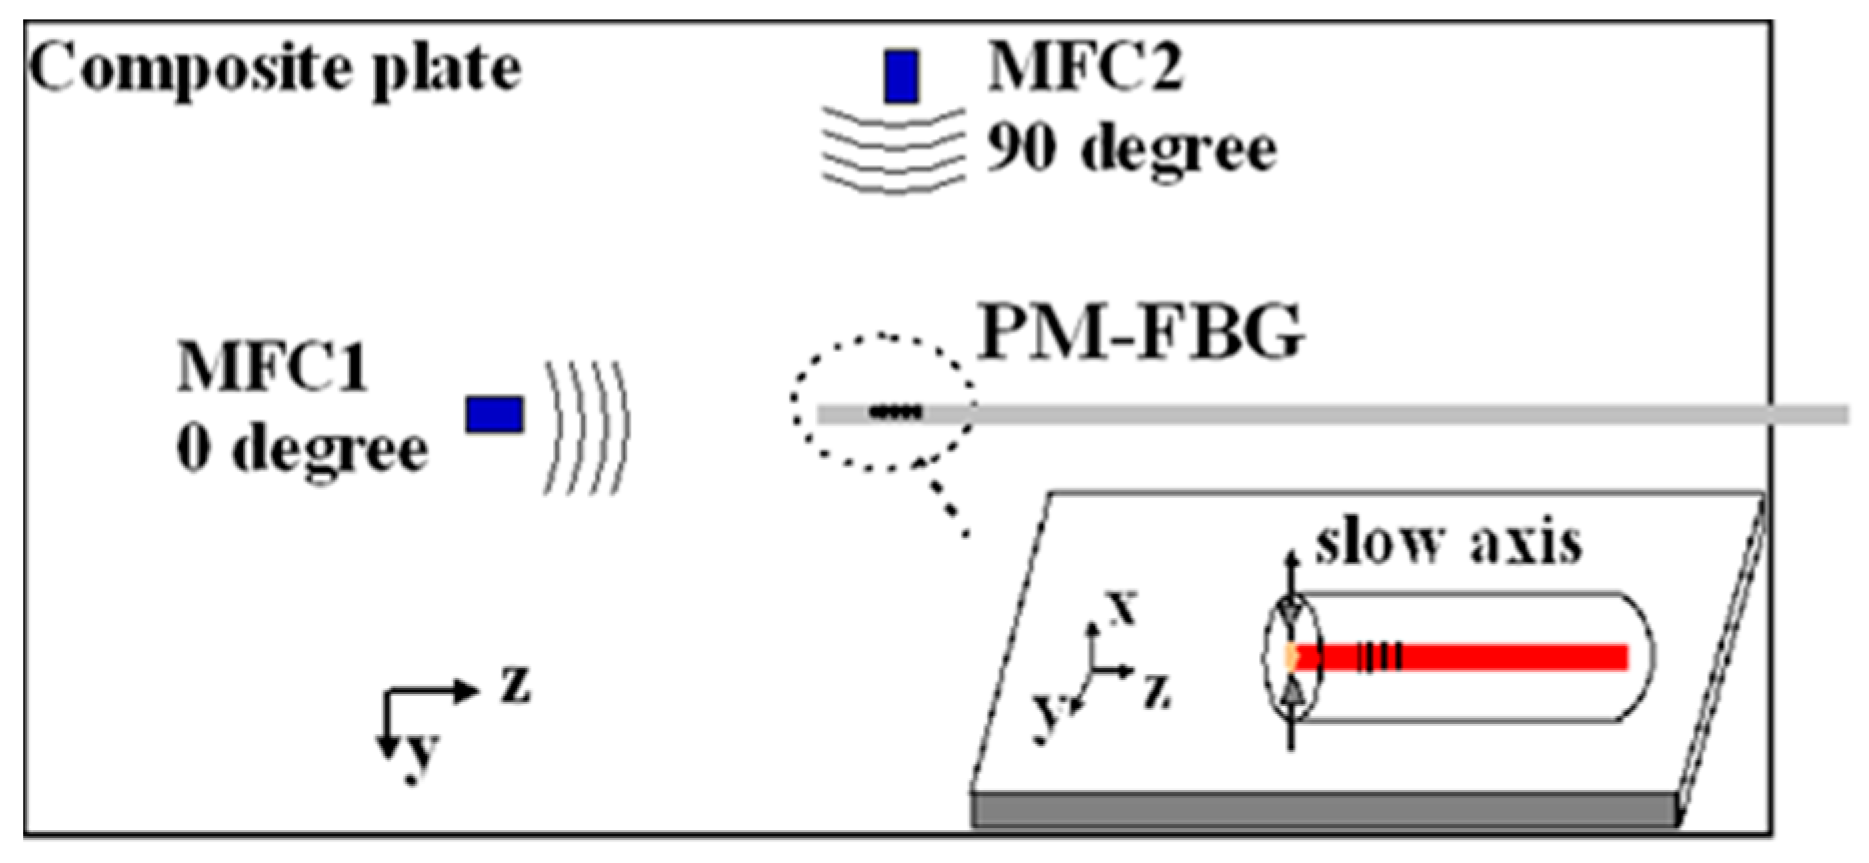
3. Experimental Setup
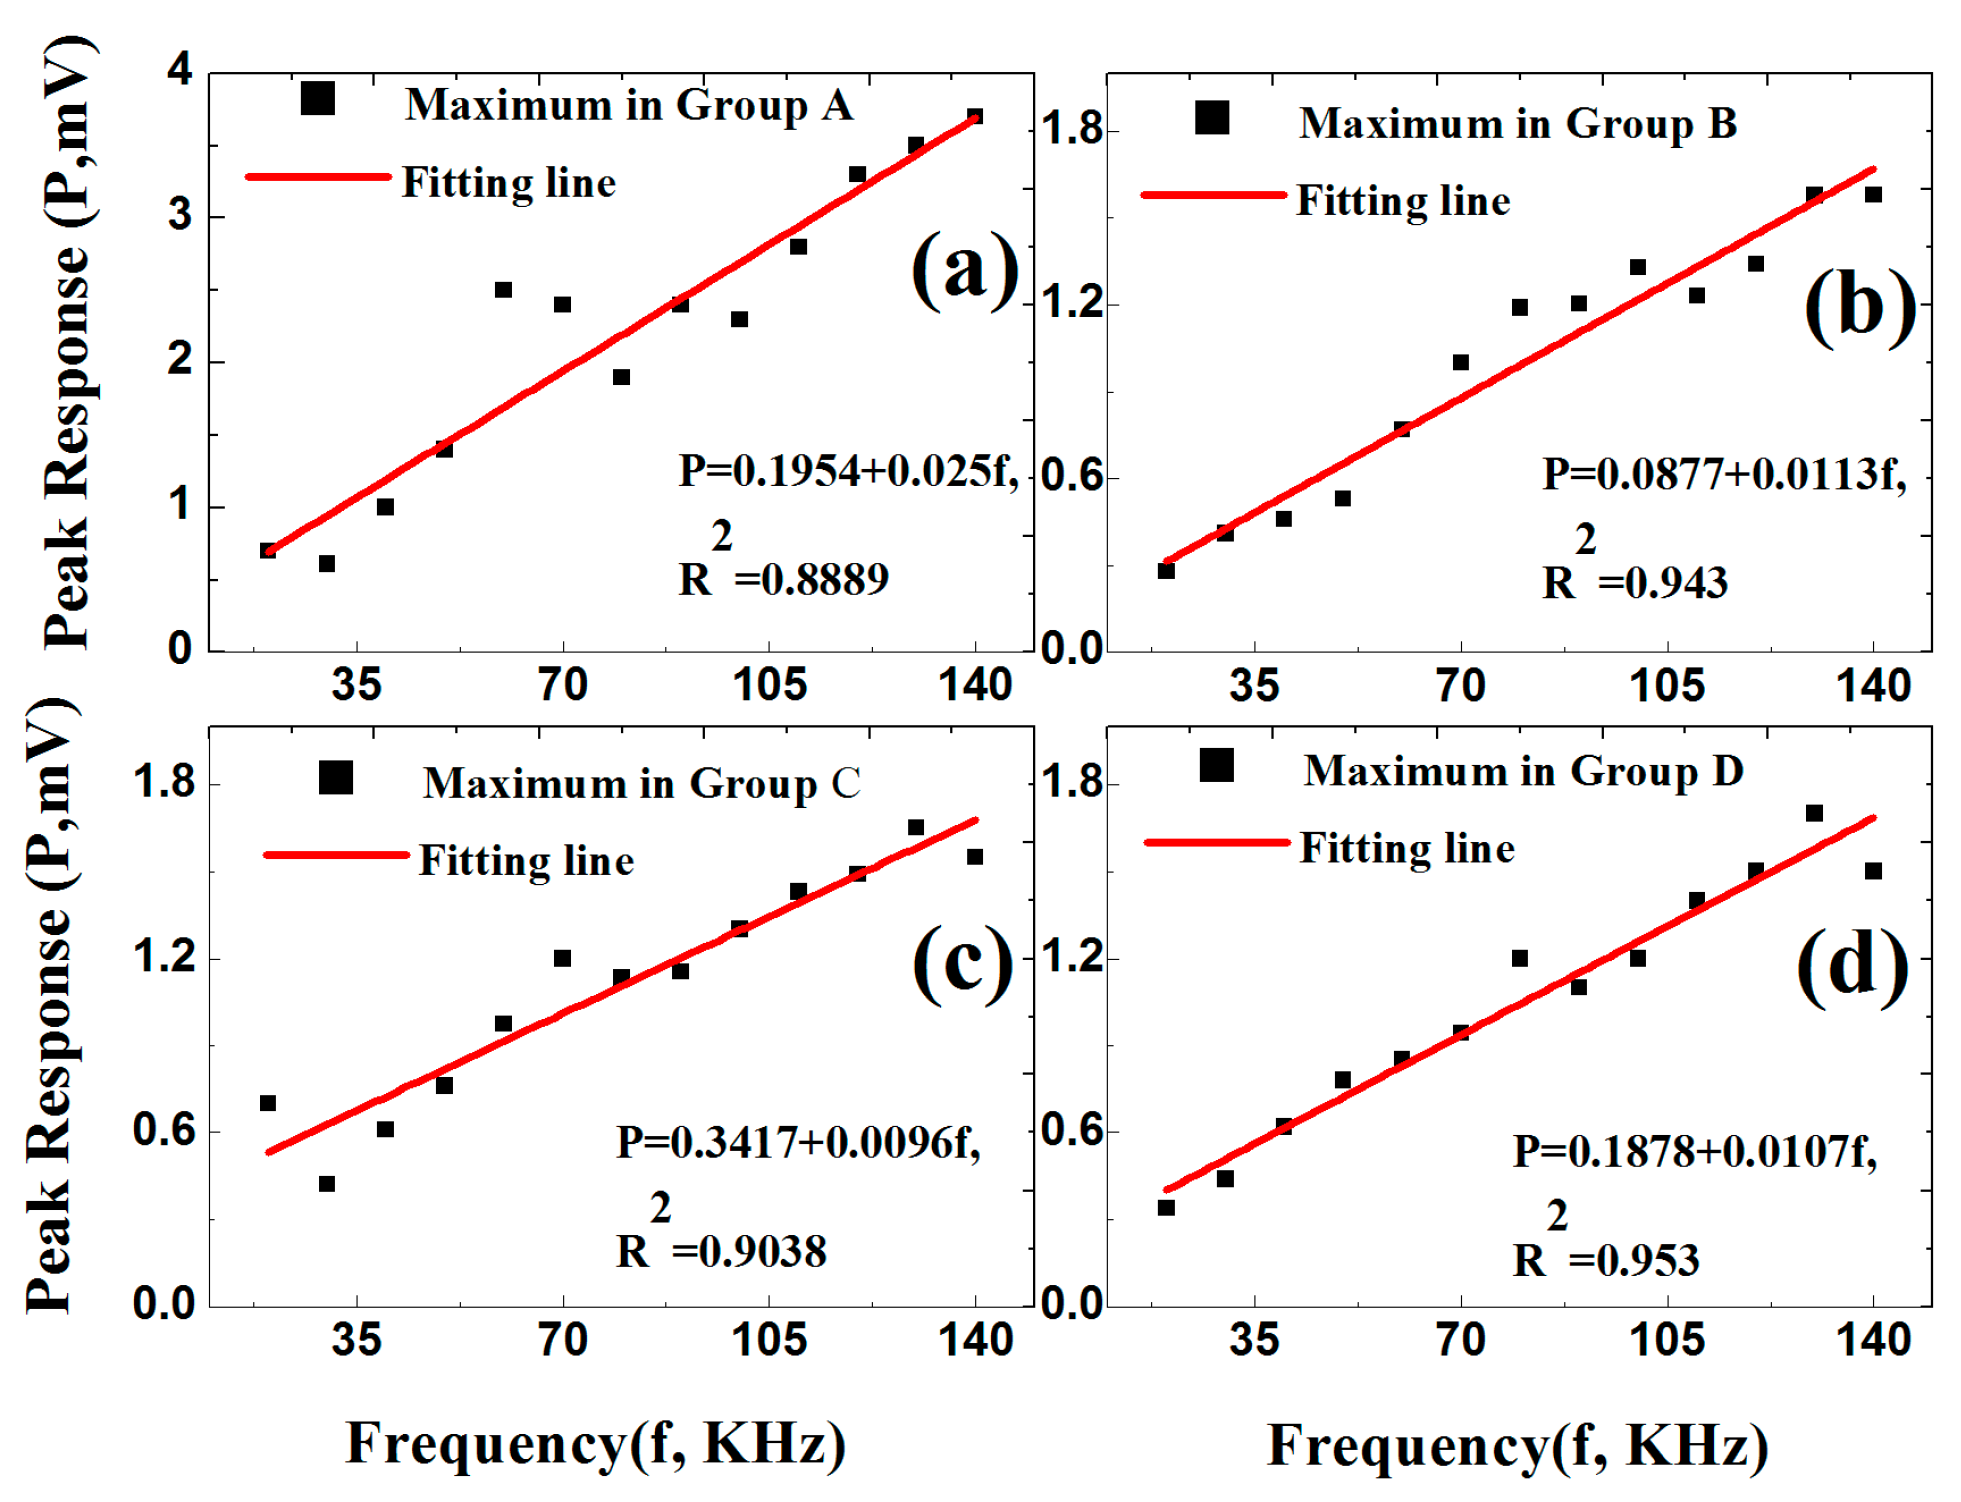
4. Experimental Results
5. Discussions
5.1. Bidirectional Lamb Waves Detection
5.2. Bimodal Lamb Waves Detection
6. Conclusions
Author Contributions
Funding
Conflicts of Interest
References
- Demer, L.J.; Fentnor, L.H. Lamb Wave Techniques in Nondestructive Testing. Int. J. Nondestruct. Test 1969, 1, 251–283. [Google Scholar]
- Monkhouse, R.S.C.; Wilcox, P.W.; Lowe, M.J.S.; Dalton, R.P.; Cawley, P. The rapid monitoring of structures using interdigital Lamb wave transducers. Smart Mater. Struct. 2000, 9, 304. [Google Scholar] [CrossRef]
- Staszewski, W.J.; Lee, B.C.; Mallet, L.; Scarpa, F. Structural health monitoring using scanning laser vibrometry: I. Lamb wave sensing. Smart Mater. Struct. 2004, 13, 251. [Google Scholar] [CrossRef]
- Mallet, L.; Lee, B.C.; Staszewski, W.J.; Scarpa, F. Structural health monitoring using scanning laser vibrometry: II. Lamb waves for damage detection. Smart Mater. Struct. 2004, 13, 261. [Google Scholar] [CrossRef]
- Mitra, M.; Gopalakrishnan, S. Guided wave based structural health monitoring: A review. Smart Mater. Struct. 2016, 25, 053001. [Google Scholar] [CrossRef]
- Guo, N.; Cawley, P. The interaction of Lamb waves with delaminations in composite laminates. J. Acoust. Soc. Am. 1993, 94, 2240–2246. [Google Scholar] [CrossRef]
- Valdez, S.H.D. Structural Integrity Monitoring of CFRP Laminates Using Piezoelectric Devices. Ph.D. Dissertation, Imperial College of Science, Technology and Medicine, University of London, London, UK, 2000. [Google Scholar]
- Seth, S.K.; Spearing, S.M.; Constantinos, S. Damage Detection in composite materials using Lamb wave methods. Smart Mater. Struct. 2002, 11, 269. [Google Scholar]
- Chakraborty, A.; Gopalakrishnan, S. A spectrally formulated finite element for wave propagation analysis in layered composite media. Int. J. Solids and Struct. 2004, 41, 5155–5183. [Google Scholar] [CrossRef]
- Ng, C.T.; Veidt, M. A Lamb-wave-based technique for damage detection in composite laminates. Smart Mater. Struct. 2009, 18, 074006. [Google Scholar] [CrossRef] [Green Version]
- Salas, K.I. Directional Transduction for Guided Wave Structural Health Monitoring. Ph.D. Dissertation, Aerospace Engineering, University of Michigan, Michigan, MI, USA, 2009. [Google Scholar]
- Li, J.; Rose, J.L. Implementing guided wave mode control by use of a phased transducer array. IEEE Trans. Ultrason. Ferroelectr. Freq. Control 2001, 48, 761–768. [Google Scholar] [CrossRef]
- Su, Z.; Ye, L. Selective generation of Lamb wave modes and their propagation characteristics in defective composite laminates. Proc. Inst. Mech. Eng. Part L: J. Mater.: Des. Appl. 2004, 218, 95–110. [Google Scholar] [CrossRef]
- Santoni, G.B.; Yu, L.; Xu, B.; Giurgiutiu, V. Lamb Wave-Mode Tuning of Piezoelectric Wafer Active Sensors for Structural Health Monitoring. J. Vib. Acoust. 2007, 129, 752–762. [Google Scholar] [CrossRef]
- Imano, K. A tilted angle polarization type piezoelectric transducer for plate wave generation. IEICE Electron. Express 2007, 4, 340–343. [Google Scholar] [CrossRef] [Green Version]
- Glushkov, E.V.; Glushkova, N.V.; Kvasha, O.V.; Lammering, R. Selective Lamb mode excitation by piezoelectric coaxial ring actuators. Smart Mater. Struct. 2010, 19, 035018. [Google Scholar] [CrossRef]
- Li, J.; Zeng, Q.; Liu, Z. Enhanced resonance transmission of acoustic waves based on asymmetric excitation of Lamb waves in phononic crystals with wedges-like structures. J. Appl. Phys. 2014, 116, 073510. [Google Scholar] [CrossRef]
- Peyman Yazdanpanah, M.; Nicolas, Q.; Patrice, M. Design and optimization of a multi-element piezoelectric transducer for mode-selective generation of guided waves. Smart Mater. Struct. 2016, 25, 075037. [Google Scholar]
- Sause, M.G.R.; Hamstad, M.A.; Horn, S. Finite element modeling of lamb wave propagation in anisotropic hybrid materials. Compos. Part B: Eng. 2013, 53, 249–257. [Google Scholar] [CrossRef]
- Putkis, O.; Dalton, R.P.; Croxford, A.J. The anisotropic propagation of ultrasonic guided waves in composite materials and implications for practical applications. Ultrasonics 2016, 65, 390–399. [Google Scholar] [CrossRef]
- Kessler, S.A.; Raghavan, A. Vector-based Damage Localization for Anisotropic Composite Laminates. In Proceedings of the 7th International Workshop on Structural Health Monitoring, Stanford, CA, USA, 9–11 September 2009. [Google Scholar]
- Zhou, G.; Sim, L.M. Damage detection and assessment in fibre-reinforced composite structures with embedded fibre optic sensors-review. Smart Mater. Struct. 2002, 11, 925. [Google Scholar] [CrossRef]
- Li, H.N.; Li, D.S.; Song, G.B. Recent applications of fiber optic sensors to health monitoring in civil engineering. Eng. Struct. 2004, 26, 1647–1657. [Google Scholar] [CrossRef]
- Kahandawa, G.C.; Wang, H.; Lau, K.T. Use of FBG sensors for SHM in aerospace structures. Photonic Sens. 2012, 2, 203–214. [Google Scholar] [CrossRef]
- Du, W.; Tao, X.M.; Tam, H.Y.; Choy, C.L. Fundamentals and applications of optical fiber Bragg grating sensors to textile structural composites. Compos. Struct. 1998, 42, 217–229. [Google Scholar] [CrossRef]
- Okabe, Y.; Yashiro, S.; Kosaka, T.; Takeda, N. Detection of transverse cracks in CFRP composites using embedded fiber Bragg grating sensors. Smart Mater. Struct. 2000, 9, 832. [Google Scholar] [CrossRef]
- Takeda, N.; Okabe, Y.; Kuwahara, J.; Kojima, S.; Ogisu, T. Development of smart composite structures with small-diameter fiber Bragg grating sensors for damage detection: Quantitative evaluation of delamination length in CFRP L laminates using Lamb wave sensing. Compos. Sci. Technol. 2005, 65, 2575–2587. [Google Scholar] [CrossRef]
- Di Sante, R. Fibre Optic Sensors for Structural Health Monitoring of Aircraft Composite Structures: Recent Advances and Applications. Sensors 2015, 15, 18666–18713. [Google Scholar] [CrossRef] [Green Version]
- Hiroshi, T.; Nobuyuki, T.; Kei, U.; Junji, T. Impact damage detection in CFRP using fiber Bragg gratings. Smart Mater. Struct. 2004, 13, 719. [Google Scholar]
- Betz, D.C.; Thursby, G.; Culshaw, B.; Staszewski, W.J. Structural Damage Location with Fiber Bragg Grating Rosettes and Lamb Waves. Struct. Health Monit. 2007, 6, 299–308. [Google Scholar] [CrossRef]
- De Pauw, B.; Goossens, S.; Geernaert, T.; Habas, D.; Thienpont, H.; Berghmans, F. Fibre Bragg Gratings in Embedded Microstructured Optical Fibres Allow Distinguishing between Symmetric and Anti-Symmetric Lamb Waves in Carbon Fibre Reinforced Composites. Sensors 2017, 17, 1948. [Google Scholar] [CrossRef]
- Hu, C.; Yu, Z.; Wang, A. An all fiber-optic multi-parameter structure health monitoring system. Opt. Express 2016, 24, 20287–20296. [Google Scholar] [CrossRef]
- Drissi-Habti, M.; Raman, V.; Khadour, A.; Timorian, S. Fiber Optic Sensor Embedment Study for Multi-Parameter Strain Sensing. Sensors 2017, 17, 667. [Google Scholar] [CrossRef]
- Jie, L.; Bai-Ou, G. Bragg gratings in rectangular microfiber for temperature independent refractive index sensing. Opt. Lett. 2012, 37, 2649–2651. [Google Scholar]
- Lawrence, C.M.; Nelson, D.V.; Udd, E. Multiparameter sensing with fiber Bragg gratings. Proc. SPIE Int. Soc. Opt. Eng. 1996, 2872, 24–32. [Google Scholar]
- Udd, E.; Schulz, W.L.; Seim, J.M.; Haugse, E.D.; Trego, A.; Johnson, P.E.; Bennett, T.E.; Nelson, D.V.; Makino, A. Multidimensional strain field measurements using fiber optic grating sensors. Proc. SPIE Int. Soc. Opt. Eng. 2000, 3986, 254–262. [Google Scholar]
- Udd, E. Review of multi-parameter fiber grating sensors. Proc. SPIE Int. Soc. Opt. Eng. 2007, 6770, 677002. [Google Scholar]
- Bosia, F.; Giaccari, P.; Botsis, J.; Facchini, M.; Limberger, H.G.; Salathé, R.P. Characterization of the response of fibre Bragg grating sensors subjected to a two-dimensional strain field. Interoper. Test Eval. Syst. Syst. Field Study 2003, 28, 369–386. [Google Scholar] [CrossRef]
- Abe, I.; Kalinowski, H.J.; Frazão, O.; Santos, J.L.; Nogueira, R.N.; Pinto, J.L. Superimposed Bragg gratings in high-birefringence fibre optics: Three-parameter simultaneous measurements. Meas. Sci. Technol. 2004, 15, 1453. [Google Scholar] [CrossRef]
- Prabhugoud, M.; Peters, K. Finite Element Analysis of Multi-axis Strain Sensitivities of Bragg Gratings in PM Fibers. J. Intell. Mater. Syst. Struct. 2007, 18, 861–873. [Google Scholar] [CrossRef]
- Mawatari, T.; Nelson, D. A multi-parameter Bragg grating fiber optic sensor and triaxial strain measurement. Smart Mater. Struct. 2008, 17, 035033. [Google Scholar] [CrossRef]
- Banks, C.E.; Wang, G. Experimental investigation on acousto-ultrasonic sensing using polarization-maintaining fiber Bragg gratings. Sens. Smart Struct. Technol. Civ. Mech. Aerosp. Syst. SPIE 2016, 9803, 98033R. [Google Scholar]
- Jinling, Z.; Hongli, J.; Jinhao, Q. Modeling of Lamb waves in composites using new third-order plate theories. Smart Mater. Struct. 2014, 23, 045017. [Google Scholar]
- Chen, J. Exploring Effect of Medium Coupling on Ultrasonic Lamb Waves in Engineering Structures and Synthesised Soft Tissue-Bone Phantoms. Ph.D. Dissertation, Department of Mechanical Engineering, Hong Kong Polytechnic University, Hongkong, 2011. [Google Scholar]
- Sorazu, B.; Thursby, G.; Culshaw, B. Wavefront Integrating Fiber Sensors for Ultrasonic Detection. IEEE Sens. J. 2011, 11, 1623–1631. [Google Scholar] [CrossRef]


| 0 Degree | 90 Degree | Possible Application | ||||
|---|---|---|---|---|---|---|
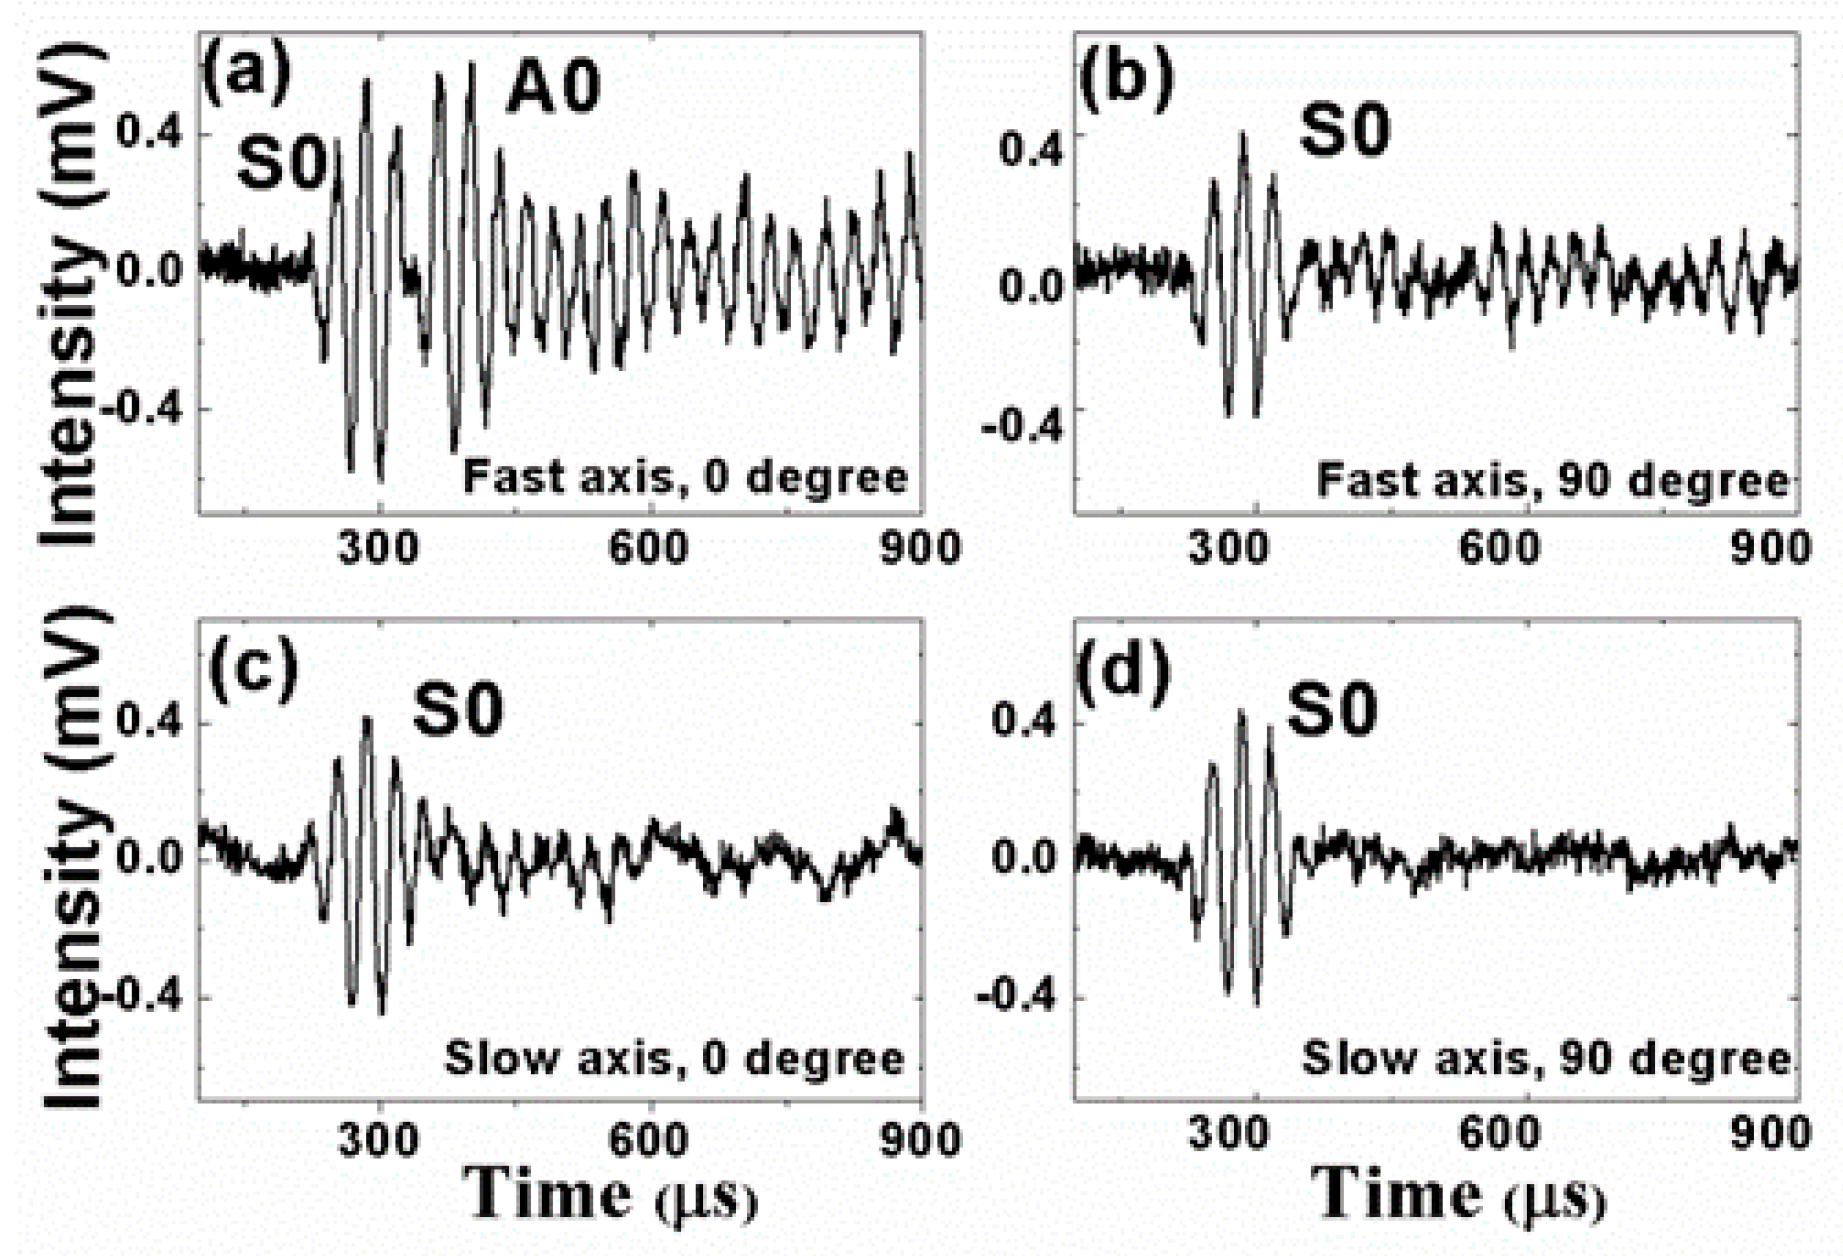
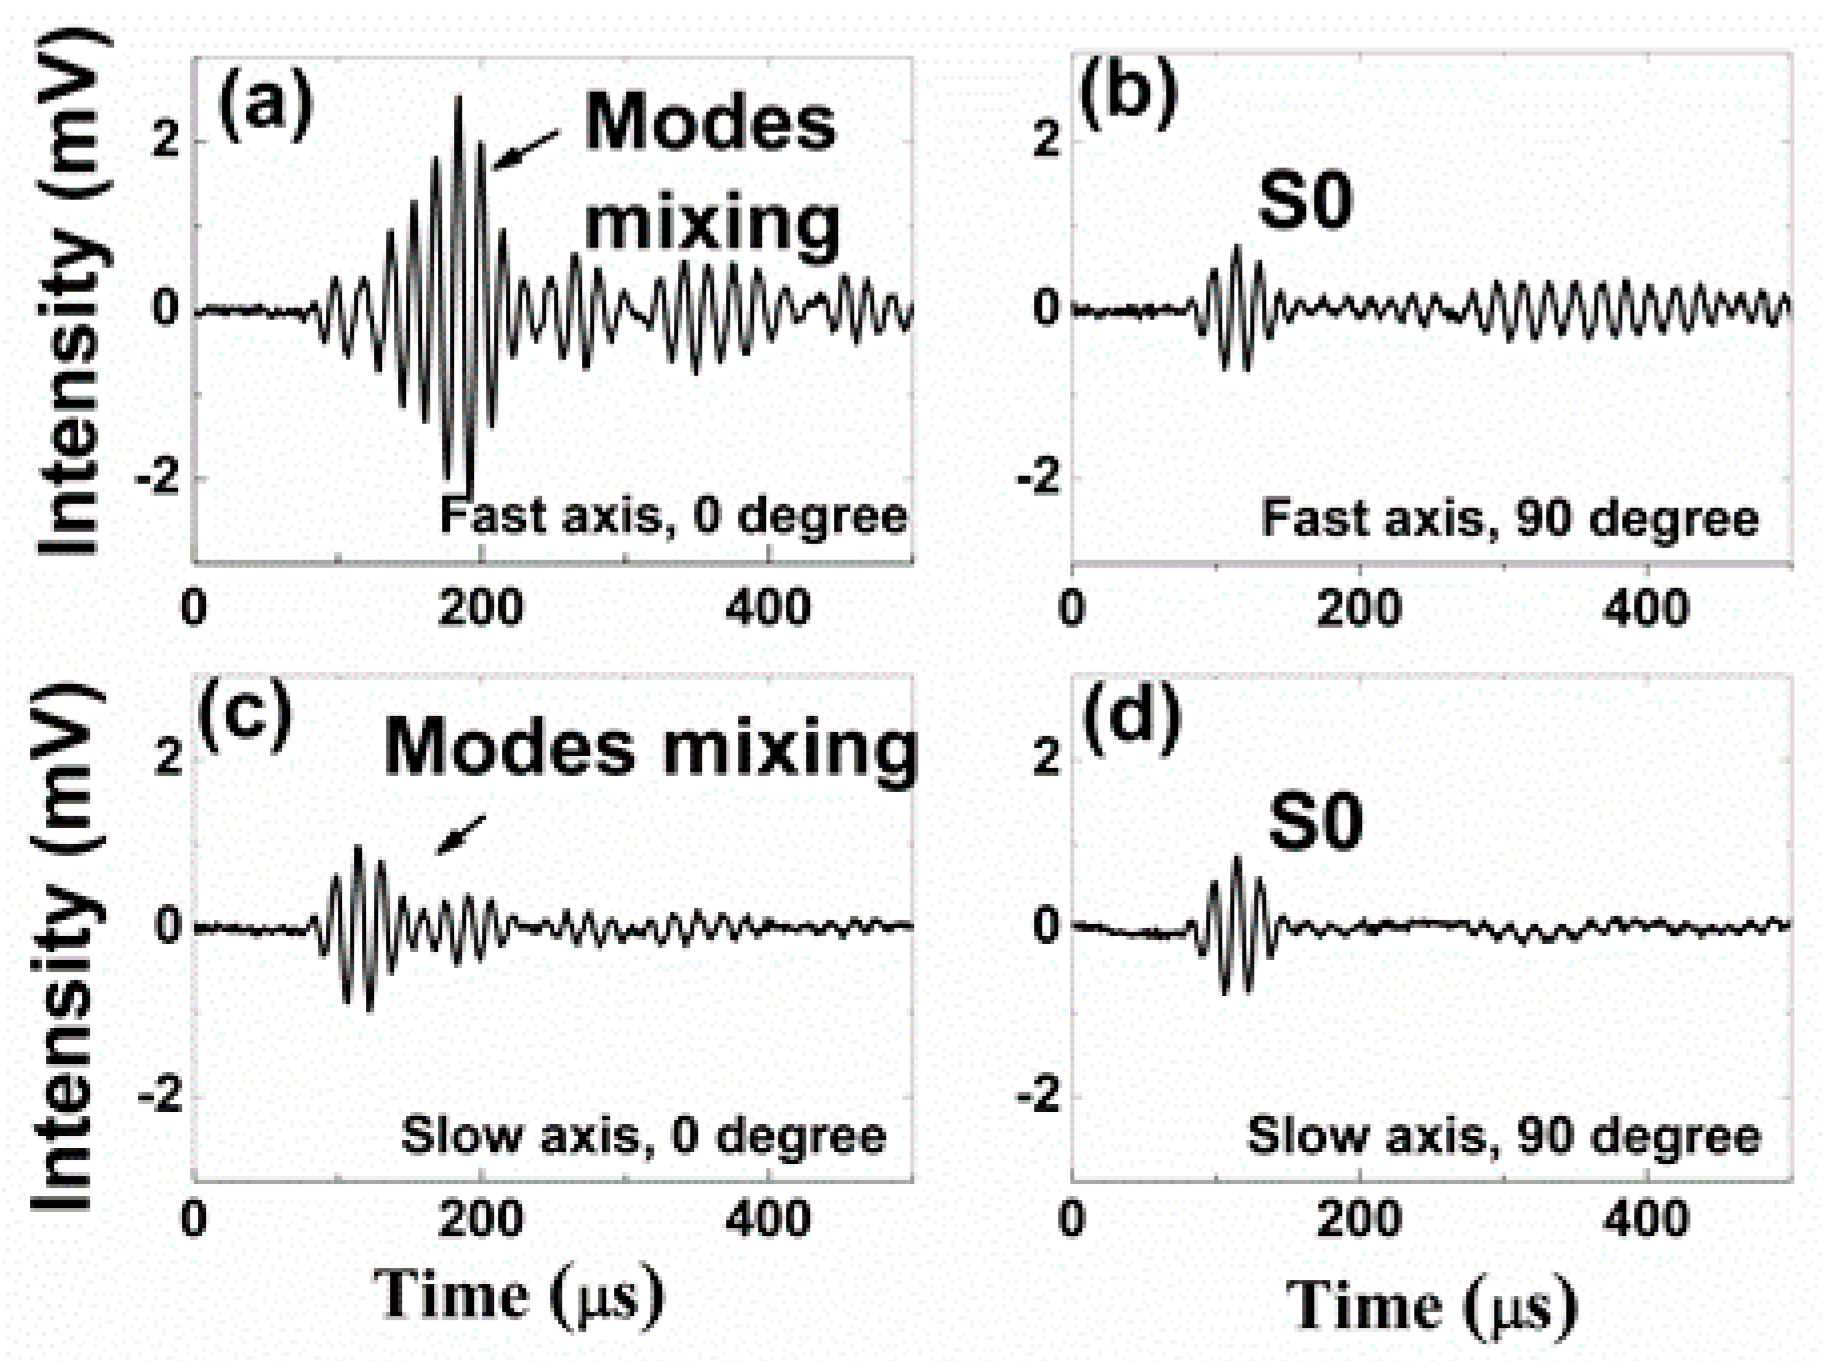
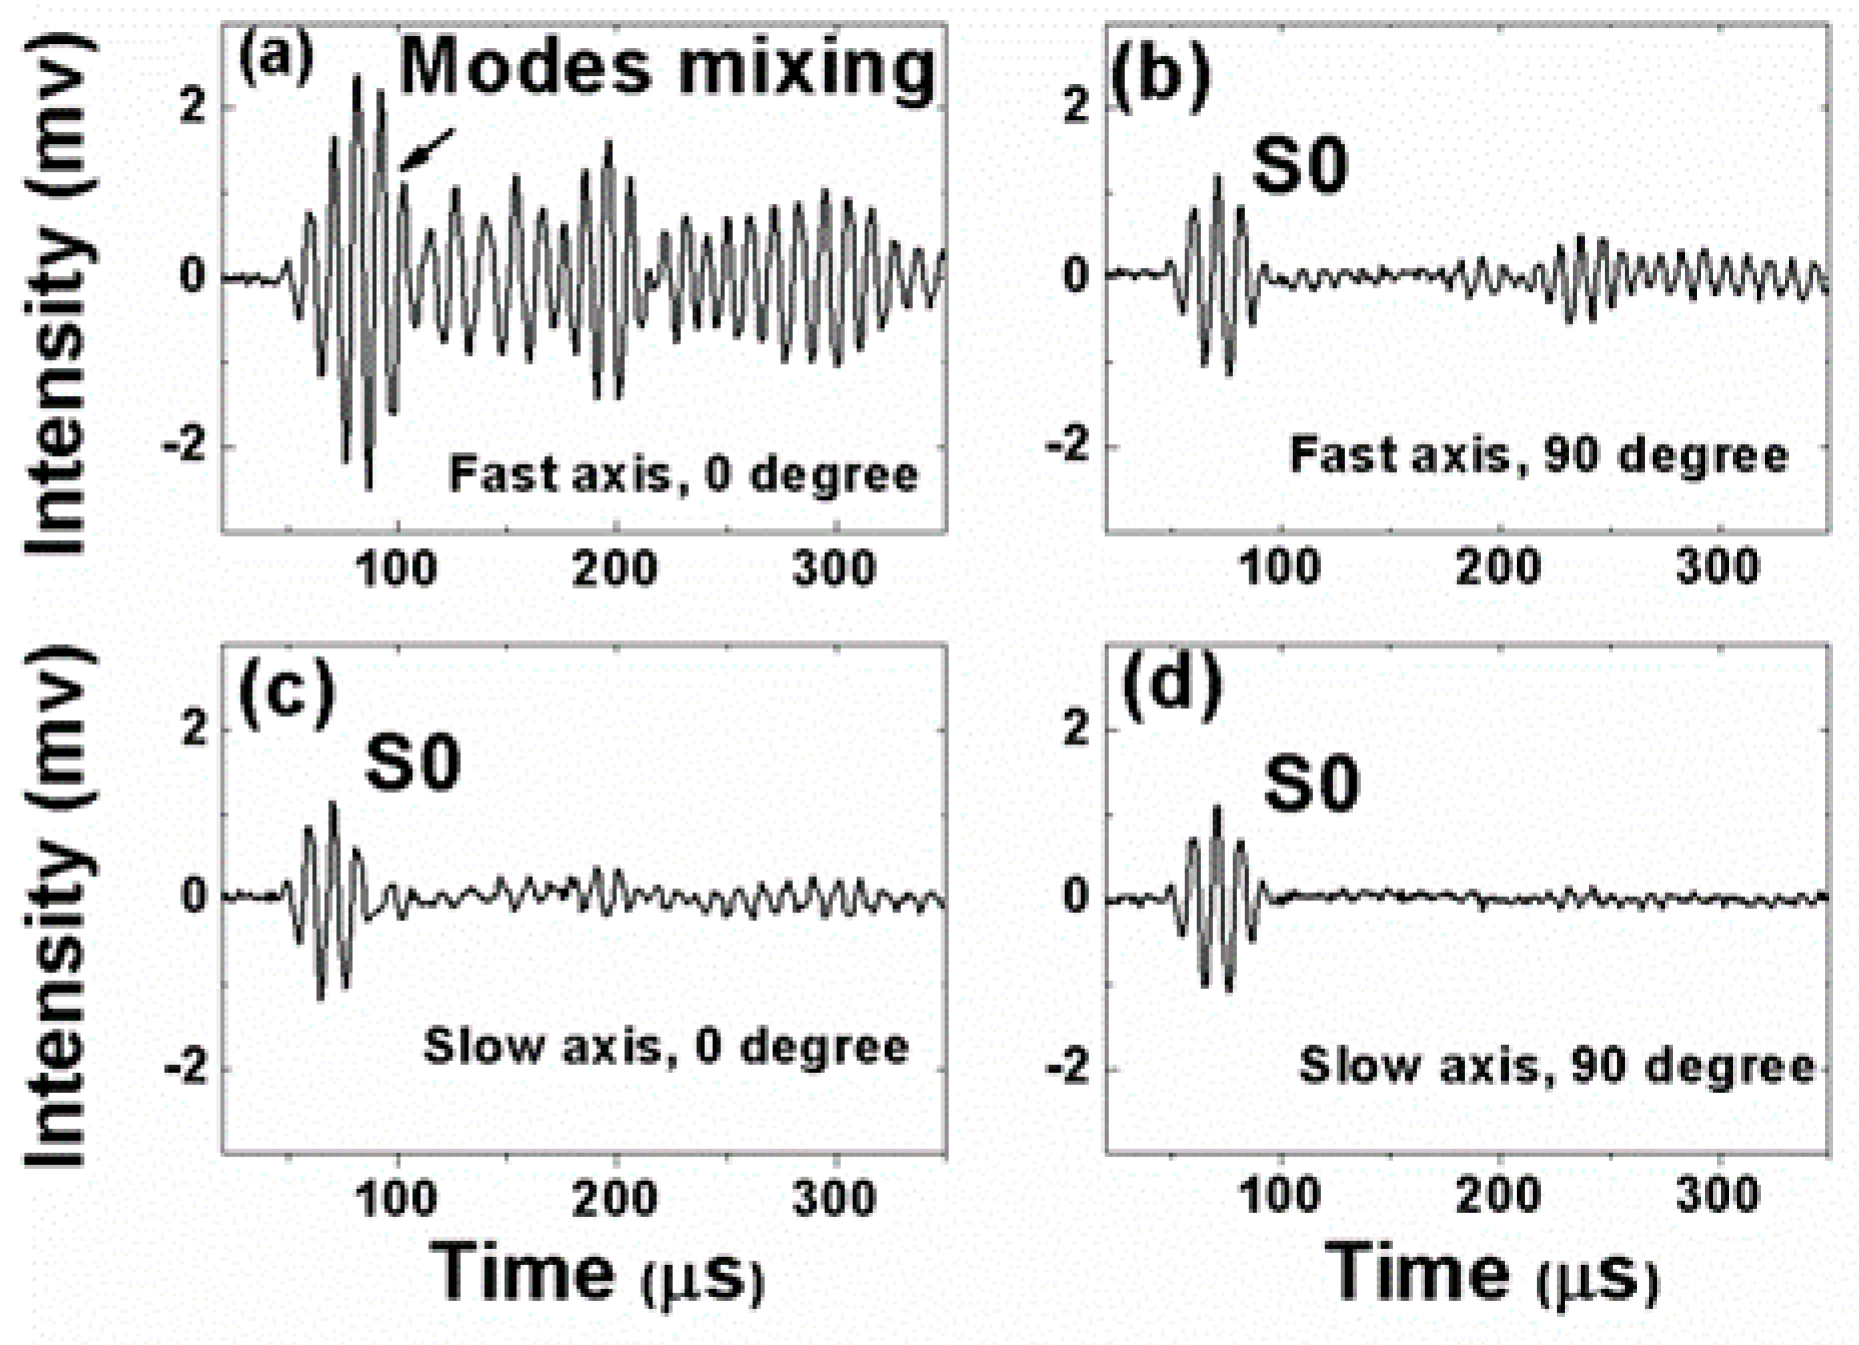
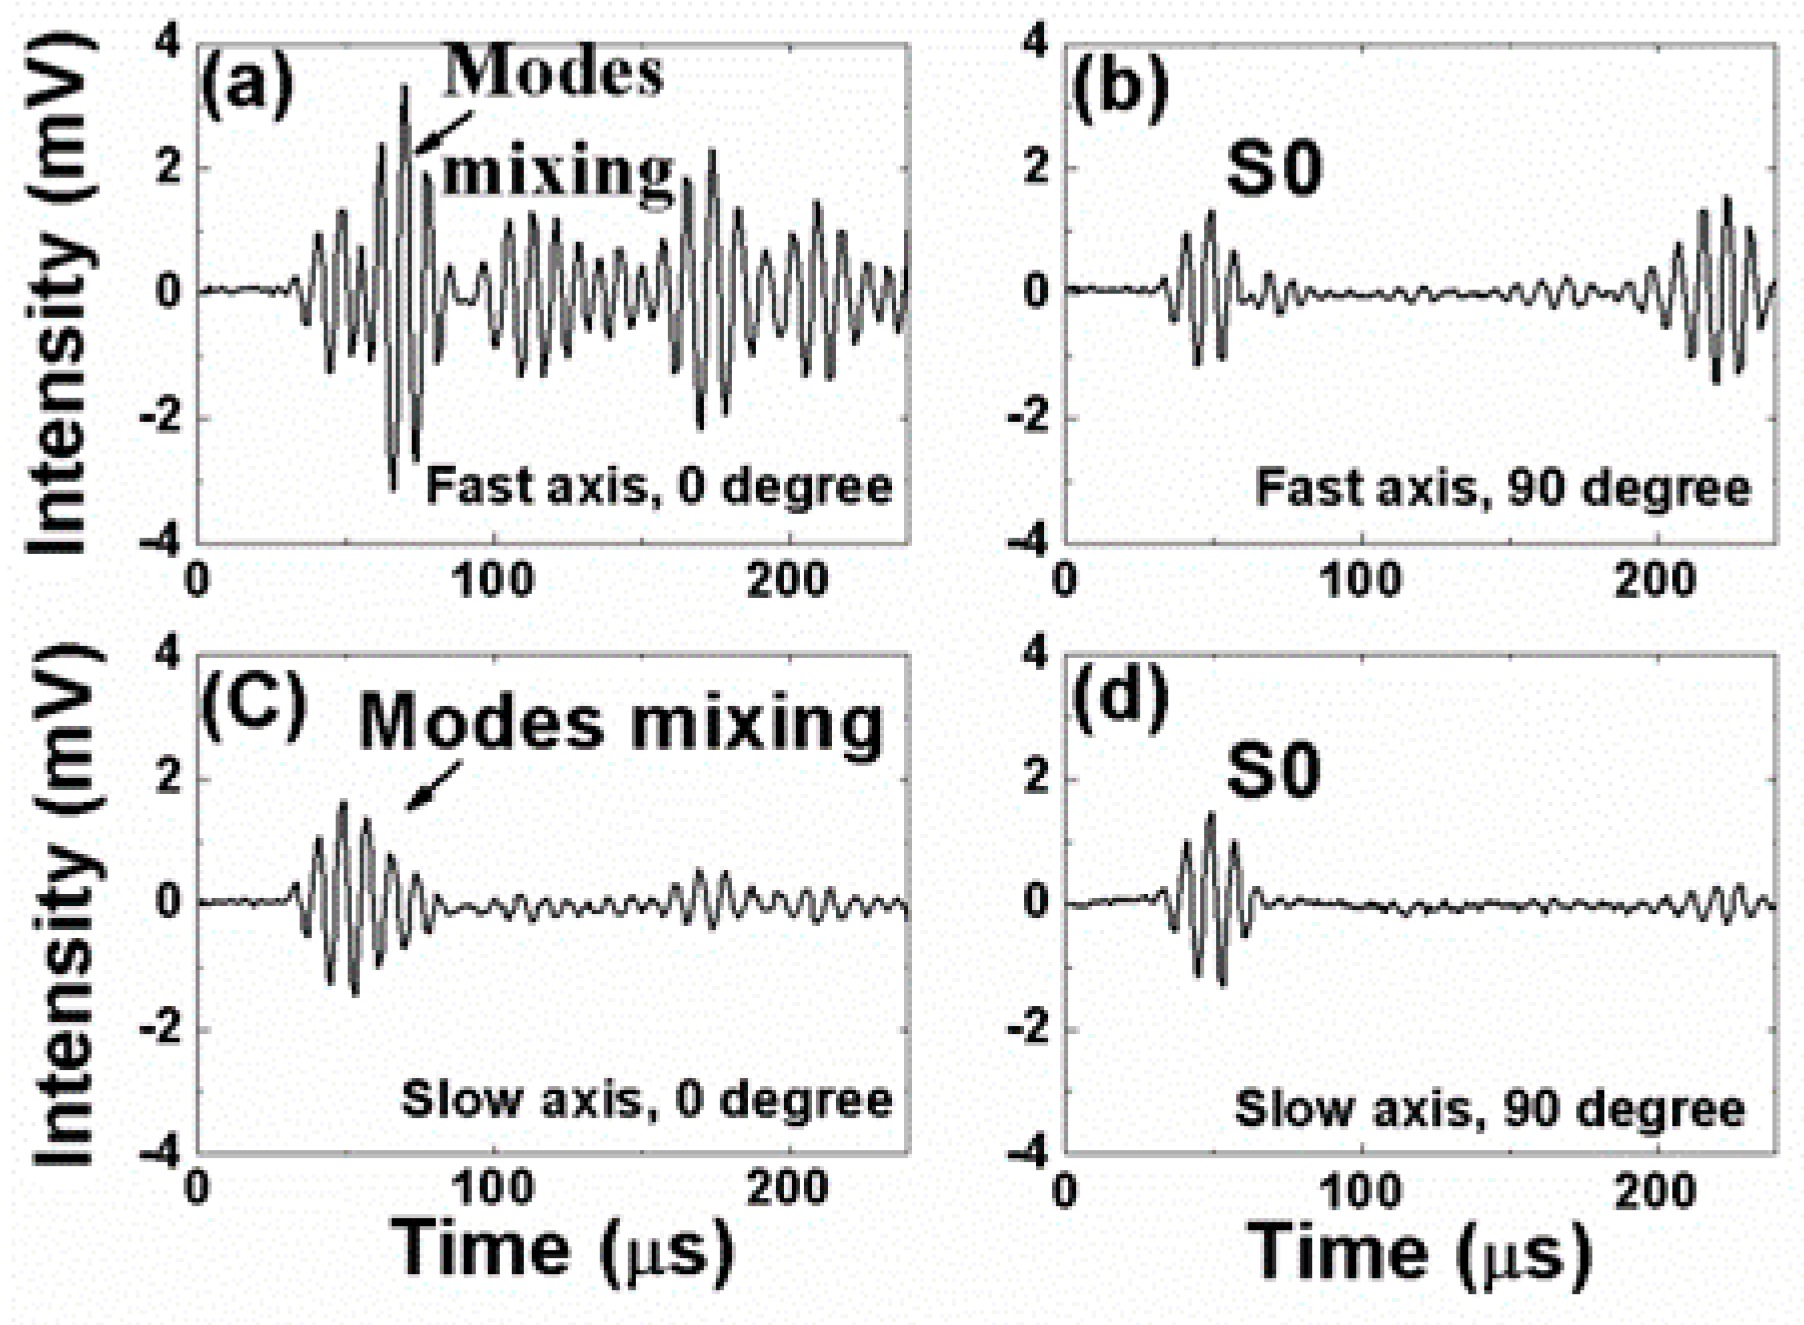
| PM-FBG | Fast axis | S0 | sensitive | S0 | sensitive | Differentiating two propagation directions |
| A0 | sensitive | A0 | weak responses | |||
| Possible Application | Bimodal LWs detection | |||||
| Slow axis | S0 | sensitive | S0 | sensitive | Bidirectional S0 detection | |
| A0 | week responses | A0 | no response | |||
| Possible Application | Mode-selective sensing | |||||
| FBG [29,30] | S0 | sensitive | S0 | insensitive | ||
| A0 | insensitive | A0 | insensitive | |||
© 2019 by the authors. Licensee MDPI, Basel, Switzerland. This article is an open access article distributed under the terms and conditions of the Creative Commons Attribution (CC BY) license (http://creativecommons.org/licenses/by/4.0/).
Share and Cite
Rao, C.; Duan, L. Bidirectional, Bimodal Ultrasonic Lamb Wave Sensing in a Composite Plate Using a Polarization-Maintaining Fiber Bragg Grating. Sensors 2019, 19, 1375. https://doi.org/10.3390/s19061375
Rao C, Duan L. Bidirectional, Bimodal Ultrasonic Lamb Wave Sensing in a Composite Plate Using a Polarization-Maintaining Fiber Bragg Grating. Sensors. 2019; 19(6):1375. https://doi.org/10.3390/s19061375
Chicago/Turabian StyleRao, Chunfang, and Lingze Duan. 2019. "Bidirectional, Bimodal Ultrasonic Lamb Wave Sensing in a Composite Plate Using a Polarization-Maintaining Fiber Bragg Grating" Sensors 19, no. 6: 1375. https://doi.org/10.3390/s19061375