Next Issue
Volume 19, April-1
Previous Issue
Volume 19, March-1
 
 
sensors-logo

Journal Browser

Journal Browser

Sensors, Volume 19, Issue 6 (March-2 2019) – 219 articles

Cover Story (view full-size image): 
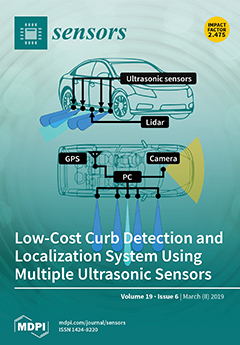
Curb detection and localization systems constitute an important aspect of environmental recognition systems of autonomous driving vehicles. Most existing curb detection and localization systems use multichannel light detection and ranging (lidar) as a primary sensor. However, although lidar demonstrates high performance, it is too expensive to be used for commercial vehicles. In this paper, we used ultrasonic sensors to implement a practical, low-cost curb detection and localization system. To compensate for the relatively lower performance of ultrasonic sensors as compared to other, higher-cost sensors, we used multiple ultrasonic sensors and applied a series of novel processing algorithms that overcome the limitations of a single ultrasonic sensor and conventional algorithms. The performance of the proposed processing algorithms was demonstrated through a field test. View Paper here.
  • Issues are regarded as officially published after their release is announced to the table of contents alert mailing list.
  • You may sign up for e-mail alerts to receive table of contents of newly released issues.
  • PDF is the official format for papers published in both, html and pdf forms. To view the papers in pdf format, click on the "PDF Full-text" link, and use the free Adobe Reader to open them.
Order results
Result details
Section
Select all
Export citation of selected articles as:
16 pages, 3893 KiB  
Article
Monitoring Spatio-Temporal Changes of Terrestrial Ecosystem Soil Water Use Efficiency in Northeast China Using Time Series Remote Sensing Data
by Hang Qi, Fang Huang and Huan Zhai
Sensors 2019, 19(6), 1481; https://doi.org/10.3390/s19061481 - 26 Mar 2019
Cited by 10 | Viewed by 4064
Abstract
Soil water use efficiency (SWUE) was proposed as an effective proxy of ecosystem water use efficiency (WUE), which reflects the coupling of the carbon–water cycle and function of terrestrial ecosystems. The changes of ecosystem SWUE at the regional scale and their relationships with [...] Read more.
Soil water use efficiency (SWUE) was proposed as an effective proxy of ecosystem water use efficiency (WUE), which reflects the coupling of the carbon–water cycle and function of terrestrial ecosystems. The changes of ecosystem SWUE at the regional scale and their relationships with the environmental and biotic factors are yet to be adequately understood. Here, we aim to estimate SWUE over northeast China using time-series Moderate Resolution Imaging Spectroradiometer (MODIS) gross primary productivity data and European Space Agency climate change initiative (ESA CCI) soil moisture product during 2007–2015. The spatio-temporal variations in SWUE and their linkages to multiple factors, especially the phenological metrics, were investigated using trend and correlation analysis. The results showed that the spatial heterogeneity of ecosystem SWUE in northeast China was obvious. SWUE distribution varied among vegetation types, soil types, and elevation. Forests might produce higher photosynthetic productivity by utilizing unit soil moisture. The seasonal variations of SWUE were consistent with the vegetation growth cycle. Changes in normalized difference vegetation index (NDVI), land surface temperature, and precipitation exerted positive effects on SWUE variations. The earlier start (SOS) and later end (EOS) of the growing season would contribute to the increase in SWUE. Our results help complement the knowledge of SWUE variations and their driving forces. Full article
(This article belongs to the Special Issue Satellite Remote Sensing in Environmental Monitoring)
Show Figures

Figure 1

20 pages, 2344 KiB  
Article
Continuous Analysis of Running Mechanics by Means of an Integrated INS/GPS Device
by Pavel Davidson, Heikki Virekunnas, Dharmendra Sharma, Robert Piché and Neil Cronin
Sensors 2019, 19(6), 1480; https://doi.org/10.3390/s19061480 - 26 Mar 2019
Cited by 19 | Viewed by 6692
Abstract
This paper describes a single body-mounted sensor that integrates accelerometers, gyroscopes, compasses, barometers, a GPS receiver, and a methodology to process the data for biomechanical studies. The sensor and its data processing system can accurately compute the speed, acceleration, angular velocity, and angular [...] Read more.
This paper describes a single body-mounted sensor that integrates accelerometers, gyroscopes, compasses, barometers, a GPS receiver, and a methodology to process the data for biomechanical studies. The sensor and its data processing system can accurately compute the speed, acceleration, angular velocity, and angular orientation at an output rate of 400 Hz and has the ability to collect large volumes of ecologically-valid data. The system also segments steps and computes metrics for each step. We analyzed the sensitivity of these metrics to changing the start time of the gait cycle. Along with traditional metrics, such as cadence, speed, step length, and vertical oscillation, this system estimates ground contact time and ground reaction forces using machine learning techniques. This equipment is less expensive and cumbersome than the currently used alternatives: Optical tracking systems, in-shoe pressure measurement systems, and force plates. Another advantage, compared to existing methods, is that natural movement is not impeded at the expense of measurement accuracy. The proposed technology could be applied to different sports and activities, including walking, running, motion disorder diagnosis, and geriatric studies. In this paper, we present the results of tests in which the system performed real-time estimation of some parameters of walking and running which are relevant to biomechanical research. Contact time and ground reaction forces computed by the neural network were found to be as accurate as those obtained by an in-shoe pressure measurement system. Full article
(This article belongs to the Special Issue Wearable Sensors for Gait and Motion Analysis 2018)
Show Figures

Figure 1

20 pages, 5269 KiB  
Article
Drone Detection and Pose Estimation Using Relational Graph Networks
by Ren Jin, Jiaqi Jiang, Yuhua Qi, Defu Lin and Tao Song
Sensors 2019, 19(6), 1479; https://doi.org/10.3390/s19061479 - 26 Mar 2019
Cited by 27 | Viewed by 7137
Abstract
With the upsurge in use of Unmanned Aerial Vehicles (UAVs), drone detection and pose estimation by using optical sensors becomes an important research subject in cooperative flight and low-altitude security. The existing technology only obtains the position of the target UAV based on [...] Read more.
With the upsurge in use of Unmanned Aerial Vehicles (UAVs), drone detection and pose estimation by using optical sensors becomes an important research subject in cooperative flight and low-altitude security. The existing technology only obtains the position of the target UAV based on object detection methods. To achieve better adaptability and enhanced cooperative performance, the attitude information of the target drone becomes a key message to understand its state and intention, e.g., the acceleration of quadrotors. At present, most of the object 6D pose estimation algorithms depend on accurate pose annotation or a 3D target model, which costs a lot of human resource and is difficult to apply to non-cooperative targets. To overcome these problems, a quadrotor 6D pose estimation algorithm was proposed in this paper. It was based on keypoints detection (only need keypoints annotation), relational graph network and perspective-n-point (PnP) algorithm, which achieves state-of-the-art performance both in simulation and real scenario. In addition, the inference ability of our relational graph network to the keypoints of four motors was also evaluated. The accuracy and speed were improved significantly compared with the state-of-the-art keypoints detection algorithm. Full article
(This article belongs to the Special Issue Mobile Sensing: Platforms, Technologies and Challenges)
Show Figures

Figure 1

43 pages, 15164 KiB  
Article
Context Definition and Query Language: Conceptual Specification, Implementation, and Evaluation
by Alireza Hassani, Alexey Medvedev, Pari Delir Haghighi, Sea Ling, Arkady Zaslavsky and Prem Prakash Jayaraman
Sensors 2019, 19(6), 1478; https://doi.org/10.3390/s19061478 - 26 Mar 2019
Cited by 17 | Viewed by 6705
Abstract
As IoT grows at a staggering pace, the need for contextual intelligence is a fundamental and critical factor for IoT intelligence, efficiency, effectiveness, performance, and sustainability. As the standardisation efforts for IoT are fast progressing, efforts in standardising context management platforms led by [...] Read more.
As IoT grows at a staggering pace, the need for contextual intelligence is a fundamental and critical factor for IoT intelligence, efficiency, effectiveness, performance, and sustainability. As the standardisation efforts for IoT are fast progressing, efforts in standardising context management platforms led by the European Telecommunications Standards Institute (ETSI) are gaining more attention from both academic and industrial research organizations. These standardisation endeavours will enable intelligent interactions between ‘things’, where things could be devices, software components, web-services, or sensing/actuating systems. Therefore, having a generic platform to describe and query context is crucial for the future of IoT applications. In this paper, we propose Context Definition and Query Language (CDQL), an advanced approach that enables things to exchange, reuse and share context between each other. CDQL consists of two main parts, namely: context definition model, which is designed to describe situations and high-level context; and Context Query Language (CQL), which is a powerful and flexible query language to express contextual information requirements without considering details of the underlying data structures. An important feature of the proposed query language is its ability to query entities in IoT environments based on their situation in a fully dynamic manner where users can define situations and context entities as part of the query. We exemplify the usage of CDQL on three different smart city use cases to highlight how CDQL can be utilised to deliver contextual information to IoT applications. Performance evaluation has demonstrated scalability and efficiency of CDQL in handling a fairly large number of concurrent context queries. Full article
Show Figures

Figure 1

15 pages, 1896 KiB  
Article
Nyquist Zone Index and Chirp Rate Estimation of LFM Signal Intercepted by Nyquist Folding Receiver Based on Random Sample Consensus and Fractional Fourier Transform
by Xinqun Liu, Tao Li, Xiaolei Fan and Zengping Chen
Sensors 2019, 19(6), 1477; https://doi.org/10.3390/s19061477 - 26 Mar 2019
Cited by 7 | Viewed by 3677
Abstract
The Nyquist folding receiver (NYFR) can achieve a high-probability interception of an ultra-wideband (UWB) signal with fewer devices, while the output of the NYFR is converted into a hybrid modulated signal of the local oscillator (LO) and the received signal, which requires the [...] Read more.
The Nyquist folding receiver (NYFR) can achieve a high-probability interception of an ultra-wideband (UWB) signal with fewer devices, while the output of the NYFR is converted into a hybrid modulated signal of the local oscillator (LO) and the received signal, which requires the matching parameter estimation methods. The linear frequency modulation (LFM) signal is a typical low probability of intercept (LPI) radar signal. In this paper, an estimation method of both the Nyquist Zone (NZ) index and the chirp rate for the LFM signal intercepted by NYFR was proposed. First, according to the time-frequency characteristics of the LFM signal, the accurate NZ and the rough chirp rate was estimated based on least squares (LS) and random sample consensus (RANSAC). Then, the information of the LO was removed from the hybrid modulated signal by the known NZ, and the precise chirp rate was obtained by using the fractional Fourier transform (FrFT). Moreover, a fast search method of FrFT optimal order was presented, which could obviously reduce the computational complexity. The simulation demonstrated that the proposed method could precisely estimate the parameters of the hybrid modulated output signal of the NYFR. Full article
(This article belongs to the Section Remote Sensors)
Show Figures

Figure 1

18 pages, 3365 KiB  
Article
Improved PSO_AdaBoost Ensemble Algorithm for Imbalanced Data
by Kewen Li, Guangyue Zhou, Jiannan Zhai, Fulai Li and Mingwen Shao
Sensors 2019, 19(6), 1476; https://doi.org/10.3390/s19061476 - 26 Mar 2019
Cited by 40 | Viewed by 4294
Abstract
The Adaptive Boosting (AdaBoost) algorithm is a widely used ensemble learning framework, and it can get good classification results on general datasets. However, it is challenging to apply the AdaBoost algorithm directly to imbalanced data since it is designed mainly for processing misclassified [...] Read more.
The Adaptive Boosting (AdaBoost) algorithm is a widely used ensemble learning framework, and it can get good classification results on general datasets. However, it is challenging to apply the AdaBoost algorithm directly to imbalanced data since it is designed mainly for processing misclassified samples rather than samples of minority classes. To better process imbalanced data, this paper introduces the indicator Area Under Curve (AUC) which can reflect the comprehensive performance of the model, and proposes an improved AdaBoost algorithm based on AUC (AdaBoost-A) which improves the error calculation performance of the AdaBoost algorithm by comprehensively considering the effects of misclassification probability and AUC. To prevent redundant or useless weak classifiers the traditional AdaBoost algorithm generated from consuming too much system resources, this paper proposes an ensemble algorithm, PSOPD-AdaBoost-A, which can re-initialize parameters to avoid falling into local optimum, and optimize the coefficients of AdaBoost weak classifiers. Experiment results show that the proposed algorithm is effective for processing imbalanced data, especially the data with relatively high imbalances. Full article
(This article belongs to the Special Issue Artificial Intelligence and Sensors)
Show Figures

Figure 1

19 pages, 4217 KiB  
Article
Next Location Prediction Based on an Adaboost-Markov Model of Mobile Users
by Hongjun Wang, Zhen Yang and Yingchun Shi
Sensors 2019, 19(6), 1475; https://doi.org/10.3390/s19061475 - 26 Mar 2019
Cited by 19 | Viewed by 4832
Abstract
As an emerging class of spatial trajectory data, mobile user trajectory data can be used to analyze individual or group behavioral characteristics, hobbies and interests. Besides, the information extracted from original trajectory data is widely used in smart cities, transportation planning, and anti-terrorism [...] Read more.
As an emerging class of spatial trajectory data, mobile user trajectory data can be used to analyze individual or group behavioral characteristics, hobbies and interests. Besides, the information extracted from original trajectory data is widely used in smart cities, transportation planning, and anti-terrorism maintenance. In order to identify the important locations of the target user from his trajectory data, a novel division method for preprocessing trajectory data is proposed, the feature points of original trajectory are extracted according to the change of trajectory structural, and then important locations are extracted by clustering the feature points, using an improved density peak clustering algorithm. Finally, in order to predict next location of mobile users, a multi-order fusion Markov model based on the Adaboost algorithm is proposed, the model order k is adaptively determined, and the weight coefficients of the 1~k-order models are given by the Adaboost algorithm according to the importance of various order models, a multi-order fusion Markov model is generated to predict next important location of the user. The experimental results on the real user trajectory dataset Geo-life show that the prediction performance of Adaboost-Markov model is better than the multi-order fusion Markov model with equal coefficient, and the universality and prediction performance of Adaboost-Markov model is better than the first to third order Markov models. Full article
(This article belongs to the Section Sensor Networks)
Show Figures

Figure 1

20 pages, 2300 KiB  
Article
Dynamic Multi-LiDAR Based Multiple Object Detection and Tracking
by Muhammad Sualeh and Gon-Woo Kim
Sensors 2019, 19(6), 1474; https://doi.org/10.3390/s19061474 - 26 Mar 2019
Cited by 71 | Viewed by 11440
Abstract
Environmental perception plays an essential role in autonomous driving tasks and demands robustness in cluttered dynamic environments such as complex urban scenarios. In this paper, a robust Multiple Object Detection and Tracking (MODT) algorithm for a non-stationary base is presented, using multiple 3D [...] Read more.
Environmental perception plays an essential role in autonomous driving tasks and demands robustness in cluttered dynamic environments such as complex urban scenarios. In this paper, a robust Multiple Object Detection and Tracking (MODT) algorithm for a non-stationary base is presented, using multiple 3D LiDARs for perception. The merged LiDAR data is treated with an efficient MODT framework, considering the limitations of the vehicle-embedded computing environment. The ground classification is obtained through a grid-based method while considering a non-planar ground. Furthermore, unlike prior works, 3D grid-based clustering technique is developed to detect objects under elevated structures. The centroid measurements obtained from the object detection are tracked using Interactive Multiple Model-Unscented Kalman Filter-Joint Probabilistic Data Association Filter (IMM-UKF-JPDAF). IMM captures different motion patterns, UKF handles the nonlinearities of motion models, and JPDAF associates the measurements in the presence of clutter. The proposed algorithm is implemented on two slightly dissimilar platforms, giving real-time performance on embedded computers. The performance evaluation metrics by MOT16 and ground truths provided by KITTI Datasets are used for evaluations and comparison with the state-of-the-art. The experimentation on platforms and comparisons with state-of-the-art techniques suggest that the proposed framework is a feasible solution for MODT tasks. Full article
(This article belongs to the Special Issue Perception Sensors for Road Applications)
Show Figures

Figure 1

14 pages, 2035 KiB  
Article
On-Farm Claw Scoring in Sows Using a Novel Mobile Device
by Miriam M. J. van Riet, Jürgen Vangeyte, Geert P. J. Janssens, Bart Ampe, Elena Nalon, Emilie-Julie Bos, Liesbet Pluym, Frank A. M. Tuyttens, Dominiek Maes and Sam Millet
Sensors 2019, 19(6), 1473; https://doi.org/10.3390/s19061473 - 26 Mar 2019
Cited by 7 | Viewed by 3616
Abstract
Claw lesions and lameness in sows are important problems in the industry as they impair sow welfare and result in economic losses. Available scoring techniques to detect claw lesions are all limited in terms of collecting data during all reproductive phases and recording [...] Read more.
Claw lesions and lameness in sows are important problems in the industry as they impair sow welfare and result in economic losses. Available scoring techniques to detect claw lesions are all limited in terms of collecting data during all reproductive phases and recording all claws. The Mobile Claw Scoring Device (MCSD) was designed to address these limitations. After considering different practical situations and a design phase, two prototypes were constructed and tested. Improvements were incorporated into a final aluminium apparatus, consisting of two cameras with light-emitting diode (LED) lights mounted in a two-segment aluminium box and covered with laminated tempered glass plates. The operating system slides underneath the claws and takes video images. This final prototype was optimised and validated in an experiment with 20 hybrid sows, comparing scores for soiled claws using the MCSD against scores for clean claws using the Feet First© sow chute (as gold standard). Fifty percent of the scores differed between both scoring tools, with mainly medial claw digits deviating, but this seemed biologically irrelevant. The MCSD seems to be an appropriate alternative for on-farm claw scoring and is distinguishable from other claw scoring techniques; however, it needs further optimisation to improve the similarity between the two techniques. Full article
(This article belongs to the Section Intelligent Sensors)
Show Figures

Figure 1

23 pages, 764 KiB  
Article
Lifetime Estimation for Multi-Phase Deteriorating Process with Random Abrupt Jumps
by Jianxun Zhang, Xiaosheng Si, Dangbo Du, Chen Hu and Changhua Hu
Sensors 2019, 19(6), 1472; https://doi.org/10.3390/s19061472 - 26 Mar 2019
Cited by 14 | Viewed by 3155
Abstract
Owing to operating condition changing, physical mutation, and sudden shocks, degradation trajectories usually exhibit multi-phase features, and the abrupt jump often appears at the changing time, which makes the traditional methods of lifetime estimation unavailable. In this paper, we mainly focus on how [...] Read more.
Owing to operating condition changing, physical mutation, and sudden shocks, degradation trajectories usually exhibit multi-phase features, and the abrupt jump often appears at the changing time, which makes the traditional methods of lifetime estimation unavailable. In this paper, we mainly focus on how to estimate the lifetime of the multi-phase degradation process with abrupt jumps at the change points under the concept of the first passage time (FPT). Firstly, a multi-phase degradation model with jumps based on the Wiener process is formulated to describe the multi-phase degradation pattern. Then, we attain the lifetime’s closed-form expression for the two-phase model with fixed jump relying on the distribution of the degradation state at the change point. Furthermore, we continue to investigate the lifetime estimation of the degradation process with random effect caused by unit-to-unit variability and the multi-phase degradation process. We extend the results of the two-phase case with fixed parameters to these two cases. For better implementation, a model identification method with off-line and on-line parts based on Expectation Maximization (EM) algorithm and Bayesian rule is proposed. Finally, a numerical case study and a practical example of gyro are provided for illustration. Full article
(This article belongs to the Special Issue Sensors for Prognostics and Health Management)
Show Figures

Figure 1

16 pages, 2618 KiB  
Article
In-Depth Investigation into the Transient Humidity Response at the Body-Seat Interface on Initial Contact Using a Dual Temperature and Humidity Sensor
by Zhuofu Liu, Jianwei Li, Meimei Liu, Vincenzo Cascioli and Peter W McCarthy
Sensors 2019, 19(6), 1471; https://doi.org/10.3390/s19061471 - 26 Mar 2019
Cited by 5 | Viewed by 4385
Abstract
Relative humidity (RH) at the body-seat interface is considered an important factor in both sitting comfort and generation of health concerns such as skin lesions. Technical difficulties appear to have limited research aimed at the detailed and simultaneous exploration of RH and temperature [...] Read more.
Relative humidity (RH) at the body-seat interface is considered an important factor in both sitting comfort and generation of health concerns such as skin lesions. Technical difficulties appear to have limited research aimed at the detailed and simultaneous exploration of RH and temperature changes at the body-seat interface; using RH sensors without the capability to record temperature where RH is recorded. To explore the causes of a spike in RH consistently produced on first contact between body and seat surface, we report data from the first use of dual temperature and RH (HTU21D) sensors in this interface. Following evaluation of sensor performance, the effect of local thermal changes on RH was investigated. The expected strong negative correlation between temperature and RH (R2 = −0.94) supported the importance of considering both parameters when studying impact of sitting on skin health. The influence of sensor movement speed (higher velocity approach: 0.32 cm/s ± 0.01 cm/s; lower velocity approach: 0.17 cm/s ± 0.01 cm/s) into a static RH region associated with a higher local temperature were compared with data gathered by altering the rate of a person sitting. In all cases, the faster sitting down (or equivalent) generated larger RH outcomes: e.g., in human sitting 53.7% ± 3.3% RH (left mid-thigh), 56.4% ± 5.1% RH (right mid-thigh) and 53.2% ± 2.7% RH (Coccyx). Differences in size of RH change were seen across the measurement locations used to study the body-seat interface. The initial sitting contact induces a transient RH response (duration ≤ 40 s) that does not accurately reflect the microenvironment at the body-seat interface. It is likely that any movement during sitting would result in similar artefact formation. As a result, caution should be taken when investigating RH performance at any enclosed interface when the surfaces may have different temperatures and movement may occur. Full article
Show Figures

Figure 1

17 pages, 1641 KiB  
Article
Environmental and Sensor Integration Influences on Temperature Measurements by Rotary-Wing Unmanned Aircraft Systems
by Brian R. Greene, Antonio R. Segales, Tyler M. Bell, Elizabeth A. Pillar-Little and Phillip B. Chilson
Sensors 2019, 19(6), 1470; https://doi.org/10.3390/s19061470 - 26 Mar 2019
Cited by 43 | Viewed by 5459
Abstract
Obtaining thermodynamic measurements using rotary-wing unmanned aircraft systems (rwUAS) requires several considerations for mitigating biases from the aircraft and its environment. In this study, we focus on how the method of temperature sensor integration can impact the quality of its measurements. To minimize [...] Read more.
Obtaining thermodynamic measurements using rotary-wing unmanned aircraft systems (rwUAS) requires several considerations for mitigating biases from the aircraft and its environment. In this study, we focus on how the method of temperature sensor integration can impact the quality of its measurements. To minimize non-environmental heat sources and prevent any contamination coming from the rwUAS body, two configurations with different sensor placements are proposed for comparison. The first configuration consists of a custom quadcopter with temperature and humidity sensors placed below the propellers for aspiration. The second configuration incorporates the same quadcopter design with sensors instead shielded inside of an L-duct and aspirated by a ducted fan. Additionally, an autopilot algorithm was developed for these platforms to face them into the wind during flight for kinematic wind estimations. This study will utilize in situ rwUAS observations validated against tower-mounted reference instruments to examine how measurements are influenced both by the different configurations as well as the ambient environment. Results indicate that both methods of integration are valid but the below-propeller configuration is more susceptible to errors from solar radiation and heat from the body of the rwUAS. Full article
(This article belongs to the Special Issue Application of Unmanned Aircraft Systems for Atmospheric Science)
Show Figures

Figure 1

23 pages, 2003 KiB  
Article
An IoT Surveillance System Based on a Decentralised Architecture
by Amilcare Francesco Santamaria, Pierfrancesco Raimondo, Mauro Tropea, Floriano De Rango and Carmine Aiello
Sensors 2019, 19(6), 1469; https://doi.org/10.3390/s19061469 - 26 Mar 2019
Cited by 49 | Viewed by 9696
Abstract
In the last few years, we witnessed numerous episodes of terrorist attacks and menaces in public crowded places. The necessity of better surveillance in these places pushed the development of new automated solutions to spot and notify possible menaces as fast as possible. [...] Read more.
In the last few years, we witnessed numerous episodes of terrorist attacks and menaces in public crowded places. The necessity of better surveillance in these places pushed the development of new automated solutions to spot and notify possible menaces as fast as possible. In this work, we propose a novel approach to create a decentralized architecture to manage patrolling drones and cameras exploiting lightweight protocols used in the internet of things (IoT) domain. Through the adoption of the mist computing paradigm it is possible to give to all the object of the smart ecosystem a cognitive intelligence to speed up the recognition and analysis tasks. Distributing the intelligence among all the objects of the surveillance ecosystem allows a faster recognition and reaction to possible warning situations. The recognition of unusual objects in certain areas, e.g., airports, train stations and bus stations, has been made using computer vision algorithms. The adoption of the IoT protocols in a hierarchical architecture provides high scalability allowing an easy and painless join of other smart objects. Also a study on the soft real-time feasibility has been conducted and is herein presented. Full article
Show Figures

Figure 1

14 pages, 15020 KiB  
Article
Mass Surveilance of C. elegans—Smartphone-Based DIY Microscope and Machine-Learning-Based Approach for Worm Detection
by Julia Bornhorst, Eike Jannik Nustede and Sebastian Fudickar
Sensors 2019, 19(6), 1468; https://doi.org/10.3390/s19061468 - 26 Mar 2019
Cited by 14 | Viewed by 5945
Abstract
The nematode Caenorhabditis elegans (C. elegans) is often used as an alternative animal model due to several advantages such as morphological changes that can be seen directly under a microscope. Limitations of the model include the usage of expensive and cumbersome microscopes, and [...] Read more.
The nematode Caenorhabditis elegans (C. elegans) is often used as an alternative animal model due to several advantages such as morphological changes that can be seen directly under a microscope. Limitations of the model include the usage of expensive and cumbersome microscopes, and restrictions of the comprehensive use of C. elegans for toxicological trials. With the general applicability of the detection of C. elegans from microscope images via machine learning, as well as of smartphone-based microscopes, this article investigates the suitability of smartphone-based microscopy to detect C. elegans in a complete Petri dish. Thereby, the article introduces a smartphone-based microscope (including optics, lighting, and housing) for monitoring C. elegans and the corresponding classification via a trained Histogram of Oriented Gradients (HOG) feature-based Support Vector Machine for the automatic detection of C. elegans. Evaluation showed classification sensitivity of 0.90 and specificity of 0.85, and thereby confirms the general practicability of the chosen approach. Full article
(This article belongs to the Special Issue Smartphone-Based Biosensing)
Show Figures

Figure 1

14 pages, 460 KiB  
Article
A Trust-Based Predictive Model for Mobile Ad Hoc Network in Internet of Things
by Waleed Alnumay, Uttam Ghosh and Pushpita Chatterjee
Sensors 2019, 19(6), 1467; https://doi.org/10.3390/s19061467 - 26 Mar 2019
Cited by 68 | Viewed by 5010
Abstract
The Internet of things (IoT) is a heterogeneous network of different types of wireless networks such as wireless sensor networks (WSNs), ZigBee, Wi-Fi, mobile ad hoc networks (MANETs), and RFID. To make IoT a reality for smart environment, more attractive to end users, [...] Read more.
The Internet of things (IoT) is a heterogeneous network of different types of wireless networks such as wireless sensor networks (WSNs), ZigBee, Wi-Fi, mobile ad hoc networks (MANETs), and RFID. To make IoT a reality for smart environment, more attractive to end users, and economically successful, it must be compatible with WSNs and MANETs. In light of this, the present paper discusses a novel quantitative trust model for an IoT-MANET. The proposed trust model combines both direct and indirect trust opinion in order to calculate the final trust value for a node. A Beta probabilistic distribution is used to combine different trust evidences and direct trust has been calculated. The theory of ARMA/GARCH has been used to combine the recommendation trust evidences and predict the resultant trust value of each node in multi-step ahead. Further, a routing protocol has been designed to ensure the secure and reliable end-to-end delivery of packets by only considering trustworthy nodes in the path. Simulation results show that our proposed trust model outperforms similar existing trust models. Full article
(This article belongs to the Section Internet of Things)
Show Figures

Figure 1

19 pages, 8065 KiB  
Article
How to Efficiently Determine the Range Precision of 3D Terrestrial Laser Scanners
by Berit Schmitz, Christoph Holst, Tomislav Medic, Derek D. Lichti and Heiner Kuhlmann
Sensors 2019, 19(6), 1466; https://doi.org/10.3390/s19061466 - 26 Mar 2019
Cited by 46 | Viewed by 5666
Abstract
As laser scanning technology has improved a lot in recent years, terrestrial laser scanners (TLS) have become popular devices for surveying tasks with high accuracy demands, such as deformation analyses. For this reason, finding a stochastic model for TLS measurements is very important [...] Read more.
As laser scanning technology has improved a lot in recent years, terrestrial laser scanners (TLS) have become popular devices for surveying tasks with high accuracy demands, such as deformation analyses. For this reason, finding a stochastic model for TLS measurements is very important in order to get statistically reliable results. The measurement accuracy of laser scanners—especially of their rangefinders—is strongly dependent on the scanning conditions, such as the scan configuration, the object surface geometry and the object reflectivity. This study demonstrates a way to determine the intensity-dependent range precision of 3D points for terrestrial laser scanners that measure in 3D mode by using range residuals in laser beam direction of a best plane fit. This method does not require special targets or surfaces aligned perpendicular to the scanner, which allows a much quicker and easier determination of the stochastic properties of the rangefinder. Furthermore, the different intensity types—raw and scaled—intensities are investigated since some manufacturers only provide scaled intensities. It is demonstrated that the intensity function can be derived from raw intensity values as written in literature, and likewise—in a restricted measurement volume—from scaled intensity values if the raw intensities are not available. Full article
(This article belongs to the Special Issue Terrestrial Laser Scanning)
Show Figures

Figure 1

13 pages, 2241 KiB  
Article
Evaluating the Potential of LJ1-01 Nighttime Light Data for Modeling Socio-Economic Parameters
by Guo Zhang, Xueyao Guo, Deren Li and Boyang Jiang
Sensors 2019, 19(6), 1465; https://doi.org/10.3390/s19061465 - 26 Mar 2019
Cited by 61 | Viewed by 5464
Abstract
The LJ1-01 satellite is the first dedicated nighttime light remote sensing satellite in the world and offers a higher spatial resolution than the Defense Meteorological Satellite Program’s Operational Linescan System (DMSP/OLS) and the Visible Infrared Imaging Radiometer Suite (VIIRS) sensor on the Suomi [...] Read more.
The LJ1-01 satellite is the first dedicated nighttime light remote sensing satellite in the world and offers a higher spatial resolution than the Defense Meteorological Satellite Program’s Operational Linescan System (DMSP/OLS) and the Visible Infrared Imaging Radiometer Suite (VIIRS) sensor on the Suomi National Polar-orbiting Partnership (NPP) satellites of the United States. This study compared the LJ1-01 nighttime light data with NPP/VIIRS data in the context of modeling socio-economic parameters. In the eastern and central regions of China, 10 parameters from the four aspects of gross regional product (annual average population, electricity consumption, and area of land in use) were selected to build linear regression models. The results showed that the LJ1-01 nighttime light data offered better potential for modeling socio-economic parameters than the equivalent NPP/VIIRS data; the former can be an effective tool for establishing models for socio-economic parameters. There were significant positive correlations between the two types of nighttime light data and the 10 socio-economic parameters; that for the gross regional product was the highest. Full article
(This article belongs to the Special Issue The Design, Data Processing and Applications of Luojia 1-01 Satellite)
Show Figures

Figure 1

14 pages, 3163 KiB  
Article
A Posture Recognition Method Based on Indoor Positioning Technology
by Xiaoping Huang, Fei Wang, Jian Zhang, Zelin Hu and Jian Jin
Sensors 2019, 19(6), 1464; https://doi.org/10.3390/s19061464 - 26 Mar 2019
Cited by 25 | Viewed by 4406
Abstract
Posture recognition has been widely applied in fields such as physical training, environmental awareness, human-computer-interaction, surveillance system and elderly health care. The traditional methods consist of two main variations: machine vision methods and acceleration sensor methods. The former has the disadvantages of privacy [...] Read more.
Posture recognition has been widely applied in fields such as physical training, environmental awareness, human-computer-interaction, surveillance system and elderly health care. The traditional methods consist of two main variations: machine vision methods and acceleration sensor methods. The former has the disadvantages of privacy invasion, high cost and complex implementation processes, while the latter has low recognition rate for still postures. A new body posture recognition scheme based on indoor positioning technology is presented in this paper. A single deployed indoor positioning system is constructed by installing wearable receiving tags at key points of the human body. The distance measurement method with ultra-wide band (UWB) radio is applied to position the key points of human body. Posture recognition is implemented by positioning. In the posture recognition algorithm, least square estimation (LSE) method and the improved extended Kalman filtering (iEKF) algorithm are respectively adopted to suppress the noise of the distances measurement and to improve the accuracy of positioning and recognition. The comparison of simulation results with the two methods shows that the improved extended Kalman filtering algorithm is more effective in error performance. Full article
(This article belongs to the Special Issue Smart Monitoring and Control in the Future Internet of Things)
Show Figures

Figure 1

14 pages, 6802 KiB  
Article
Deformation Monitoring of Earth Fissure Hazards Using Terrestrial Laser Scanning
by Yunfeng Ge, Huiming Tang, Xulong Gong, Binbin Zhao, Yi Lu, Yong Chen, Zishan Lin, Hongzhi Chen and Yashi Qiu
Sensors 2019, 19(6), 1463; https://doi.org/10.3390/s19061463 - 26 Mar 2019
Cited by 19 | Viewed by 5454
Abstract
Deformation monitoring is a powerful tool to understand the formation mechanism of earth fissure hazards, enabling the engineering and planning efforts to be more effective. To assess the evolution characteristics of the Yangshuli earth fissure hazard more completely, terrestrial laser scanning (TLS), a [...] Read more.
Deformation monitoring is a powerful tool to understand the formation mechanism of earth fissure hazards, enabling the engineering and planning efforts to be more effective. To assess the evolution characteristics of the Yangshuli earth fissure hazard more completely, terrestrial laser scanning (TLS), a remote sensing technique which is regarded as one of the most promising surveying technologies in geohazard monitoring, was employed to detect the changes to ground surfaces and buildings in small- and large-scales, respectively. Time-series of high-density point clouds were collected through 5 sequential scans from 2014 to 2017 and then pre-processing was performed to filter the noise data of point clouds. A tiny deformation was observed on both the scarp and the walls, based on the local displacement analysis. The relative height differences between the two sides of the scarp increase slowly from 0.169 m to 0.178 m, while no obvious inclining (the maximum tilt reaches just to 0.0023) happens on the two walls, based on tilt measurement. Meanwhile, global displacement analysis indicates that the overall settlement slowly increases for the ground surface, but the regions in the left side of scarp are characterized by a relatively larger vertical displacement than the right. Furthermore, the comparisons of monitoring results on the same measuring line are discussed in this study and TLS monitoring results have an acceptable consistency with the global positioning system (GPS) measurements. The case study shows that the TLS technique can provide an adequate solution in deformation monitoring of earth fissure hazards, with high effectiveness and applicability. Full article
(This article belongs to the Special Issue Terrestrial Laser Scanning)
Show Figures

Graphical abstract

28 pages, 4844 KiB  
Review
Laser-Assisted Printed Flexible Sensors: A Review
by Tao Han, Anindya Nag, Nasrin Afsarimanesh, Subhas Chandra Mukhopadhyay, Sudip Kundu and Yongzhao Xu
Sensors 2019, 19(6), 1462; https://doi.org/10.3390/s19061462 - 25 Mar 2019
Cited by 53 | Viewed by 9285
Abstract
This paper provides a substantial review of some of the significant research done on the fabrication and implementation of laser-assisted printed flexible sensors. In recent times, using laser cutting to develop printed flexible sensors has become a popular technique due to advantages such [...] Read more.
This paper provides a substantial review of some of the significant research done on the fabrication and implementation of laser-assisted printed flexible sensors. In recent times, using laser cutting to develop printed flexible sensors has become a popular technique due to advantages such as the low cost of production, easy sample preparation, the ability to process a range of raw materials, and its usability for different functionalities. Different kinds of laser cutters are now available that work on samples very precisely via the available laser parameters. Thus, laser-cutting techniques provide huge scope for the development of prototypes with a varied range of sizes and dimensions. Meanwhile, researchers have been constantly working on the types of materials that can be processed, individually or in conjugation with one another, to form samples for laser-ablation. Some of the laser-printed techniques that are commonly considered for fabricating flexible sensors, which are discussed in this paper, include nanocomposite-based, laser-ablated, and 3D-printing. The developed sensors have been used for a range of applications, such as electrochemical and strain-sensing purposes. The challenges faced by the current printed flexible sensors, along with a market survey, are also outlined in this paper. Full article
(This article belongs to the Special Issue Printed-Sensors)
Show Figures

Figure 1

19 pages, 2439 KiB  
Article
Automatic Detection of Faults in Race Walking: A Comparative Analysis of Machine-Learning Algorithms Fed with Inertial Sensor Data
by Juri Taborri, Eduardo Palermo and Stefano Rossi
Sensors 2019, 19(6), 1461; https://doi.org/10.3390/s19061461 - 25 Mar 2019
Cited by 40 | Viewed by 5084
Abstract
The validity of results in race walking is often questioned due to subjective decisions in the detection of faults. This study aims to compare machine-learning algorithms fed with data gathered from inertial sensors placed on lower-limb segments to define the best-performing classifiers for [...] Read more.
The validity of results in race walking is often questioned due to subjective decisions in the detection of faults. This study aims to compare machine-learning algorithms fed with data gathered from inertial sensors placed on lower-limb segments to define the best-performing classifiers for the automatic detection of illegal steps. Eight race walkers were enrolled and linear accelerations and angular velocities related to pelvis, thighs, shanks, and feet were acquired by seven inertial sensors. The experimental protocol consisted of two repetitions of three laps of 250 m, one performed with regular race walking, one with loss-of-contact faults, and one with knee-bent faults. The performance of 108 classifiers was evaluated in terms of accuracy, recall, precision, F1-score, and goodness index. Generally, linear accelerations revealed themselves as more characteristic with respect to the angular velocities. Among classifiers, those based on the support vector machine (SVM) were the most accurate. In particular, the quadratic SVM fed with shank linear accelerations was the best-performing classifier, with an F1-score and a goodness index equal to 0.89 and 0.11, respectively. The results open the possibility of using a wearable device for automatic detection of faults in race walking competition. Full article
(This article belongs to the Section Sensor Networks)
Show Figures

Graphical abstract

22 pages, 21714 KiB  
Article
Two-Dimensional Frontier-Based Viewpoint Generation for Exploring and Mapping Underwater Environments
by Eduard Vidal, Narcís Palomeras, Klemen Istenič, Juan David Hernández and Marc Carreras
Sensors 2019, 19(6), 1460; https://doi.org/10.3390/s19061460 - 25 Mar 2019
Cited by 19 | Viewed by 4327
Abstract
To autonomously explore complex underwater environments, it is convenient to develop motion planning strategies that do not depend on prior information. In this publication, we present a robotic exploration algorithm for autonomous underwater vehicles (AUVs) that is able to guide the robot so [...] Read more.
To autonomously explore complex underwater environments, it is convenient to develop motion planning strategies that do not depend on prior information. In this publication, we present a robotic exploration algorithm for autonomous underwater vehicles (AUVs) that is able to guide the robot so that it explores an unknown 2-dimensional (2D) environment. The algorithm is built upon view planning (VP) and frontier-based (FB) strategies. Traditional robotic exploration algorithms seek full coverage of the scene with data from only one sensor. If data coverage is required for multiple sensors, multiple exploration missions are required. Our approach has been designed to sense the environment achieving full coverage with data from two sensors in a single exploration mission: occupancy data from the profiling sonar, from which the shape of the environment is perceived, and optical data from the camera, to capture the details of the environment. This saves time and mission costs. The algorithm has been designed to be computationally efficient, so that it can run online in the AUV’s onboard computer. In our approach, the environment is represented using a labeled quadtree occupancy map which, at the same time, is used to generate the viewpoints that guide the exploration. We have tested the algorithm in different environments through numerous experiments, which include sea operations using the Sparus II AUV and its sensor suite. Full article
(This article belongs to the Section Physical Sensors)
Show Figures

Figure 1

26 pages, 6101 KiB  
Article
Development and Control of a Pneumatic-Actuator 3-DOF Translational Parallel Manipulator with Robot Vision
by Lian-Wang Lee, Hsin-Han Chiang and I-Hsum Li
Sensors 2019, 19(6), 1459; https://doi.org/10.3390/s19061459 - 25 Mar 2019
Cited by 11 | Viewed by 5201
Abstract
A vision-based three degree-of-freedom translational parallel manipulator (TPM) was developed. The developed TPM has the following characteristics. First, the TPM is driven by three rodless pneumatic actuators and is designed as a horizontal structure to enlarge its horizontal working space to cover a [...] Read more.
A vision-based three degree-of-freedom translational parallel manipulator (TPM) was developed. The developed TPM has the following characteristics. First, the TPM is driven by three rodless pneumatic actuators and is designed as a horizontal structure to enlarge its horizontal working space to cover a conveyor. Then, a robot-vision system (including a webcam mounted on the TPM) collects images of objects on the conveyor and transfers them through the LabVIEW application programming interface for image processing. Since it is very difficult to achieve precise position control of the TPM due to the nonlinear couplings among the robot axes, feedback linearization is utilized to design an adaptive interval type-2 fuzzy controller with self-tuning fuzzy sliding-mode compensation (AIT2FC-STFSMC) for each rodless pneumatic actuator to attenuate nonlinearities, function approximation errors, and external disturbances. Finally, experiments proved that the vision-based three degree-of-freedom TPM was capable of accurately tracking desired trajectories and precisely executing pick-and-place movement in real time. Full article
Show Figures

Figure 1

15 pages, 4224 KiB  
Article
Combining Weighted Contour Templates with HOGs for Human Detection Using Biased Boosting
by Shih-Shinh Huang, Shih-Han Ku and Pei-Yung Hsiao
Sensors 2019, 19(6), 1458; https://doi.org/10.3390/s19061458 - 25 Mar 2019
Cited by 1 | Viewed by 2654
Abstract
This paper proposes a method to detect humans in the image that is an important issue for many applications, such as video surveillance in smart home and driving assistance systems. A kind of local feature called the histogram of oriented gradients (HOGs) has [...] Read more.
This paper proposes a method to detect humans in the image that is an important issue for many applications, such as video surveillance in smart home and driving assistance systems. A kind of local feature called the histogram of oriented gradients (HOGs) has been widely used in describing the human appearance and its effectiveness has been proven in the literature. A learning framework called boosting is adopted to select a set of classifiers based on HOGs for human detection. However, in the case of a complex background or noise effect, the use of HOGs results in the problem of false detection. To alleviate this, the proposed method imposes a classifier based on weighted contour templates to the boosting framework. The way to combine the global contour templates with local HOGs is by adjusting the bias of a support vector machine (SVM) for the local classifier. The method proposed for feature combination is referred to as biased boosting. For covering the human appearance in various poses, an expectation maximization algorithm is used which is a kind of iterative algorithm is used to construct a set of representative weighted contour templates instead of manual annotation. The encoding of different weights to the contour points gives the templates more discriminative power in matching. The experiments provided exhibit the superiority of the proposed method in detection accuracy. Full article
(This article belongs to the Special Issue Selected Papers from INNOV 2018)
Show Figures

Figure 1

16 pages, 2058 KiB  
Article
Guide Star Selection for the Three-FOV Daytime Star Sensor
by Liang Wu, Qian Xu, Haojing Wang, Hongwu Lyu and Kaipeng Li
Sensors 2019, 19(6), 1457; https://doi.org/10.3390/s19061457 - 25 Mar 2019
Cited by 20 | Viewed by 3965
Abstract
To realize the application of the star sensor in the all-day carrier platform, a three-field-of-view (three-FOV) star sensor in short-wave infrared (SWIR) band is considered. This new prototype employs new techniques that can improve the detection capability of the star sensor, when the [...] Read more.
To realize the application of the star sensor in the all-day carrier platform, a three-field-of-view (three-FOV) star sensor in short-wave infrared (SWIR) band is considered. This new prototype employs new techniques that can improve the detection capability of the star sensor, when the huge size of star identification feature database becomes a big obstacle. Hence, a way to thin the guide star catalog for three-FOV daytime star sensor is studied. Firstly, an introduction of three-FOV star sensor and an example of three-FOV daytime star sensor with narrow FOV are presented. According to this model and the requirement of triangular star identification method, two constraints based on the number and the brightness of the stars in FOV are put forward for guide star selection. Then on the basis of these constraints, the improved spherical spiral method (ISSM) is proposed and the optimal number of reference points of ISSM is discussed. Finally, to demonstrate the performance of the ISSM, guide star catalogs are generated by ISSM, magnitude filter method (MFM), 1st order self-organizing guide star selection method (1st-SOPM) and the spherical spiral method (SSM), respectively. The results show that the guide star catalog generated by ISSM has the smallest size and the number and brightness characteristics of its guide stars are better than the other methods. ISSM is effective for the guide star selection in the three-FOV daytime star sensor. Full article
Show Figures

Figure 1

20 pages, 9282 KiB  
Article
Power-Frequency Electric Field Sensing Utilizing a Twin-FBG Fabry–Perot Interferometer and Polyimide Tubing with Space Charge as Field Sensing Element
by Lutang Wang and Nian Fang
Sensors 2019, 19(6), 1456; https://doi.org/10.3390/s19061456 - 25 Mar 2019
Cited by 1 | Viewed by 3256
Abstract
A novel fiber-optic sensor based on the alternating electric field force actions on polyimide tubing with space charge for power-frequency electric field sensing is presented. In structure, the sensor consists of a lightweight fiber cantilever beam covered with a length of electrically charged [...] Read more.
A novel fiber-optic sensor based on the alternating electric field force actions on polyimide tubing with space charge for power-frequency electric field sensing is presented. In structure, the sensor consists of a lightweight fiber cantilever beam covered with a length of electrically charged polyimide tubing as the field sensing element. A twin-FBG based Fabry–Perot interferometer is embedded in this fiber beam to detect the beam vibrations excited by the force of power-frequency electric field to be sensed. Space charge in polyimide tubing is formed through a dielectric charging process. The basic concept, structure, fabrication and operation principle of the sensor are introduced with detailed theoretical analyses. The comprehensive experiments with two sensor prototypes are carried out, in which a sensor exhibits a high sensitivity of 173.65 μV/(V/m) with a minimal detectable field strength of 0.162 V/m, and another has a durability of continuous operation for over a year. Full article
(This article belongs to the Section Physical Sensors)
Show Figures

Figure 1

11 pages, 2338 KiB  
Communication
FRET-Based Semiconducting Polymer Dots for pH Sensing
by Jiemei Ou, Huijun Tan, Zhong Chen and Xudong Chen
Sensors 2019, 19(6), 1455; https://doi.org/10.3390/s19061455 - 25 Mar 2019
Cited by 12 | Viewed by 3693
Abstract
Förster resonance energy transfer (FRET)-based polymer dots (Pdots), fabricated by semiconducting polymers and exhibiting excellent properties, have attracted much interest in the last decade, however, full polymer-dot-based pH sensors are seldom systematically exploited by researchers. In this work, we constructed a kind of [...] Read more.
Förster resonance energy transfer (FRET)-based polymer dots (Pdots), fabricated by semiconducting polymers and exhibiting excellent properties, have attracted much interest in the last decade, however, full polymer-dot-based pH sensors are seldom systematically exploited by researchers. In this work, we constructed a kind of blend polymer dot, utilizing poly[(9,9-dihexyl-9H-fluorene-2,7-vinylene)-co-(1-methoxy-4-(2-ethylhexyloxy)-2,5-phenylenevinylene)] (PFV) as the donor, poly[2,5-bis(3′,7′-dimethyloctyloxy)-1,4-phenylenevinylene] (BDMO-PPV) as the acceptor, and polysytrene graft EO functionalized with carboxy (PS-PEG-COOH) to generate surface carboxyl groups. This type of Pdot, based on the FRET process, was quite sensitive to pH value changes, especially low pH environments. When the pH value decreases down to 2 or 1, the fluorescence spectrum of Pdots-20% exhibit spectral and intensity changes at the same time, and fluorescence lifetime changes as well, which enables pH sensing applications. The sharpening of the emission peak at ~524 nm, along with the weakening and blue shifts of the emission band at ~573 nm, imply that the efficiency of the energy transfer between PFV and BDMO-PPV inside the Pdots-20% decreased due to polymer chain conformational changes. The time-resolved fluorescence measurements supported this suggestion. Pdots constructed by this strategy have great potential in many applications, such as industrial wastewater detection, in vitro and intracellular pH measurement, and DNA amplification and detection. Full article
(This article belongs to the Special Issue Resonant Sensors)
Show Figures

Figure 1

11 pages, 1057 KiB  
Article
Earthquake Magnitude Estimation Using a Total Noise Enhanced Optimization Model
by Kyunghyun Lee, Jinhwan Oh, Hyukwoo Lee and Kwanho You
Sensors 2019, 19(6), 1454; https://doi.org/10.3390/s19061454 - 25 Mar 2019
Cited by 2 | Viewed by 3361
Abstract
In this paper, a heterodyne laser interferometer, which is used as a sensor for high-precision displacement measurement, is introduced to measure ground vibration and seismic waves as a seismometer. The seismic wave is measured precisely through the displacement variation obtained by the heterodyne [...] Read more.
In this paper, a heterodyne laser interferometer, which is used as a sensor for high-precision displacement measurement, is introduced to measure ground vibration and seismic waves as a seismometer. The seismic wave is measured precisely through the displacement variation obtained by the heterodyne laser interferometer. The earthquake magnitude is estimated using only the P-wave magnitudes for the first 3 s through the total noise enhanced optimization (TNEO) model. We use data from southern California to investigate the relationship between peak acceleration amplitude ( P d ) and the earthquake magnitude ( M g ). For precise prediction of the earthquake magnitude using only the P d value, the TNEO model derives the relation equation between P d and the magnitude, considering the noise present in each measured seismic data. The optimal solution is obtained from the TNEO model based objective function. We proved the performance of the proposed method through simulation and experimental results. Full article
(This article belongs to the Section Intelligent Sensors)
Show Figures

Figure 1

11 pages, 1145 KiB  
Article
Rapid Identification of Kudzu Powder of Different Origins Using Laser-Induced Breakdown Spectroscopy
by Fei Liu, Wei Wang, Tingting Shen, Jiyu Peng and Wenwen Kong
Sensors 2019, 19(6), 1453; https://doi.org/10.3390/s19061453 - 25 Mar 2019
Cited by 21 | Viewed by 3811
Abstract
The rapid identification of kudzu powder of different origins is of great significance for studying the authenticity identification of Chinese medicine. The feasibility of rapidly identifying kudzu powder origin was investigated based on laser-induced breakdown spectroscopy (LIBS) technology combined with chemometrics methods. The [...] Read more.
The rapid identification of kudzu powder of different origins is of great significance for studying the authenticity identification of Chinese medicine. The feasibility of rapidly identifying kudzu powder origin was investigated based on laser-induced breakdown spectroscopy (LIBS) technology combined with chemometrics methods. The discriminant models based on the full spectrum include extreme learning machine (ELM), soft independent modeling of class analogy (SIMCA), K-nearest neighbor (KNN) and random forest (RF), and the accuracy of models was more than 99.00%. The prediction results of KNN and RF models were best: the accuracy of calibration and prediction sets of kudzu powder from different producing areas both reached 100%. The characteristic wavelengths were selected using principal component analysis (PCA) loadings. The accuracy of calibration set and the prediction set of discrimination models, based on characteristic wavelengths, is all higher than 98.00%. Random forest and KNN have the same excellent identification results, and the accuracy of calibration and prediction sets of kudzu powder from different producing areas reached 100%. Compared with the full spectrum discriminant analysis model, the discriminant analysis model based on the characteristic wavelength had almost the same discriminant effects, and the input variables were reduced by 99.92%. The results of this research show that the characteristic wavelength can be used instead of the LIBS full spectrum to quickly identify kudzu powder from different producing areas, which had the advantages of reducing input, simplifying the model, increasing the speed and improving the model effect. Therefore, LIBS technology is an effective method for rapid identification of kudzu powder from different habitats. This study provides a basis for LIBS to be applied in the genuineness and authenticity identification of Chinese medicine. Full article
(This article belongs to the Section Physical Sensors)
Show Figures

Figure 1

17 pages, 2716 KiB  
Article
A Passive Source Location Method in a Shallow Water Waveguide with a Single Sensor Based on Bayesian Theory
by Xiaoman Li, Shengchun Piao, Minghui Zhang and Yan Liu
Sensors 2019, 19(6), 1452; https://doi.org/10.3390/s19061452 - 25 Mar 2019
Cited by 7 | Viewed by 2546
Abstract
Bayesian methodology is a good way to infer unknown parameters in a marine environment. A passive source location method in a shallow water waveguide with a single sensor based on Bayesian theory is presented in this paper. The input of a Bayesian inversion [...] Read more.
Bayesian methodology is a good way to infer unknown parameters in a marine environment. A passive source location method in a shallow water waveguide with a single sensor based on Bayesian theory is presented in this paper. The input of a Bayesian inversion algorithm is received different normal mode impulse signals, which are separated and extracted with a warping transformation from received broadband impulse signals. The source range, depth, and other seabed parameters were estimated without prior knowledge of the seabed information. Different normal mode impulse acoustic signals travelling at different group speeds arrived at the sensor at different times because of the dispersion characteristics of the shallow water waveguide. The time delay of different modes can be used for the passive source location. However, normal mode group speeds are greatly affected by the environmental parameters. The performance of the passive location becomes negative when parameters mismatch. In this paper, the source location was transformed to the inversion of the source location and environmental parameters, which can be estimated accurately based on the multi-dimensional posterior probability density (PPD). This method is less limited by environmental factors, and the accuracy of inversion results can be analyzed according to the PPD of inversion parameters, which has higher reliability and a wider application scope. The effectiveness and robustness of the algorithm were quantified in terms of the root mean squared error (RMSE) at a variety of signal-to-noise ratios (SNRs) in 50 simulation sets. The RMSE values decreased with the SNR. The validity and accuracy of the method were proved by the results of simulation and experiment data. Full article
(This article belongs to the Section Physical Sensors)
Show Figures

Figure 1

Previous Issue
Next Issue
Back to TopTop