Article

Prevalence and Incidence of Black Band Disease of Scleractinian Corals in the Kepulauan Seribu Region of Indonesia

1
Research and Development Institute for Ornamental Fish Culture, Jl. Perikanan No. 13, Pancoran Mas, Kota Depok, Jawa Barat 16436, Indonesia
2
Department of Marine Science and Technology, Faculty of Fisheries and Marine Science, Bogor Agricultural University, Jl. Agatis No.1 Kampus IPB Darmaga, Bogor 16680, Indonesia
3
School of Biological Sciences, Medical Biology Centre, Queen’s University Belfast, Belfast BT9 7BL, UK
4
Molecular Health and Disease Laboratory, Enviornmental Sustainability Research Centre, College of Life and Natural Sciences, University of Derby, Kedleston Road, Derby DE22 1GB, UK
*
Author to whom correspondence should be addressed.
Diversity 2016, 8(2), 11; https://doi.org/10.3390/d8020011
Submission received: 11 January 2016 / Revised: 9 April 2016 / Accepted: 15 April 2016 / Published: 28 April 2016
(This article belongs to the Special Issue Coral Reef Biodiversity and Conservation)

Abstract

:
Black band disease (BBD) is the oldest recognised disease associated with scleractinian corals. However, despite this, few BBD surveys have been conducted in the Indonesian archipelago, one of the world’s hot spots for coral diversity. In this study, we show that BBD was recorded in the reefs of Kepulauan Seribu, Indonesia, at the time of surveying. The disease was found to mainly infect corals of the genus Montipora. In some instances, upwards of 177 colonies (31.64%) were found to be infected at specific sites. Prevalence of the disease ranged from 0.31% to 31.64% of Montipora sp. colonies throughout the archipelago. Although BBD was found at all sites, lower frequencies were associated with sites closest to the mainland (17.99 km), as well as those that were furthest away (63.65 km). Despite there being no linear relationship between distance from major population centers and BBD incidence, high incidences of this disease were associated with sites characterized by higher levels of light intensity. Furthermore, surveys revealed that outbreaks peaked during the transitional period between the dry and rainy seasons. Therefore, we suggest that future surveys for disease prevalence in this region of Indonesia should focus on these transitory periods.

1. Introduction

Indonesian coral reefs account for 51% of those found within Southeast Asia and comprise 18% of the world's total coral reef area [1]. They also boast the highest coral biodiversity in the world, with at least 480 coral species identified to date [1,2]. This highlights the importance of this particular region to overall coral ecology. However, as is the case around the world, reefs in Indonesia are threatened by many anthropogenic factors including pollution, over-exploitation of marine biota, and destructive fishing practices [3]. Coupled with the effects of climate change, which are predicted to lead to increased incidences of bleaching and disease, degraded reefs are now a more common sight than pristine systems [4,5].
Despite a wealth of coral disease research having been conducted within the Caribbean and the wider Indo-Pacific region, few baseline disease surveys have been conducted in Indonesia. It took 32 years from the initial discovery of diseases [6] before Indonesian reefs were surveyed for the presence or absence of disease [7]. Since then, only a handful of studies have assessed the prevalence of coral disease in this region [8,9]. This study therefore aimed at assessing the prevalence and incidence of one of the most dominant coral diseases in the Indo-Pacific, black band disease (BBD), across both spatial and temporal scales, within Kepulauan Seribu, Jakarta, Indonesia. We also explored the potential for local water quality conditions to affect disease etiology in this region.

2. Material and Methods
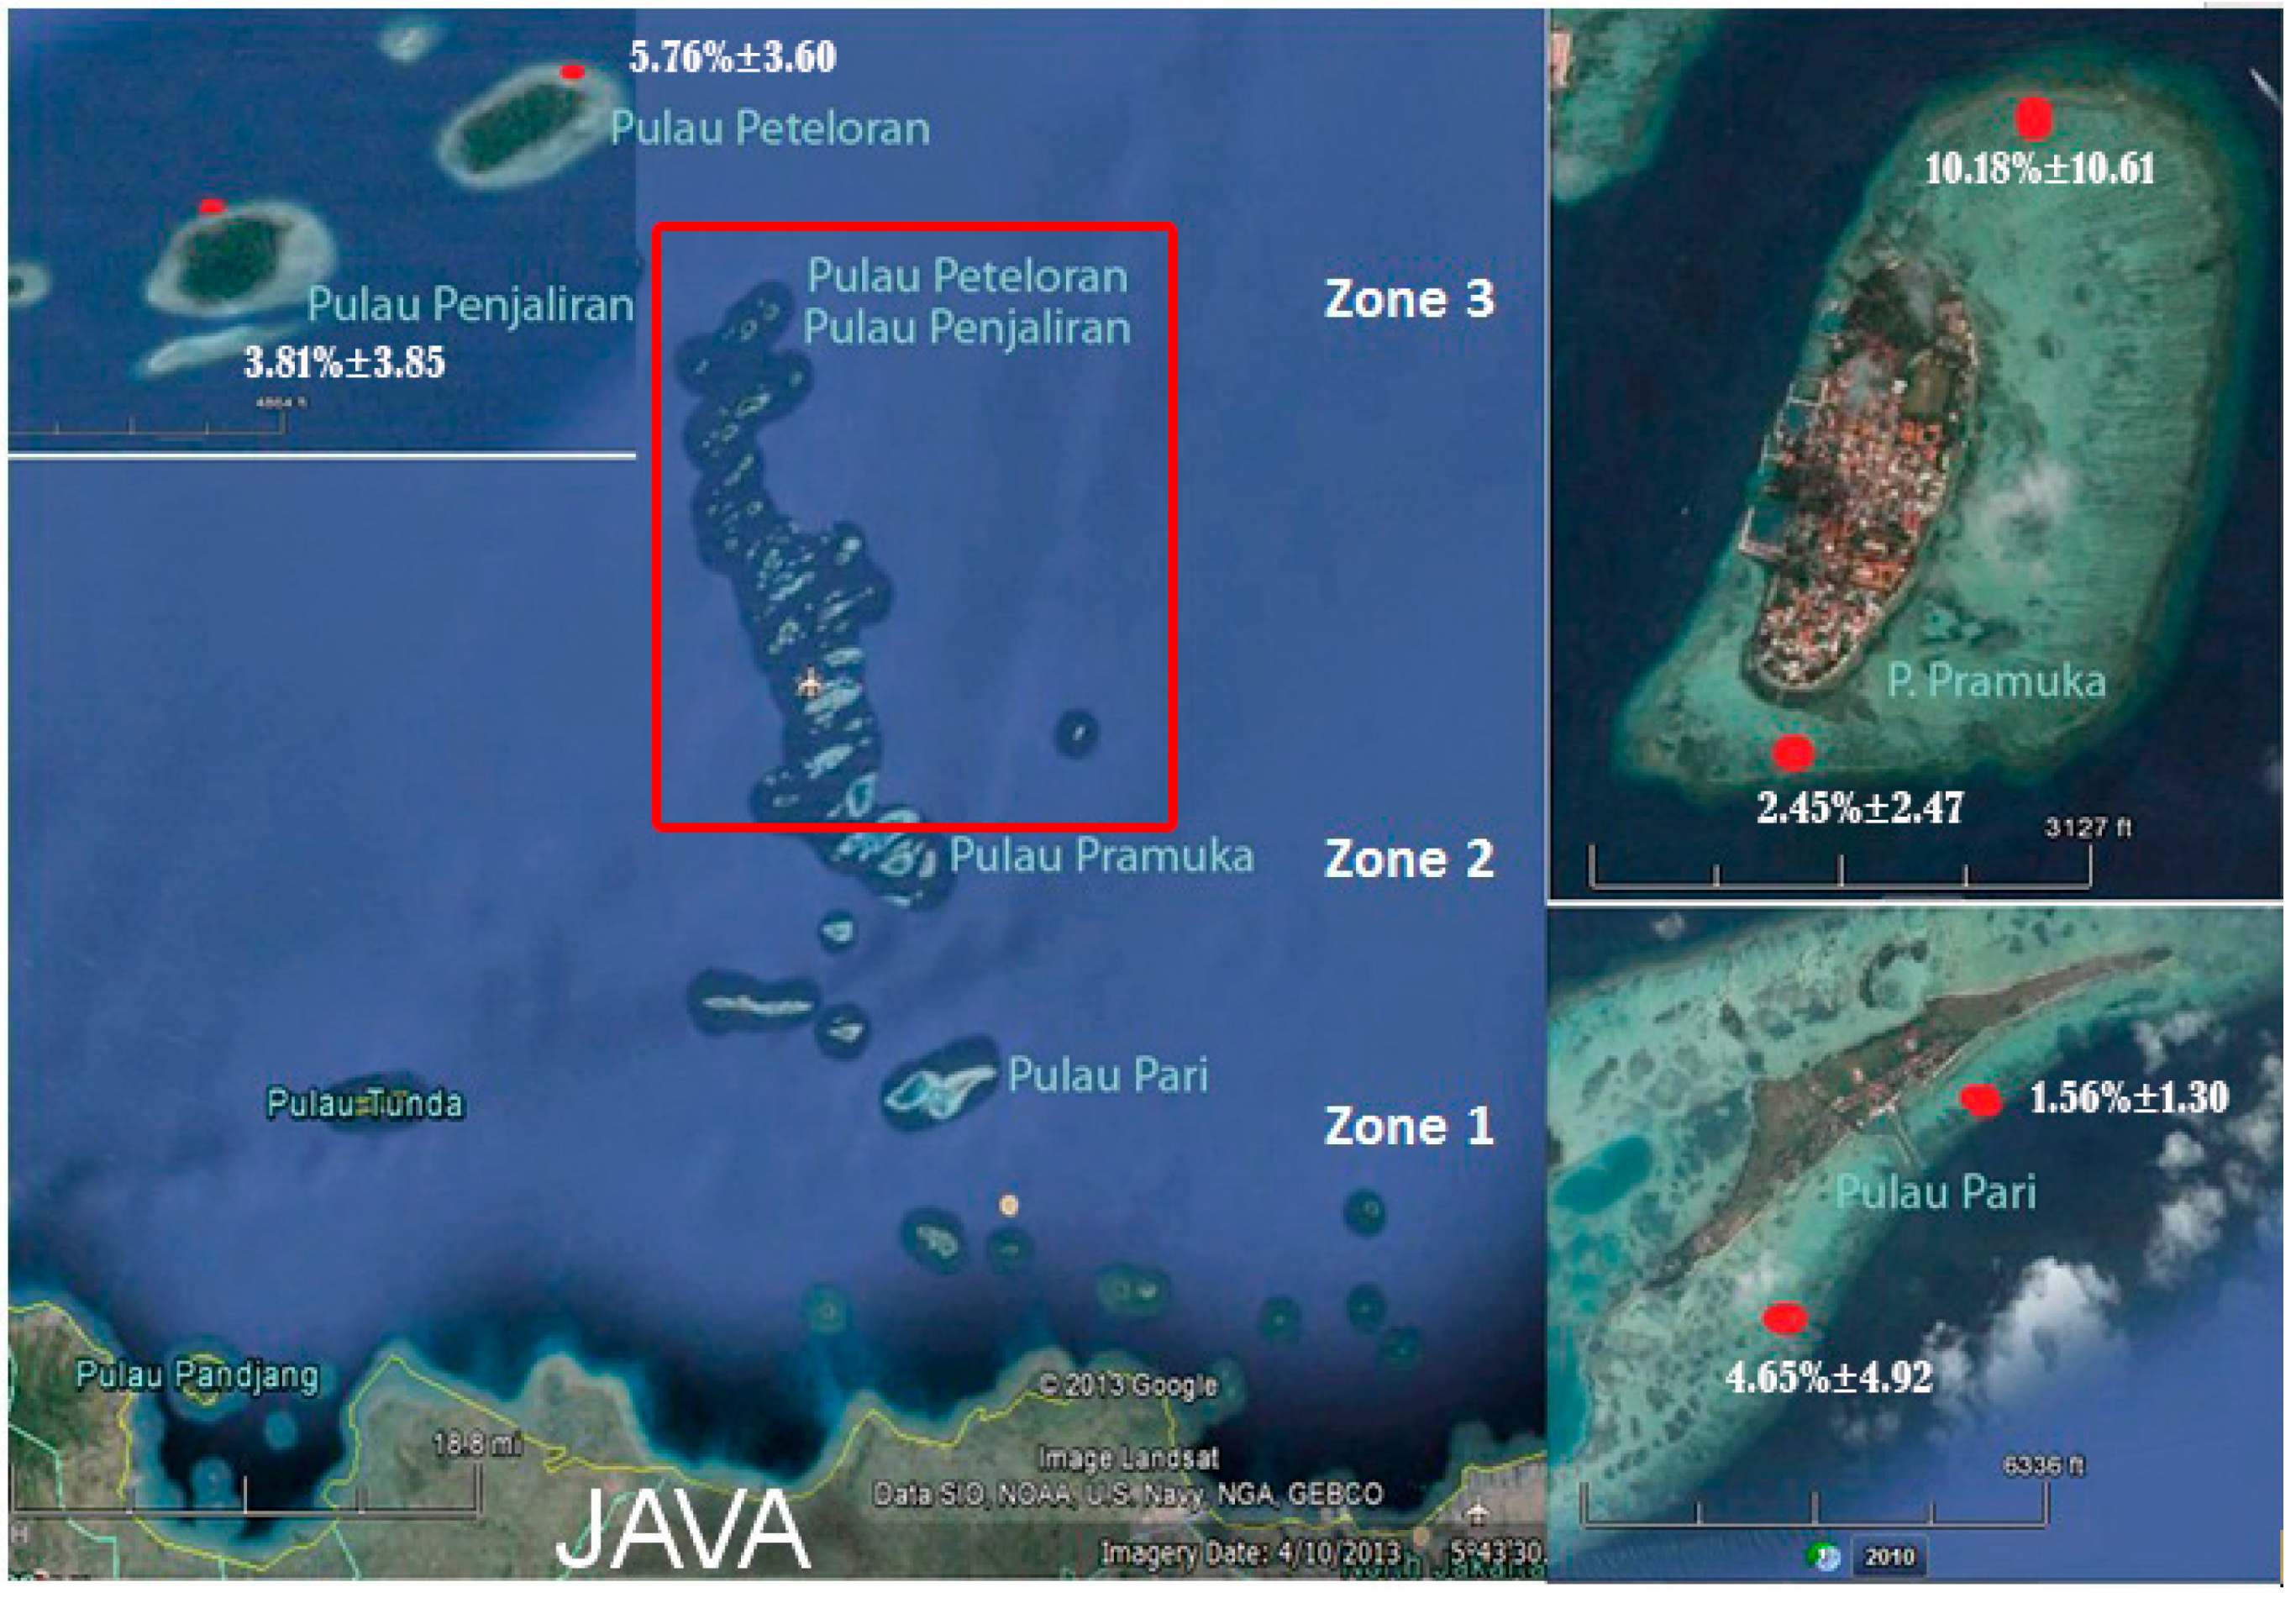
2.1. Research Sites

The prevalence and incidence of BBD were monitored at reef sites belonging to three different islands in Kepalauan Seribu, an archipelago located near the densely populated island of Java. Island selection (Figure 1) was based on distance from the mainland (i.e., Java). Two islands; Southern Pari (05°52′14.0′′ S, 106°36′38.8′′ E) and Eastern Pari (05°51’30.5” S, 106°37’25.9” E) represented the nearest sites (Zone 1, 17.99 km from Java), Southern Pramuka (05°45′01.9′′ S, 106°36′41.5′′ E) and Northern Pramuka (5°44′24.9′′ S, 106°37′14.5” E) represented the middle sites (Zone 2, 31.70 km from Java), and Peteloran (05°27′07.6′′ S, 106°33′44.9′′ E) and Penjaliran Timur (05°27′34.0′′ S, 106°33′49.3′′ E) represented the farthest sites (Zone 3, 63.65 km from Java). Pari Island and Pramuka Island are inhabited, while Peteloran and Penjaliran Timur are within the core zone of the uninhabited National Marine Park (and thus assumed to be an area less exposed to sources of anthropogenic pollution). It should also be noted that fish farming is undertaken to a large extent around Pramuka Island (Zone 2).

2.2. Survey Methods

The study was carried out over one year from June 2011 to February 2012, allowing the incorporation of two seasons (dry and rainy), as well as the transitional period between them. The total number of colonies (both healthy and diseased), coral genera, and types of disease were recorded along belt transects (3 m × 20 m), recording all observations 1 m to the left and right of the transect line. Coral disease prevalence was calculated by comparing the total number of corals affected by disease to that of the total number of coral colonies observed (infected + healthy) for each location. BBD prevalence was assessed within reefs by conducting surveys at the reef crest (1.5-m depth) by snorkeling and the slope (7-m depth) by SCUBA at each site. The surveys at a 1.5-m depth were carried out at six sites throughout the three zones during 2011 (spatial and temporal data) and the surveys at a 7-m depth were carried out during November 2011 when an outbreak of BBD was recorded at eight sites at Zone 2 (spatial data). Temporal data were collected every month at six sites within the zone. Corals were identified at the genus level. Underwater images were taken using a Cannon I × us 120 camera. Both factors (spatial and temporal) were considered in the statistical analyses, as described below. At each location, diseased colonies were tagged to aid in disease incidence monitoring. Temperature and light intensity (recorded by HOBO data loggers, Onset Corporation, Bourne, MA, USA) were recorded at 2-h intervals at one site per zone at a depth of 1.5 m. Both temperature and light intensity data were calculated as an average over the total duration of the study and compared with other zones.

2.3. Black Band Disease Incidence

BBD incidence was calculated based on the number of new infections that arose in a given population over time. In the first month of observation, infected colonies were tagged (see above). This meant new infection could be identified in subsequent observations and thus, incidence rates determined. Incidence data was calculated by comparing the number of newly infected colonies with the total number of healthy and diseased coral colonies within the same location. Similar to prevalence data, incidence recordings were taken across both spatial (n = 6 sites; South and East of Pari Island, South and North of Pramuka Island, Penjaliran Island and Peteloran Island) and temporal (n = 3 seasons; dry-season ranged from June to October 2011, the transition period from November to December and the rainy season from January to February 2012) scales. Note, incidence data was not collected at the deeper depths (7 m) for this study.

2.4. Statistical Analysis

A Kruskal-Wallis test was carried out on data to determine differences in disease prevalence at different locations and between seasons, as the data were not normally distributed. Disease prevalence between different depths was analyzed using a nested ANOVA. Two-way ANOVAs were used to determine whether temperature and light differed over time and between sites. Tukey’s post hoc tests were conducted to determine individual mean differences between certain groups when an overall effect (p < 0.05) was found in the ANOVA and Kruskal-Wallis tests.

3. Results

3.1. Black Band Disease Prevalence

BBD was only found to infect corals from the genus Montipora (Figure 2), with average prevalence between 1.03 and 21.98% between zones. The highest average BBD prevalence throughout the year was found at Zone 2 (6.31%), followed by Zone 3 (4.78%), and then Zone 1 (3.11%). It should be noted, though, that there were significant differences in BBD prevelance between the different sites (p > 0.05) (Table 1). BBD prevalence was also found to be significantly higher (t = 5280, p = 0.002) on the reef crest (12.53%; 1.5 m), compared to that of the reef slope (0.05%; 7 m) (Table 1, Figure 2).
BBD was identified at each location throughout the year (Figure 1). However, prevalence peaked in the transitional period between the dry and rainy seasons (November 2011), a result which was reflected at all sites surveyed (Figure 3). The highest prevalence during sampling was recorded at Pramuka Island with the average from 2 sites totaling 19.82% (for Zone 2 during the transitional season—see Figure 3). This is followed by the peak in prevelance at Penjaliran and Peteloran Island located within Zone 3 (11.79%) and at Pari Island or Zone 1 (5.98%) (Figure 3). BBD prevalence decreased after two weeks, in contrast to Northern Pramuka and Peteloran (Zones 2 and 3), in which BBD prevalence took one month to decrease from its peak (Figure 3). Following infection during the peak season, minor signs of coral recovery were apparent at all sites.

3.2. Black Band Disease Incidence

Twenty-three genera of scleractinian corals and one genera of octocorallia were found during the surveys, however only Montipora spp. were impacted by BBD across all surveys and time periods (Table 2). Incidence rates in this genus ranged from 0 to 16.17%. Average BBD incidence in Montipora spp. was found to be highest within Zone 2 (3.18%), followed by Zone 3 (1.67%), and lowest at Zone 1 (0.92%). A significant difference in the number of new BBD cases was found between South Pari and East Pari Islands (Kruskal-Wallis X2 = 5.381, p = 0.020) and between East Pari and North Pramuka Islands (Kruskal-Wallis X2 = 5.851, p = 0.016). Temporal observations (carried out every month for a year) revealed that BBD incidence increased during the dry season and reached a peak during the transitional season (Figure 3).

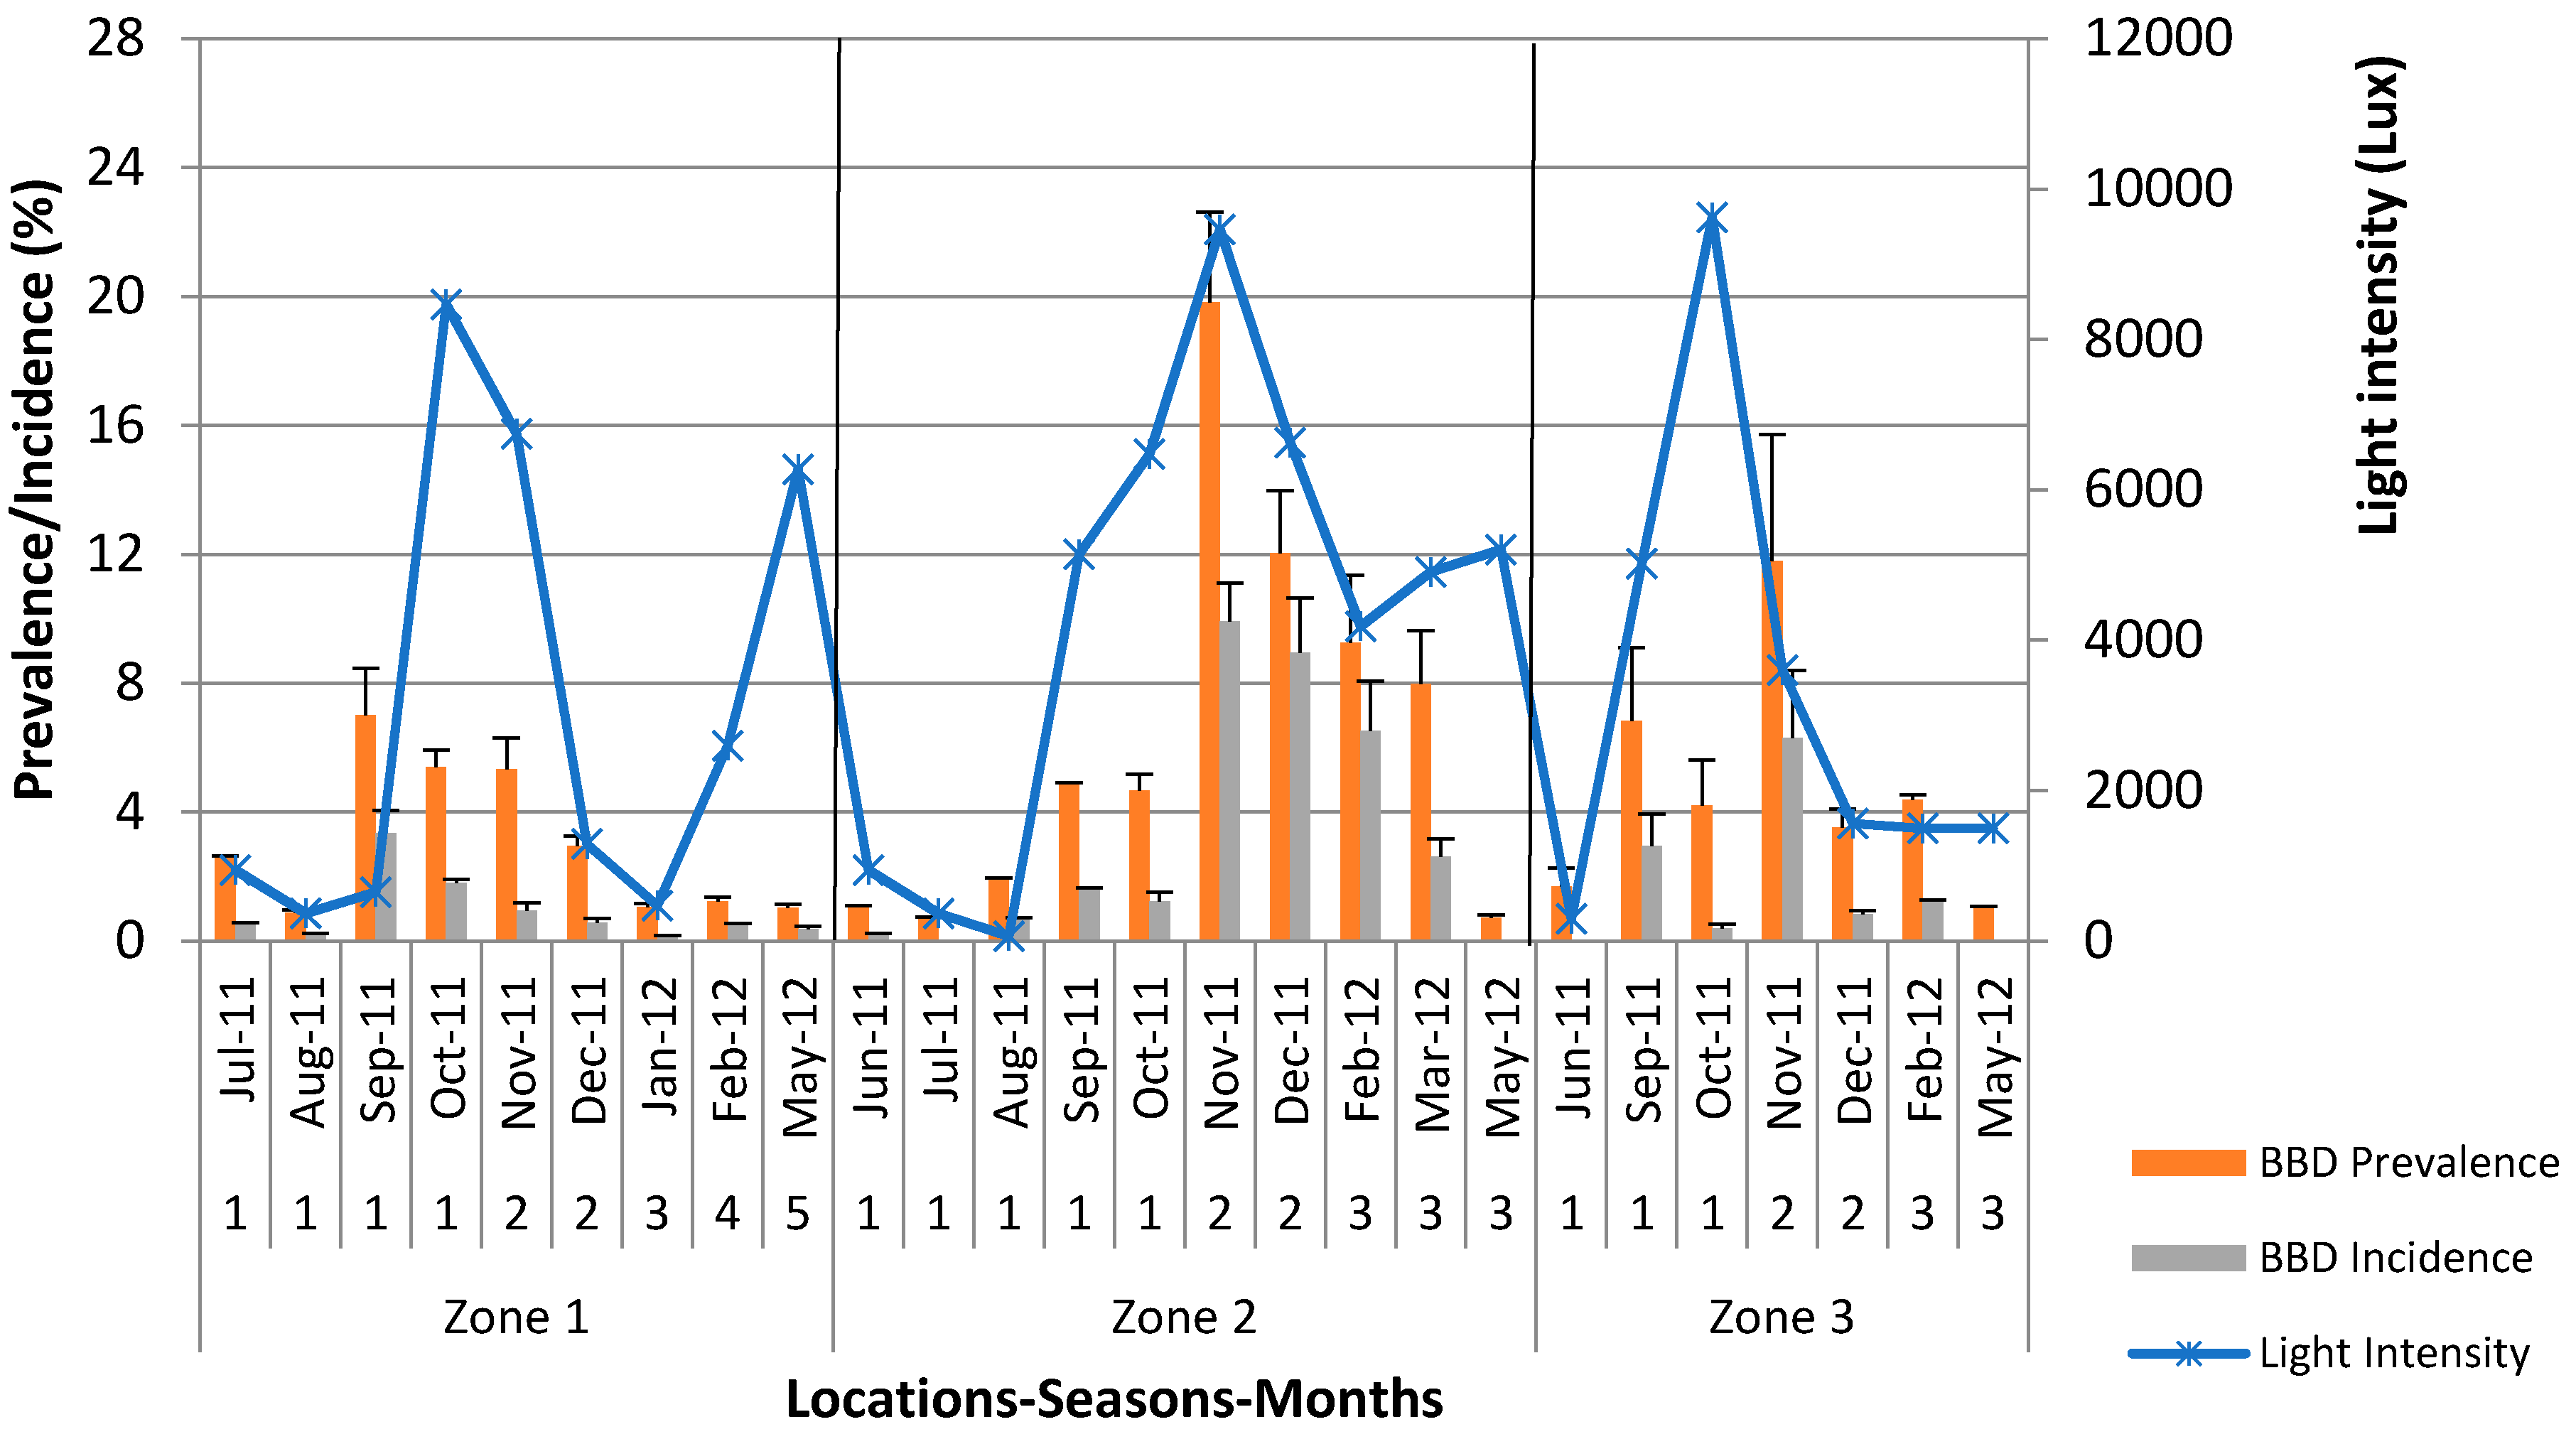
3.3. Environmental Parameters

Water temperatures were found to fluctuate across seasons at each of the different study sites. Peak temperatures were observed to occur during the transitional phase (November and December) at each location (29.87 ± 0.694 °C at Zone 1, 29.78 ± 0.1153 °C at Zone 2, and 29.82 ± 0.198 °C at Zone 3). However, throughout the sampling period, there was no significant variation in temperatures between the different sites In contrast, light intensity was higher in Zone 2 (8046.87 ± 2004.87 lux), with Zones 1 and 3 showing values of 4019.21 ± 3859.03 lux and 2583.46 ± 1443.03 lux, respectively. Light intensity peaked during early November in 2011 (the transitional period). This season is characterized by very slow currents and/little wave action, resulting in increased light intensity compared to other seasons. Moreover, this area has a well established fish farm located within the study site, which is likely a source of nutrients which may in turn influence the incidence of disease at this particular location. However, that said, there was no significant variation in light intensity noted between the study sites at any of the sampling times. There was, however, a significant difference in BBD prevelance associated with depth (Table 1), with a greater prevelance of corals showing BBD in shallower waters (Figure 2).

4. Discussion

4.1. Prevalence of Black Band Disease

BBD was identified throughout the archipelago, being present at every site surveyed. BBD prevalence was found to be highest around North Pramuka Island (Zone 2). The prevalence of BBD at the sites surveyed during this study is considerably higher than those levels previously reported at other locations, such as the Caribbean, where BBD is frequently recorded but at background levels of between 0.02% and 8% [6,8,10,11,12,13,14]. The highest records of BBD prevalence to date, have been from the Great Barrier Reef (GBR), where reported incidences of up to 19% have been recorded [15]. In this study, prevalence reaching 31.64% at sites such as North Pramuka Island and is therefore alarming. Furthermore, as the dominant coral (Montipora sp.) associated with many of these reefs also appears to be the most vulnerable to this disease, BBD could likely have very significant effects on the ecosystem as a whole. Indeed, if we base the status of reefs in Kepulauan Seribu on classifications first outlined by Antonious [16], these reefs can be categorized as being in a “catastrophic” state, with over 177 colonies (31.64%) showing BBD at North Pramuka Island alone (records taken during the peak season and/or the transition period between October and November 2012).

4.2. Black Band Disease Incidence

BBD incidence peaked during the transitional period in November (after the dry season, though prior to the full onset of the rainy season) in the middle regions of Kepulauan Seribu (Zone 2). This is in contrast to findings by Bruckner [13] who found that BBD incidence on Jamaican reefs reached a peak during the rainy season, when nutrient runoff from the land was also recorded at its highest level [13]. These contrasting results may be due to other factors known to cause increases in coral disease prevalence, such as increased temperature and light intensity [17].

4.3. Effect of Environmental Factors on BBD Prevalence

Both prevalence and incidence of BBD increased in the dry season and peaked during the transitional phase (between the dry and rainy seasons). Spatially, BBD prevalence was on average highest in the middle of the archipelago around Pramuka (Zone 2) and lowest closest to the mainland at Pari Island (Zone 1). This suggests that BBD prevalence is unlikely linked directly to anthropogenic factors such as pollution and nutrient run-off from Jakarta bay, which in turn is influenced by high population in Jakarta, as had been originally hypothesized. If this was indeed the case, sites closer to populated islands would have a higher prevalence of BBD. Although, on average, this was not the case, during one of the seasons, the dry season (June to October 2011), BBD prevalence was indeed shown to be higher closest to the mainland (Pari Island, Zone 1). Interestingly, at this time, the current system moves from southeast to southwest, resulting in waste and sediment from 13 rivers being offloaded into Jakarta Bay, suggesting there may still be an association of BBD prevalence and pollution in at least some instances. That said, BBD was still found at sites in Kepulauan Seribu that are the greatest distant from any major population center. Relatively high incidences of BBD were also found at sites in Puerto Rico (Mona Island) that were over 120 km from the “mainland” of Puerto Rico [18]. Collectively, these results suggest that temperature and light may be a more likely primary driver of BBD prevalence, than pollution and other anthropogenic factors. This hypothesis is further supported by our findings which show that higher BBD prevalence is associated with the reef crest compared to the reef slope. Here, temperature and light intensity are higher. As BBD is caused by photosynthetically active cyanobacteria [19], these results are not entirely surprising.

5. Conclusions

BBD prevalence and incidence were found to be higher within the middle region of Kepulauan Seribu and occurred more frequently during the transitional phase between the dry and rainy seasons. Furthermore, BBD prevalence was higher on the reef flats than on the reef slopes, indicating that BBD is more prevalent in shallower waters in Zone 2. Although no significant correlation was found between BBD prevalence and light intensity, a high incidence of the disease did correlate with a spike in both temperature and light levels, suggesting some linkage. These results support previous findings and indicate that BBD is strongly associated with environmental parameters, namely light, likely due in some way to the cyanobacteria associated with this disease. An important outcome of this study is the finding that BBD is prevalent at all of the six study sites and does not increase with proximity to major urban centres. We recommend that future studies should be focused around building a monitoring network related to coral disease throughout Indonesia, especially during the transition period between the dry and rainy seasons, when BBD was observed to occur at the highest prevelance.

Acknowledgments

We would like to thank the Marine National Park of Kepulauan Seribu for providing accomadation during the research field trips and to the two reviwers, who’s comments helped improve this manuscript.

Author Contributions

Ofri Johan and Neviaty P. Zamany conducted the field work, analyzed the data and wrote the paper; David Smith, helped analyze the data and wrote the paper, Michael J. Sweet supervised the project, analyzed the data and wrote the paper.

Conflicts of Interest

The authors declare no conflict of interest.

References

  1. Burke, L.; Selig, E.; Spalding, M. Reefs at Risk in Southeast Asia; World Resources Institute: Cambridge, UK, 2002; p. 44. [Google Scholar]
  2. Bryant, D.; Burke, L.; McManus, J.; Spalding, M. Reefs at risk: A map-based indicator of threats to the World’s coral reefs. World Resource Institute: Washington, DC, USA, 1998; p. 56. [Google Scholar]
  3. Fadila; Idris. Two Years Comparation of Life Percentage of Coral in Kepulauan Seribu (2003, 2005, dan 2007). In Coral Reef of Jakarta; Long-term Monitoring of Coral Reef in Kepulauan Seribu (2003–2007); Edy Setiawan, E.; Yusri, S. (Eds.) The Indonesian Coral Reef Foundation: Jakarta, Indonesia, 2009; p. 102. (In Indonesian)
  4. Galloway, S.B.; Bruckner, A.W.; Woodley, C.M. (Eds.) Coral Health and Disease in the Pacific: Vision for Action. NOAA Technical Memorandum NOS NCCOS 97 and CRCP 7; National Oceanic and Atmospheric Administration: Silver Spring, MD, USA, 2009.
  5. Carpenter, K.E.; Abrar, M.; Aeby, G.; Aronson, R.; Banks, S.; Bruckner, A.; Chiriboga, A.; Cortes, J.; Delbeek, C.; DeVantier, L.; et al. One-third of reef-building coral face elevated extinction risk from climate change and local impacts. Science 2008, 321, 560–563. [Google Scholar] [CrossRef] [PubMed]
  6. Antonius, A. New observations on coral destruction in reefs. In Proceedings of the 10th Meeting the Association of Island Marine Laboratories of the Caribbean, Mayagüez, Puerto Rico, 4–7 September 1973.
  7. Sabdono, A.; Radjasa, O.K. Genetic Diversity of Bacteria Associated with Coral—Producing Antibacterial Compounds in an Effort to Control the Black Band Disease on Coral Reefs Ecosystem; Research Report, Coastal and Tropical Marine Studies Center; Research Institution of Dipenegoro University: Kota Semarang, Indonesia, 2004; p. 30. (In Indonesian) [Google Scholar]
  8. Haapkylä, J.; Seymour, A.S.; Trebilco, J.; Smith, D. Coral disease prevalence and coral health in the Wakatobi Marine Park, Southeast Sulawesi, Indonesia. J. Mar. Biol. Assoc. UK 2007, 87, 5582:1–5582:12. [Google Scholar] [CrossRef]
  9. Yusri, S.; Estadivari. Distribution of Infection by White Syndrome and Coral Bleaching to Coral Communities in Petondan Timur Island, Kepulauan Seribu. Ber. Biol. 2007, 8, 223–229. (In Indonesian) [Google Scholar]
  10. Garrett, P.; Ducklow, H. Coral diseases in Bermuda. Nature 1975, 253, 349–350. [Google Scholar] [CrossRef]
  11. Edmunds, P.J. Extent and effect of black band disease on a Caribbean reef. Coral Reefs. 1991, 10, 161–165. [Google Scholar] [CrossRef]
  12. Kuta, K.G.; Richardson, L.L. Abundance and distribution of black band disease on coral reefs in the northern Florida Keys. Coral Reefs 1996, 15, 219–223. [Google Scholar] [CrossRef]
  13. Bruckner, A.W.; Bruckner, R.J.; Williams, E.H. Spread of a black-band disease epizootic through the coral reef system in St. Ann’s Bay, Jamaica. Bull. Mar. Sci. 1997, 61, 919–928. [Google Scholar]
  14. Haapkyla, J.; Flavell, M.; Melbourne-Thomas, J.; Willis, B.L. Spatio-temporal patterns of coral disease prevalence on Heron Island, Great Barrier Reef, Australia. Coral Reefs 2010, 29, 1035–1045. [Google Scholar] [CrossRef]
  15. Miller, I.R. Black band disease on the Great Barrier Reef. Coral Reefs 1996, 15, 58. [Google Scholar]
  16. Antonius, A. Pathologic syndromes on reef corals: A review. Proc 2nd Eur Meet ISRS. Pub Serv Geol Lux 1995, 29, 231–235. [Google Scholar]
  17. Kuta, K.G.; Richardson, L.L. Ecological aspects of black band disease of corals: Relationships between disease incidence and environmental factors. Coral Reefs 2002, 21, 393–398. [Google Scholar]
  18. Bruckner, A.W. Black Band Disease (BBD) of Scleractinian Corals: Occurrence, Impacts and Mitigation. Ph.D. Thesis, University of Puerto Rico, Mayagüez, Puerto Rico, 1999; p. 286. [Google Scholar]
  19. Antonius, A. The “band” diseases in coral reefs. In Proceedings of the 4th International Coral Reef Symposium, Manila, Philippines, 18–22 May 1981; pp. 7–14.
Figure 1. Maps showing the locations of each zone monitored in this study. Zone 1 = nearest sites (Southern Pari and Eastern Pari islands) with a population of 2458. Zone 2 = middle sites (Southern Pramuka and Northern Pramuka islands) with a population of 5123. Zone 3 = farthest sites (Penjaliran and Peteloran islands) as core zone of marine park which no population. The red squares represent the core zone of the Marine National Park area and the red points represent the six study sites with prevalence average of all sampling times of BBD (Source: Google Earth).
Diversity 08 00011 g001
Figure 2. (a) Representative image of Montipora sp. showing signs of BBD, which often started in the centre of the colonies; (b) the majority of colonies showing signs of BBD were found in shallow waters (less than 2 m depth).
Diversity 08 00011 g002
Figure 3. Coral disease prevalence and incidence on each season (dry season = 1; transition period = 2; and the rainy season = 3). Light intensity is displayed as a blue line. Zone are separated with a vertical lines.
Diversity 08 00011 g003
Table 1. A Kruskal-Wallis test to determine the effects of site and season on black band disease (BBD) prevalence and incidence. The effect indicate less than (<), higher than (>) and difference between location and season based on 95% statistic level (*).
EffectdfPrevalence X2/ pIncidence X2/ pPost-hoc Comparisons
Prevalence: East Pari x North Pramuka14.86/0.0728.98/0.11East Pari < North Pramuka (*)
East Pari x Peteloran16.19/0.013East Pari < Peteloran (*)
South Pramuka x Peteloran14.62/0.032South Pramuka > Peteloran (*)
Incidence: South Pari x East Pari (*)15.38/0.020South Pari > East Pari (*)
East Pari x North Pramuka15.85/0.016East Pari < North Pramuka (*)
East Pari x Peteloran13.48/0.062East Pari < Peteloran (*)
Prevalence based on season26.14/0.0467.76/0.021Rainy season > transition period > dry season
Zone 1: Transition x rain16.49/0.011Transition period > rain (*)
Zone 2: Dry x transition17.180/0.007Dry < transition (*)
Zone 3: Transition x rain13.682/0.055Transition > rain (*)
Insidence based on season218.312/0.053Transition period-Zone 1> dry season-Zone 2 > transition period-Zone 1
Zone 1: Dry x rainy13.291/0.070dry > rainy (*)
Zone 2: Transition x rainy15.999/0.014transition > rainy (*)
Depth (Site)F = 6.132/0.001-Crest > slope
Table 2. Coral genera and number of colonies found across sites in shallow water less than 2 m depth. Coral Montipora spp. are more abundant than other genera.
PhylumFamilyGenusSouth PariEast TimurSouth PramukaNorth PramukaNorth PeteloranEast PenjaliranTotalAbundance
SlceractiniaAcroporidae1Acropora spp.1521802257813415091922.38
2Montipora spp.467661399519251223251861.36
Faviidae3Favia spp.1002106180.43
4Favites spp.171917918721.74
5Leptoria spp.00010890.21
6Goniastrea spp.2101320260.64
7Platygyra spp.40010150.11
8Cyphastrea spp.231305130.32
Agariciidae9Leptoseris spp.0016000160.38
10Coeloseris spp.00040040.09
11Pavona spp.4714300280.67
Fungiidae12Fungia spp.12201050.13
Poritidae13Goniopora spp.501402120.29
14Porites spp.2513655226422225.41
Oculinidae15Galaxea spp.320131021481.18
Merulinidae16Hydnophora spp.424452200.48
17Merulina spp.01000230.07
Mussidae18Lobophyllia spp.13010050.12
19Symphyllia spp.01010350.13
Pocilloporidae20Pocillopora spp.17261744791192.90
21Stylopora spp.10110030.08
22Seriatopora hystrix3204000270.65
Siderastreiidea23Psammocora spp.222221100.24
OctocoralliaAlcyonacea24Lobophytum sp.0000011
Total colonies7359607847354314604104
Total species18151719101688

