
Genetic Diversity in Apple Fruit Moth Indicate Different Clusters in the Two Most Important Apple Growing Regions of Norway


Abstract
:1. Introduction
2. Materials and Methods
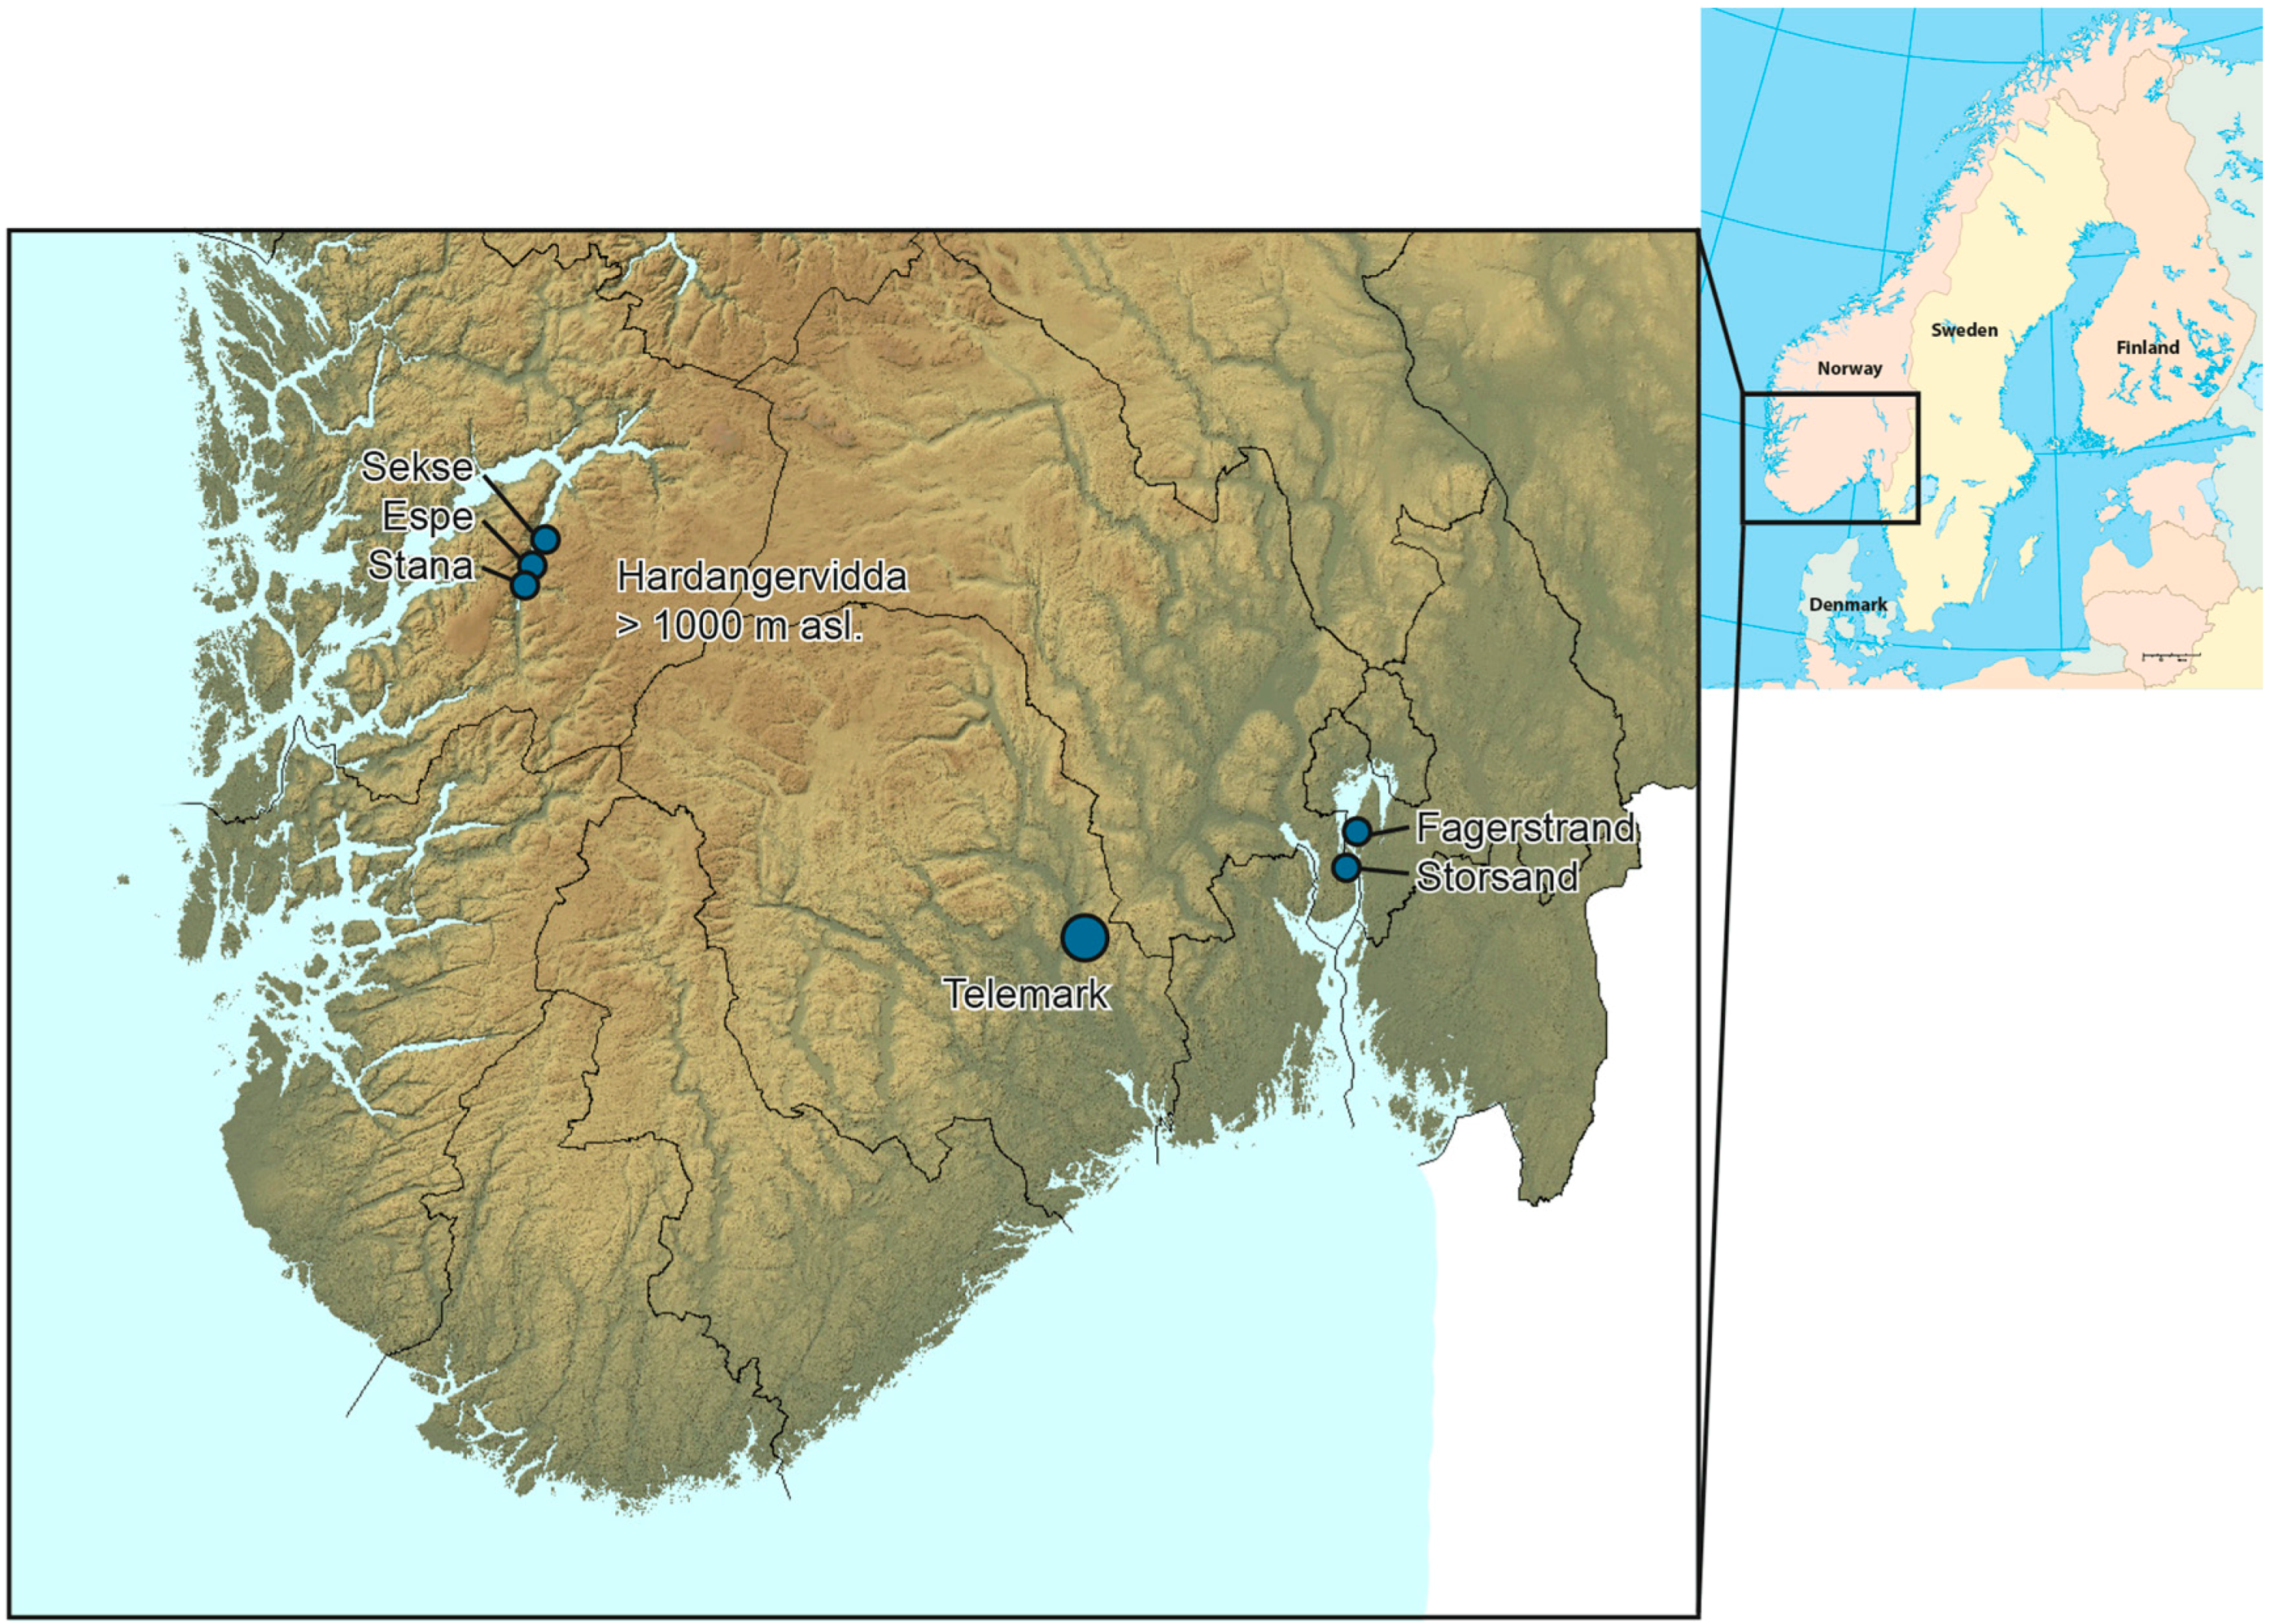
2.1. Collection of A. conjugella Materials
2.2. DNA Extraction
2.3. AFLP Analysis
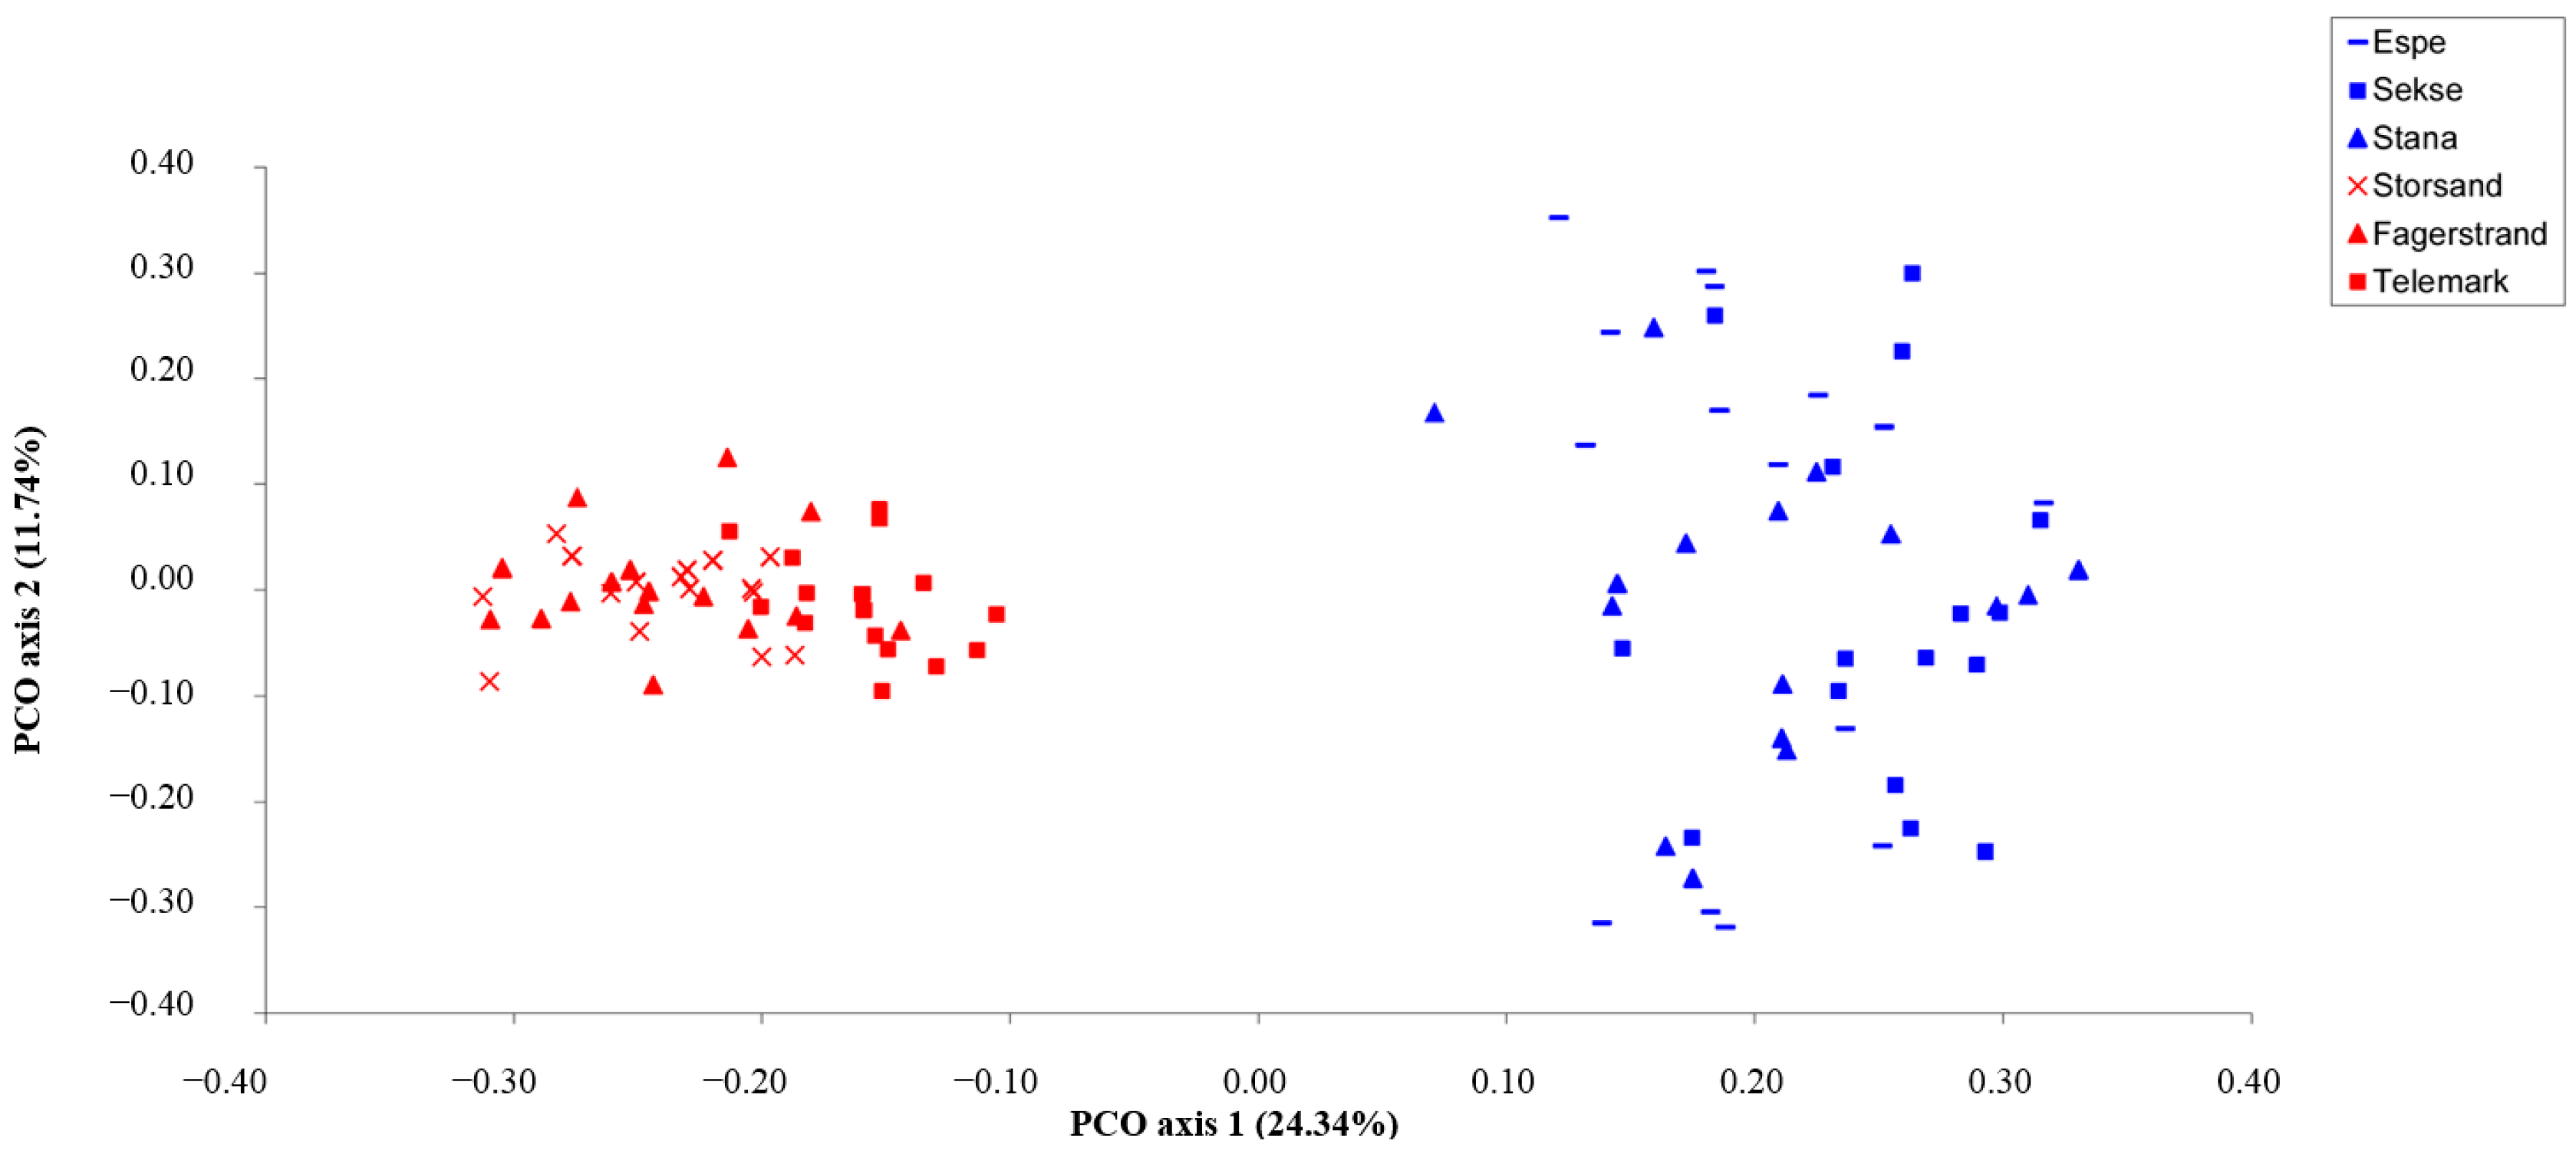
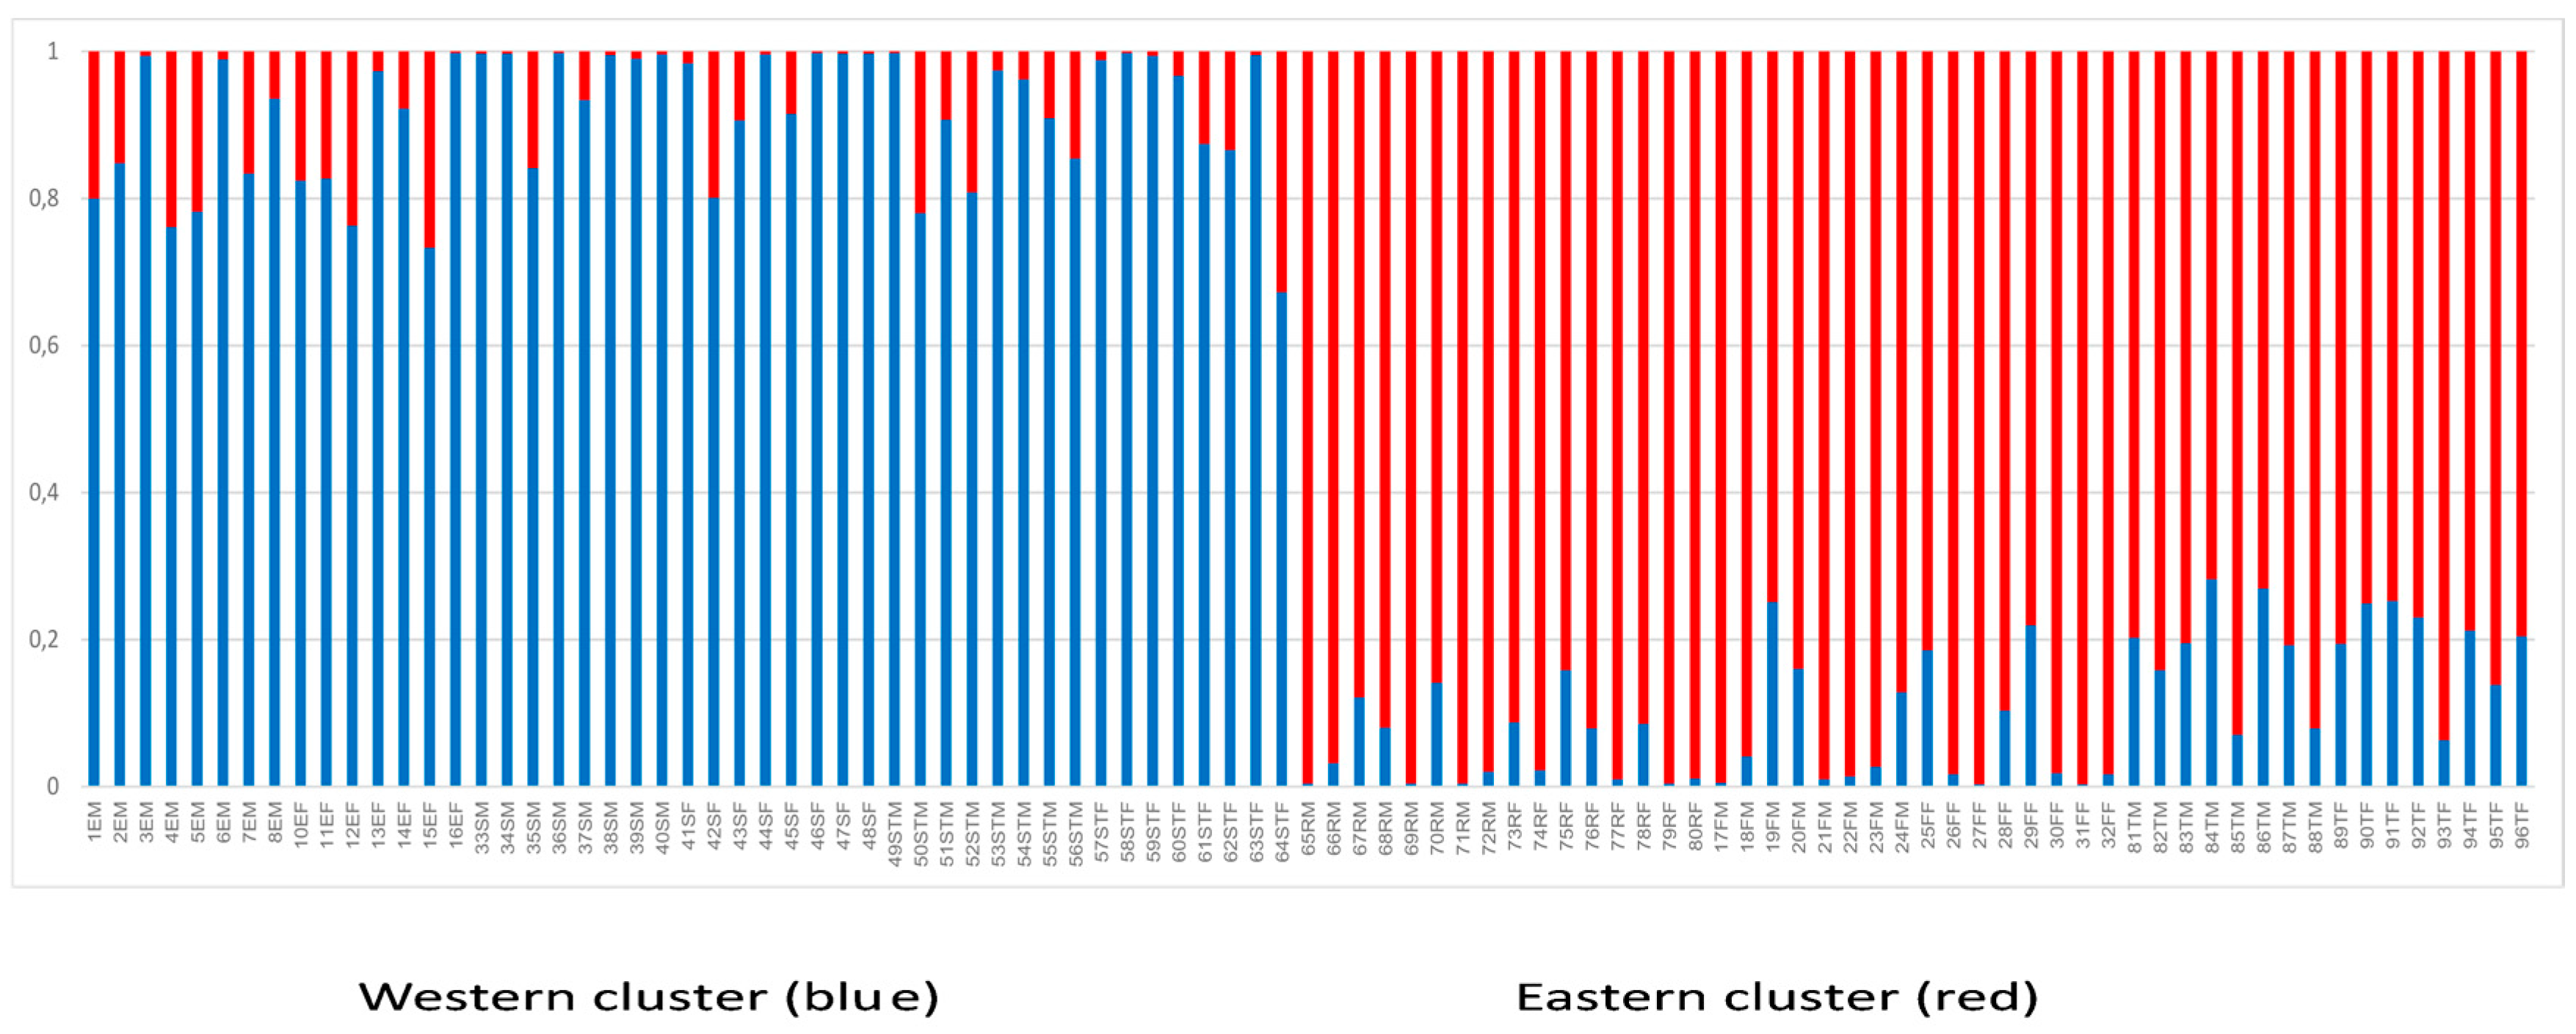
2.4. Data Analyses
3. Results
4. Discussion
Supplementary Materials
Acknowledgments
Author Contributions
Conflicts of Interest
References
- Kristensen, N.P.; Scoble, M.J.; Karsholt, O. Lepidoptera phylogeny and systematics: The state of inventorying moth and butterfly diversity. Zootaxa 2007, 1668, 699–747. [Google Scholar]
- Sharma, J.; Khajuria, D.; Dogra, G. Studies on the apple fruit moth, Argyresthia conjugella zeller (Yponomeutidae: Lepidoptera): Identification, distribution and extent of damage in India. Int. J. Pest Manag. 1988, 34, 189–192. [Google Scholar]
- Fletcher, J. Canada, Department of Agriculture, Central Experimental Farm. Report of the Entomologist and Botanist 1896; Government Printing Bureau: Ottawa, ON, Canada, 1897; pp. 226–276.
- Schøyen, T.H. Beretning om skadeinsekter og Plantesygdomme; Grøndahl og Søns bogtrykkeri: Kristiania, Norway, 1899. (In Norwegian) [Google Scholar]
- Bengtsson, M.; Jaastad, G.; Knudsen, G.; Kobro, S.; Bäckman, A.C.; Pettersson, E.; Witzgall, P. Plant volatiles mediate attraction to host and non-host plant in apple fruit moth, Argyresthia conjugella. Entomol. Exp. Appl. 2006, 118, 77–85. [Google Scholar] [CrossRef]
- Kobro, S.; Søreide, L.; Djønne, E.; Rafoss, T.; Jaastad, G.; Witzgall, P. Masting of rowan Sorbus aucuparia L. and consequences for the apple fruit moth Argyresthia conjugella zeller. Popul. Ecol. 2003, 45, 25–30. [Google Scholar]
- Ribeiro, D.B.; Batista, R.; Prado, P.I.; Brown, K.S., Jr.; Freitas, A.V. The importance of small scales to the fruit-feeding butterfly assemblages in a fragmented landscape. Biodivers. Conserv. 2012, 21, 811–827. [Google Scholar] [CrossRef]
- Tufto, J.; Lande, R.; Ringsby, T.H.; Engen, S.; Sæther, B.E.; Walla, T.R.; DeVries, P.J. Estimating brownian motion dispersal rate, longevity and population density from spatially explicit mark–recapture data on tropical butterflies. J. Anim. Ecol. 2012, 81, 756–769. [Google Scholar] [CrossRef] [PubMed]
- Legal, L.; Dorado, O.; Machkour-M’Rabet, S.; Leberger, R.; Albre, J.; Mariano, N.A.; Gers, C. Ecological constraints and distribution of the primitive and enigmatic endemic mexican butterfly baronia brevicornis (lepidoptera: Papilionidae). Can. Entomol. 2015, 147, 71–88. [Google Scholar] [CrossRef]
- Dingle, H.; Drake, V.A. What is migration? Bioscience 2007, 57, 113–121. [Google Scholar] [CrossRef]
- Roux, O.; Gevrey, M.; Arvanitakis, L.; Gers, C.; Bordat, D.; Legal, L. ISSR: Tool for discrimination and genetic stucture analyses of Plutella xylostella populations native to different geographical areas. Mol. Phylogenet. Evol. 2007, 43, 240–250. [Google Scholar] [CrossRef] [PubMed]
- Laffin, R.; Langor, D.; Sperling, F. Population structure and gene flow in the white pine weevil, Pissodes strobi (Coleoptera: Curculionidae). Ann. Entomol. Soc. Am. 2004, 97, 949–956. [Google Scholar] [CrossRef]
- Fan, Z.; Jiang, G.F.; Liu, Y.X.; He, Q.X.; Blanchard, B. Population explosion in the yellow-spined bamboo Locust Ceracris kiangsu and inferences for the impact of human activity. PLoS ONE 2014, 9, e89873. [Google Scholar] [CrossRef] [PubMed]
- Gomez, A. Molecular ecology of rotifers: From population differentiation to speciation. Hydrobiologia 2005, 546, 83–99. [Google Scholar] [CrossRef]
- Margaritopoulos, J.T.; Voudouris, C.C.; Olivares, J.; Sauphanor, B.; Mamuris, Z.; Tsitsipis, J.A.; Franck, P. Dispersal ability in codling moth: Mark–release–recapture experiments and kinship analysis. Agric. For. Entomol. 2012, 14, 399–407. [Google Scholar] [CrossRef]
- Voudouris, C.C.; Franck, P.; Olivares, J.; Sauphanor, B.; Mamuris, Z.; Tsitsipis, J.; Margaritopoulos, J. Comparing the genetic structure of codling moth Cydia pomonella (L.) from Greece and France: Long distance gene-flow in a sedentary pest species. Bull. Entomol. Res. 2012, 102, 185–198. [Google Scholar] [CrossRef] [PubMed]
- Azevedo, F.; Coutinho, R.; Kraenkel, R. Spatial dynamics of a population with stage-dependent diffusion. Commun. Nonlinear Sci. Numer. Simul. 2015, 22, 605–610. [Google Scholar] [CrossRef]
- Kaňuch, P.; Berggren, Å.; Cassel-Lundhagen, A. Colonization history of Metrioptera roeselii in Northern Europe indicates human-mediated dispersal. J. Biogeogr. 2013, 40, 977–987. [Google Scholar] [CrossRef]
- Chen, H.; Wang, H.; Siegfried, B.D. Genetic differentiation of Western corn rootworm populations (Coleoptera: Chrysomelidae) relative to insecticide resistance. Ann. Entomol. Soc. Am. 2012, 105, 232–240. [Google Scholar] [CrossRef]
- Franck, P.; Reyes, M.; Olivares, J.; Sauphanor, B. Genetic architecture in codling moth populations: Comparison between microsatellite and insecticide resistance markers. Mol. Ecol. 2007, 16, 3554–3564. [Google Scholar] [CrossRef] [PubMed]
- Vos, P.; Hogers, R.; Bleeker, M.; Reijans, M.; van De Lee, T.; Hornes, M.; Friters, A.; Pot, J.; Paleman, J.; Kuiper, M. AFLP: A new technique for DNA fingerprinting. Nucleic Acids Res. 1995, 23, 4407–4414. [Google Scholar] [CrossRef] [PubMed]
- Martinelli, S.; Clark, P.; Zucchi, M.; Silva-Filho, M.; Foster, J.E.; Omoto, C. Genetic structure and molecular variability of Spodoptera frugiperda (Lepidoptera: Noctuidae) collected in maize and cotton fields in Brazil. Bull. Entomol. Res. 2007, 97, 225–231. [Google Scholar] [CrossRef] [PubMed]
- Krumm, J.T.; Hunt, T.E.; Skoda, S.R.; Hein, G.L.; Lee, D.J.; Clark, P.L.; Foster, J.E. Genetic variability of the European corn borer, Ostrinia nubilalis, suggests gene flow between populations in the Midwestern United States. J. Insect Sci. 2008, 8, 72. [Google Scholar] [CrossRef] [PubMed]
- Kneeland, K.; Coudron, T.A.; Lindroth, E.; Stanley, D.; Foster, J.E. Genetic variation in field and laboratory populations of the spine soldier bug, Podisus maculiventris. Entomol. Exp. Appl. 2012, 143, 120–126. [Google Scholar] [CrossRef]
- Barman, A.K.; Sansone, C.; Parajulee, M.N.; Medina, R.F. Population genetic structure of Pseudatomoscelis seriatus (Hemiptera: Miridae) in the cotton-growing regions of the United States. J. Econ. Entomol. 2013, 106, 2225–2233. [Google Scholar] [CrossRef] [PubMed]
- Vela, D.; García Guerreiro, M.P.; Fontdevila, A. Adaptation of the AFLP technique as a new tool to detect genetic instability and transposition in interspecific hybrids. BioTechniques 2011, 50, 247. [Google Scholar] [PubMed]
- Nukazawa, K.; Kazama, S.; Watanabe, K. A hydrothermal simulation approach to modelling spatial patterns of adaptive genetic variation in four stream insects. J. Biogeogr. 2015, 42, 103–113. [Google Scholar] [CrossRef]
- Meglecz, E.; Petenian, F.; Danchin, E.; D’Acier, A.C.; Rasplus, J.Y.; Faure, E. High similarity between flanking regions of different microsatellites detected within each of two species of Lepidoptera: Parnassius apollo and Euphydryas aurinia. Mol. Ecol. 2004, 13, 1693–1700. [Google Scholar] [CrossRef] [PubMed]
- Meglécz, E.; Solignac, M. Brief report microsatellite loci for Parnassius mnemosyne (Lepidoptera). Hereditas 1998, 128, 179–180. [Google Scholar] [CrossRef]
- Zhan, J.; McDonald, B. The interaction among evolutionary forces in the pathogenic fungus Mycosphaerella graminicola. Fung. Genet. Biol. 2004, 41, 590–599. [Google Scholar] [CrossRef] [PubMed]
- Sarhan, A. Isolation and characterization of five microsatellite loci in the Glanville fritillary butterfly (Melitaea cinxia). Mol. Ecol. Notes 2006, 6, 163–164. [Google Scholar] [CrossRef]
- Elameen, A.; Fjellheim, S.; Larsen, A.; Rognli, O.A.; Sundheim, L.; Msolla, S.; Masumba, E.; Mtunda, K.; Klemsdal, S.S. Analysis of genetic diversity in a sweet potato (Ipomoea batatas L.) germplasm collection from Tanzania as revealed by AFLP. Genet. Resour. Crop Evol. 2008, 55, 397–408. [Google Scholar] [CrossRef]
- Dice, L.R. Measures of the amount of ecologic association between species. Ecology 1945, 26, 297–302. [Google Scholar] [CrossRef]
- Jaccard, P. Nouvelles recherches sur la distribution florale. Bull. Soc. Vand. Sci. Nat. 1908, 44, 223–270. [Google Scholar]
- Rohlf, F.J. NTsys-pc: Numerical Taxonomy and Multivariate Analysis System; Exeter Publishing: Setauket, NY, USA, 1992. [Google Scholar]
- Pritchard, J.K.; Stephens, M.; Donnelly, P. Inference of population structure using multilocus genotype data. Genetics 2000, 155, 945–959. [Google Scholar] [PubMed]
- Falush, D.; Stephens, M.; Pritchard, J.K. Inference of population structure using multilocus genotype data: Linked loci and correlated allele frequencies. Genetics 2003, 164, 1567–1587. [Google Scholar] [PubMed]
- Evanno, G.; Regnaut, S.; Goudet, J. Detecting the number of clusters of individuals using the software structure: A simulation study. Mol. Ecol. 2005, 14, 2611–2620. [Google Scholar] [CrossRef] [PubMed]
- Earl, D.A. Structure harvester: A website and program for visualizing structure output and implementing the Evanno method. Conserv. Genet. Resour. 2012, 4, 359–361. [Google Scholar] [CrossRef]
- Excoffier, L.; Smouse, P.E.; Quattro, J.M. Analysis of molecular variance inferred from metric distances among DNA haplotypes: Application to human mitochondrial DNA restriction data. Genetics 1992, 131, 479–491. [Google Scholar] [PubMed]
- Excoffier, L.; Smouse, P.E. Using allele frequencies and geographic subdivision to reconstruct gene trees within a species: Molecular variance parsimony. Genetics 1994, 136, 343–359. [Google Scholar] [PubMed]
- Schneider, S.; Roessli, D.; Excoffier, L. Arlequin: A software for population genetics data analysis. User Manu. Ver. 2000, 2, 2496–2497. [Google Scholar]
- Whitlock, M.C.; McCauley, D.E. Indirect measures of gene flow and migration: FST = 1/(4 nm + 1). Heredity 1999, 82, 117–125. [Google Scholar] [CrossRef] [PubMed]
- Mantel, N. The detection of disease clustering and a generalized regression approach. Cancer Res. 1967, 27, 209–220. [Google Scholar] [PubMed]
- Agunbiade, T.A.; Coates, B.S.; Datinon, B.; Djouaka, R.; Sun, W.; Tamo, M.; Pittendrigh, B.R. Genetic differentiation among Maruca vitrata f. (Lepidoptera: Crambidae) populations on cultivated cowpea and wild host plants: Implications for insect resistance management and biological control strategies. PLoS ONE 2014, 9, e92072. [Google Scholar] [CrossRef] [PubMed]
- Sezonlin, M.; Dupas, S.; Le Rü, B.; Le Gall, P.; Moyal, P.; Calatayud, P.A.; Giffard, I.; Faure, N.; Silvain, J.F. Phylogeography and population genetics of the maize stalk borer Busseola fusca (Lepidoptera, Noctuidae) in sub-Saharan Africa. Mol. Ecol. 2006, 15, 407–420. [Google Scholar] [CrossRef] [PubMed]
- Bettaïbi, A.; Mezghani-Khemakhem, M.; Bouktila, D.; Makni, H.; Makni, M. Genetic variability of the tomato leaf miner (Tuta absoluta meyrick; Lepidoptera: Gelechiidae), in Tunisia, inferred from RAPD-PCR. Chil. J. Agric. Res. 2012, 72, 212–216. [Google Scholar] [CrossRef]
- Legrand, D.; Chaput-Bardy, A.; Turlure, C.; Dubois, Q.; Huet, M.; Schtickzelle, N.; Stevens, V.M.; Baguette, M. Isolation and characterization of 15 microsatellite loci in the specialist butterfly Boloria eunomia. Conserv. Genet. Resour. 2014, 6, 223–227. [Google Scholar] [CrossRef]
- Cheraghali, Z.; Esfandiari, M.; Mossadegh, M.S.; Memari, H.R. Genetic diversity of populations of the stem borer Sesamia nonagrioides (Lepidoptera: Noctuidae) in southern and southwestern Iran, using RAPD-PCR. North-West. J. Zool. 2015, 11, 70–75. [Google Scholar]
- De La Poza, M.; Farinós, G.P.; Beroiz, B.; Ortego, F.; Hernández-Crespo, P.; Castañera, P. Genetic structure of Sesamia nonagrioides (lefebvre) populations in the Mediterranean area. Environ. Entomol. 2008, 37, 1354–1360. [Google Scholar] [CrossRef]
- Pichon, A.; Arvanitakis, L.; Roux, O.; Kirk, A.; Alauzet, C.; Bordat, D.; Legal, L. Genetic differentiation among various populations of the diamondback moth, Plutella xylostella Lepidoptera yponomeutidae. Bull. Entomol. Res. 2006, 96, 137–144. [Google Scholar] [CrossRef] [PubMed]
- Sezonlin, M.; Ndemah, R.; Goergen, G.; Le Rü, B.; Dupas, S.; Silvain, J.F. Genetic structure and origin of Busseola fusca populations in Cameroon. Entomol. Exp. Appl. 2012, 145, 143–152. [Google Scholar] [CrossRef]
- Wei, S.J.; Shi, B.C.; Gong, Y.J.; Jin, G.H.; Chen, X.X.; Meng, X.F. Genetic structure and demographic history reveal migration of the diamondback moth Plutella xylostella (Lepidoptera: Plutellidae) from the southern to northern regions of china. PLoS ONE 2013, 8, e59654. [Google Scholar] [CrossRef] [PubMed]
- Silva-Brandão, K.L.; Santos, T.V.; Cônsoli, F.L.; Omoto, C. Genetic diversity and structure of Brazilian populations of Diatraea saccharalis (Lepidoptera: Crambidae): Implications for pest management. J. Econ. Entomol. 2015, 108, 307–316. [Google Scholar] [CrossRef] [PubMed]
- St Pierre, M.J.; Hendrix, S.D.; Lewis, C.K. Dispersal ability and host-plant characteristics influence spatial population structure of monophagous beetles. Ecol. Entomol. 2005, 30, 105–115. [Google Scholar] [CrossRef]
- DeChaine, E.G.; Martin, A.P. Historic cycles of fragmentation and expansion in Parnassius smintheus (Papilionidae) inferred using mitochondrial DNA. Evolution 2004, 58, 113–127. [Google Scholar] [CrossRef] [PubMed]
- Meng, X.F.; Shi, M.; Chen, X.X. Population genetic structure of Chilo suppressalis (walker) (Lepidoptera: Crambidae): Strong subdivision in china inferred from microsatellite markers and mt-DNA gene sequences. Mol. Ecol. 2008, 17, 2880–2897. [Google Scholar] [CrossRef] [PubMed]
- Seyahooei, M.A.; van Alphen, J.J.; Kraaijeveld, K. Genetic structure of Leptopilina boulardi populations from different climatic zones of Iran. BMC Ecol. 2011, 11, 4. [Google Scholar] [CrossRef] [PubMed]
- Mopper, S. Adaptive genetic structure in phytophagous insect populations. Trends Ecol. Evol. 1996, 11, 235–238. [Google Scholar] [CrossRef]
- Kaňuch, P.; Berggren, Å.; Cassel-Lundhagen, A. Genetic diversity of a successful colonizer: Isolated populations of Metrioptera roeselii regain variation at an unusually rapid rate. Ecol. Evol. 2014, 4, 1117–1126. [Google Scholar] [CrossRef] [PubMed]
- Berman, M.; Austin, C.M.; Miller, A.D. Characterization of the complete mitochondrial genome and 13 microsatellite loci through next-generation sequencing for the new Caledonian spider-ant Leptomyrmex pallens. Mol. Biol. Rep. 2014, 41, 1179–1187. [Google Scholar] [CrossRef] [PubMed]
- Drag, L.; Kosnar, J.; Cizek, L. Development and characterization of ten polymorphic microsatellite loci for the great Capricorn beetle (Cerambyx cerdo) (Coleoptera: Cerambycidae). Conserv. Genet. Resour. 2013, 5, 907–909. [Google Scholar] [CrossRef]
- Elisa Posso, C.; González, R.; Cárdenas, H.; Gallego, G.; Duque, M.C.; Suarez, M.F. Random amplified polymorphic DNA analysis of Anopheles nuneztovari (Diptera: Culicidae) from western and Northeastern Colombia. Memórias do Instituto Oswaldo Cruz 2003, 98, 469–476. [Google Scholar] [CrossRef]
- Ciosi, M.; Masiga, D.K.; Turner, C.M.; Valenzuela, J.G. Laboratory colonisation and genetic bottlenecks in the tsetse fly Glossina pallidipes. PLoS Negl. Trop. Dis. 2014, 8, e2697. [Google Scholar] [CrossRef] [PubMed]
- Charman, T.G.; Sears, J.; Green, R.E.; Bourke, A.F. Conservation genetics, foraging distance and nest density of the scarce great yellow bumblebee (Bombus distinguendus). Mol. Ecol. 2010, 19, 2661–2674. [Google Scholar] [CrossRef] [PubMed]


| Region | Location | ♂ | ♀ | N |
| West | Espe | 8 | 7 | 15 |
| Sekse | 8 | 8 | 16 | |
| Stana | 8 | 8 | 16 | |
| N | 24 | 23 | 47 | |
| East | Storsand | 8 | 8 | 16 |
| Fagerstrand | 8 | 8 | 16 | |
| Telemark | 8 | 8 | 16 | |
| N | 24 | 24 | 48 | |
| Total | 48 | 47 | 95 |
| Primer Combination | EcoRI Primer 5′-3′ | MseI Primer 5′-3′ | Number of Polymorphic Markers |
|---|---|---|---|
| EcoRI0 × MseI0 | GACTGCGTACCAATTC | GATGAGTCCTGAGTAA | |
| EcoRI19 × MseI15 | 6FAM- GACTGCGTACCAATTCGA | GATGAGTCCTGAGTAACA | 77 |
| EcoRI19 × MseI16 | 6FAM-GACTGCGTACCAATTCGA | GATGAGTCCTGAGTAACC | 86 |
| EcoRI19 × MseI17 | 6FAM- GACTGCGTACCAATTCGA | GATGAGTCCTGAGTAACG | 75 |
| EcoRI12 × MseI16 | 6FAM- GACTGCGTACCAATTCAC | GATGAGTCCTGAGTAACC | 91 |
| EcoRI12 × MseI17 | 6FAM- GACTGCGTACCAATTCAC | GATGAGTCCTGAGTAACG | 81 |
| Source of Variation | d.f. | Sum of Squares | Variance Components | Percentage of Variation |
|---|---|---|---|---|
| Within regions | 1 | 898.083 | 15.79340 | 17.33 |
| Among populations with regions | 3 | 560.000 | 4.31102 | 4.73 |
| Among regions | 90 | 6392.125 | 71.02361 | 77.94 |
| Total | 94 | 7850.208 | 91.12804 |
| Regions | 1 | 2 | 3 | 4 | 5 | 6 |
|---|---|---|---|---|---|---|
| 1 | 0.00000 | |||||
| 2 | 0.01469 | 0.00000 | ||||
| 3 | 0.00193 | 0.00496 | 0.00000 | |||
| 4 | 0.19706 | 0.26121 | 0.22103 | 0.00000 | ||
| 5 | 0.19280 | 0.26079 | 0.22350 | 0.01826 | 0.00000 | |
| 6 | 0.17872 | 0.24820 | 0.20326 | 0.13837 | 0.14781 | 0.00000 |
| Regions (No) | No. of Individuals | Expected Heterozygosity | Gene Flow (Nm) | Mean FST |
|---|---|---|---|---|
| Western (1, 2 and 3) | 47 | 0.335 | 34.80 | 0.007 |
| Eastern (4, 5 and 6) | 48 | 0.276 | 2.37 | 0.105 |
| The mean and the total | 95 | 0.306 | 0.40 | 0.780 |
© 2016 by the authors; licensee MDPI, Basel, Switzerland. This article is an open access article distributed under the terms and conditions of the Creative Commons by Attribution (CC-BY) license (http://creativecommons.org/licenses/by/4.0/).
Share and Cite
Elameen, A.; Eiken, H.G.; Knudsen, G.K. Genetic Diversity in Apple Fruit Moth Indicate Different Clusters in the Two Most Important Apple Growing Regions of Norway. Diversity 2016, 8, 10. https://doi.org/10.3390/d8020010
Elameen A, Eiken HG, Knudsen GK. Genetic Diversity in Apple Fruit Moth Indicate Different Clusters in the Two Most Important Apple Growing Regions of Norway. Diversity. 2016; 8(2):10. https://doi.org/10.3390/d8020010
Chicago/Turabian StyleElameen, Abdelhameed, Hans Geir Eiken, and Geir K. Knudsen. 2016. "Genetic Diversity in Apple Fruit Moth Indicate Different Clusters in the Two Most Important Apple Growing Regions of Norway" Diversity 8, no. 2: 10. https://doi.org/10.3390/d8020010