Article

Feeding and Reproductive Phenotypic Traits of the Sea Urchin Tripneustes gratilla in Seagrass Beds Impacted by Eutrophication

by
Helen Grace P. Bangi
1,2,* and
Marie Antonette Juinio-Meñez
1
1
The Marine Science Institute, University of the Philippines-Diliman, Quezon City 1101, Philippines
2
College of Fisheries and Aquatic Sciences, Cagayan State University-Aparri Campus, Maura, Aparri 3515, northern, Philippines
*
Author to whom correspondence should be addressed.
Diversity 2023, 15(7), 843; https://doi.org/10.3390/d15070843
Submission received: 5 May 2023 / Revised: 1 July 2023 / Accepted: 4 July 2023 / Published: 11 July 2023
(This article belongs to the Special Issue Ecology and Biogeography of Marine Benthos)

Abstract

:
The sea urchin Tripneustes gratilla is a major grazer and is, hence, an excellent key model organism to study to gain a better understanding of responses to changes in its habitat. We investigated whether there are significant variations in the feeding and reproductive phenotypic traits of populations from three seagrass bed sites, with respect to their proximity to fish farms in Bolinao, northwestern Philippines. We established three stations in each of the three sites: the far, the intermediate, and those near the fish farms, and compared the sea urchins’ phenotypic traits and determined whether these were related to seagrass productivity and water parameters. Regardless of the sampling period, adult sea urchins (66.92 ± 0.27 mm test diameter, TD, n = 157) from the areas intermediate and near to the fish farms had significantly lower indices of Aristotle’s lantern, gut contents, gut and gonads, and lower gonad quality (high percentage of unusual black gonads), compared to those from the far stations. Multivariate analysis showed that the smaller feeding structures and gut, lower consumption rates and lower gonad indices and quality of sea urchins in the intermediate and near fish farms were positively related to lower shoot density, leaf production and species diversity, as well as lower water movement in those stations. The larger size of the Aristotle’s lantern in the far stations was not related to food limitations. More importantly, the phenotypic variability in the feeding structures and gonads of sea urchins in the same seagrass bed provides new evidence regarding the sensitivity of this species to environmental factors that may affect variability in food quality.

1. Introduction

Aquaculture has been expanding globally, accounting for nearly half of the global fish and seafood supply [1]. One of the main concerns with this expansion is the release of nutrients and organic matter into the environment as waste feeds or metabolic end-products [2,3]. Hence, these are sources of organic enrichment and eutrophication in coastal environments. While aquaculture wastes may increase food for wild fauna and primary production (e.g., [4,5,6]), they have negative direct effects on ecosystems. For example, excess nutrients increase the growth of filamentous turf algae and epiphytes, reducing the growth of important foundation species such as kelps, other macroalgae and seagrasses (e.g., [7,8]).
Seagrass beds are widely recognized as habitats for many epifauna, infauna and macrobenthic invertebrates, including sea urchins (e.g., [9]). However, they are highly susceptible to both natural and human influences, and there has been concern about the global decline in this important ecosystem (e.g., [10,11,12,13]). Studies related to seagrasses and associated herbivores are especially important in the tropical Indo-West Pacific region and southeast Asia, where the highest biodiversity in seagrass species is found [14,15,16,17]. Many seagrass beds, however, have been damaged. Increased nutrient loading related to eutrophication has been identified as a main driver of increasing rates of seagrass decline [16,18,19,20,21]. Moreover, fish farm-derived organic wastes has altered the natural isotopic composition of organic matter sources of primary producers and different trophic level consumers, thus modifying the natural food webs (e.g., [22,23]).
The sea urchin Tripneustes gratilla is widely distributed in the Indo-West Pacific region, and is usually found in shallow seagrass beds or reef habitats that have high potential primary productivity, but are exposed to natural and human-induced disturbances [24]. It is harvested commercially for its gonads or “roe” (e.g., [25,26,27]). In the Philippines, T. gratilla fisheries have been overexploited. For example, in our study site, the fishery collapsed and recovered after many years due to a restocking effort [26]. T. gratilla has high growth and respiration rates, as well as high feeding and reproductive capacities [28,29,30]. As a grazer, T. gratilla has a key role in the decomposition and recycling of nutrients, enhancing seagrass productivity [31,32,33,34,35]. It is also considered to be a keystone grazer in the control of the invasive macroalgae Kappaphycus in Kaneohe Bay, Hawaii [36] and a potential biological control agent for other invasive algae (e.g., [37,38,39]). This mechanism and the process of grazing of epiphytes increase the light and nutrient uptake by seagrasses (e.g., [40]), and open up more spaces for coral recruitment, survival, and growth, e.g., [41].
The composition and structure of the benthic community of associated epifauna, infauna and macrofauna have been shown to vary with changes in seagrass habitats, as influenced by the intensive milkfish (Chanos chanos) aquaculture in Santiago Island, Bolinao, northwestern Philippines (e.g., [42]). As a major grazer on seagrass beds [32], T. gratilla is an excellent model organism to be studied to gain insights into adaptations or responses to potential changes in this ecosystem. We hypothesize that the effect of eutrophication may also be evident among populations of T. gratilla, in relation to the differences in the quality of the seagrass habitat and the benthic environment. This could result in variability in phenotypic traits related to feeding and reproduction. In this study, we investigated whether there were significant variations in the feeding and reproductive phenotypic traits between populations of T. gratilla in three areas with different distances from the fish farms on Santiago Island in Bolinao. Specifically, we determined and compared different sea urchin parameters directly related to feeding and reproduction, such as the weight ratio of the Aristotle’s lantern, gut contents, gut and gonads, to total body weight (expressed as body index), as well as the gonad quality of samples from the different stations in the three areas. Secondly, we determined whether seagrass productivity parameters (i.e., shoot density, estimated leaf production and above-ground fresh and dry biomass) and physical water parameters (i.e., relative water movement, sea surface temperature and mean depth) were related to the sea urchin parameters.

2. Materials and Methods

2.1. Study Stations and Sampling Design

Santiago Island (16°23′19.7″ N, 119°55′25.7″ E, Figure 1) in Bolinao is known to have the widest reef flat system in the northwestern Philippines [43]. The reef flat has an extensive seagrass bed with approximately 22,500 ha, and is an important source of fish and macroinvertebrate fishery resources, including the sea urchin T. gratilla. Fish pens and cages are located in the Guiguiwanen channel between the Bolinao mainland and the southern part of Santiago Island, and the fish aquaculture has been a major industry in the region. This, however, has contributed to the degradation in coastal waters, the sediment environment [44,45,46,47,48], and the seagrass ecosystem (e.g., [49,50]), specifically in the eastern area of the island, near the fish farms.
The study stations are dominated by Thalassia hemprichii, where adult T. gratilla are found. The stations are shallow, submerged even at the lowest tide, with depths ranging from about 0.8 m to 1.5 m. The study stations were established in three areas with respect to their proximity to the fish farms: the reference or the relatively unimpacted stations on the northwestern side being the farthest, named here as FAR, the eastern stations intermediate to the fish farms, named INT, and the eastern stations nearest the fish farms, referred to as NEAR. The FAR stations are approximately 13 to 15 km away from the fish farms, while the NEAR and INT stations are about 1 to 2 km from the fish farms, respectively. Sampling was conducted to coincide with the prevalence of the northeast (NE), southwest (SW), and easterly monsoon weather in the area. T. gratilla adult samples were found during the first sampling period in the NEAR stations; however, none was found during the subsequent sampling period. Hence, stations from a nearby location, i.e., INT, were then sampled. Sampling was conducted during the SW period in the FAR and NEAR stations, and during the NE and easterly periods in the FAR and INT stations.

2.2. Physical Water Parameters

Physical parameters that usually vary in the sampling areas, such as sea surface temperature (SST), relative water movement and site depth, were monitored during the study period. Thermologgers (Onset HOBO Water Temp Prodata Logger, Onset Computer Corporation, MA) were installed in each location to record the SST throughout the duration of the study. Relative water movement was monitored at each of the FAR, INT and NEAR stations, with respect to the fish farms using the “diffusion factor (DF) technique” or clod card method [52]. Three replicate card sets (i.e., 3 cards per set) were deployed over two 24 h periods in each station during the middle of each sampling period.

2.3. Seagrass Parameters

The average above-ground biomass (fresh and dry weight, g·m−2) of seagrass, and associated macroalgae, as well as the seagrass shoot density (number of individuals.m−2), were determined in each station using a standard quadrat method [53,54]. Three replicate transects (50 m each) were used in each station and sampling period. Seagrass abundance was quantified by laying a quadrat (50 × 50 cm2, divided into 25 squares, 10 × 10 cm2 each) every 5 m (for non-uniform seagrass distribution) or 10 m interval (uniform distribution) along each transect. Representative samples of seagrasses (from 5 to 10 replicate quadrats per transect) were collected within the total quadrats assessed per station and brought to the laboratory for sorting and identification, including for associated macroalgae [55]. Samples were rinsed with fresh water, and epiphytes were gently scraped off prior to drying the seagrass samples at 60 °C to a constant weight. Seagrass leaf production (g DW·m−2·day−1) for each species per station was estimated and computed using the plastochrone method [56,57], considering the leaf weight (g), and the plastochrone index (PI, in days) for each species. Excessive turbidity precluded further replication within the first station NEAR the fish farms.

2.4. Sea Urchin Parameters

2.4.1. Feeding and Somatic Traits

The ability to obtain food is affected by body size [58], and the total body weight and components’ weight (e.g., gonads) were found to be directly related to the test diameter (e.g., [26,59]); hence, adult T. gratilla samples in a similar size range (62 to 70 mm TD) were used in each station. To ensure that a minimum of 10 females in a similar size range could be analyzed in each station during each sampling period, around 30–35 adult T. gratilla (mixed males and females) were collected at a time, within 50 m × 2 m belt transects (using the same seagrass sampling area), for laboratory analyses. The analysis of gonad quality (or other phenotypic traits) was limited to females of the indicated size ranges, as females were more abundant than males. Each individual was measured and blotted dry with a cloth before being weighed (to the nearest 0.1 g) to obtain the total fresh body weight (BW). The gut of each individual was removed from the test, and the contents were carefully removed, set aside and weighed (to the nearest 0.1 g) prior to preservation in buffered 5% formalin and seawater, for further analysis. To correct for differences in body size, since the BW of the sea urchins varied between stations (F2, 129 = 6.05, p = 0.003), the amount of food in the gut was evaluated using the repletion index (RI) or gut content index (GCI), modified from [60], which excluded the weight of the gut. This was determined using the following equation: GCI = (FWdt content/BW) × 100, where FWdt content is the fresh weight of the digestive tract contents in grams, and BW is the total fresh weight of the body in grams. Each individual sample was further dissected to determine the weight of the main body components: Aristotle’s lantern (teeth and jaw pyramid), gut or digestive tract, and the gonad. The Aristotle’s lantern and gut indices (ALI and GI, respectively) were determined as the ratio of the respective weights and BW of the sea urchin, multiplied by 100. The index, which is the ratio of the actual weight of each body component to the total BW, is a standard measure of the size of the body component, considering the individual differences in total BW, even with a uniform test diameter.

2.4.2. Reproductive Traits

The gonadosomatic index (GSI), which is the ratio of gonad fresh weight (FWg) to total body fresh weight (BW) in grams, multiplied by 100, was calculated as follows: GSI = (FWg/BW) × 100.
The same gonad samples (from 10 individuals per station and sampling period) that were used in for GSI determination were used for gonad quality evaluation. The relative quality (GQlty) of each gonad sample was based on color [61,62]. Fresh samples were scored by assessing the gonad color using a color table (standard colored cards based on Munsell Color System, USA) and a reference guide (Pantone Matching System Color Chart, Pantone, Inc., Carlstadt, NJ, USA).

2.5. Data Analyses

A multivariate permutational analysis of variance (PERMANOVA, [63]), was used to test for significant differences in T. gratilla variables in the three areas, with respect to “proximity to fish farm” or “Pr”. In the analyses, “Pr” was a fixed factor, with three levels (FAR, INT and NEAR the fish farms). Station (St) was a random factor, nested in “Pr”, with two to three levels (station 1, 2 and 3). Season (Se) was an orthogonal factor, with two levels (SW and NE monsoon season and easterly season) per station. Data were computed using a resemblance matrix based on a Euclidean distance index on log-transformed data. Similar tests were performed to determine significant differences in the seagrass parameters (shoot density, leaf production, fresh and dry above-ground biomass), and physical water parameters with respect to the main factor, Pr. All p-values were obtained using 4999 random permutations of residuals under a reduced model or through Monte Carlo (MC), where appropriate. Posteriori pair-wise tests were conducted using PERMANOVA.
Multidimensional scaling or MDS [64,65] was used to visualize potential patterns in the response variables. A canonical analysis of principal coordinates, or CAP [66] was used to determine the distinctiveness of separation of variables in a multivariate space, with respect to the three sampling areas. To compute the correlational structure of the multiple sea urchin and seagrass variables, and their relationships with the physical water variables, vectors were overlaid, representing the Pearson’s correlation of each variable with the ordination axes (principal coordinates analysis or PCO, and CAP coordinates). Data were computed on a resemblance matrix based on an Euclidean distance index on log- or square-root-transformed data. All p-values were obtained using 4999 random permutations of residuals under a reduced model [63,67]. The physical water variables were analyzed using principal component analysis (PCA) prior to PCO and CAP analyses. The significant correlational structure of the sea urchin variables and their relationships with the physical water and seagrass variables were further examined using a distance-based linear model, distLM [68]. Calculations were based on normalized Euclidean distance in log-transformed data.
All of the analyses were performed using the software Primer 6 [69] (Plymouth Marine Laboratory, Plymouth, UK) with the add-on package PERMANOVA (developed by Anderson, M.J.).

3. Results

3.1. Physical Water Parameters

Overall, the mean sea surface temperature (SST), mean diffusion rate (DR) or relative water movement and the mean water depth varied significantly between the FAR, INT and NEAR stations, during each sampling period.
Notably, the highest mean SST (36.2 °C) was recorded in the stations NEAR the fish farms, during the SW sampling period. The overall mean SST was 31.9 ± 0.1 °C in the stations INT to the fish farms and 29.43 ± 0.1 °C in the stations FAR from the fish farms, during two sampling periods: NE and easterly season.
On the other hand, the highest mean water movement (DR) was recorded in the FAR stations (24.46 ± 0.38 g·d−1, during the NE sampling period), versus 11.18 ± 0.18 to 15.46 ± 0.32 g·d−1 only in the INT stations during the same period. The lowest mean value, however, was recorded in the INT stations (5.58 ± 0.15 g·d−1) during the easterly sampling period. Slower water movement was recorded in the NEAR stations (7.25 ± 0.72 g·d−1) compared to the FAR stations (13.11 ± 0.31 g·d−1) during the SW sampling period.
The overall mean depth was 0.93 ± 0.02 m in the FAR stations, 0.92 ± 0.01 m in the INT stations and 0.79 ± 0.01 m in the NEAR stations.
Similar to the seagrass and sea urchin parameters, the physical water parameters were integrated in the multivariate analysis to look at their relationships, based on the objectives of the study.

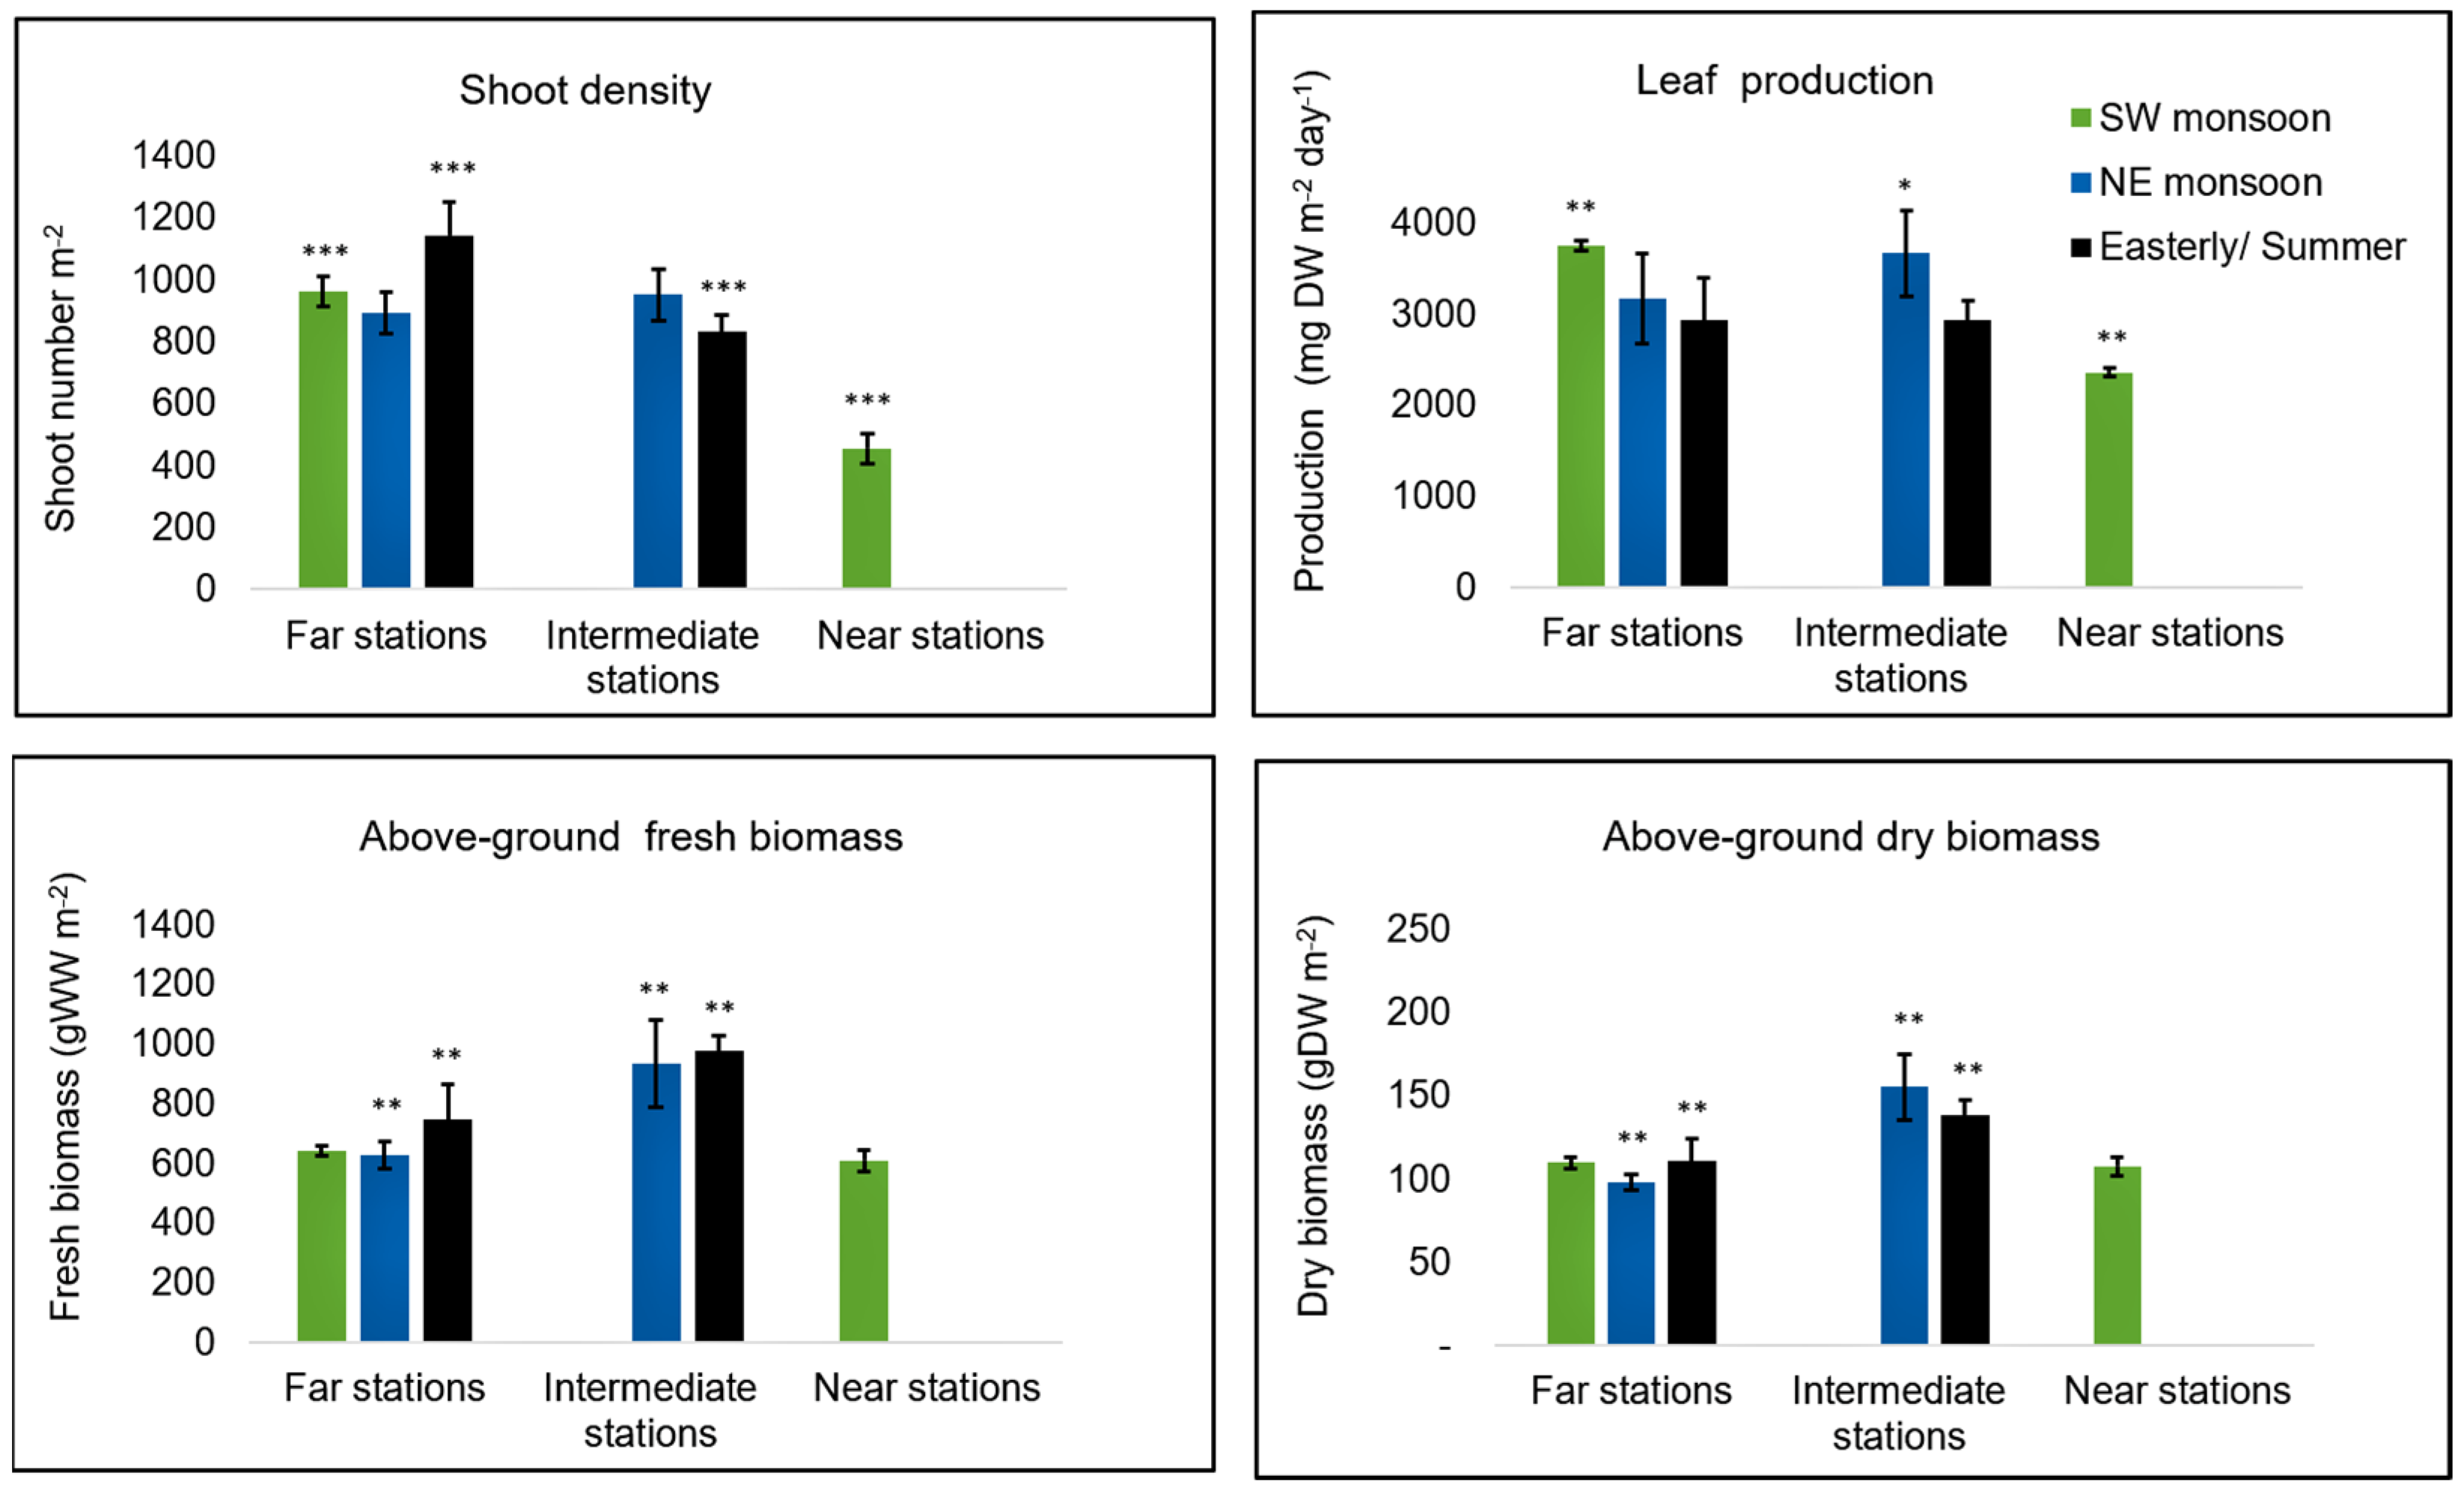
3.2. Seagrass Parameters

The seagrass above-ground biomass, shoot density and leaf production are shown in Figure 2. The mean above-ground biomass was significantly (t(35) = 5.295, p = 0.004, p(perm)) higher by 25 to 33% in the INT stations compared to the mean values in the FAR stations, during the same NE and easterly sampling period. However, the biomass in the NEAR stations was not significantly different (t(35) = 1.036, p = 0.3558, p(perm)) from that in the FAR stations during the SW sampling period.
On the other hand, the mean shoot density was significantly (t(35) = 4.063, p = 0.0002, p(perm)) higher by about 30% in the FAR stations compared to the INT and NEAR stations, during the SW and easterly sampling period. The mean leaf production was also significantly (t(35) = 3.5948, p = 0.0138, p(perm)) higher by about three orders of magnitude in the FAR stations compared to the NEAR stations during the SW sampling period. The mean values recorded in the NEAR stations were significantly lower by about 50% and 38% for shoot density and leaf production, respectively, than the mean values recorded in the FAR stations during the same SW sampling period. Despite spatial variations in shoot density, leaf production and biomass, Thalassia hemprichii was the most abundant seagrass in all of the stations, with relative abundance of up to 95% in the FAR stations and INT stations, and up to 84% in the NEAR stations (Figure S1). Notably, Syringodium isoetifolium was found only in the FAR stations.
Taken together, while the above-ground biomass of seagrass was high in all of the stations, the relative food abundance in terms of shoot densities, estimated leaf production and number of species was the lowest in the stations NEAR the fish farms.

3.3. Sea Urchin Parameters

3.3.1. Gut Contents

The mean gut content index (GCI) and gut content weights were significantly lower (F2, 129 = 11.397, p = 0.0002, p(perm)) in samples from the INT and NEAR stations compared to those from the FAR stations during the NE and SW sampling periods (Figure 3). Despite this, there was no single sample observed to have an empty gut or with extremely low gut content. Preliminary gut content and Ivlev’s electivity analyses (Figure S2a–c) indicated that S. isoetifolium, which was not found in the INT and NEAR stations, is a preferred species compared to other species. The gut contents consisted mostly of a mixture of seagrass and macroalgae in all of the stations. However, among the seagrass species, T. hemprichii formed the majority of the gut content, which was also the most abundant seagrass species in all of the stations based on shoot density, leaf production and above-ground biomass. Some sand, forams and sediments were also found in the gut of the sea urchin samples.

3.3.2. Feeding Somatic Traits

Notably, significant differences were found in T. gratilla feeding somatic traits between the three sampling areas with respect to their proximity to the fish farms, despite the uniform test diameter size range of the samples used (F2, 129 = 1.521, p = 0.222).
The mean Aristotle’s lantern index of T. gratilla was significantly (t(129) = 4.057, p = 0.0154, p(perm)) lower in the NEAR stations (8.30 ± 0.46) compared to those from the FAR stations (14.71 ± 0.72), during the same SW sampling period (Figure 4). The mean indices of samples in the INT stations (10.05 ± 0.71 and 9.87 ± 0.54) were likewise significantly lower (t(129) = 2.791, p = 0.0452, p(MC)) compared to those from the FAR stations (13.68 ± 0.65 and 11.22 ± 0.47) during the same NE and easterly sampling period, respectively. In terms of the gut index, a similar pattern in variations (F2, 129 = 10.333, p = 0.0150, p(perm), Figure 5) was observed as the Aristotle’s lantern and gonads (F2, 129 = 8.013, p = 0.0120, p(perm), Figure 6), except during the easterly sampling period.

3.3.3. Gonads

The overall mean gonadosomatic index (GSI) of T. gratilla showed similar patterns of variation (F2, 129 = 8.013, p = 0.0120, p(perm)) with the feeding somatic traits of Aristotle’s lantern and gut. The mean GSI of the samples from the NEAR stations was also significantly lower (10.39 ± 1.15, Figure 6, t(129) = 3.155, p = 0.0432, p(perm)) compared to those from the FAR stations (14.60 ± 0.64) during the same SW sampling period. Likewise, a significantly lower (t(129) = 2.635, p = 0.05, p(MC)) mean GCI was recorded in the INT stations (14.04 ± 1.08 and 14.05 ± 0.96) compared to those sampled from the FAR stations (20.62 ± 0.92 and 18.91 ± 1.07) during the NE and easterly period, respectively. Similarly, gonad weight was significantly the lowest (F2, 129 = 6.220, p = 0.0314, p(perm)) in stations NEAR the fish farms.
Gonad quality (Figure 7) also varied significantly across the three areas (F2, 129 = 15.99, p = 0.0046, p(perm)). The quality of the gonads of samples from stations INT and NEAR to the fish farms was significantly lower (i.e., highest percentage of the “worst” category or Grade I, 77.3% and 35.0%, respectively), compared to those from the FAR stations (i.e., 9.6% only).

3.4. Relationship of Sea Urchin Phenotypic Traits, Seagrass and Water Parameters

The unconstrained (MDS) ordination of variables describing sea urchin and seagrass status showed fair separation between the impacted INT and NEAR stations close to the fish farms and those FAR from the fish farms (Figure S3), with impacted INT stations in a somehow intermediate position. A significant (p = 0.0002) maximized separation of multiple variables representing the groups, with respect to the three sampling areas, is evident. Moreover, CAP (Figure S4) correctly allocated every sample (100%) to the severely impacted NEAR or the FAR stations, with high but partial (83.33%) success occurring for the INT stations. Together with the high allocation success, the canonical correlation coefficient, δ2, was high (0.8371, Table 1) for the first coordinate, explaining 71.0% or the majority of the total variations observed in the T. gratilla and seagrass parameters. For the first coordinate, the phenotypic traits significantly associated with the stations INT and NEAR the fish farms include the following: a lower gut content index and Aristotle’s lantern and gut indices, as well as a lower gonad index and quality.
Pearson correlation coefficient values which were significant for most of the traits ranged from −0.50 to −0.72 (Table 2). The opposite of these traits (higher quality, body component weights or indices) was true for the FAR stations.
On the other hand, the seagrass and physical water variables associated with stations INT and NEAR the fish farms were lower shoot density, lower leaf production (NEAR stations), lower diffusion factor and higher SST, but higher above-ground biomass and higher mean depth (INT stations). The opposite was true for stations FAR from the fish farms. Pearson correlation coefficient values which were significant for most of the variables ranged from −0.55 to −0.85 (Table 2).
The results of the distance-based linear model analyses further showed significant (p = 0.0002) positive relationships between the respective average weights and indices for gut content, Aristotle’s lantern and gonads. Likewise, gonad weight, and index and gonad quality were positively correlated (Table S1).
With respect to the response of the sea urchins, a lower gut content index and smaller Aristotle’s lantern and gonads were significantly associated with the stations INT and NEAR the fish farms. The opposite was true for the stations FAR from the fish farms. In addition, the degrees of relationships of the T. gratilla phenotypic variables and seagrass and physical water parameters in the sampling areas, with respect to their proximity to the fish farms, are shown in Table S2. Sequential distance-based linear model tests showed that biological (seagrass shoot density and leaf production) and physical (DF, SST) factors contributed significantly (about 32.7%) to the variations observed in T. gratilla feeding and reproductive phenotypic traits.

4. Discussion

This study showed significant variability in multiple feeding and reproductive traits in T. gratilla populations impacted by eutrophication from intensive fish aquaculture. The results not only validate previous studies on the negative impacts of euthrophication on seagrasses, but also the potential negative impacts on the growth of a top grazer, as indicated by the feeding-related phenotypic traits and reproductive output and quality of populations. In addition, this study showed that the smaller feeding structures, lower consumption rates and lower reproductive outputs of sea urchins near the fish farms are positively related to the poor productivity and diversity in seagrasses in those areas. Variations among populations of T. gratilla sampled from stations that are only a few kilometers apart and with relative to proximity to fish farms have not been previously reported. This study supports an earlier study (e.g., [42]) that found that changes in the community structure of benthic macrofauna (e.g., T. gratilla) were associated with the seagrass beds along the eastern side of Santiago island due to mariculture-induced pollution. The species heterogeneity of the macrofauna was significantly reduced towards the polluted stations, near the fish farms that we sampled.

4.1. Seagrass Bed Condition

The lowest shoot densities, leaf production and number of seagrass species were found in the stations near the fish farms. While the above-ground biomass in these stations was high and comparable to those in stations far from the fish farms, only two species, T. hemprichii and E. acoroides, were present. The results of this study are consistent with previous studies, which showed a marked decrease in the number of seagrass species, and showed that the shoot density and cover of T. hemprichii were the lowest near the fish farms [44]. The cover and diversity in seagrass species decreased from 1995 [70] to 2012 [45,71] in the same eastern stations in Bolinao, near the fish farms. Moreover, four species (C. rotundata, C. serrulata, Halodule uninervis, Halophila ovalis) which were found in a station near the fish farm [45,70], very adjacent to our stations near the fish farms, were not observed in the present study.
The lower shoot densities and leaf production In the stations near the fish farms are unlikely caused by enhanced herbivory activities or overgrazing by sea urchins at high densities (1030 to 2000 individuals 100 m−2), as reported in other studies (e.g., [38,72,73]). The mean density range of T. gratilla in our stations was very low (0.48 to 5.3 individuals 100 m−2). The low seagrass productivity could be due to the low light extinction coefficient and low water velocity recorded in areas near the fish farm [74]. A decreasing pattern in leaf growth and an increase in shoot mortality in T. hemprichii was attributed to the anoxic sediment conditions and high sedimentation rates in areas close to the fish farms [75]. Under reduced sediment conditions, the high respiratory demand of the belowground parts alters the carbon balance of the T. hemprichii and C. serrulata shoots [76], resulting in shoot mortality. Hence, the driver of the poor health of the seagrass is likely the poor water and sediment quality, as this has already been shown to be heavily impacted by the milkfish aquaculture (e.g., [46,48,51]), even before and during the conduct of this study (Figure S5).

4.2. Condition of the Sea Urchin Populations

4.2.1. Diet

The absence of E. acoroides in the gut of T. gratilla indicates that it is not preferred by the sea urchin. S. isoetifolium was not found in the gut of T. gratilla; however, it primarily consumed T. hemprichi, the most abundant species in all of the stations. This was also shown in an earlier study of T. gratilla in Bolinao [32], and in Papua New Guinea [77]. Our data on proximate analysis on T. hemprichii showed higher concentrations of carbohydrates and proteins and higher calories compared to S. isoethyfolium (Table S3). The higher carbohydrates and proteins of the former species can promote better growth and reproduction, as shown for other sea urchins [78].

4.2.2. Feeding and Reproductive Phenotypic Traits

The feeding structure (Aristotle’s lantern) of sea urchins from stations intermediate and near to the fish farms was significantly smaller compared to those from stations far from the fish farms. In addition, the gonad quality was higher in the latter stations. The smaller feeding structure of sea urchins in the stations intermediate and near to fish farms was positively related to lower consumption rates (gut content index), and a smaller gut. This suggests that feeding may be constrained in the impacted stations, considering the higher seagrass biomass in these stations. Conversely, the larger Aristotle’s lantern of individuals in the stations far from the fish farms was related to higher consumption rates, a larger gut and consequently a larger gonad size. Our findings related to the size of the feeding structure concur with laboratory studies that have shown that sea urchins with a smaller feeding structure have a lower capacity to feed, [79] for Diadema setosum; [80] for Echinometra mathaei. However, the larger Aristotle’s lantern in the stations far from the fish farms, where reproductive conditions and food quality were better, contrasts various studies which have reported that a larger Aristotle’s lantern is a response to food limitations (e.g., [81,82,83]). The shoot density and leaf production in these stations were significantly higher compared to the eastern stations intermediate and near to the fish farms. None of the urchins sampled from any of the stations had empty gut. The positive relationship between the size of Aristotle’s lantern to the gut size and content reflects feeding capacity rather than food availability.
The average gonad sizes of sea urchins from the stations far from the fish farms were 19 to 20% of the body weight, while those from the stations intermediate and near to the fish farms only ranged from 10.4% to 14%, regardless of season. The larger size and better quality of the gonads of sea urchins in the former stations may be due to the higher quality of the seagrass (i.e., higher shoot density, leaf production and diversity in species), together with the higher capacity of the sea urchins to feed (larger Aristotle’s lantern) in these stations. On the other hand, the low gonad size of sea urchins in the stations intermediate and near to the fish farms may be related to the reduced feeding capacity of the sea urchins in these stations, as indicated by their significantly smaller feeding structures. In addition, there was a high incidence of black gonads in these stations. These black gonads were not previously encountered in our earlier studies in the area (e.g., [26,84]). Dark gonads have been reported to be related to old age and small gonad size in Strongylocentrotus nudus [61]. Our study, however, used adults of similar test diameter sizes, assumed to be of similar ages, based on the species short life span of about 2 years and fast gametogenic cycle of about 3 months [26]. The occurrence of black gonads could be an extreme indication of poor nutrition and the adverse physiological effects of polluted environmental conditions in the seagrass habitat. We observed that sea urchins with black gonads did not release gametes during induction in the laboratory (Bangi and Juinio-Meñez, unpublished data). Other samples that were induced to spawn in the laboratory from these stations had much lower fecundity (5021 ± 440 eggs per female, unpublished data) compared with the previous sea cage experiments of T. gratilla when fed with a high ration of T. hemprichii (503,261 ± 15,279 eggs per female) or unfed (12,770 ± 1286 eggs per female, [84], Bangi and Juinio-Meñez, unpublished data). These results further suggest that the fecundity and gamete quality of T. gratilla are also affected by the quality of the seagrass food and the environment.
Taken together, the difference in the traits of the sea urchins in the three study areas show that the degraded environmental conditions near the fish farms are affecting the feeding capacity and the quality of the food of these T. gratilla populations. Thus, growth rates may be affected, as well as the reproductive output. This study provides evidence on the effect of organic pollution on wild populations in their natural habitat, which has only been shown previously in laboratory studies. For example, studies have shown that chronic exposure to low (0.8 mgL−1 inorganic, 10 mgL−1 organic) and high (3.2 mgL−1 inorganic, 1000 mgL−1 organic) sublethal concentrations of phosphates inhibits feeding, fecal production, nutrient absorption and allocation, growth and righting behavior in the sea urchin Lytechinus variegatus [85], which has the same life history as T. gratilla [24]. Moreover, related studies have shown reduced fertilization success in L. variegatus exposed to all phosphate treatments, and arrested embryonic development in the highest concentrations [86]. In another study, the sea urchin S. droebachiensis exposed to chronic unionized ammonia up to 0.068 mg L−1 (high) caused 76% mortality and reduced gonad growth [87]. The exposure of S. droebachiensis to nitrite also caused a significant reduction of gonadal growth, starting from 0.5 mg N-NO2 L−1 concentration [88]. In addition, one study [89] suggested that modern commercial aquafeeds may directly affect the reproductive fitness of sea urchins, based on their study on Heriocidaris erythrogramma. Hence, as seagrass habitats are exposed to organic pollution and eutrophication, the responses and the fine-scale phenotypic variability in top grazers such as T. gratilla provide important indicators on how this affects ecosystem health.

5. Conclusions

Overall, our results have shown significant variability in the feeding and reproductive traits of T. gratilla in different stations in three areas within the seagrass beds of Santiago Island in Bolinao. Sea urchins from the eastern stations intermediate and near to the fish farms had smaller feeding structures and gut, lower gut content and smaller gonads, compared to those from the western stations, located far from the fish farms. Moreover, those with smaller gonads also had a high percentage of unusual black gonads. These variabilities were related to the lower quality of seagrass parameters in those stations.
The lower quality and size of feeding and reproductive phenotypic traits in T. gratila possibly reflect the negative impacts of fish farming on the seagrass habitat, used as both food and refuge by the sea urchin. While T. gratilla is a resilient and stress-tolerant species with respect to hydrodynamically related disturbances, as shown in a previous study [90], this species is very vulnerable to other disturbances, i.e., eutrophication associated with intensive fish aquaculture. Furthermore, this has a negative effect on the reproductive potential of the sea urchin population in the region. Additionally, the decrease in gonad size and quality directly affects the production and economic value of the fishery of T. gratilla. These results highlight the need to consider the economic and social benefits of intensive fish farming against its related impact on other economic and environmental aspects of the surrounding environment.

Supplementary Materials

The following supporting information can be downloaded at: https://www.mdpi.com/article/10.3390/d15070843/s1, Figure S1: Percentage abundance by mean shoot density of the different seagrass species measured in each station in three locations; Figure S2a–c: Overall mean % abundance of food items by fresh biomass and the relative selectivity of similarly sized adult T. gratilla sampled from the FAR stations during the northeast NE monsoon season and easterly season (2a), from the FAR stations and NEAR stations during the southwest SW monsoon season (2b), and from the INTermediate stations during the northeast NE monsoon season and easterly season (2c); Figure S3: Unconstrained non-metric MDS plot done to compare the various biological variables (T. gratilla multiple phenotypic traits, repletion index, mean density and seagrass abundance measures) shown in CAP (Figure S3) with respect to the main factor “proximity to fish farm”, based on Bray Curtis similarity measure on square root-transformed data; Figure S4: Constrained canonical analysis of principal coordinates (CAP) plots showing the correlation structures in various response variables measured in T. gratilla (multiple phenotypic traits, repletion index, mean density) as a response or proximity to the fish farm environment and related factors; Figure S5: Monthly concentrations of chlorophyll-a and major nutrients monitored in representative stations in the vicinity of the Milkfish cages and pens in Bolinao, with reference values based on ASEAN criteria, data from the project on “Monitoring of Water Parameters for a Mariculture Site in Bolinao” (San Diego-McGlone, personal communication); Table S1: Summary of results on the distance-based linear model (DistLM) examining the percentage of variance accounted for each biological variable (T. gratilla phenotypic traits, repletion index), and determining the relationships among the biological variables with respect to different stations in three areas and three seasons; Table S2: Distance-based linear model (DistLM) examining the percentage of variance accounted for each biological seagrass and environmental variables (diffusion factor (DF), sea surface temperature (SST), mean site depth, seagrass abundance measures such as shoot density (shootden), leaf production (leafprodn), and fresh or dry weight seagrass biomass (FW, DW biomass) in three sampling areas and three seasons; Table S3: Proximate analysis of macrophyte food for T. gratilla and its gonads.

Author Contributions

Conceptualization, H.G.P.B. and M.A.J.-M.; resources and supervision, H.G.P.B. and M.A.J.-M.; Field sampling and Lab preparation, H.G.P.B.; Lab sample processing and analysis, H.G.P.B.; Data analysis, H.G.P.B.; manuscript draft preparation and writing, H.G.P.B.; series of review and revision of the manuscript, H.G.P.B. and M.A.J.-M. All authors have read and agreed to the published version of the manuscript.

Funding

This study was mainly funded by the Department of Science and Technology (DOST)—Science Education Institute’s Accelerated Science and Technology Human Resource Development Program (SEI-ASTHRDP, Fund SRSF, STSD-214). The Cagayan State University provided complete salary and one semester scholarship for H.G.P.B. Additional research funds, laboratory facilities and supplies were provided by the University of the Philippines Marine Science Institute’s (UP MSI) Bolinao Marine Laboratory (PHD-16-02) and The Marine Invertebrate Laboratory of M.A.J.M.

Institutional Review Board Statement

Not applicable.

Data Availability Statement

The raw data and datasets collated and analyzed for the study may be available through a valid request from the corresponding author.

Acknowledgments

The authors are very grateful to the anonymous reviewers for providing significant comments and suggestions to improve the manuscript. They are also indebted to the following: Rene R. Rollon, for providing advice on seagrass sampling techniques; Symon Dworjanyn, for providing valuable inputs in the earlier version of this manuscript; Marilou San Diego-McGlone, for providing some water quality data in Bolinao; Charissa M. Ferrerra, for the assistance provided on the Ocean Data View mapping software; Ma Josefa R. Pante, for some statistical advice. The authors would like to thank Jay R Gorospe for reviewing and providing valuable suggestions on the revised version of the manuscript, likewise to Lambert Meñez, for critically editing the manuscript, and to Jerwin Baure for additional assistance in copy editing the manuscript. The authors are thankful to Larry Milan, Jack Rengel, Lawrence Ramoran, for assisting the authors in field sampling and laboratory processing of samples. L. Milan, Jan Noelle Rimando and Aphrodite Entoma assisted in laboratory analysis of samples, particularly in gut content analysis.

Conflicts of Interest

The authors declare no conflict of interest.

References

  1. Campbell, B.; Pauly, D. Mariculture: A global analysis of production trends since 1950. Mar. Policy 2013, 39, 94–100. [Google Scholar] [CrossRef]
  2. Tacon, A.G.J.; Forster, I.P. Aquafeeds and the environment: Policy implications. Aquaculture 2003, 226, 181–189. [Google Scholar] [CrossRef]
  3. Primavera, J.H. Overcoming the impacts of aquaculture on the coastal zone. Ocean Coast. Manag. 2006, 49, 531–545. [Google Scholar] [CrossRef]
  4. Tewfik, A.; Rasmussen, J.B.; McCann, K.S. Anthropogenic enrichment alters a marine benthic food web. Ecology 2005, 86, 2726–2736. [Google Scholar] [CrossRef]
  5. Anton, A.; Cebrian, J.; Heck, K.L.; Duarte, C.M.; Sheehan, K.L.; Miller, M.-E.C.; Foster, C.D. Decoupled effects (positive to negative) of nutrient enrichment on ecosystem services. Ecol. Appl. 2011, 1, 991–1009. [Google Scholar] [CrossRef]
  6. White, C.A.; Bannister, R.J.; Dworjanyn, S.A.; Husa, V.; Nichols, P.D.; Dempster, T. Aquaculture-derived trophic subsidy boosts populations of an ecosystem engineer. Aquacult. Environ. Interact. 2018, 10, 279–289. [Google Scholar] [CrossRef] [Green Version]
  7. McGlathery, K.J. Macroalgal blooms contribute to the decline of seagrass in nutrient-enriched coastal waters. J. Phycol. 2001, 37, 453–456. [Google Scholar] [CrossRef] [Green Version]
  8. Burkholder, J.M.; Tomasko, D.A.; Touchette, B.W. Seagrasses and eutrophication. J. Exp. Mar. Biol. Ecol. 2007, 350, 46–72. [Google Scholar] [CrossRef]
  9. Williams, S.L.; Heck, K.L., Jr. Seagrass Community Ecology. In Marine Community Ecology; Bertness, M.D., Gaines, S.D., Hay, M.E., Eds.; Sinauer Associates: Sundergland, MA, USA, 2001; pp. 317–337. [Google Scholar]
  10. Short, F.T.; Wyllie-Echeverria, S. Natural and human induced disturbance of seagrasses. Environ. Conserv. 1996, 23, 17–27. [Google Scholar] [CrossRef]
  11. Duarte, C.M. The future of seagrass meadows. Environ. Conserv. 2002, 29, 192–206. [Google Scholar] [CrossRef] [Green Version]
  12. Walker, D.I.; Kendrick, G.A.; McComb, A.J. Decline and Recovery of Seagrass Ecosystems-The Dynamics of Change. In Seagrasses: Biology, Ecology and Conservation; Larkum, A.W.D., Orth, E.J., Duarte, C.M., Eds.; Springer: Dordrecht, The Netherlands, 2007; pp. 551–565. [Google Scholar]
  13. Coles, R.; Grech, A.; Rasheed, M.; McKenzie, L.; Unsworth, R.; Short, F. Seagrass Ecology and Threats in the Tropical Indo-Pacific Bioregion. In Seagrass: Ecology, Uses and Threats; Pirog, R.S., Ed.; Nova Science Publishers, Inc.: New York, NY, USA, 2011. [Google Scholar]
  14. Short, F.; Carruthers, T.; Dennison, W.; Waycott, M. Global seagrass distribution and diversity: A bioregional model. J. Exp. Mar. Biol. Ecol. 2007, 350, 3–20. [Google Scholar] [CrossRef]
  15. Short, F.T.; Polidoro, B.; Livingstone, S.R.; Carpenter, K.E.; Bandeira, S.; Bujang, J.S.; Calumpong, H.P.; Carruthers, T.J.; Coles, R.G.; Dennison, W.C.; et al. Extinction risk assessment of the world’s seagrass species. Biol. Conserv. 2011, 144, 1961–1971. [Google Scholar] [CrossRef]
  16. Short, F.T.; Coles, R.; Fortes, M.D.; Victor, S.; Salik, M.; Isnain, I.; Andrew, J.; Seno, A. Monitoring in the Western Pacific region shows evidence of seagrass decline in line with global trends. Mar. Pollut. Bull. 2014, 83, 408–416. [Google Scholar] [CrossRef]
  17. Fortes, M.D.; Ooi, J.L.S.; Tan, Y.M.; Prathep, A.; Bujang, J.S.; Yaakub, M.S. Seagrass in Southeast Asia: A review of status and knowledge gaps, and a road map for conservation. Bot. Mar. 2018, 61, 269–288. [Google Scholar] [CrossRef]
  18. Orth, R.J.; Carruthers, T.J.; Dennison, W.C.; Duarte, C.M.; Fourqurean, J.W.; Heck, K.L.; Hughes, A.R.; Kendrick, G.A.; Kenworthy, W.J.; Olyarnik, S.; et al. A global crisis for seagrass ecosystems. Bioscience 2006, 56, 987–996. [Google Scholar] [CrossRef] [Green Version]
  19. Ralph, P.J.; Tomasko, D.; Moore, K.; Seddon, S.; Macinnis, O.C.M. Human impacts on seagrasses: Eutrophication, sedimentation, and contamination. In Seagrasses: Biology, Ecology, and Conservation; Larkum, A.W.D., Orth, E.J., Duarte, C.M., Eds.; Springer: Dordrecht, The Netherlands, 2007; pp. 567–593. [Google Scholar]
  20. Waycott, M.; Duarte, C.M.; Carruthers, T.J.B.; Orth, R.J.; Dennison, W.C.; Olyarnik, S.; Calladine, A.; Fourqurean, J.W.; Heck, K.L.; Hughes, A.R.; et al. Accelerating loss of seagrasses across the globe threatens coastal ecosystems. Proc. Natl. Acad. Sci. USA 2009, 106, 12377–12381. [Google Scholar] [CrossRef]
  21. Jiang, Z.; Cui, L.; Liu, S.; Zhao, C.; Wu, Y.; Chen, Q.; Yu, S.; Li, J.; He, J.; Fang, Y.; et al. Historical changes in seagrass beds in a rapidly urbanizing area of Guangdong Province: Implications for conservation and management. Glob. Ecol. Conserv. 2020, 22, e01035. [Google Scholar] [CrossRef]
  22. Vizzini, S.; Mazzola, A. Stable isotope evidence for the environmental impact of a land-based fish farm in the western Mediterranean. Mar. Pollut. Bull. 2004, 49, 61–70. [Google Scholar] [CrossRef]
  23. Vizzini, S.; Mazzola, A. The effects of anthropogenic organic matter inputs on stable carbon and nitrogen isotopes in organisms from different trophic levels in a southern Mediterranean coastal area. Sci. Total Environ. 2006, 368, 723–731. [Google Scholar] [CrossRef]
  24. Lawrence, J.M. Sea urchin life history strategies. In Sea Urchins: Biology and Ecology, 4th ed.; Lawrence, J.M., Ed.; Elsevier: London, UK, 2020; pp. 19–28. [Google Scholar]
  25. Talaue-McManus, L.T.; Kesner, K.P. Valuation of a Philippine municipal sea urchin fishery and implications of its collapse. In Philippine Coastal Resources under Stress; Juinio-Meñez, M.A.R., Newkirk, G.F., Eds.; Selected papers from the Fourth Annual Common Property Conference; University of the Philippines: Quezon City, Philippines, 1995; pp. 229–239. [Google Scholar]
  26. Juinio-Meñez, M.A.; Bangi, H.G.P.; Malay, M.C.D.; Pastor, D. Enhancing the recovery of depleted Tripneustes gratilla stocks through grow-out culture and restocking. Rev. Fish. Sci. 2008, 16, 35–43. [Google Scholar] [CrossRef]
  27. Andrew, N.L.; Agatsuma, Y.; Ballesteros, E.; Bazhin, A.G.; Creaser, E.P.; Barnes, D.K.A.; Botsford, L.W.; Bradbury, A.; Campbell, A.; Dixon, J.D.; et al. Status and management of the world sea urchin fisheries. Oceanogr. Mar. Biol. Annu. Rev. 2002, 40, 343–425. [Google Scholar]
  28. Lawrence, J.M.; Agatsuma, Y. Tripneustes. In Sea Urchins: Biology and Ecology, 4th ed.; Lawrence, J.M., Ed.; Academic Press: London, UK; Elsevier: London, UK, 2020; pp. 681–703. [Google Scholar]
  29. Shimabukuro, S. Tripneustes gratilla (sea urchin). In Aquaculture in Tropical Areas; English ed.; Shokita, S., Kakazu, K., Tomori, A., Toma, T., Eds.; Prepared by M. Yamaguchi; Midoro Shobo: Tokyo, Japan, 1991; pp. 313–328. [Google Scholar]
  30. Lawrence, J.M.; Bazhin, A. Life-history strategies and the potential of sea urchins for aquaculture. J. Shellfish Res. 1998, 17, 1515–1522. [Google Scholar]
  31. Koike, I.; Mukai, H.; Nojima, S. The role of the sea urchin, Tripneustes gratilla (Linnaeus), in decomposition and nutrient cycling in a tropical seagrass bed. Ecol. Res. 1987, 2, 19–29. [Google Scholar] [CrossRef]
  32. Klumpp, D.W.; Salita-Espinosa, J.T.; Fortes, M.D. Feeding ecology and trophic role of sea urchins in a tropical seagrass community. Aquat. Bot. 1993, 45, 205–229. [Google Scholar] [CrossRef]
  33. Valentine, J.F.; Heck, K.L., Jr.; Busby, J.; Webb, D. Experimental evidence that herbivory can increase shoot density in a subtropical turtlegrass (Thalassia testudinum) meadow. Oecologia 1997, 112, 193–200. [Google Scholar] [CrossRef]
  34. Vonk, J.A.; Pijnappels, M.H.J.; Stapel, J. In situ quantification of Tripneustes gratilla grazing and its effects on three co-occurring tropical seagrass species. Mar. Ecol. Prog. Ser. 2008, 360, 107–114. [Google Scholar] [CrossRef] [Green Version]
  35. Chiu, S.-H.; Huang, Y.-H.; Lin, H.-J. Carbon budget of leaves of the tropical intertidal seagrass Thalassia hemprichii. Estuar. Coast. Shelf Sci. 2013, 125, 27–35. [Google Scholar] [CrossRef]
  36. Conklin, E.J.; Smith, J.E. Abundance and spread of the invasive red algae, Kappaphycus spp. in Kane’ ohe Bay, Hawai’i and an experimental assessment of management options. Biol. Invasions 2005, 7, 1029–1039. [Google Scholar] [CrossRef]
  37. Stimson, J.; Cunha, T.; Philippoff, J. Food preferences and related behavior of the browsing sea urchin Tripneustes gratilla (Linnaeus) and its potential for use as a biological control agent. Mar. Biol. 2007, 151, 1761–1772. [Google Scholar] [CrossRef]
  38. Valentine, J.P.; Edgar, G.J. Impacts of a population outbreak of the urchin Tripneustes gratilla amongst Lord Howe Island coral communities. Coral Reefs 2010, 29, 399–410. [Google Scholar] [CrossRef]
  39. Westbrook, C.E.; Ringang, R.R.; Cantero, S.M.A.; HDAR, TNC Urchin Team; Toonen, R.J. Survivorship and feeding preferences among size classes of outplanted sea urchins, Tripneustes gratilla, and possible use as biocontrol for invasive alien algae. PeerJ 2015, 3, e1235. [Google Scholar] [CrossRef] [Green Version]
  40. Cebrian, J.; Enriquez, S.; Fortes, M.; Agawin, N.; Vermaat, J.E.; Duarte, C.M. Epiphyte accrual on Posidonia oceanica. L Delile leaves: Implications for light absorption. Bot. Mar. 1999, 42, 123–128. [Google Scholar] [CrossRef]
  41. Furman, B.; Heck, K.I., Jr. Differential impacts of echinoid grazers on coral recruitment. Bull. Mar. Sci. 2009, 85, 121–132. [Google Scholar]
  42. Leopardas, V.; Honda, K.; Go, G.A.; Bolisay, K.; Pantallano, A.D.; Uy, W.; Fortes, M.D.; Nakaoka, M. Variation in macrofaunal communities of sea grass beds along a pollution gradient in Bolinao, northwestern Philippines. Mar. Pollut. Bull. 2016, 105, 310–318. [Google Scholar] [CrossRef] [Green Version]
  43. McManus, J.W.; Nañola, C.L.; Reyes, R.B.; Kesner, K.N. Resource Ecology of the Bolinao Coral Reef System; ICLARM Studies Review, 22; International Center for Living Aquatic Resources Management: Manila, Philippines, 1992; p. 117. [Google Scholar]
  44. Holmer, M.; Marba, N.; Terrados, J.; Duarte, C.M.; Fortes, M.D. Impacts of milkfish (Chanos chanos) aquaculture on carbon and nutrient fluxes in the Bolinao area, Philippines. Mar. Pollut. Bull. 2002, 44, 685–696. [Google Scholar] [CrossRef] [Green Version]
  45. Holmer, M.; Duarte, C.M.; Heilskov, A.; Olesen, B.; Terrados, J. Biogeochemical conditions in sediments enriched by organic matter from net-pen fish farms in the Bolinao area, Philippines. Mar. Pollut. Bull. 2003, 46, 1470–1479. [Google Scholar] [CrossRef]
  46. David, C.P.; Sta. Maria, Y.Y.; Siringan, F.P.; Reotita, J.M.; Zamora, P.B.; Villanoy, C.L.; Sombrito, E.Z.; Azanza, R.V. Coastal pollution due to increasing nutrient flux in aquaculture sites. Environ. Geol. 2009, 58, 447–454. [Google Scholar] [CrossRef]
  47. Geček, S.; Legović, T. Towards carrying capacity assessment for aquaculture in the Bolinao Bay, Philippines: A numerical study of tidal circulation. Ecol. Modell. 2010, 221, 1394–1412. [Google Scholar] [CrossRef]
  48. San Diego-McGlone, M.L.; Azanza, R.V.; Villanoy, C.L.; Jacinto, G.S. Eutrophic waters, algal bloom and fish kill in fish farming areas in Bolinao, Pangasinan, Philippines. Mar. Poll. Bull. 2008, 57, 295–301. [Google Scholar] [CrossRef]
  49. Fortes, M.D.; Go, G.A.; Bolisay, K.; Nakaoka, M.; Uy, W.H.; Lopez, M.R.; Leopardas, V.; Leriorato, J.; Pantallano, A.; Paciencia, F.; et al. Seagrass response to mariculture-induced physico-chemical gradients in Bolinao, northwestern Philippines. In Proceedings of the 12th International Coral Reef Symposium, Cairns, Australia, 9–13 July 2012. [Google Scholar]
  50. Tanaka, T.; Go, G.A.; Watanabe, A.; Miyajima, T.; Nakaoka, M.; Uy, W.H.; Nadaoka, K.; Watanabe, S.; Fortes, M.D. 17-year change in species composition of mixed seagrass beds around Santiago Island, Bolinao, the northwestern Philippines. Mar. Pollut. Bull. 2014, 88, 81–85. [Google Scholar] [CrossRef] [Green Version]
  51. Ferrera, C.M.; Watanabe, A.; Miyajima, T.; San Diego-McGlone, M.L.; Morimoto, N.; Umezawa, Y.; Herrera, E.; Tsuchiya, T.; Yoshikai, M.; Nadaoka, K. Phosphorus as a driver of nitrogen limitation and sustained eutrophic conditions in Bolinao and Anda, Philippines, a mariculture-impacted tropical coastal area. Mar. Pollut. Bull. 2016, 105, 237–248. [Google Scholar] [CrossRef] [Green Version]
  52. Doty, S.M. Measurement of water movement in reference to benthic algal growth. Bot. Mar. 1971, 14, 32–35. [Google Scholar] [CrossRef]
  53. English, S.; Wilkinson, C.; Baker, V. Seagrass Communities. Chapter 5. In Survey Manual for Tropical Marine Resources; ASEAN-Australia Marine Science Project; Australian Institute of Marine Science: Townsville, Australia, 1997; pp. 241–252. [Google Scholar]
  54. Burdick, D.M.; Kendrick, G.A. Standards for seagrass collection, identification, and sample design. In Global Seagrass Research Methods; Short, F.T., Coles, R.G., Eds.; Elsevier Science B.V.: Amsterdam, The Netherlands, 2001; pp. 79–100. [Google Scholar]
  55. Duarte, C.M.; Kirkman, H. Methods for the measurement of seagrass abundance and depth distribution. In Global Seagrass Research Methods; Short, F.T., Coles, R.G., Eds.; Elsevier Science B.V.: Amsterdam, The Netherlands, 2001; pp. 141–154. [Google Scholar]
  56. Vermaat, J.E.; Fortes, M.D.; Agawin, N.R.; Duarte, C.M.; Marbà, N.; Uri, J.S. Meadow maintenance, growth and productivity in a mixed Philippine seagrass bed. Mar. Ecol. Prog. Ser. 1995, 124, 215–255. [Google Scholar] [CrossRef] [Green Version]
  57. Short, F.T.; Duarte, C.M. Methods for the measurement of seagrass growth and production. In Global Seagrass Research Methods; Short, F.T., Coles, R.G., Eds.; Elsevier Science B.V.: Amsterdam, The Netherlands, 2001; pp. 155–182. [Google Scholar]
  58. Lawrence, J.M. The effect of stress and disturbance in Echinoderms. Zool. Sci. 1990, 7, 17–28. [Google Scholar]
  59. Tuason, A.Y.; Gomez, E.D. The reproductive biology of Tripneustes gratilla Linnaeus (Echinodermata: Echinoidea) with some notes on Diadema setosum Leske. Proc. Int. Symp. Mar. Biogeogr. Evol. South. Hemisph. 1979, 2, 707–716. [Google Scholar]
  60. Vaïtilingon, D.; Rasolofonirina, R.; Jangoux, M. Feeding preferences, seasonal gut repletion indices, and diel feeding patterns of the sea urchin Tripneustes gratilla (Echinodermata: Echinoidea) on a coastal habitat off Toliara (Madagascar). Mar. Biol. 2003, 143, 451–458. [Google Scholar] [CrossRef]
  61. Agatsuma, Y.; Sato, M.; Taniguchi, K. Factor causing brown-colored gonads of the sea urchin, Strongylocentrotus nudus, in northern Honshu, Japan. Aquaculture 2005, 249, 449–458. [Google Scholar] [CrossRef]
  62. Agnette, T.; Zairin, M.; Mokoginta; Suprayudi, M.A.; Yulianda, F. Protein level and protein energy ratio that produce the best gonad quality of sea urchin Tripneustes gratilla. J. Biol. Life Sci. 2014, 5, 95–105. [Google Scholar]
  63. Anderson, M.J. Permutation tests for univariate or multivariate analysis of variance and regression. Can. J. Fish. Aquat. Sci. 2001, 58, 626–639. [Google Scholar] [CrossRef]
  64. Shepard, R.N. The analysis of proximities: Multidimensional scaling with an unknown distance function. II. Psychometrika 1962, 27, 219–246. [Google Scholar] [CrossRef]
  65. Kruskal, J.B. Multidimensional Scaling by Optimizing Goodness of Fit to a Nonmetric Hypothesis. Psychometrika 1964, 29, 1–27. [Google Scholar] [CrossRef]
  66. Anderson, M.J.; Willis, T.J. Canonical analysis of principal coordinates: A useful method of constrained ordination for ecology. Ecology 2003, 84, 511–525. [Google Scholar] [CrossRef]
  67. Anderson, M.J.; ter Braak, C.J.F. Permutation tests for multi-factorial analysis of variance. J. Stat. Comput. Simul. 2003, 73, 85–113. [Google Scholar] [CrossRef]
  68. McArdle, B.H.; Anderson, M.J. Fitting multivariate models to community data: A comment on distance-based redundancy analysis. Ecology 2001, 82, 290–297. [Google Scholar] [CrossRef]
  69. Clarke, K.R.; Warwick, R.M. Change in Marine Communities: An Approach to Statistical Analysis and Interpretation, 2nd ed.; Primer-e Ltd., Plymouth Marine Laboratory: Plymouth, UK, 2001. [Google Scholar]
  70. Bach, S.S.; Borum, J.; Fortes, M.D.; Duarte, C.M. Species composition and plant performance of mixed seagrass beds along a siltation gradient at Cape Bolinao, the Philippines. Mar. Ecol. Prog. Ser. 1998, 174, 247–256. [Google Scholar] [CrossRef]
  71. Watai, M.; Nakamura, Y.; Honda, K.; Bolisay, K.O.; Miyajima, T.; Nakaoka, M.; Fortes, M.D. Diet, growth, and abundance of two seagrass bed fishes along a pollution gradient caused by milkfish farming in Bolinao, northwestern Philippines. Fish Sci. 2015, 81, 43–51. [Google Scholar] [CrossRef]
  72. Eklöf, J.S.; de la Torre-Castro, M.; Gullström, M.; Uku, J.; Muthiga, N.; Lyimo, T.; Bandeira, S.O. Sea urchin overgrazing of seagrasses: A review of current knowledge on causes, consequences, and management. Estuar. Coast. Shelf Sci. 2008, 79, 569–580. [Google Scholar] [CrossRef]
  73. Fernandez, C.; Ferrat, L.; Pergent, G.; Pasqualini, V. Sea urchin–seagrasses interactions: Trophic links in a benthic ecosystem from a coastal lagoon. Hydrobiologia 2012, 699, 21–33. [Google Scholar] [CrossRef]
  74. Rollon, R.N.; Van Steveninck, E.D.D.R.; Van Vierssen, W.; Fortes, M.D. Contrasting recolonization strategies in multi-species seagrass meadows. Mar. Pollut. Bull. 1998, 37, 450–459. [Google Scholar] [CrossRef]
  75. Terrados, J.; Duarte, C.M.; Kamp-Nielsen, L.; Borum, J.; Agawin, N.S.R.; Fortes, M.D.; Gacia, E.; Lacap, D.; Lubanski, M.; Greve, T. Are seagrass growth and survival affected by reducing conditions in the sediment? Aquat. Bot. 1999, 65, 175–197. [Google Scholar] [CrossRef]
  76. Uy, W.H.; Vermaat, J.E.; Hemminga, M.A. The Interactive Effect of Shading and Sediment Conditions on Growth and Photosynthesis of Two Seagrass Species, Thalassia hemprichii and Halodule uninervis. Functioning of Philippine Seagrass Species under Deteriorating Light Conditions. Ph.D. Dissertation, Wageningen University-International Institute for Infrastructural, Hydraulic and Environmental Engineering, Swets and Zeitlinger B.V., Lisse, The Netherlands, 2001; pp. 49–72. [Google Scholar]
  77. Mukai, H.; Nojima, S. A preliminary study on grazing and defecation rates of a seagrass grazer, Tripneustes gratilla (L.) (Echinidermata: Echinoidea), in Papua New Guinean seagrass beds. Spec. Publ. Makaishishima Mar. Biol. Stn. 1985, 84–191. [Google Scholar]
  78. Watts, S.A.; Lawrence, A.L.; Lawrence, J.M. Nutrition. In Sea Urchins: Biology and Ecology, 4th ed.; Lawrence, J.M., Ed.; Elsevier: London, UK, 2020; pp. 191–208. [Google Scholar]
  79. Ebert, T.A. Relative growth of sea urchin jaws: An example of plastic resource allocation. Bull. Mar. Sci. 1980, 30, 467–474. [Google Scholar]
  80. Black, R.; Codd, C.; Hebbert, D.; Vink, S.; Burt, J. The functional significance of the relative size of Aristotle’s lantern in the sea urchin Echinometra mathaei (de Blainville). J. Exp. Mar. Biol. Ecol. 1984, 77, 81–97. [Google Scholar] [CrossRef]
  81. Levitan, D.R. Skeletal changes in the test and jaws of the sea urchin Diadema antillarum in response to food limitation. Mar. Biol. 1991, 111, 431–435. [Google Scholar] [CrossRef]
  82. Edwards, P.B.; Ebert, T.A. Plastic responses to limited food availability and spine damage in the sea urchin Strongylocentrotus purpuratus. J. Exp. Mar. Biol. Ecol. 1991, 145, 205–220. [Google Scholar] [CrossRef]
  83. Smith, J.G.; Garcia, S.C. Variation in purple sea urchin (Strongylocentrotus purpuratus) morphological traits in relation to resource availability. PeerJ 2021, 9, e11352. [Google Scholar] [CrossRef]
  84. Bangi, H.G.P. The Effect of Adult Nutrition on Somatic and Gonadal Growth, Egg Quality and Larval Development of the Sea Urchin Tripneustes gratilla Linnaeus 1758 (Echinodermata: Echinoidea). Master’s Thesis, Marine Science Institute, University of the Philippines Diliman, Quezon City, Philippines, 2001. [Google Scholar]
  85. Böttger, S.A.; McClintock, J.B.; Klinger, T.S. Effects of organic and inorganic phosphates on feeding, absorption, nutrient allocation, growth, righting responses of the sea urchin Lytechinus variegatus. Mar. Biol. 2001, 138, 741–751. [Google Scholar] [CrossRef]
  86. Böttger, S.A.; McClintock, J.B. The effects of organic and inorganic phosphates on fertilization and early development in the sea urchin Lytechinus variegatus (Echinodermata: Echinoidea). Comp. Biochem. Physiol. Part C 2001, 129, 307–315. [Google Scholar] [CrossRef]
  87. Siikavuopio, S.I.; Dale, T.; Foss, A.; Mortensen, A. Effects of chronic ammonia exposure on gonad growth and survival in green sea urchin Strongylocentrotus droebachiensis. Aquaculture 2004, 242, 313–320. [Google Scholar] [CrossRef]
  88. Siikavuopio, S.I.; Dale, T.; Christiansen, J.S.; Nevermo, I. Effects of chronic nitrite exposure on gonad growth in green sea urchin Strongylocentrotus droebachiensis. Aquaculture 2004, 242, 357–363. [Google Scholar] [CrossRef]
  89. White, C.A.; Dworjanyn, S.A.; Nichols, P.D.; Mos, B.; Dempster, T. Future aquafeeds may compromise reproductive fitness in a marine invertebrate. Mar. Environ. Res. 2016, 122, 67–75. [Google Scholar] [CrossRef] [Green Version]
  90. Bangi, H.G.P.; Juinio-Meñez, M.A. Resource allocation trade-offs in the sea urchin Tripneustes gratilla under relative storminess and wave exposure. Mar. Ecol. Prog. Ser. 2019, 608, 165–182. [Google Scholar] [CrossRef]
Figure 1. Map showing the study stations in Bolinao, northwestern Philippines, indicated by the filled circles (green: northwestern stations farthest to the fish farms (FAR), sampled during the southwest, SW, northeast, NE and easterly monsoon period; dark red: eastern side, intermediate stations (INT), sampled during NE and easterly period; black: eastern stations, nearest to the fish farms (NEAR), sampled during SW monsoon period). The location of fish cages and pens are shown within the Bolinao-Anda coastal waters based on Google Earth image of January 2014, modified from [51] using Ocean Data View software. Map of the Philippines on the right shows the location of Bolinao.
Diversity 15 00843 g001
Figure 2. Overall mean (±SE) shoot density, estimated leaf production, above-ground fresh and dry biomass of seagrass resources measured in each station. Asterisks indicate statistical significance of samples between the stations, within each corresponding sampling period (* p < 0.05, ** p < 0.01, *** p < 0.001), obtained using 4999 permutations or through Monte Carlo (MC) where appropriate, based on PERMANOVA. Pair-wise tests were done as a posteriori check for significant effect.
Diversity 15 00843 g002
Figure 3. Overall mean (±SE) gut content percentage (in relation to total body weight) in similarly sized adult T. gratilla sampled from each study station. Asterisks indicate statistical significance of samples between stations, within each corresponding period (** p < 0.01, *** p < 0.001), obtained using 4999 permutations or through Monte Carlo (MC), where appropriate, based on PERMANOVA. Pair-wise tests were done as a posteriori check for significant effect.
Diversity 15 00843 g003
Figure 4. Overall mean (±SE) Aristotle’s lantern weight percentage (in relation to total body weight) in similarly sized adult T. gratilla sampled from each station. Asterisks indicate statistical significance of samples between stations, within each corresponding sampling period (* p < 0.05, ** p < 0.01), obtained using 4999 permutations or through Monte Carlo (MC), where appropriate, based on PERMANOVA. Pair-wise tests were done as a posteriori check for significant effect.
Diversity 15 00843 g004
Figure 5. Overall mean (±SE) gut weight percentage (in relation to total body weight) in similarly sized adult T. gratilla sampled from each station. Asterisks indicate statistical significance of samples between stations, within each corresponding sampling period (** p < 0.01), obtained using 4999 permutations or through Monte Carlo (MC), where appropriate, based on PERMANOVA. Pair-wise tests were done as a posteriori check for significant effect.
Diversity 15 00843 g005
Figure 6. Overall mean (±SE) gonad weight percentage (in relation to total body weight) in similarly sized adult T. gratilla sampled from each station. Asterisks indicate statistical significance of samples between stations, within each corresponding sampling period (* p < 0.05, ** p < 0.01), obtained using 4999 permutations or through Monte Carlo (MC), where appropriate, based on PERMANOVA. Pair-wise tests were done as a posteriori check for significant effect.
Diversity 15 00843 g006
Figure 7. Gonad quality by overall mean % frequency of categories in similarly sized adult T. gratilla sampled from each station. Actual gonad colors are indicated. The five quality grades are as follows: Grade I (dark greenish to blackish brown), Grade II (greenish to yellowish brown), Grade III (light to vivid reddish yellow), Grade IV (bright reddish yellow) and Grade V (bright orange–yellow). Grade I is the “worst” quality and Grade V is the “best”. Asterisks indicate statistical significance of samples between stations, within each corresponding sampling period (*** p < 0.001), obtained using 4999 permutations or through Monte Carlo (MC), where appropriate, based on PERMANOVA. Pair-wise tests were done as a posteriori check for significant effect.
Diversity 15 00843 g007
Table 1. Canonical analyses of principal coordinates (CAP) examining the relationships of T. gratilla phenotypic traits (body components % weight, and gonad quality) and seagrass abundance measures, on the basis of Euclidean distance index on log- and square root-transformed data. “m” is the number of PCO or principal coordinate axes used in the CAP analysis, % Var is the percentage of the total variance explained by the first m PCO axis. Allocation % success is the percentage of points correctly allocated into each group, δ2 = the squared canonical correlation. p-values given are the results of pair-wise comparisons of T.gratilla phenotypic traits and seagrass abundance measures in FAR vs. INT stations vs. NEAR stations, using permutational analysis of variance, with 999 permutations of individual.
Canonical Analysis of Principal Coordinates (CAP)
Correlations
EigenvalueCorrelationCorrelation sq. (δ2)
10.91490.8371
20.78610.618
m% Var (1st PCO)Total Allocation success (%)1st Correlation sq. (δ2)p value
371.0492.4240.837090.001
Cross Validation
(Leave-one-out allocation of observation to groups)
ClassifiedTotal% correct
Original GroupsFAR stationsINTermediate stationsNEAR stations
FAR stations500050100
INTermediate stations105006083.33
NEAR stations002222100
Table 2. Result of CAP analyses examining the correlations of each T. gratilla phenotypic trait, density and seagrass abundance measure and environmental station variables. A positive correlation in the first axis indicates trait or variables associated with stations FAR from the fish farms, while a negative correlation indicates trait or variables associated with stations INT and NEAR to the fish farms.
CAP Pearson correlatons
(Response variables: T. gratilla and seagrass variables)
GSIALIGIRIGQltyShoot denLeaf prodFW biomassDW biomass
CAP1−0.663−0.599−0.621−0.504−0.503−0.849−0.565−0.132−0.0152
CAP2−0.182−0.148−0.140−0.054−0.1750.1450.4640.9220.875
CAP Pearson correlation
(Environmental variables)
SSTDFDepth
CAP10.334−0.707−0.023
CAP20.079−0.0820.322
PERMUTATION TEST
Trace statistic = (tr(Q_m’HQ_m))
First squared canonical correlation = (delta_1^2) = δ12
Trace statistic: tr (Q_m’HQ_m): 1.45507    P: 0.0002
δ12: 0.83709P: 0.0002
No. of permutations used: 4999
Disclaimer/Publisher’s Note: The statements, opinions and data contained in all publications are solely those of the individual author(s) and contributor(s) and not of MDPI and/or the editor(s). MDPI and/or the editor(s) disclaim responsibility for any injury to people or property resulting from any ideas, methods, instructions or products referred to in the content.

