Article

Genomic Patterns of Iberian Wild Bees Reveal Levels of Diversity, Differentiation and Population Structure, Supporting the “Refugia within Refugia” Hypothesis

1
cE3c—Center for Ecology, Evolution and Environmental Changes & CHANGE—Global Change and Sustainability Institute, Departamento de Biologia Animal, Faculdade de Ciências, Universidade de Lisboa, 1749-016 Lisboa, Portugal
2
Department of Ecology, Universidade Federal de Goiás, Goiânia 74690-900, GO, Brazil
3
Laboratory of Agrozoology, Department of Plants and Crops, Faculty of Bioscience Engineering, Ghent University, B-9000 Ghent, Belgium
4
Molecular and Cellular Life Sciences, Department of Biology, Vrije Universiteit Brussel (VUB), 1050 Brussels, Belgium
5
Laboratory of Zoology, Research Institute for Biosciences, University of Mons, Place du Parc 20, 7000 Mons, Belgium
*
Author to whom correspondence should be addressed.
These authors contributed equally to this work.
Diversity 2023, 15(6), 746; https://doi.org/10.3390/d15060746
Submission received: 6 May 2023 / Revised: 31 May 2023 / Accepted: 2 June 2023 / Published: 6 June 2023
(This article belongs to the Special Issue Diversity, Systematics and Evolution of Hymenoptera)

Abstract

:
We used a population genomic approach to unravel the population structure, genetic differentiation, and genetic diversity of three widespread wild bee species across the Iberian Peninsula, Andrena agilissima, Andrena flavipes and Lasioglossum malachurum. Our results demonstrated that genetic lineages in the Ebro River valley or near the Pyrenees mountains are different from the rest of Iberia. This relatively congruent pattern across species once more supports the hypothesis of “refugia within refugia” in the Iberian Peninsula. The results for A. flavipes and A. agilissima showed an unexpected pattern of genetic differentiation, with the generalist polylectic A. flavipes having lower levels of genetic diversity (Ho = 0.0807, He = 0.2883) and higher differentiation (FST = 0.5611), while the specialist oligolectic A. agilissima had higher genetic diversity (Ho = 0.2104, He = 0.3282) and lower differentiation values (FST = 0.0957). For L. malachurum, the smallest and the only social species showed the lowest inbreeding coefficient (FIS = 0.1009) and the lowest differentiation level (FST = 0.0663). Overall, our results, suggest that this pattern of population structure and genetic diversity could be explained by the combined role of past climate changes and the life-history traits of the species (i.e., size, sociality and host-plant specialization), supporting the role of the Iberian refugia as a biodiversity hotspot.

1. Introduction

Pollinators comprise a diverse group of animals and are keystone elements inside ecological networks, playing an important role in ecosystem function [1], as well as ensuring the reproduction of 88% of flowering plant species and 35% of crops in global agricultural production [2,3]. Among these, bees are thought to be the most important pollinators globally [4,5]. However, according to the European Red List of Bees, at least 9% of all bee species in Europe are at risk of extinction, and 57% do not have enough data to assess their conservation status [6]. Unfortunately, despite the great diversity of bee species, with approximately 20,000 species described worldwide [7], studies are focused mostly on honeybees (e.g., Apis mellifera and Apis cerana), showing that there is still a knowledge gap when it comes to the remaining species of wild bees, as knowledge on honey bees is poorly transferable to wild bees [8,9].
In order to create a knowledge-based conservation strategy for wild bees, it is important to understand how genetic diversity has been generated, distributed and maintained through time and to integrate these genetic diversity measurements into mitigation strategies [10]. Low levels of genetic diversity could restrict the adaptive and evolutive potential of natural populations of wild bees inhabiting unstable habitats, increasing both mutation rates and the risk of inbreeding, possibly threatening population viability [11]. Several studies have shown that declining bumblebee species have historically lower levels of genetic diversity when compared to more stable species [12,13,14,15], and their decline does not appear to be the cause of these observed differences [13,14,16].
Within Europe, areas with a Mediterranean climate such as the Iberian Peninsula have both high bee diversity and high levels of endemism [6]. The Mediterranean climates provides optimal conditions for bees, with these regions supporting higher species diversity than the tropics [17]. One possible reason for this high diversity could be that the Iberian Peninsula functioned as one of the largest European refugia for European communities during the Quaternary glaciation events [18,19,20,21,22]. Moreover, during the Quaternary climatic cycles, with its several mountain ranges and complex physiography, multiple refugia were created within Iberia, where populations remained isolated from one another, reducing gene flow and increasing differentiation. Such isolation is known to have contributed to the genetic diversity and differentiation among populations of several taxa [19,20,23], but there are exceptions [24]. As a consequence of these empirical data, the hypothesis of “refugia within refugia” [20] has become a general hypothesis used to address Iberian phylogeographic patterns. Such a hypothesis implies that the populations inhabiting each of the several Iberian refugia during the glacial phase of the Quaternary climatic cycles had reduced gene flow, or were even completely isolated, which increased neutral differentiation, resulting in population structure inside each species. Geographic congruence was found among several taxonomic groups, and some geographic areas seem to be more prone to having more differentiated populations [20]. Postglacial expansions enable the formation of contact zones between refugia populations or admixture, but do not entirely erode the populations’ structure patterns [19,25]. However, life-history traits such as diet span [26,27,28], sociality and nesting behavior [29,30] and body size [30] may have affected both genetic diversity and differentiation among bee populations either in the glacial or interglacial phases of the Quaternary climatic cycles. Studies of the genomic patterns of bees in the Iberian Peninsula are not common and, to our knowledge, restricted to the honeybee [29] and the buff-tailed-bumblebee [30], with the latter lacking any genetic structure.
To better understand the genomic patterns of wild bees, we used RAD sequencing to obtain single nucleotide polymorphic sites (SNPs) on three common species sampled across the Iberian Peninsula. Andrena flavipes is a medium-sized ground-nesting bee (7–9 mm) [31]. Despite being solitary, it is known to form large nesting aggregations [31]. This species has been recorded to collect pollen from up to 13 plant families and is classified as polylactic [32]. Andrena agilissima can also be classified as a medium-sized species (8–12 mm). Like A. flavipes, it constructs its nest underground, has a solitary lifestyle [31] and can also form large nests aggregations [33]. However, it is an oligolectic species, collecting pollen only from the Brassicacea plant family [31]. Lasioglossum malachurum is a social species, forming colonies with a single reproducing female and several sterile female workers, and also nests underground. Of our three species, L. malachurum is the smallest (4–7 mm, queens may be larger) and it has been recorded to collect pollen from up to 23 plant families [34].
Using the genomic data of these species, we want to assess: (i) whether there are population structures inside Iberia as expected according to the “refugia within refugia” hypothesis, and (ii) the role of life-history traits such as, diet span, body size, sociality and nesting behavior on genetic diversity and differentiation among the identified populations of each species. To our knowledge, no studies tackling these issues have been conducted in the Iberian Peninsula for these three species.

2. Materials and Methods
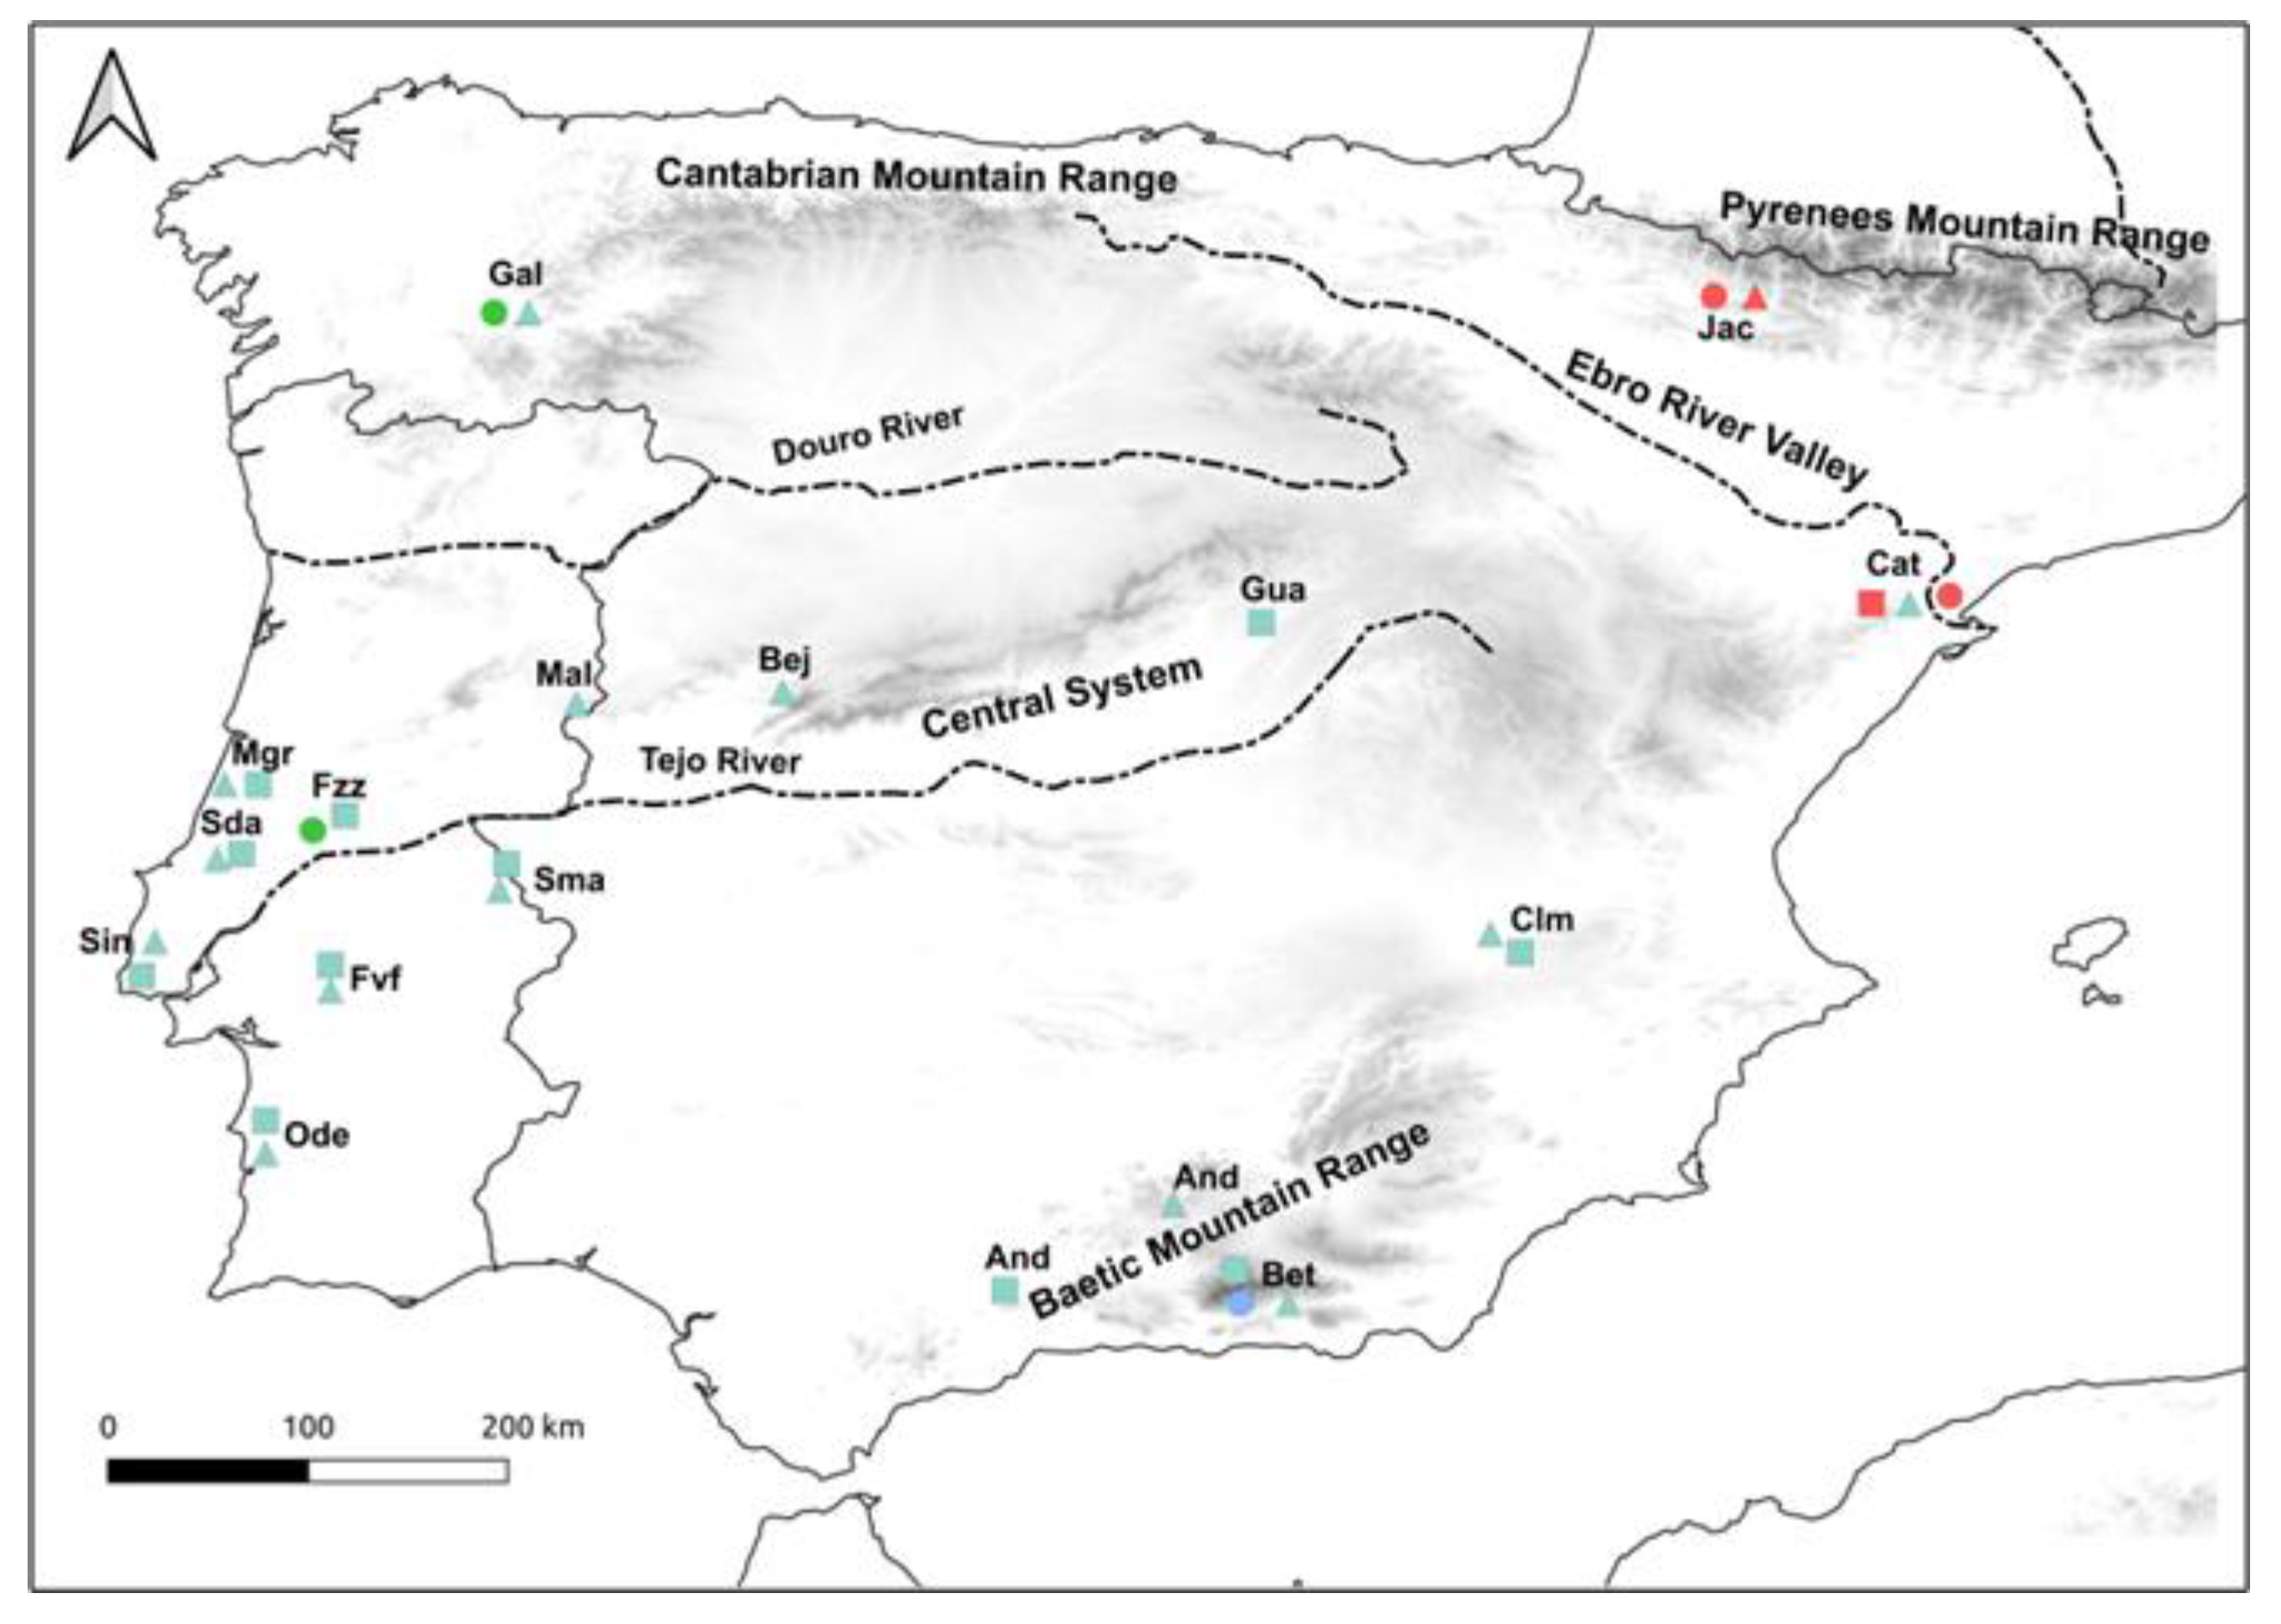
2.1. Sampling

The sampling of wild bee species was conducted with the appropriate permits issued by wildlife conservation authorities from Portugal and Spain. Between March and May 2019, a total of 118 individuals of the three target wild bee species (A. agilissima, A. flavipes, and L. malachurum) were collected across 16 areas in the Iberian Peninsula (Figure 1; Supplementary Tables S1 and S2). Since bees are haplodiploid, we only collected diploid individuals (females) to better assess the genetic diversity of these populations. Sampled bees were preserved individually in sampling tubes filled with pure ethanol and stored at −20 °C for subsequent analyses. Identification of the bees was performed in the laboratory using a Wild M3 (10×/21) stereoscope. The identities of all individuals were confirmed using DNA Barcoding.

2.2. DNA Extraction

The whole-genome DNA was extracted from the fore- and middle legs, the head and/or a portion of the thorax, depending on the size of the specimens. The hind legs and the abdomen were discarded to minimize DNA contamination with pollen and/or microbiota. High-quality genomic DNA was extracted using the DNeasy Blood and Tissue kit (Qiagen, Hilden, Germany) following the manufacturer’s standard protocol, with some minor adjustments. The extracted genomic DNA was then stored at −20 °C, and 40 µL of each DNA sample was dried on 96-well plates, using a thermocycler at 65 °C, with the lid open. The plates were then shipped to CD Genomics (Shirley, New York, NY, USA). Paired-end RAD sequencing was performed with Illumina NovaSeq, using the PstI-HF enzyme (New England Biolabs, Ipswich, MA, USA).

2.3. COI Amplification

DNA barcoding, with amplification and sequencing of fragments of the mitochondrial cytochrome oxidase I gene (COI), was used to confirm the species identity of all samples. We used two sets of universal primers: LepF/LepR [35], which amplified a fragment of 350 bp, and LCO/HCO [36], which produced one fragment of 710 bp. Additionally, to confirm the genetic identity of the individuals of the Andrena species, two species-specific oligonucleotide primers were designed for this genus: 5′-GATAGAATTAAGAAATCCAGG-3′ (AndrenaF) and 5′-CTGATCATGGGAATAGTGG-3′ (AndrenaR). We used Sequencher v5.4.6 (Gene Codes Corporation: Ann Arbor, MI, USA) [37] and AliView v1.26 (using Maft v.7) [38] to construct a consensus sequence from 53 sequences of 10 Andrena samples previously identified using the universal primers. The consensus sequence was then used to design a customized set of primers via the online tool Primer3 v0.4.0 (https://bioinfo.ut.ee/primer3-0.4.0/ (accessed on 1 June 2019)). The primers were synthesized using StabVida (Caparica, Portugal).
The fragment of the COI gene of several Andrena individuals was then sequenced in the forward direction. The quality of DNA sequences was controlled using Sequencher v5.4.6 [37].

2.4. SNP Calling and Filtering

Quality control of the RADseq raw read data was performed using FastQC v.0.11.3 (http://www.bioinformatics.babraham.ac.uk/projects/fastqc/ (accessed on 1 July 2020)). The adapters were removed using fastp v.0.20.1 [39], with an adapter list provided by CD Genomics. STACKS v2.53 [40] was used for filtering and SNP calling by following three steps: (i) the process_radtags module (with default settings for pair-end data) was used to remove low-quality reads (with a phred score < 33) and truncate all sequences for a size of 130 bp; (ii) the denovo_map.pl module (comprising ustacks, cstacks, sstacks and gstacks) was run with default settings for paired-end data to build the RAD loci catalogs and call SNPs; and (iii) the populations module was run with the following parameters: the individuals of each species were gathered in one single population, one random SNP per RAD locus was kept to avoid confounding signals of linkage disequilibrium, and SNPs had to be present in 80% of the individuals to be retained. Finally, VCFtools v0.1.11 [41] was used for the final filtering process, keeping both loci with a minor allele count equal to or greater than two and loci with less than 20% of missing data. Individuals with 30% or more of missing data were excluded. PGDSpider v.2.1.1.5 [42] was used to convert the final filtered datasets into the file formats needed for further analyses.

2.5. Population Structure

Population structure was inferred using three different methods: (i) ALStructure v. 0.1.0 [43], wrapped under Structure_threader v. 1.3.7 [44] (ii) principal components analyses (PCA), using the R package adegenet v. 2.1.5 [45] and performed in R v. 3.6.3 [46] and (iii) fineRADstructure v0.3.2, with the plots also being built in R v.3.6.3, using the FinestructureLibrary R package [47]. FineRADstructure was used with default parameters. For FineRADstructure, it is recommended to use inputs that have not been filtered for linkage disequilibrium. For this reason, the populations module of STACKS was used a second time with the same parameters applied as before, but retaining all the SNPs (all-SNPs dataset), rather than one random SNPs per locus. The datasets comprising only one random SNP per locus were used in the PCAs and ALStructure. ALStructure was run with default parameters, and we chose a range of K values from one to half the number of sampling sites for each species.
The number of clusters for each species was selected by comparing the three methods used. Subsequent analyses were performed, with the samples grouped according to the inferred K value for each species.

2.6. Summary Statistics

For the three species studied, neutral genetic variation was characterized based on several genetic estimates that were inferred using R v.3.6.3 [46]. Observed heterozygosity (Ho), the inbreeding coefficient (FIS) and the pairwise FST between each cluster were obtained using the R package hierfstat v.0.5-7c [48]. Expected heterozygosity (He) was calculated using the poppr v.2.9.0 R package [49]. G’ST Hedrick [50] and Jost’s D [51], both pairwise and global values, as well as the global Fst values for each species were calculated using the mmod v1.3.3 R package [52]. Nucleotide diversity (π) and nucleotide divergence (dXY) were calculated using Pixy v1.2.5.beta1 [53].

3. Results

A total of 118 samples were sequenced, (Table S2). After the quality processing, for Andrena agilissima, only 12 individuals and 14,230 SNPs were retained; for Andrena flavipes, 57 individuals and 27,822 SNPs were retained; and for Lasioglossum malachurum, 35 individuals and 33,810 SNPs were retained. The All-SNPs dataset had 26,321 SNPs for A. agilissima, 543,914 SNPs for A. flavipes and 256,976 for L. malachurum (Table S3).

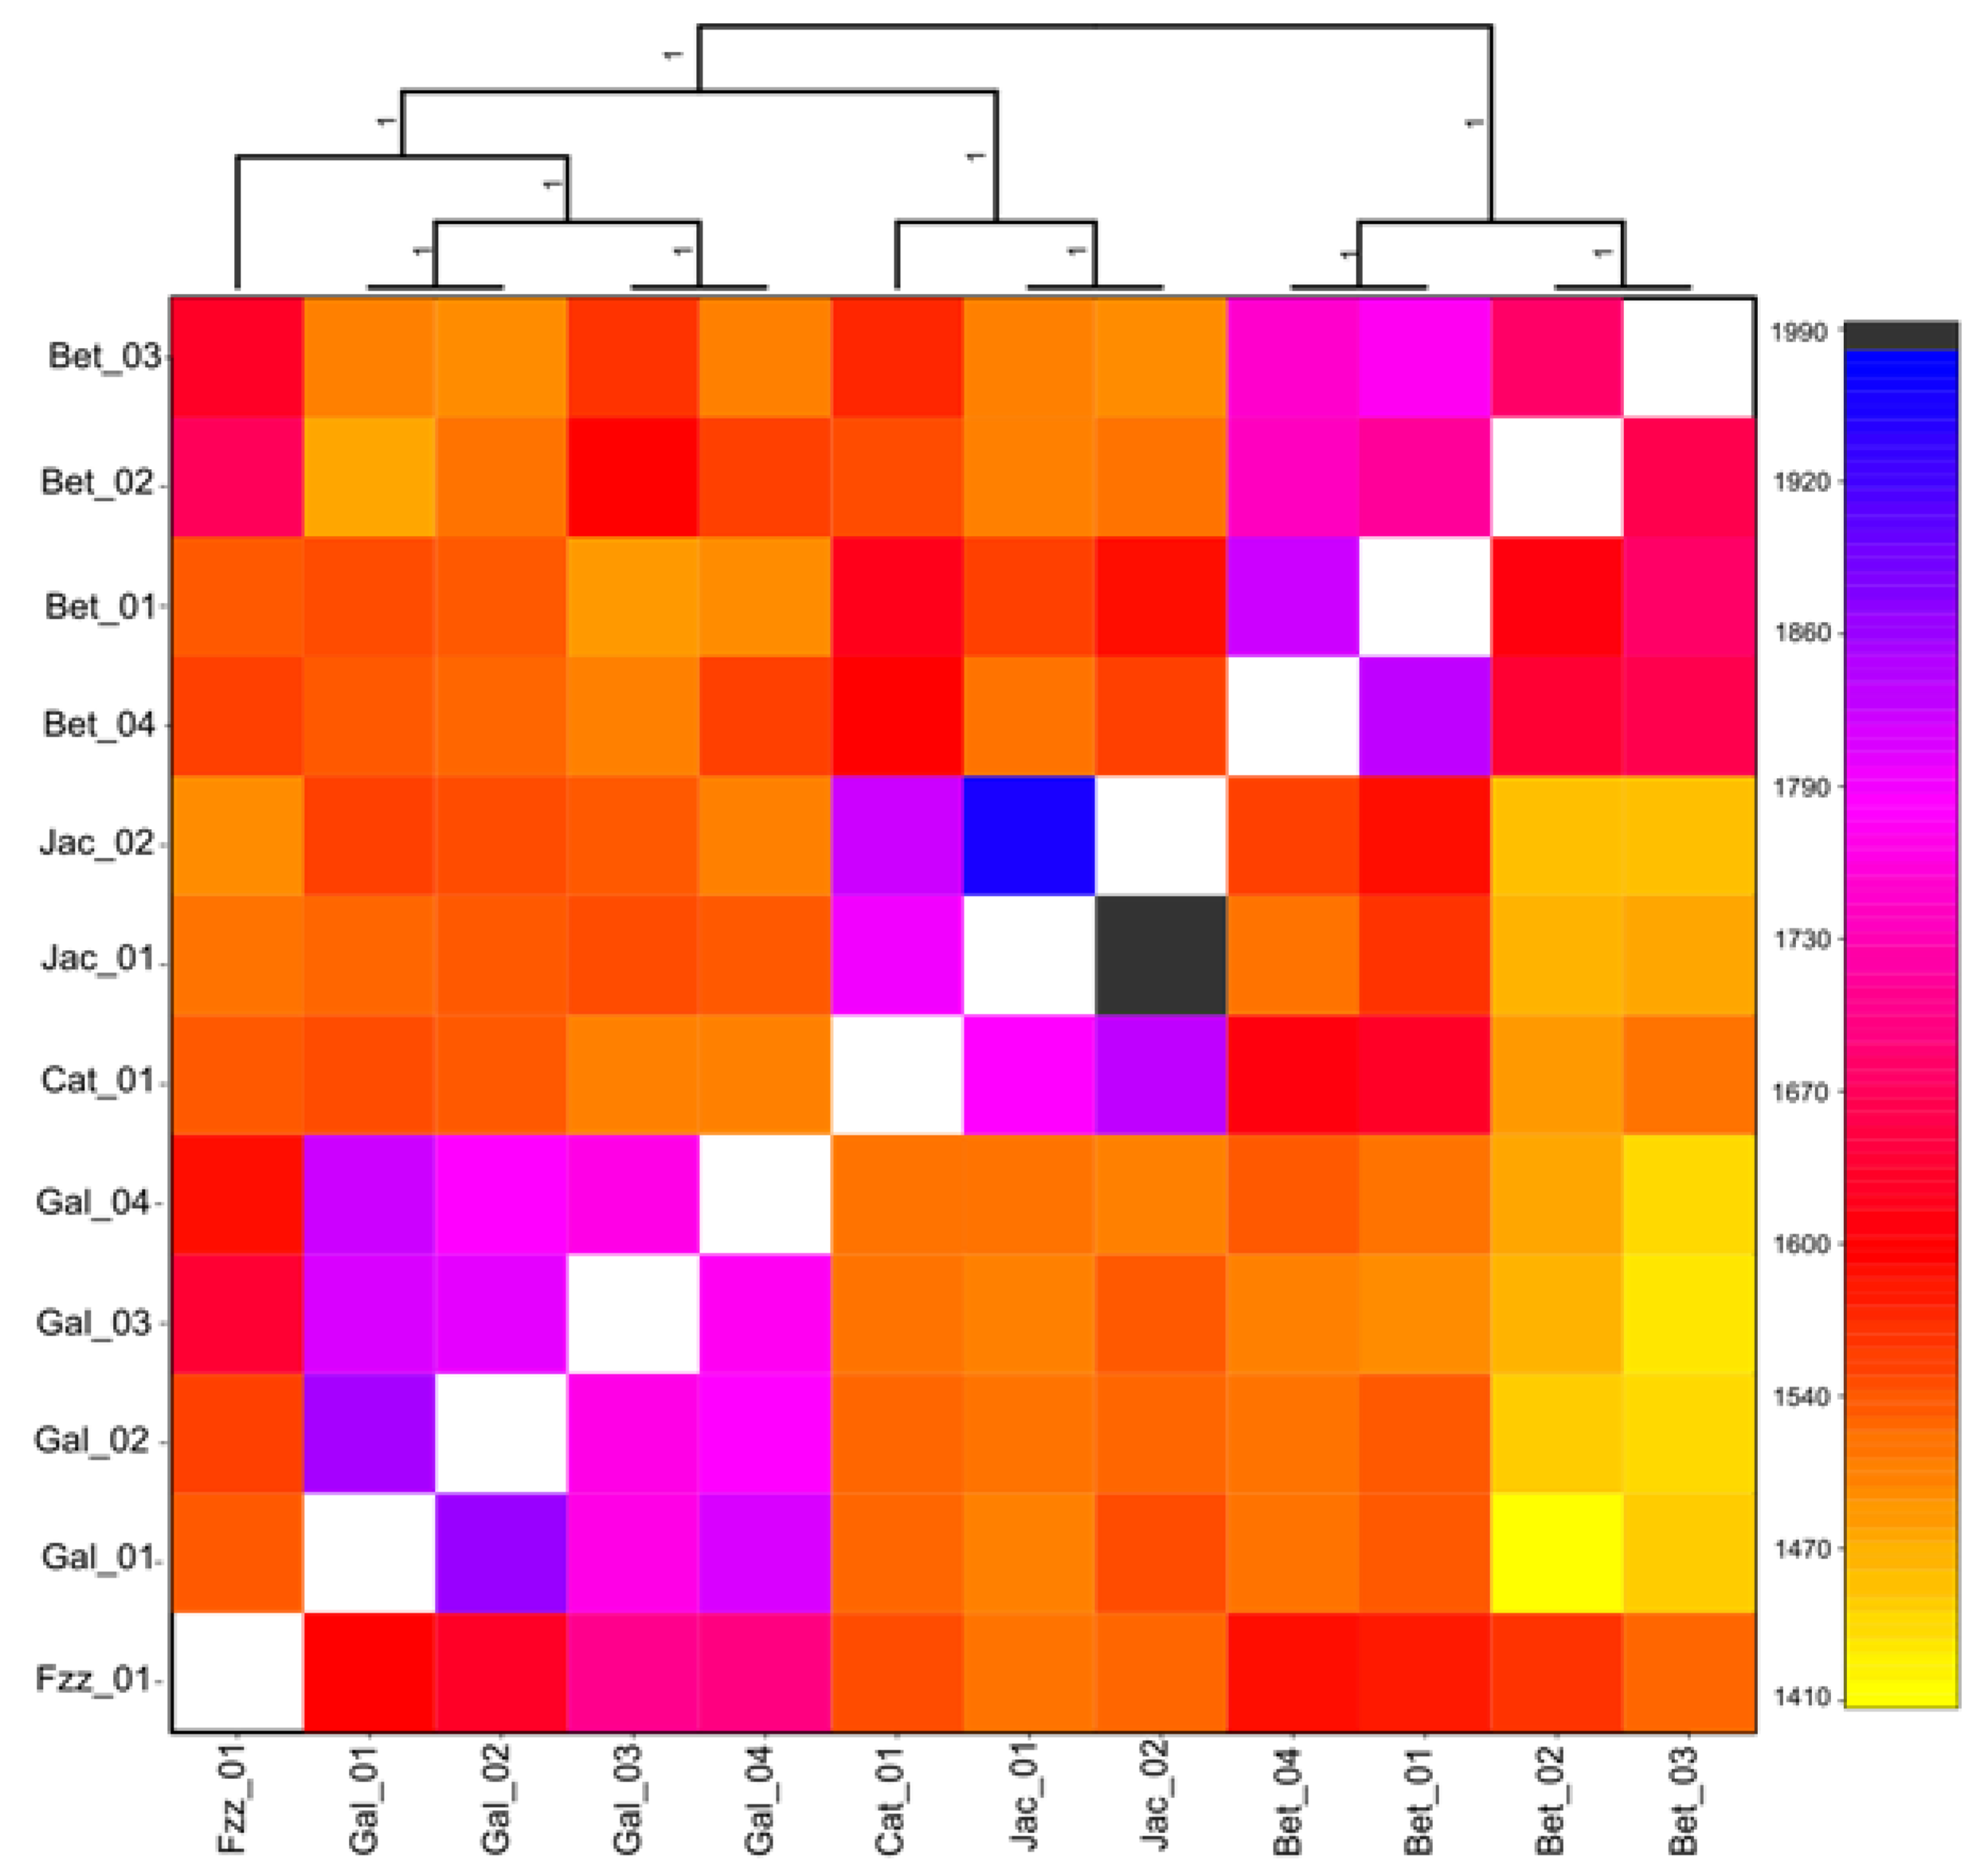
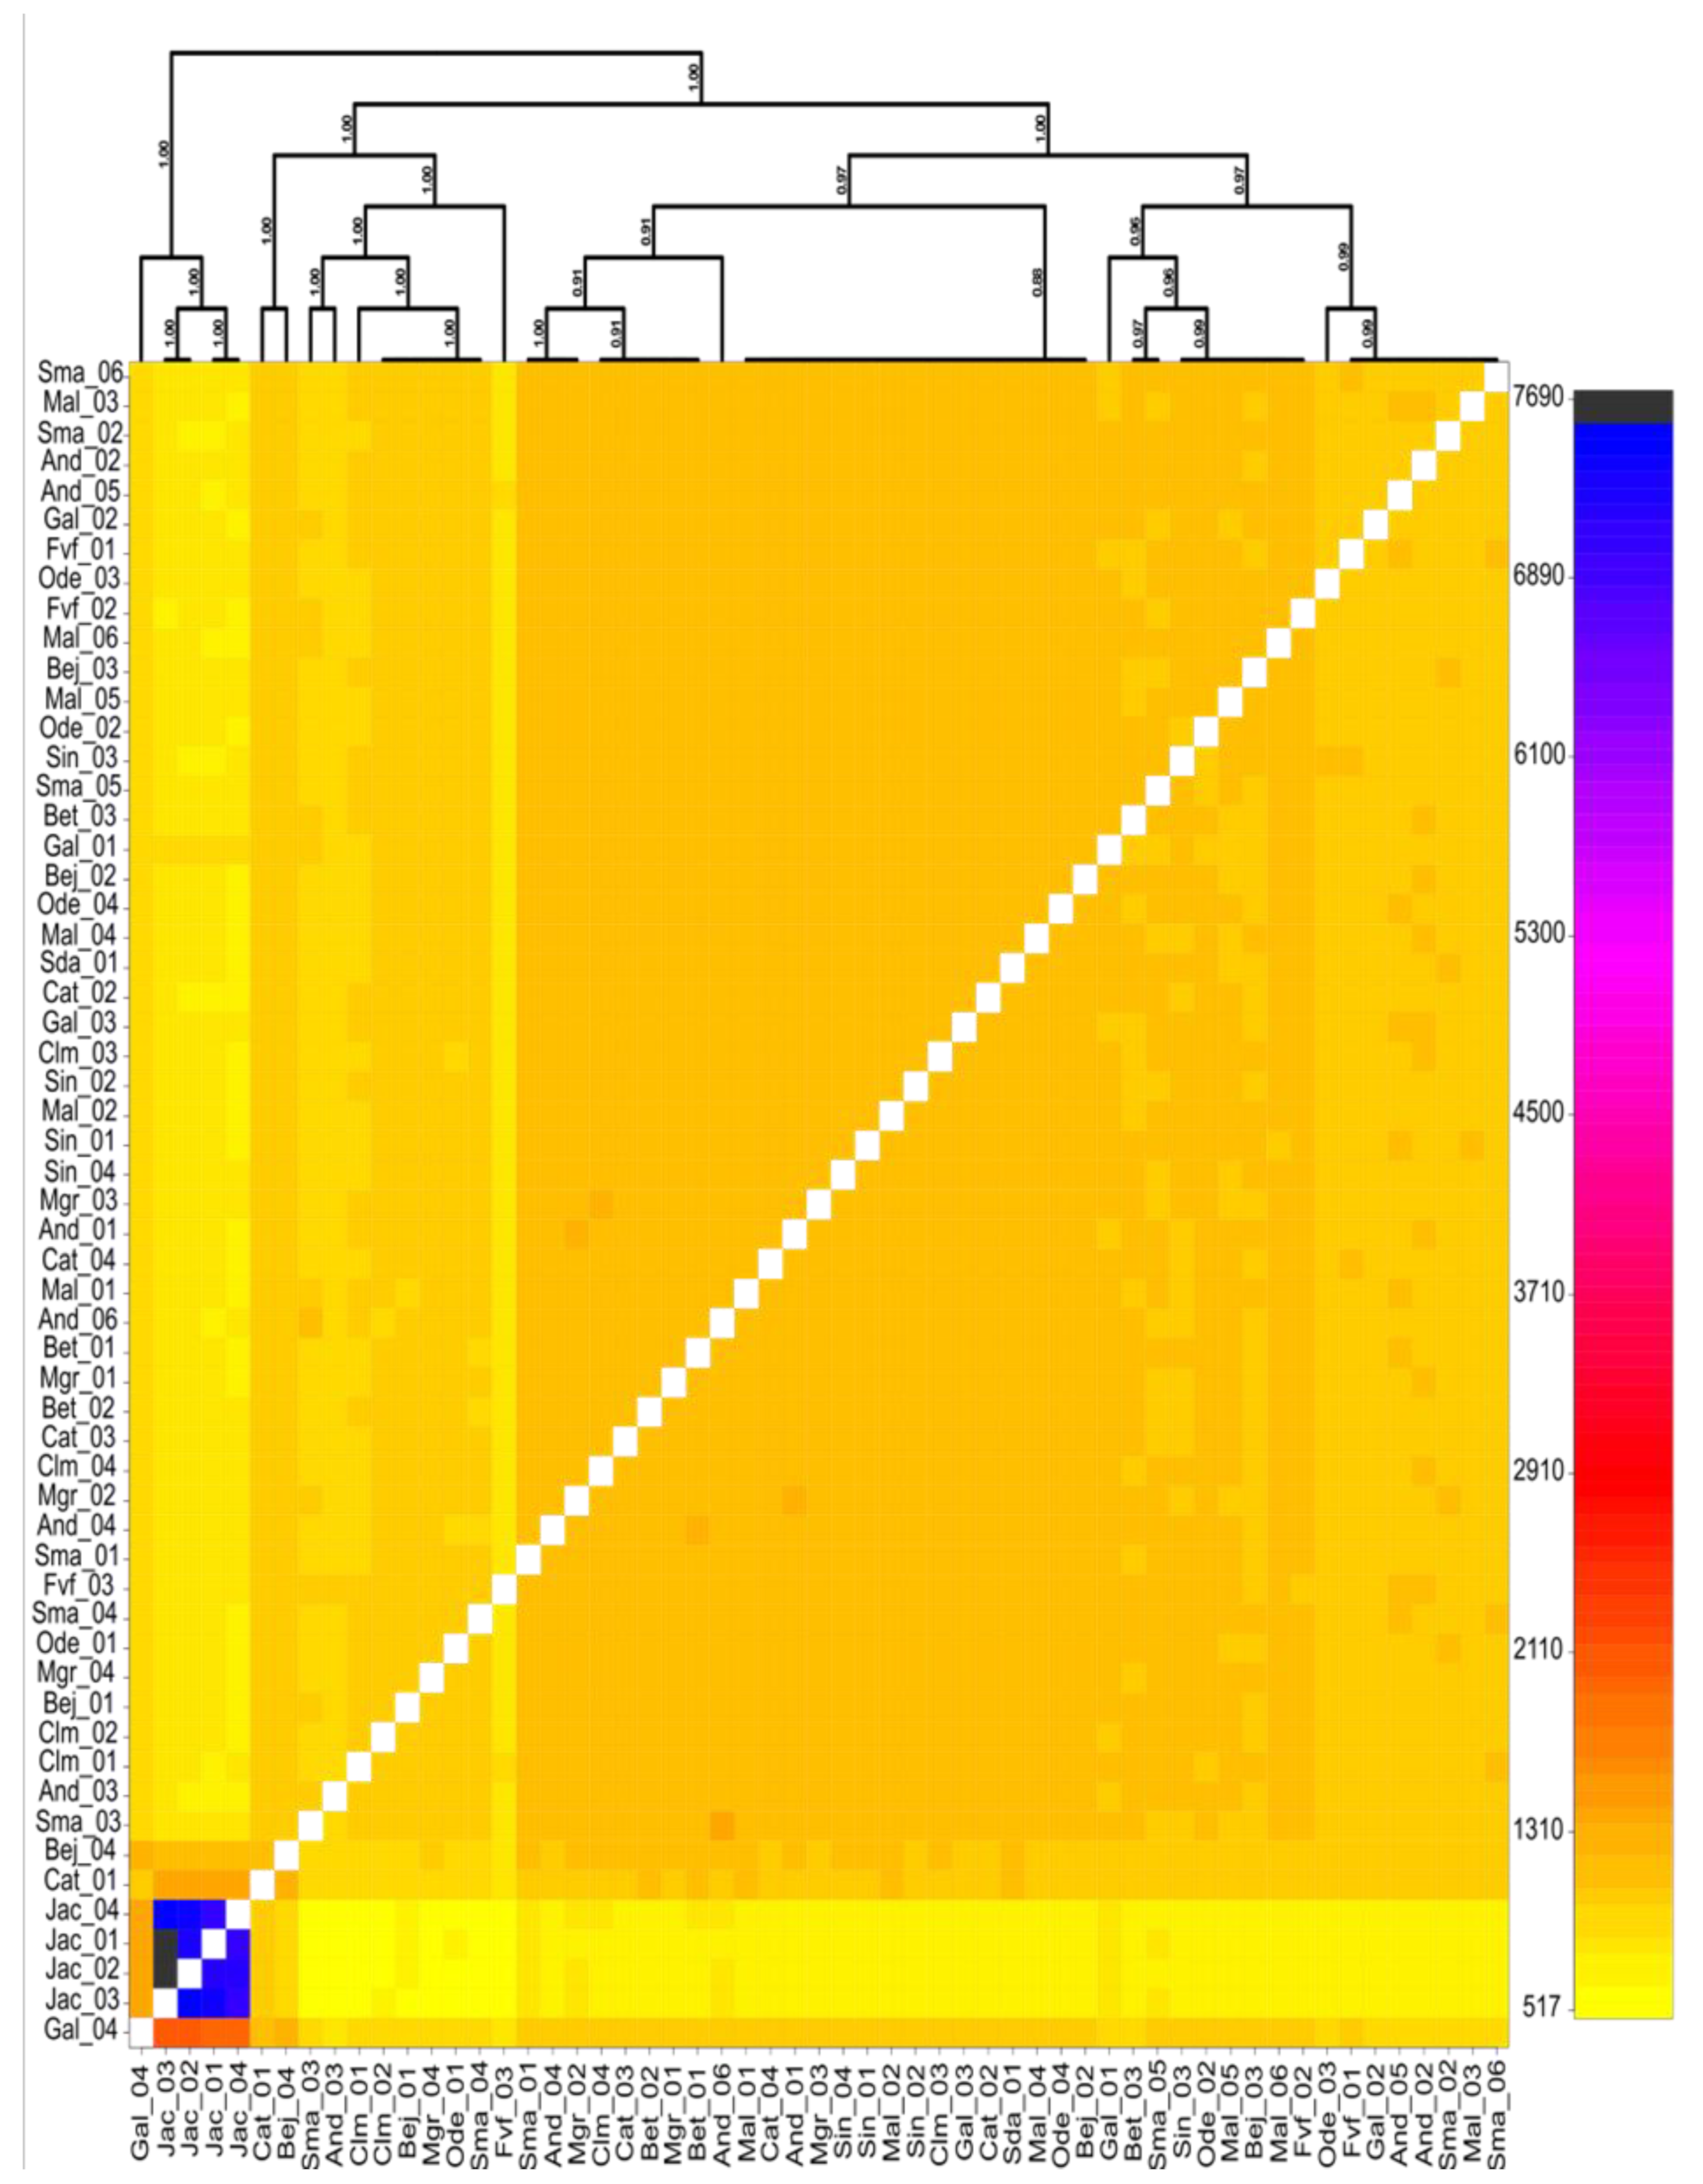
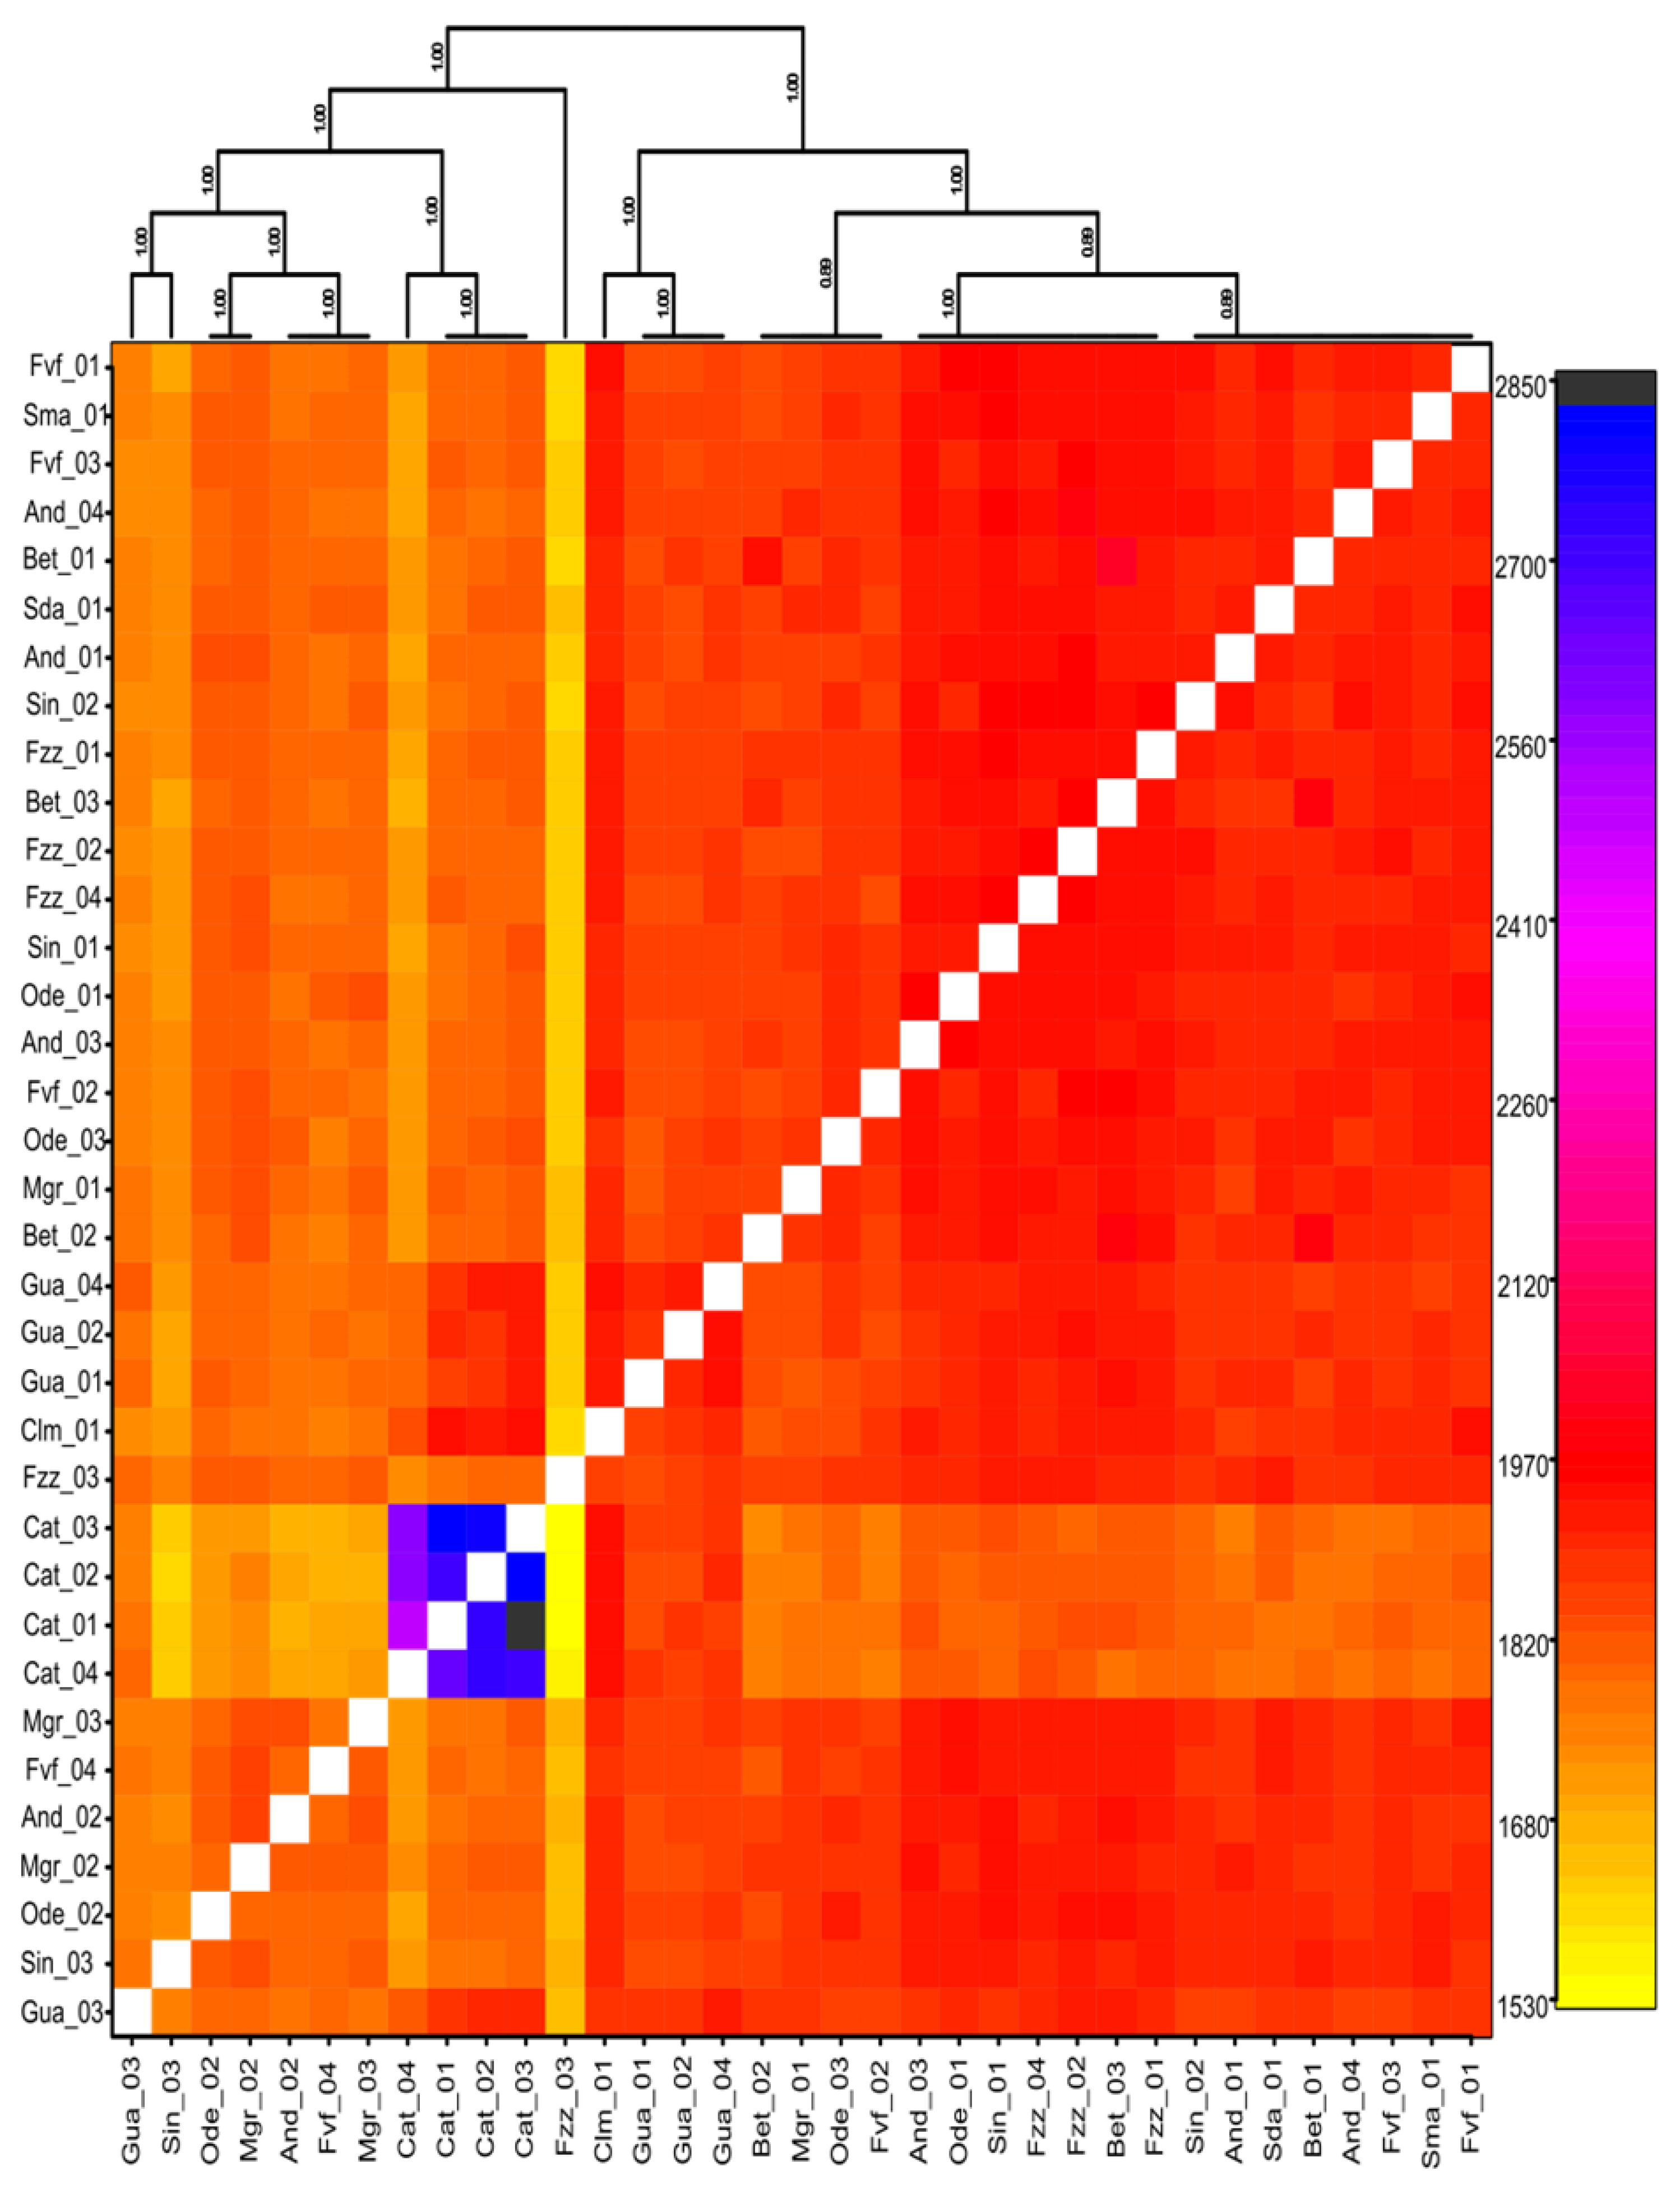
3.1. Population Structure

All three species (A. agilissima, A. flavipes and L. malachurum) showed genetic population structure inside the Iberian Peninsula (Figure 1, Figure 2, Figure 3 and Figure 4 and Figures S1–S6). For the three species, samples from the Ebro River valley or from the Pyrenees region usually formed a cluster that was different from the remaining areas of the Iberian Peninsula.
Andrena agilissima displayed a different pattern of genetic structure when compared to the other two species. The three methods used for inferring population structure (i.e., FineRADstructure, ALstructure and PCA) showed clear separation in the three groups (Figure 1, Figure 2, Figures S1 and S4): (i) the West group, comprising the samples from Galicia (Gal); (ii) the Ebro river valley group, that clusters individuals from Catalonia and Jaca (Cat and Jac, respectively); and (iii) the Baetic group, formed of individuals from the Baetic mountains (Bet). Both FineRadStructure and Alstructure (with K = 4) clustered the individuals from Ferreira do Zêzere (Fzz) closer to the West group (Figure 2 and Figure S1). PCA showed less clear separation among the three principal groups (Figure S4). Interestingly, within the Baetic group, we found considerable variation, with individuals Bet_04 and Bet_01 clustered together, and Bet_02 and Bet_03 formed a second sub-cluster within the Baetic group (Figure 2). However, based on the FineRADstructure clustering, we keep it as a single cluster.
Andrena flavipes and L. malachurum showed a less complex pattern of genetic population structure. For A. flavipes, the three methods indicated the existence of two populations: Iberian and the Pyrenean (Figure 1, Figure 3, Figures S2 and S5). The Iberian population comprised 53 samples from most of our sampling sites, and the Pyrenean one comprised the four samples from Jaca (Jac) in the northeastern area of the Iberian Peninsula. Additionally, one individual from Galicia (Gal_04) was identified using the three methods as sharing genetic material with the Iberian and Pyrenean populations. Lasioglossum malachurum also showed two genetic populations within the Iberian Peninsula. The three methods grouped the 4 individuals from Catalonia (Cat, Figure 1, Figure 4, Figures S3 and S6) but separated those from the other 31 individuals. Based on these results, L. malachurum clustered into two populations: Ebro River valley (comprising the four individuals from Catalonia—Cat) and the Iberian population (comprising the 31 individuals from the remaining sampling sites) (Figure S6). However, there are some discrepancies among the three methods. ALstructure showed a possible third and fourth group in central Spain, and in the Baetic mountains, respectively (Figure S3).

3.2. Summary Statistics

Several genetic parameters (Ho, He, FIS and π) were estimated to characterize the genetic status of the three species (Table 1). The Andrena flavipes species showed the lowest values (Ho = 0.0807; He = 0.1187; π = 0.0940), while A. agilissima showed the highest values (Ho = 0.2104; He = 0.3173; π = 0.2846). Lasioglossum malachurum presented the lowest FIS value (FIS = 0.1009) compared to the two previous species (Table 1).
When the analysis was carried out between the identified populations (see previous section) the results showed that A. agilissima’s Baetic population presented the lowest Ho, and the highest FIS values of the three main species. The populations with more individuals of A. flavipes and L. malachurum (Iberia, N = 53 and 31, respectively) consistently had the highest values of all summary statistics, including FIS (Table S4).
For the differentiation statistics, the results for three species showed a similar pattern, with A. flavipes having the highest and L. malachurum the lowest values (Table S5). This pattern is again evident for the pairwise differentiation between populations of each species (Table 2 and Table S6). The exception is for the nucleotide divergence per population (dXY) (Table 2), where A. agilissima had the highest values.

4. Discussion

The current analyses show the population structures inside the Iberian Peninsula for three wild bee species. All the studied species showed remarkable geographic congruence in the population structure, with the Ebro River valley and northeastern areas (Pyrenees Mountains) hosting a different genetic cluster than the rest of Iberia (Figure 1, Figure 2, Figure 3 and Figure 4). The Ebro valley had already been identified as a putative refugia during the last glaciation event (126 ky–11 ky) for different taxa [20], including the Apis mellifera iberiensis [23]. Historical climatic stability is also likely to have played a role. Indeed, the Ebro valley is known as one of three areas to have maintained a Mediterranean-type climate during the most severe part of the Würm glaciation event (30 ky) [21]. Such events, and the mountain ranges that shield the valley (Figure 1), may have isolated populations long enough for the differentiation to occur or to increase the already existing differentiation. Another explanation, non-exclusive, could be that the populations of this differentiated cluster may be part of a larger population distributed in central Europe. This could be the case, in particular, for A. flavipes, which showed high levels of differentiation, with the edge of the two populations being near the Pyrenees mountain range. The Pyrenees mountains are known to have acted both as a refugia area during the glaciations [20] and as an area where different genetic lineages of the same species have a secondary contact zone during interglacial periods after isolation caused by Quaternary glaciations [18]. The population structure of Andrena agilissima showed an additional distinct cluster in the Baetic mountains, something shared with several other species from different taxonomic groups [20].
Other studies tackling the genetic structure and differentiation of Andrena species found that their populations did not show population structure, neither high differentiation between populations [54,55]. The lack of observed structure and low differentiation for the more northernly European species of A. fuscipes [55] and A. vaga [54], which are both oligolectic and one of which (A. vaga) has a comparable body size to A. agilissima [31] (factors than can influence the population structure pattern), may support the recurrent idea that Iberian landscape heterogeneity, and physiographic barriers, as well the Quaternary climatic oscillations [25] could promote the more complex structure pattern observed in the Iberian Peninsula. However, it is important to emphasize that the mentioned studies used microsatellites, which are known to present lower differentiation values than SNPs [56,57]. Overall, our results seem support the “refugia within refugia” hypothesis, but not in a conclusive way, a more extensive sampling inside Iberia for A. agilissima and L. malachurum species and beyond the Pyrenees for the three species could provide a conclusive insight into their population structure pattern.
A denser sampling inside Iberia for A. agilissima and L. malachurum species could provide a better resolution on the location of the refugia and consequently provide a better insight into the evolutionary history of these species.
For our second aim, we wanted to assess the role of the putative effects of diet span, body size, sociality and nesting behavior on the genetic diversity and differentiation among the identified populations of each species. We should expect a negative correlation between both body size and sociality level with the differentiation between bee populations [30]. Our results showed that L. malachurum, a smallsized social species, had the lowest differentiation values, which corroborates previous results by other authors [58]. This result seems to support the role of sociality in differentiation level, but is contradictory to the role of body size, since small-sized bees tend to have higher differentiation values than larger ones, due to body size affecting their dispersion capacity [30]. The reverse pattern seems evident in the two Andrena species, which are both larger and less social than L. malachurum but have higher levels of differentiation.
Andrena agilissima showed the highest dxy values of the three species, while showing intermediate FST values. It is known that methods of absolute differentiation measures, such as dxy, showed low power with multiple independent markers (such as SNPs) compared with relative measures of differentiation [59], which could explain this result. Accordingly, the small dataset for A. agilissima could be the cause of the high dxy value for this species in comparison with A. flavipes.
Several studies that compared genetic diversity between oligolectic vs. polylectic species have found that the former show lower genetic diversity [26,28,60] and higher differentiation [27,60]. It has been hypothesized that such a decrease in genetic diversity may be caused by a lower effective population size and greater population isolation, caused by lower abundance of host plants [26,28,60,61]. However, this hypothesis lacks empirical validation, and in Mediterranean areas, certain plant species or botanical families used by oligolectic species can be hyper-abundant, such as Brassicaceae, the sole pollen source for A. agilissima.
Our results showed the exact opposite pattern, with the oligolectic A. agilissima having lower differentiation values (Table 2, Tables S5 and S6) and higher genetic diversity (Table 1 and Table S4) than the polylectic A. flavipes, which is the species with lower levels of genetic diversity and higher differentiation in all used statistics (except dxy). Since A. agilissima’s host plant is a widely distributed and abundant family (Brassicaceae), it may not suffer a decrease in its genetic diversity. The abundance of host plants can suggest a possible explanation for A. agilissima’s high genetic diversity, but does not explain the lower genetic diversity of A. flavipes. The highest abundance of host plant was the factor proposed to explain the highest genetic diversity of Melitta leporina (foraging on Fabaceae) compared to the two sister species [28].
The high level of He for A. agilissima may also be partially caused by the formula employed under the poppr R package [49] for He calculus, which, according to the authors, tends to inflate the value when rare alleles are present in small datasets. However, the Ho is also high, suggesting that these results may have some biological meaning, which could be confirmed with additional sampling.
The low FIS values for L. malachurum and higher values for the two Andrena species could be explained by the sex-biased dispersion of the former. Lasioglossum malachurum males prefer to mate with females outside their natal nest [62]. Additionally, L. malachurum’s queens are known to mate with more than one male [63]. The communal nesting behavior displayed by some species of Andrena could lead them to mate with geographically close individuals, with the mating sometimes occurring even before the female’s emergence from the nest [64], increasing inbreeding [65]. This is known to be the case for A. agilissima [33]. A high level of inbreeding was also reported for A. vaga [54], A. scotica/A. jacobi [65] and, to lesser extent, A. fuscipes [55]. From the previous examples, only A. fuscipes does not have a communal nesting strategy [55]. Lasioglossum malachurum is also known for cases of worker reproduction [63,65], the existence of alien workers in nests [64,66,67] and multiple-queen mating [66,67].
We did not try to detect signatures of natural selection in these datasets. Consequently, some of our results on population structure and summary statistics could be marginally affected by the confounding factors of selection and neutral variation. Moreover, we recognize that using reference genomes for the SNPs calling process will improve the quality of the dataset. However, we also recognize that both mentioned limitations have a minor effect on the overall results of population structure and summary statistics. Our results were obtained from the integration of thousands of SNPs and were only marginally affected by the small number of SNPs that were identified using the selection detection methods or by the relatively small increment in SNPs that resulted from the use of reference genomes.
Overall, this set of results highlights the combined role of past climatic changes and life-history traits in shaping the current patterns of genetic variability within the Iberian Peninsula. The Quaternary climatic oscillations have consequences for the levels of population isolation and for past demographic events. These cycles can cause range shifts and can alternate between range contraction, with concomitant population size reduction and isolations, and range expansion, population augmentation and admixing of the previous isolated genetic lineages. These climatic cycles cause demographic cycles, and in Iberia, with its complex physiography, could generate multiple lineages in multiple refugia. This “refugia within refugia” hypothesis [20] that our results seem to, once again, support, emphasizes the importance of certain areas of Iberia as a biodiversity hotspot. Moreover, to some still unknown extent, the eco-evolutionary response to these past demographic cycles is constrained by the specific combinations of life-history traits of each species, which only further research with a wide range of species can fully elucidate.

5. Conclusions

Our results provide the first Iberian-scale wild bee population genomic analysis with RADseq data. The identification of unequivocal population genetic structure inside the Iberian Peninsula for three species—with the additional more complex pattern of A. agilissima, the high differentiation value and low diversity of A. flavipes, and the low FIS of L. malachurum—emphasizes the role of past demography, due to Quaternary glaciations, and life-history traits in the genomic diversity and differentiation of Iberian populations.
Moreover, the congruent identification of the Ebro river valley/Pyrenees area, and, to a lesser extent, the Baetic mountains, as putative refugia during the climatic cycles for the main target species, seems to support (albeit not conclusively) the “refugia within refugia” hypothesis [20], and the consequent role of the Iberian refugia as a cradle of biodiversity. Additionally, it enables the identification of geographic areas with higher diversity and differentiated populations that are relevant for the setup of a conservation strategy for pollinators in the Iberian Peninsula.

Supplementary Materials

The following supporting information can be downloaded at: https://www.mdpi.com/article/10.3390/d15060746/s1, Table S1: Information of sampled bees; Table S2: Distribution of samples across sampling area; Table S3: Filtering SNPs; Table S4: Summary statistics by populations; Table S5: Global differentiation levels by species; Table S6: Pairwise differentiation statistics. Figure S1: Structure analysis for Andrena agilissima using ALStructure; Figure S2: Structure analysis for Andrena flavipes using ALStructure; Figure S3: Structure analysis for Lasioglossum malachurum using ALStructure; Figure S4: Principal components analysis of Andrena agilissima; Figure S5: Principal components analysis of Andrena flavipes; Figure S6: Principal components analysis of Lasioglossum malachurum.

Author Contributions

O.S.P., L.G.C., D.M. and G.S. participated in the conceptualization of the work. P.d.S., A.H., T.J.W. and O.S.P. collected the samples. A.H. and P.d.S. conducted the laboratory work and prepared the genomic data. P.d.S., A.H., S.E.S. and O.S.P. performed the data analysis. All authors have read and agreed to the published version of the manuscript.

Funding

This work was supported by the Project ‘Effect of Eutrophication and Climate on Pollinators and ecosystem service provision’ (EUCLIPO), co-funded by national funds through Fundação para a Ciência e Tecnologia (FCT), Portugal (PTDC/BIA-ECO/28360/2017), and by EU ERDF funds within the Portugal 2020 Partnership Agreement and Programa Operacional Regional Lisboa. DM and TJW were partly supported by the FNRS/FWO joint program “EOS—Excellence of Science” for the project “CliPS: Climate change and its effects on Pollination Services (project 30947854)”.

Institutional Review Board Statement

Not applicable.

Data Availability Statement

The custom R functions and datasets used to support our analyses are available at https://github.com/ospfsg/PollinatorsDiversity (accessed on 30 May 2023).

Conflicts of Interest

The authors declare no conflict of interest.

References

  1. Cardoso, P.; Barton, P.S.; Birkhofer, K.; Chichorro, F.; Deacon, C.; Fartmann, T.; Fukushima, C.S.; Gaigher, R.; Habel, J.C.; Hallmann, C.A.; et al. Scientists’ Warning to Humanity on Insect Extinctions. Biol. Conserv. 2020, 242, 108426. [Google Scholar] [CrossRef]
  2. Potts, S.G.; Biesmeijer, J.C.; Kremen, C.; Neumann, P.; Schweiger, O.; Kunin, W.E. Global Pollinator Declines: Trends, Impacts and Drivers. Trends Ecol. Evol. 2010, 25, 345–353. [Google Scholar] [CrossRef]
  3. Ollerton, J.; Winfree, R.; Tarrant, S. How Many Flowering Plants Are Pollinated by Animals? Oikos 2011, 120, 321–326. [Google Scholar] [CrossRef]
  4. Bates, A.J.; Sadler, J.P.; Fairbrass, A.J.; Falk, S.J.; Hale, J.D.; Matthews, T.J. Changing Bee and Hoverfly Pollinator Assemblages along an Urban-Rural Gradient. PLoS ONE 2011, 6, e23459. [Google Scholar] [CrossRef] [PubMed]
  5. Winfree, R.; Bartomeus, I.; Cariveau, D.P. Native Pollinators in Anthropogenic Habitats. Annu. Rev. Ecol. Evol. Syst. 2011, 42, 1–22. [Google Scholar] [CrossRef] [Green Version]
  6. Nieto, A.; Roberts, S.P.M.; Kemp, J.; Rasmont, P.; Kuhlmann, M.; García Criado, M.; Biesmeijer, J.C.; Bogusch, P.; Dathe, H.H.; De la Rúa, P.; et al. European Red List of Bees; Publication Office of the European Union: Luxembourg, 2014; ISBN 9789279445125. [Google Scholar]
  7. Danforth, B.N.; Cardinal, S.; Praz, C.; Almeida, E.A.B.; Michez, D. The Impact of Molecular Data on Our Understanding of Bee Phylogeny and Evolution. Annu. Rev. Entomol. 2013, 58, 57–78. [Google Scholar] [CrossRef] [Green Version]
  8. Geldmann, J.; González-Varo, J.P. Conserving Honey Bees Does Not Help Wildlife. Science 2018, 359, 392–393. [Google Scholar] [CrossRef]
  9. Wood, T.J.; Michez, D.; Paxton, R.J.; Drossart, M.; Neumann, P.; Gérard, M.; Vanderplanck, M.; Barraud, A.; Martinet, B.; Leclercq, N.; et al. Managed Honey Bees as a Radar for Wild Bee Decline? Apidologie 2020, 51, 1100–1116. [Google Scholar] [CrossRef]
  10. López-Uribe, M.M.; Ricigliano, V.A.; Simone-Finstrom, M. Defining Pollinator Health: A Holistic Approach Based on Ecological, Genetic, and Physiological Factors. Annu. Rev. Anim. Biosci. 2020, 8, 269–294. [Google Scholar] [CrossRef] [Green Version]
  11. Pauls, S.U.; Nowak, C.; Balint, M.; Pfenninger, M. The Impact of Global Climate Change on Genetic Diversity within Populations and Species. Mol. Ecol. 2013, 22, 925–946. [Google Scholar] [CrossRef]
  12. Maebe, K.; Karise, R.; Meeus, I.; Mänd, M.; Smagghe, G. Pattern of Population Structuring between Belgian and Estonian Bumblebees. Sci. Rep. 2019, 9, 9651. [Google Scholar] [CrossRef] [Green Version]
  13. Maebe, K.; Meeus, I.; Ganne, M.; De Meulemeester, T.; Biesmeijer, K.; Smagghe, G. Microsatellite Analysis of Museum Specimens Reveals Historical Differences in Genetic Diversity between Declining and More Stable Bombus Species. PLoS ONE 2015, 10, e0127870. [Google Scholar] [CrossRef] [Green Version]
  14. Maebe, K.; Meeus, I.; Vray, S.; Claeys, T.; Dekoninck, W.; Boevé, J.L.; Rasmont, P.; Smagghe, G. A Century of Temporal Stability of Genetic Diversity in Wild Bumblebees. Sci. Rep. 2016, 6, 38289. [Google Scholar] [CrossRef] [Green Version]
  15. Dreier, S.; Redhead, J.W.; Warren, I.A.; Bourke, A.F.G.; Heard, M.S.; Jordan, W.C.; Sumner, S.; Wang, J.; Carvell, C. Fine-Scale Spatial Genetic Structure of Common and Declining Bumble Bees across an Agricultural Landscape. Mol. Ecol. 2014, 23, 3384–3395. [Google Scholar] [CrossRef] [Green Version]
  16. Lozier, J.D. Revisiting Comparisons of Genetic Diversity in Stable and Declining Species: Assessing Genome-Wide Polymorphism in North American Bumble Bees Using RAD Sequencing. Mol. Ecol. 2014, 23, 788–801. [Google Scholar] [CrossRef]
  17. Orr, M.C.; Hughes, A.C.; Chesters, D.; Pickering, J.; Zhu, C.D.; Ascher, J.S. Global Patterns and Drivers of Bee Distribution. Curr. Biol. 2021, 31, 451–458.e4. [Google Scholar] [CrossRef]
  18. Taberlet, P.; Fumagalli, L.; Wust-Saucy, A.G.; Cosson, J.F. Comparative Phylogeography and Postglacial Colonization Routes in Europe. Mol. Ecol. 1998, 7, 453–464. [Google Scholar] [CrossRef] [Green Version]
  19. Hewitt, G. The Genetic Legacy of the Quaternary Ice Ages. Nature 2000, 405, 907–913. [Google Scholar] [CrossRef]
  20. Gómez, A.; Lunt, D.H. Refugia within Refugia: Patterns of Phylogeographic Concordance in the Iberian Peninsula. In Phylogeography of Southern European Refugia; Weiss, S., Ferrand, N., Eds.; Springer: Berlin/Heidelberg, Germany, 2007; pp. 155–188. ISBN 9781402049033. [Google Scholar]
  21. Blondel, J.; Aronson, J.; Bodiou, J.-Y.; Boeuf, G. The Mediterranean Region Biological Diversity in Space and Time, 2nd ed.; Oxford University Press: Oxford, UK, 2010. [Google Scholar]
  22. Miraldo, A.; Hewitt, G.M.; Paulo, O.S.; Emerson, B.C. Phylogeography and Demographic History of Lacerta Lepida in the Iberian Peninsula: Multiple Refugia, Range Expansions and Secondary Contact Zones. BMC Evol. Biol. 2011, 11, 170. [Google Scholar] [CrossRef] [Green Version]
  23. Chávez-Galarza, J.; Henriques, D.; Johnston, J.S.; Carneiro, M.; Rufino, J.; Patton, J.C.; Pinto, M.A. Revisiting the Iberian Honey Bee (Apis mellifera iberiensis) Contact Zone: Maternal and Genome-Wide Nuclear Variations Provide Support for Secondary Contact from Historical Refugia. Mol. Ecol. 2015, 24, 2973–2992. [Google Scholar] [CrossRef]
  24. Silva, S.E.; Seabra, S.G.; Carvalheiro, L.G.; Nunes, V.L.; Marabuto, E.; Mendes, R.; Rodrigues, A.S.B.; Pina-Martins, F.; Yurtsever, S.; Laurentino, T.G.; et al. Population Genomics of Bombus Terrestris Reveals High but Unstructured Genetic Diversity in a Potential Glacial Refugium. Biol. J. Linn. Soc. 2020, 129, 259–272. [Google Scholar] [CrossRef]
  25. Hewitt, G.M. Some Genetic Consequences of Ice Ages, and Their Role, in Divergence and Speciation. Biol. J. Linn. Soc. 1996, 58, 247–276. [Google Scholar] [CrossRef]
  26. Packer, L.; Zayed, A.; Grixti, J.C.; Ruz, L.; Owen, R.E.; Vivallo, F.; Toro, H. Conservation Genetics of Potentially Endangered Mutualisms: Reduced Levels of Genetic Variation in Specialist versus Generalist Bees. Conserv. Biol. 2005, 19, 195–202. [Google Scholar] [CrossRef]
  27. Dellicour, S.; Michez, D.; Mardulyn, P. Comparative Phylogeography of Five Bumblebees: Impact of Range Fragmentation, Range Size and Diet Specialization. Biol. J. Linn. Soc. 2015, 116, 926–939. [Google Scholar] [CrossRef] [Green Version]
  28. Dellicour, S.; Michez, D.; Rasplus, J.-Y.; Mardulyn, P. Impact of Past Climatic Changes and Resource Availability on the Population Demography of Three Food-Specialist Bees. Mol. Ecol. 2015, 24, 1074–1090. [Google Scholar] [CrossRef]
  29. Lepais, O.; Darvill, B.; O’Connor, S.; Osborne, J.L.; Sanderson, R.A.; Cussans, J.; Goffe, L.; Goulson, D. Estimation of Bumblebee Queen Dispersal Distances Using Sibship Reconstruction Method. Mol. Ecol. 2010, 19, 819–831. [Google Scholar] [CrossRef]
  30. López-Uribe, M.M.; Jha, S.; Soro, A. A Trait-Based Approach to Predict Population Genetic Structure in Bees. Mol. Ecol. 2019, 28, 1–11. [Google Scholar] [CrossRef]
  31. Falk, S.J. Field Guide to the Bees of Great Britain and Ireland; Bloomsbury Publishing: London, UK, 2015; Volume 14, ISBN 9781472967053. [Google Scholar]
  32. Güler, Y.; Sorkun, K. Analysis of Pollen Collected by Andrena flavipes Panzer (Hymenoptera: Andrenidae) in Sweet Cherry Orchards, Afyonkarahisar Province of Turkey. Psyche 2010, 2010, 160789. [Google Scholar] [CrossRef] [Green Version]
  33. Paxton, R.J.; Giovanetti, M.; Andrietti, F.; Scamoni, E.; Scanni, B. Mating in a Communal Bee, Andrena agilissima (Hymenoptera Andrenidae). Ethol. Ecol. Evol. 1999, 11, 371–382. [Google Scholar] [CrossRef]
  34. Polidori, C.; Rubichi, A.; Barbieri, V.; Trombino, L.; Donegana, M. Floral Resources and Nesting Requirements of the Ground-Nesting Social Bee, Lasioglossum malachurum (Hymenoptera: Halictidae), in a Mediterranean Semiagricultural Landscape. Psyche 2010, 2010, 851947. [Google Scholar] [CrossRef] [Green Version]
  35. Hajibabaei, M.; Janzen, D.H.; Burns, J.M.; Hallwachs, W.; Hebert, P.D.N. DNA Barcodes Distinguish Species of Tropical Lepidoptera. Proc. Natl. Acad. Sci. USA 2006, 103, 968–971. [Google Scholar] [CrossRef] [Green Version]
  36. Folmer, O.; Black, M.; Hoeh, W.; Lutz, R.; Vrijenhoek, R. DNA Primers for Amplification of Mitochondrial Cytochrome c Oxidase Subunit I from Diverse Metazoan Invertebrates. Mol. Mar. Biol. Biotechnol. 1994, 3, 294–299. [Google Scholar]
  37. Sequencher®, Version 5.4.6; DNA Sequence Analysis Software; Gene Codes Corporation: Ann Arbor, MI, USA, 2016.
  38. Larsson, A. AliView: A Fast and Lightweight Alignment Viewer and Editor for Large Datasets. Bioinformatics 2014, 30, 3276–3278. [Google Scholar] [CrossRef] [Green Version]
  39. Chen, S.; Zhou, Y.; Chen, Y.; Gu, J. Fastp: An Ultra-Fast All-in-One FASTQ Preprocessor. Bioinformatics 2018, 34, i884–i890. [Google Scholar] [CrossRef]
  40. Rochette, N.C.; Rivera-Colón, A.G.; Catchen, J.M. Stacks 2: Analytical Methods for Paired-end Sequencing Improve RADseq-based Population Genomics. Mol. Ecol. 2019, 28, 4737–4754. [Google Scholar] [CrossRef]
  41. Danecek, P.; Auton, A.; Abecasis, G.; Albers, C.A.; Banks, E.; DePristo, M.A.; Handsaker, R.E.; Lunter, G.; Marth, G.T.; Sherry, S.T.; et al. The Variant Call Format and VCFtools. Bioinformatics 2011, 27, 2156–2158. [Google Scholar] [CrossRef] [Green Version]
  42. Lischer, H.E.L.; Excoffier, L. PGDSpider: An Automated Data Conversion Tool for Connecting Population Genetics and Genomics Programs. Bioinformatics 2012, 28, 298–299. [Google Scholar] [CrossRef] [Green Version]
  43. Cabreros, I.; Storey, J.D. A Likelihood-Free Estimator of Population Structure Bridging Admixture Models and Principal Components Analysis. Genetics 2019, 212, 1009–1029. [Google Scholar] [CrossRef] [Green Version]
  44. Pina-Martins, F.; Silva, D.N.; Fino, J.; Paulo, O.S. Structure_threader: An Improved Method for Automation and Parallelization of Programs Structure, FastStructure and MavericK on Multicore CPU Systems. Mol. Ecol. Resour. 2017, 17, e268–e274. [Google Scholar] [CrossRef]
  45. Jombart, T. Adegenet: A R Package for the Multivariate Analysis of Genetic Markers. Bioinformatics 2008, 24, 1403–1405. [Google Scholar] [CrossRef] [Green Version]
  46. R Core Team R: A Language and Environment for Statistical Computing. R Foundation for Statistical Computing, Vienna, Austria. Available online: https://www.r-project.org (accessed on 26 March 2020).
  47. Malinsky, M.; Trucchi, E.; Lawson, D.J.; Falush, D. RADpainter and FineRADstructure: Population Inference from RADseq Data. Mol. Biol. Evol. 2018, 35, 1284–1290. [Google Scholar] [CrossRef] [PubMed] [Green Version]
  48. Goudet, J. HIERFSTAT, a Package for R to Compute and Test Hierarchical F-Statistics. Mol. Ecol. Notes 2005, 5, 184–186. [Google Scholar] [CrossRef] [Green Version]
  49. Kamvar, Z.N.; Tabima, J.F.; Grunwald, N.J. Poppr: An R Package for Genetic Analysis of Populations with Clonal, Partially Clonal, and/or Sexual Reproduction. PeerJ 2014, 2, e281. [Google Scholar] [CrossRef] [PubMed] [Green Version]
  50. Hedrick, P.W. A Standardized Genetic Differentiation Measure. Evolution 2005, 59, 1633–1638. [Google Scholar] [PubMed]
  51. Jost, L. GST and Its Relatives Do Not Measure Differentiation. Mol. Ecol. 2008, 17, 4015–4026. [Google Scholar] [CrossRef]
  52. Winter, D.J. Mmod: An R Library for the Calculation of Population Differentiation Statistics. Mol. Ecol. Resour. 2012, 12, 1158–1160. [Google Scholar] [CrossRef]
  53. Korunes, K.L.; Samuk, K. Pixy: Unbiased Estimation of Nucleotide Diversity and Divergence in the Presence of Missing Data. Mol. Ecol. Resour. 2021, 21, 1359–1368. [Google Scholar] [CrossRef]
  54. Exeler, N.; Kratochwil, A.; Hochkirch, A. Strong Genetic Exchange among Populations of a Specialist Bee, Andrena vaga (Hymenoptera: Andrenidae). Conserv. Genet. 2008, 9, 1233–1241. [Google Scholar] [CrossRef]
  55. Exeler, N.; Kratochwil, A.; Hochkirch, A. Does Recent Habitat Fragmentation Affect the Population Genetics of a Heathland Specialist, Andrena fuscipes (Hymenoptera: Andrenidae)? Conserv. Genet. 2010, 11, 1679–1687. [Google Scholar] [CrossRef]
  56. Jakobsson, M.; Edge, M.D.; Rosenberg, N.A. The Relationship Between FST and the Frequency of the Most Frequent Allele. Genetics 2013, 193, 515–528. [Google Scholar] [CrossRef] [Green Version]
  57. Meirmans, P.G.; Hedrick, P.W. Assessing Population Structure: FST and Related Measures. Mol. Ecol. Resour. 2011, 11, 5–18. [Google Scholar] [CrossRef]
  58. Friedel, A.; Paxton, R.J.; Soro, A. Spatial Patterns of Relatedness within Nesting Aggregations of the Primitively Eusocial Sweat Bee Lasioglossum malachurum. Insectes Soc. 2017, 64, 465–475. [Google Scholar] [CrossRef]
  59. Cruickshank, T.E.; Hahn, M.W. Reanalysis Suggests That Genomic Islands of Speciation Are Due to Reduced Diversity, Not Reduced Gene Flow. Mol. Ecol. 2014, 23, 3133–3157. [Google Scholar] [CrossRef] [Green Version]
  60. Zayed, A.; Packer, L. The Population Genetics of a Solitary Oligolectic Sweat Bee, Lasioglossum (Sphecodogastra) Oenotherae (Hymenoptera: Halictidae). Heredity 2007, 99, 397–405. [Google Scholar] [CrossRef]
  61. Su, T.; He, B.; Zhao, F.; Jiang, K.; Lin, G.; Huang, Z. Population Genomics and Phylogeography of Colletes Gigas, a Wild Bee Specialized on Winter Flowering Plants. Ecol. Evol. 2022, 12, e8863. [Google Scholar] [CrossRef]
  62. Smith, B.H.; Ayasse, M. Kin-Based Male Mating Preferences in Two Species of Halictine Bee. Behav. Ecol. Sociobiol. 1987, 20, 313–318. [Google Scholar] [CrossRef]
  63. Paxton, R.J.; Ayasse, M.; Field, J.; Soro, A. Complex Sociogenetic Organization and Reproductive Skew in a Primitively Eusocial Sweat Bee, Lasioglossum malachurum, as Revealed by Microsatellites. Mol. Ecol. 2002, 11, 2405–2416. [Google Scholar] [CrossRef]
  64. Paxton, R.J. Male Mating Behaviour and Mating Systems of Bees: An Overview. Apidologie 2005, 36, 145–156. [Google Scholar] [CrossRef]
  65. Paxton, R.J.; Thorén, P.A.; Tengö, J.; Estoup, A.; Pamilo, P. Mating Structure and Nestmate Relatedness in a Communal Bee, Andrena jacobi (Hymenoptera, Andrenidae), Using Microsatellites. Mol. Ecol. 1996, 5, 511–519. [Google Scholar] [CrossRef]
  66. Richards, M.H.; French, D.; Paxton, R.J. It’s Good to Be Queen: Classically Eusocial Colony Structure and Low Worker Fitness in an Obligately Social Sweat Bee. Mol. Ecol. 2005, 14, 4123–4133. [Google Scholar] [CrossRef]
  67. Soro, A.; Ayasse, M.; Zobel, M.U.; Paxton, R.J. Complex Sociogenetic Organization and the Origin of Unrelated Workers in a Eusocial Sweat Bee, Lasioglossum malachurum. Insectes Soc. 2009, 56, 55–63. [Google Scholar] [CrossRef]
Figure 1. Study area with sampling sites (Table S1) for A. agilissima (circles), A. flavipes (triangles) and L. malachurum (squares). Colors of the symbols identify the genetic clusters (see Results). Grey areas represent mountains with an altitude above 700 m. Sampling sites are Sintra (Sin), Aire e Candeeiros mountain (Sda), Marinha Grande (Mgr), Ferreira do Zêzere (Fzz), Foros de Vale Figueira (Fvf), Odeceixe (Ode), São Mamede (Sma), Malcata (Mal), Gallicia (Gal), Bejar (Bej), Andalucia (And), Baetic region (Bet), Guadalajara (Gua), Castille-La-Mancha (Clm), Jaca (Jac) and Catalonia (Cat).
Diversity 15 00746 g001
Figure 2. FineRADstructure plot for Andrena agilissima with all SNPs per locus, with a total of 26,321 SNPs. On the x-axis, each sample is considered a recipient, and on the y-axis, each sample is considered a donor of genomic regions. Samples from Ferreira do Zêzere (Fzz), Gallicia (Gal), Jaca (Jac) and the Baetic region (Bet). See Figure 1 for more on geographic location of the sampling sites. Darker colors indicate a higher amount of shared genomic regions between samples. White diagonal represents absence of value (each sample versus itself).
Diversity 15 00746 g002
Figure 3. FineRADstructure plot for Andrena flavipes with all SNPs per locus, with a total of 543,914 SNPs. On the x-axis, each sample is considered a recipient, and on the y-axis, each sample is considered a donor of genomic regions. Samples from Sintra (Sin), Aire e Candeeiros mountain (Sda), Marinha Grande (Mgr), Foros de Vale Figueira (Fvf), Odeceixe (Ode), São Mamede (Sma), Malcata (Mal), Gallicia (Gal), Bejar (Bej), Andalucia (And), Baetic region (Bet), Castille-La-Mancha (Clm), Jaca (Jac) and Catalonia (Cat). See Figure 1 for more on geographic location of the sampling sites. Darker colors indicate a higher amount of shared genomic regions between samples. White diagonal represents absence of value (each sample versus itself).
Diversity 15 00746 g003
Figure 4. FineRADstructure plot for Lasioglossum malachurum with all SNPs per locus, with a total of 256,976 SNPs. On the x-axis, each sample is considered as a recipient, and on the y-axis, each sample is considered a donor of genomic regions. Samples from Sintra (Sin), Aire e Candeeiros mountain (Sda), Marinha Grande (Mgr), Ferreira do Zêzere (Fzz), Foros de Vale Figueira (Fvf), Odeceixe (Ode), São Mamede (Sma), Andalucia (And), Baetic region (Bet), Guadalajara (Gua) and Catalonia (Cat). See Figure 1 for more on geographic location of the sampling sites. Darker colors indicate a higher amount of shared genomic regions between samples. White diagonal represents absence of value (each sample versus itself).
Diversity 15 00746 g004
Table 1. Summary statistics by species: number of individuals (N); number of populations inferred by the structure analysis (Pop); observed heterozygosity (Ho); mean expected heterozygosity (He); inbreeding coefficient (FIS); and nucleotide diversity (π). For Ho, Fis and π, the average value and respective standard deviation are provided. Highest values are indicated in bold.
SpeciesNPopHoHeFISΠ
A. agilissima1230.2104 ± 0.2120.31730.3282 ± 0.5330.2846 ± 0.235
A. flavipes5720.0807 ± 0.1220.11870.2883 ± 0.4290.0940 ± 0.151
L. malachurum3520.1806 ± 0.1650.19780.1009 ± 0.3160.1936 ± 0.186
Table 2. Pairwise differentiation statistics. The lower diagonal represents the FST values under Weir and Cockrham’s formula of 1984, while the upper diagonal represents the average and standard deviation of nucleotide divergence (dXY).
A. agilissima
WestEbroBaetic
West-0.3244 ± 0.2020.3363 ± 0.180
Ebro0.1114-0.3339 ± 0.200
Baetic0.09260.0853-
A. flavipes
IberianPyrenean
Iberian-0.2362 ± 0.323
Pyrenean0.5611-
L. malachurum
EbroIberian
Ebro-0.2088 ± 0.169
Iberian0.0663-
Disclaimer/Publisher’s Note: The statements, opinions and data contained in all publications are solely those of the individual author(s) and contributor(s) and not of MDPI and/or the editor(s). MDPI and/or the editor(s) disclaim responsibility for any injury to people or property resulting from any ideas, methods, instructions or products referred to in the content.

