
22 Years of Aquatic Plant Spatiotemporal Dynamics in the Upper Mississippi River


Abstract
:1. Introduction
2. Methods
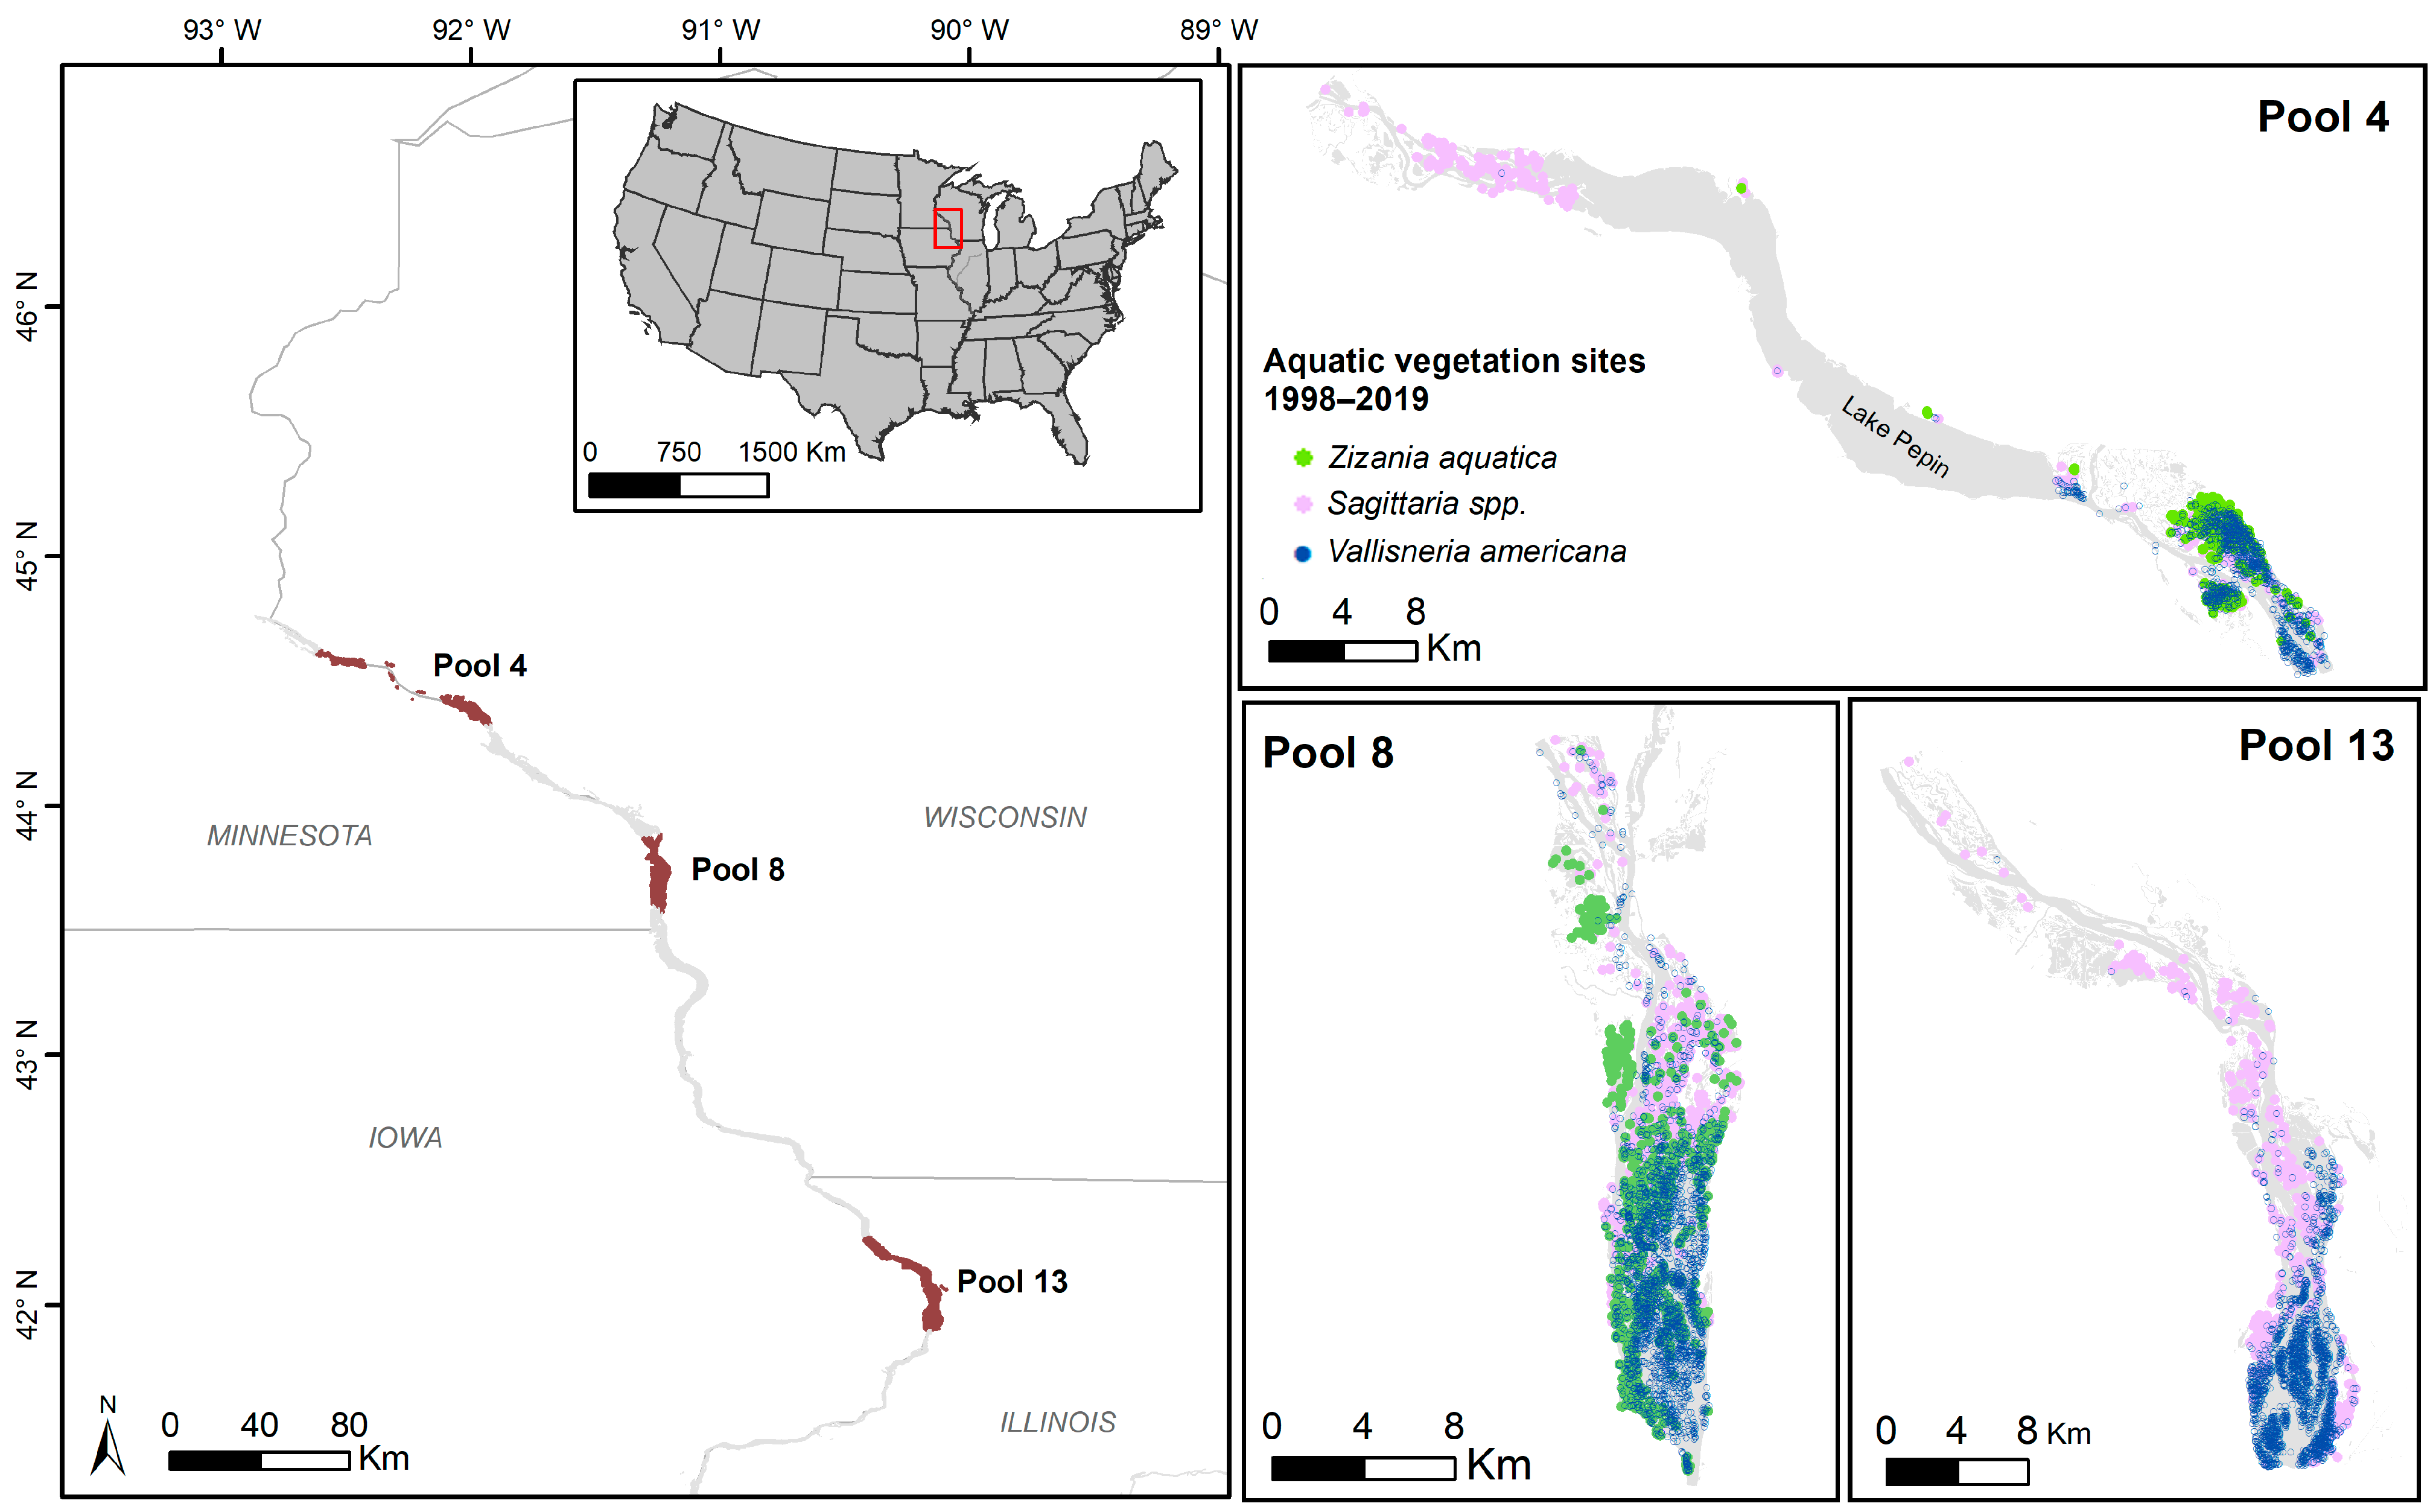
2.1. Study Area
2.2. Macrophyte and Habitat Data
2.3. Data Analyses
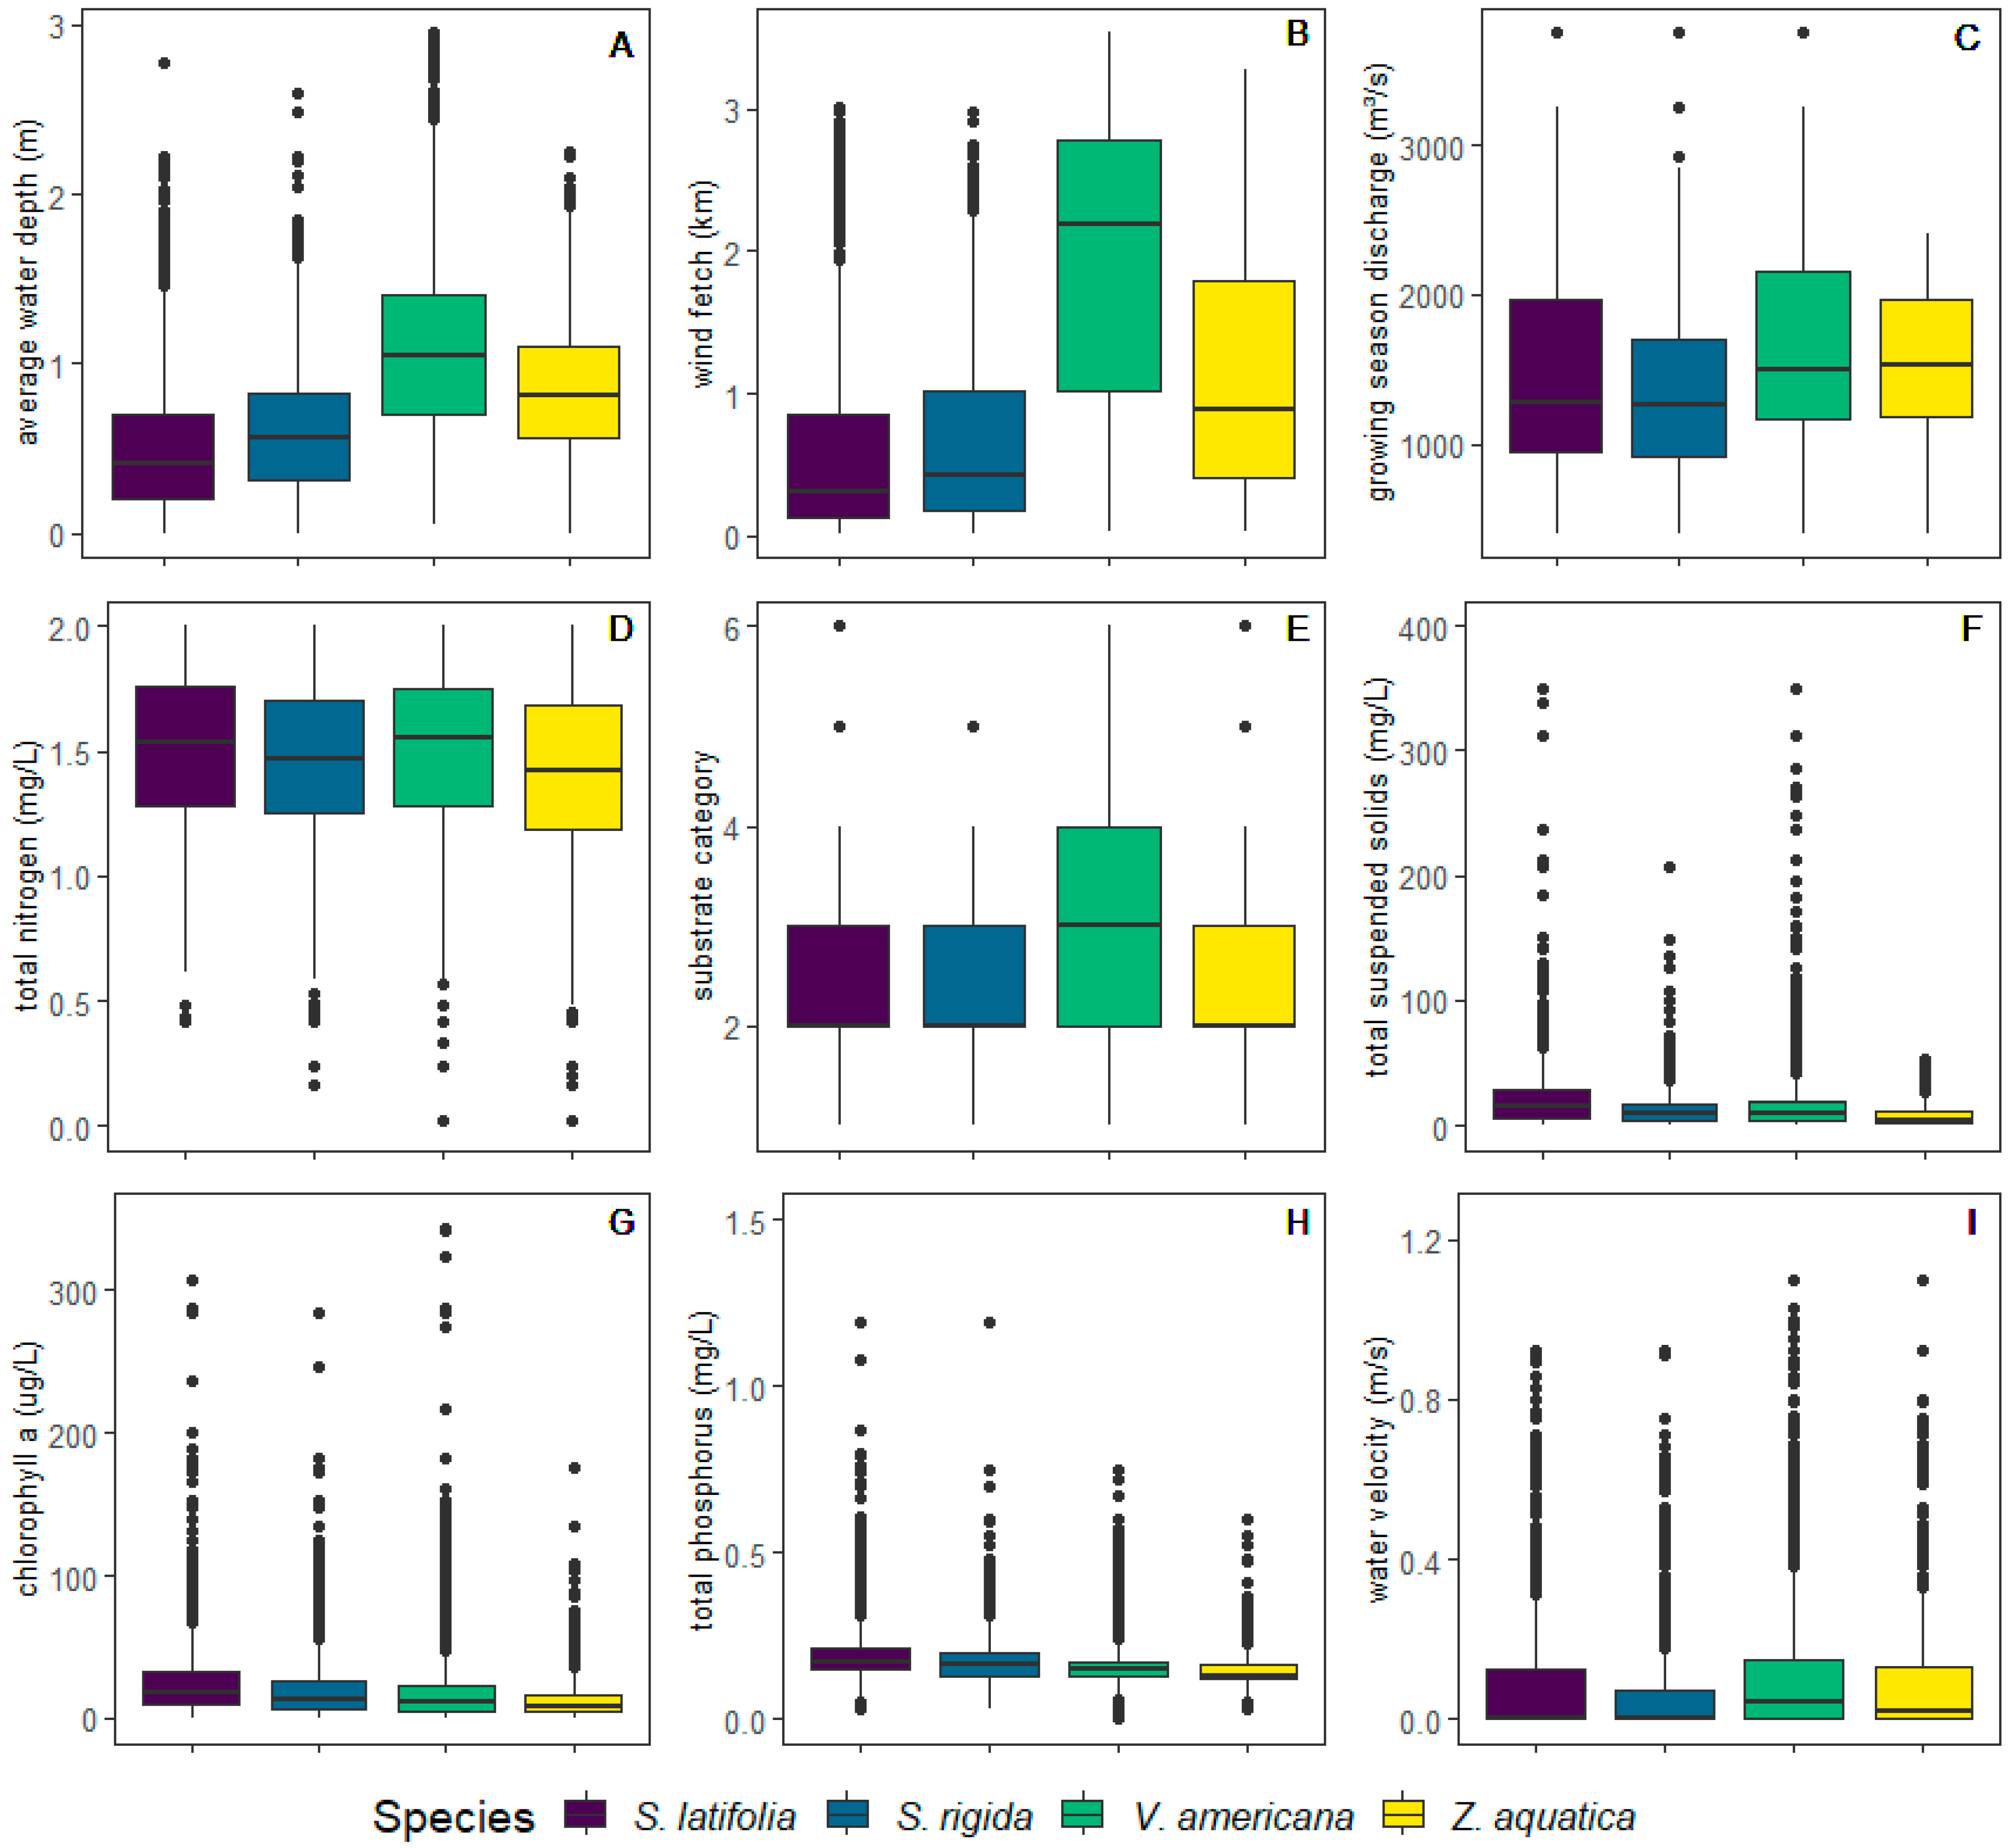
2.3.1. Using Ordination to Define Niches and Environmental Gradients
2.3.2. Mapping Spatial and Temporal Changes in Sagittaria spp., Z. aquatica, and V. americana
3. Results
3.1. Defining Ecological Niches and Associated Environmental Gradients
3.2. Ordination-Quantifying Patterns of Macrophyte Abundance and Niche Space over Time
3.3. Curve Fit- Spatial and Temporal Trends of Z. aquatica, V. americana, and Sagittaria spp.
4. Discussion
5. Conclusions
Supplementary Materials
Author Contributions
Funding
Institutional Review Board Statement
Data Availability Statement
Acknowledgments
Conflicts of Interest
References
- Van Geest, G.J.; Wolters, H.; Roozen, F.C.J.M.; Coops, H.; Roijackers, R.M.M.; Buijse, A.D.; Scheffer, M. Water-Level Fluctuations Affect Macrophyte Richness in Floodplain Lakes. Hydrobiologia 2005, 539, 239–248. [Google Scholar] [CrossRef]
- Schneider, B.; Cunha, E.R.; Marchese, M.; Thomaz, S.M. Explanatory Variables Associated with Diversity and Composition of Aquatic Macrophytes in a Large Subtropical River Floodplain. Aquat. Bot. 2015, 121, 67–75. [Google Scholar] [CrossRef]
- Carhart, A.M.; Kalas, J.E.; Rogala, J.T.; Rohweder, J.J.; Drake, D.C.; Houser, J.N. Understanding Constraints on Submersed Vegetation Distribution in a Large, Floodplain River: The Role of Water Level Fluctuations, Water Clarity and River Geomorphology. Wetlands 2021, 41, 57. [Google Scholar] [CrossRef]
- Alahuhta, J.; Lindholm, M.; Baastrup-Spohr, L.; García-Girón, J.; Toivanen, M.; Heino, J.; Murphy, K. Macroecology of Macrophytes in the Freshwater Realm: Patterns, Mechanisms and Implications. Aquat. Bot. 2021, 168, 103325. [Google Scholar] [CrossRef]
- Grinnell, J. The niche-relationships of the California thrasher. The Auk 1917, 34, 427–433. [Google Scholar] [CrossRef]
- Chase, J.M.; Leibold, M.A. Ecological Niche: Linking Classical and Contemporary Approaches; The University of Chicago Press: Chicago, IL, USA, 2003. [Google Scholar]
- Devictor, V.; Clavel, J.; Julliard, R.; Lavergne, S.; Mouillot, D.; Thuiller, W.; Venail, P.; Villéger, S.; Mouquet, N. Defining and measuring ecological specialization. J. Appl. Ecol. 2010, 47, 15–25. [Google Scholar] [CrossRef] [Green Version]
- Jongman, R.H.G.; ter Braak, C.J.F.; Van Tongeren, O.F.R. Data Analysis in Community and Landscape Ecology; Cambridge University Press: Cambridge, UK, 1995. [Google Scholar]
- Bouska, K.L.; Larson, D.M.; Drake, D.C.; Lund, E.M.; Carhart, A.M.; Bales, K.R. Aquatic Vegetation Dynamics in the Upper Mississippi River over 2 Decades Spanning Vegetation Recovery. Freshw. Sci. 2022, 41, 33–44. [Google Scholar] [CrossRef]
- USACE (U.S. Army Corps of Engineers). Upper Mississippi River System Ecosystem Restoration Objectives—2009. U.S. Army Corps of Engineers, Rock Island District, Rock Island, Illinois. 2011. Available online: https://www.mvr.usace.army.mil/Portals/48/docs/Environmental/UMRR/UMRR_Ecosystem_Restoration_Objectives_2009.pdf (accessed on 1 October 2022).
- Fremling, C.R. Immortal River—The Mississippi in Ancient and Modern Times; University of Wisconsin Press: Madison, WI, USA, 2005; p. 472. [Google Scholar]
- Houser, J.N.; Bouska, K.L.; De Jager, N.R.; Ickes, B.S.; Jankowski, K.J.; Larson, D.M.; Van Appledorn, M.; Rohweder, J.J. Introduction, Chap. In Ecological Status and Trends of the Upper Mississippi and Illinois Rivers; U.S. Geological Survey Open-File Report 2022-1039; Houser, J.N., Ed.; Upper Midwest Environmental Sciences Center: La Crosse, WI, USA, 2022; Volume 1, pp. 162–177. [Google Scholar] [CrossRef]
- McCain, K.N.S.; Schmuecker, S.; De Jager, N.R. Habitat Needs Assessment-II for the Upper Mississippi River Restoration Program: Linking Science to Management Perspectives; U.S. Army Corps of Engineers: Rock Island, IL, USA, 2018. Available online: https://pubs.er.usgs.gov/publication/70202203 (accessed on 9 January 2023).
- De Jager, N.R.; Rogala, J.T.; Rohweder, J.J.; Van Appledorn, M.; Bouska, K.L.; Houser, J.N.; Jankowski, K.J. Indicators of Ecosystem Structure and Function for the Upper Mississippi River System; Open-file report 2018-1143; U.S. Geological Survey, upper Midwest Environmental Sciences Center: La Crosse, WI, USA, 2018. [Google Scholar] [CrossRef]
- Peck, J.H.; Smart, M.M. An Assessment of the Aquatic and Wetland Vegetation of the Upper Mississippi River. Hydrobiologia 1986, 136, 57–75. [Google Scholar] [CrossRef]
- Fischer, J.R.; Claflin, T.O. Declines in Aquatic Vegetation in Navigation Pool No. 8, Upper Mississippi River between 1975 and 1991. Regul. Rivers Res. Manag. 1995, 11, 157–165. [Google Scholar] [CrossRef]
- De Jager, N.R.; Rohweder, J.J. Changes in Aquatic Vegetation and Floodplain Land Cover in the Upper Mississippi and Illinois Rivers (1989–2000–2010). Environ. Monit. Assess. 2017, 189, 77. [Google Scholar] [CrossRef]
- Carhart, A.M.; De Jager, N.R. Spatial and Temporal Changes in Species Composition of Submersed Aquatic Vegetation Reveal Effects of River Restoration. Restor. Ecol. 2018, 27, 672–682. [Google Scholar] [CrossRef]
- Burdis, R.M.; DeLain, S.A.; Lund, E.M.; Moore, M.J.C.; Popp, W.A. Decadal Trends and Ecological Shifts in Backwater Lakes of a Large Floodplain River: Upper Mississippi River. Aquat. Sci. 2020, 82, 27. [Google Scholar] [CrossRef]
- Larson, D.M.; Lund, E.M.; Carhart, A.M.; Drake, D.C.; Houser, J.N.; De Jager, N.R.; Bouska, K.L.; Bales, K.R.; Giblin, S.M. Aquatic Vegetation Indicators. In Ecological Status and Trends of the Upper Mississippi and Illinois Rivers; U.S. Geological Survey Open-File Report, 2022-1039; Houser, J.N., Ed.; USGS: La Crosse, WI, USA, 2022; Volume 1, pp. 112–133. [Google Scholar] [CrossRef]
- DeLain, S.A.; Popp, W.A. Relationship of Weed Shiner and Young-of Year Bluegill and Largemouth Bass Abundance to Submersed Aquatic Vegetation in Navigation Pools 4, 8, and 13 of the Upper Mississippi River, 1998–2012; LTRM technical report 2014–T001; U.S. Geological Survey—USGS: La Crosse, WI, USA, 2014. Available online: https://pubs.usgs.gov/mis/ltrmp2014-t001/pdf/ltrmp2014-t001.pdf (accessed on 1 January 2022).
- Weeks, A.M.; De Jager, N.R.; Haro, R.J.; Sandland, G.J. Spatial and Temporal Relationships Between the Invasive Snail Bithynia tentaculata and Submersed Aquatic Vegetation in Pool 8 of the Upper Mississippi River: Spatial and Temporal Patterns of Bithynia tentaculata. River Res. Appl. 2017, 33, 729–739. [Google Scholar] [CrossRef] [Green Version]
- Korschgen, C.E.; Green, W.L. American Wildcelery (Vallisneria americana): Ecological Considerations for Restoration; U.S. Department of the Interior, Fish and Wildlife Service: Bailey’s Crossroads, VA, USA, 1988; p. 27. [Google Scholar]
- U.S. Fish and Wildlife Service. Upper Mississippi River National Wildlife and Fish Refuge Comprehensive Conservation Plan and Habitat Management Plan: U.S. Fish and Wildlife Service. 2019. Available online: https://www.fws.gov/midwest/planning/uppermiss/ (accessed on 22 November 2022).
- Kenow, K.P.; Gray, B.R.; Lyon, J.E. Flooding Tolerance of Sagittaria latifolia and Sagittaria rigida under Controlled Laboratory Conditions: Flooding Tolerance of Sagittaria under Laboratory Conditions. River Res. Appl. 2018, 34, 1024–1031. [Google Scholar] [CrossRef]
- Marburger, J.E. Biology and Management of Sagittaria latifolia Willd (Broad-Leaf Arrow-Head) for Wetland Restoration and Creation. Restor. Ecol. 1993, 1, 248–255. [Google Scholar] [CrossRef]
- Larson, D.M.; Carhart, A.; Lund, E. Aquatic vegetation types identified during early and late phases of vegetation recovery in the upper Mississippi River. Ecosphere 2023, 14, e4468. [Google Scholar] [CrossRef]
- Yin, Y.; Winkelman, J.S.; Langrehr, H.A. Long Term Resource Monitoring Program Procedures: Aquatic Vegetation Monitoring; Program Report 95-P002-7; United States Geological Survey, Upper Midwest Environmental Science Center: La Crosse, WI, USA, 2000. Available online: https://umesc.usgs.gov/documents/reports/1995/95p00207.pdf (accessed on 1 January 2023)95p.
- Soballe, D.M.; Fischer, J.R. Long Term Resource Monitoring Program Procedures: Water Quality Monitoring; Technical Report 2004-T002-01; United States Geological Survey, Upper Midwest Environmental Science Center: La Crosse, WI, USA, 2004. Available online: https://www.umesc.usgs.gov/documents/reports/2004/04t00201.pdf (accessed on 1 January 2023).
- Rohweder, J.; Rogala, J. Upper Mississippi River System Weighted Wind Fetch Analysis (1989, 2000, 2010/2011); Contract report prepared for the U.S. Army Corps of Engineers’ Upper Mississippi River Restoration—Long Term Resource Monitoring element; U.S. Geological Survey: La Crosse, WI, USA, 2020; p. 26. [Google Scholar] [CrossRef]
- U.S. Army Corps of Engineers—Water Levels of Rivers and Lakes. Available online: https://rivergages.mvr.usace.army.mil/WaterControl/new/layout.cfm (accessed on 1 March 2021).
- Bray, J.R.; Curtis, J.T. An ordination of the upland forest communities of southern Wisconsin. Ecol. Monogr. 1957, 27, 326–349. [Google Scholar] [CrossRef]
- R Core Team. R: A Language and Environment for Statistical Computing; R Foundation for Statistical Computing: Vienna, Austria, 2020; Available online: https://www.R-project.org/ (accessed on 1 January 2023).
- Oksanen, J.F.; Blanchet, G.; Friendly, M.; Kindt, R.; Legendre, P.; McGlinn, D.; Minchin, P.R.; O’Hara, R.B.; Simpson, G.L.; Solymos, P.; et al. Vegan: Community Ecology Package. 2019. Available online: https://cran.r-project.org/web/packages/vegan/index.html (accessed on 1 January 2022).
- ESRI. ArcGIS Desktop, Version 10.8.1; Environmental Systems Research Institute: Redlands, CA, USA, 2022.
- De Jager, N.R.; Fox, T.J. Curve Fit: A Pixel-Level Raster Regression Tool for Mapping Spatial Patterns. Methods Ecol. Evol. 2013, 4, 789–792. [Google Scholar] [CrossRef]
- Pillsbury, R.W.; McGuire, M.A. Factors Affecting the Distribution of Wild Rice (Zizania palustris) and the Associated Macrophyte Community. Wetlands 2009, 29, 724–734. [Google Scholar] [CrossRef]
- Meeker, J.E. The Ecology of “Wild” Wild-Rice (Zizania palustris var. palustris) in the Kakagon Sloughs, a Riverine Wetland on Lake Superior; The University of Wisconsin–Madison ProQuest Dissertations Publishing: Madison, WI, USA, 1993. [Google Scholar]
- Asaeda, T.; Fujino, T.; Manatunge, J. Morphological Adaptations of Emergent Plants to Water Flow: A Case Study with Typha angustifolia, Zizania latifolia and Phragmites australis. Freshw. Biol. 2005, 50, 1991–2001. [Google Scholar] [CrossRef]
- Franklin, P.; Dunbar, M.; Whitehead, P. Flow controls on lowland river macrophytes: A review. Sci. Total Environ. 2008, 400, 369–378. [Google Scholar] [CrossRef] [PubMed]
- Madsen, J.D.; Chambers, P.A.; James, W.F.; Koch, E.W.; Westlake, D.F. The interaction between water movement, sediment dynamics and submersed macrophytes. Hydrobiologia 2001, 444, 71–84. [Google Scholar] [CrossRef]
- Jankowski, K.J. Water Quality Indicators. In Ecological Status and Trends of the Upper Mississippi and Illinois Rivers; U.S. Geological Survey Open-File Report, 2022-1039; Houser, J.N., Ed.; USGS: La Crosse, WI, USA, 2022; Volume 1, pp. 84–110. [Google Scholar] [CrossRef]
- Houser, J.N.; Bales, K.R.; Bouska, K.L.; Burdis, R.M.; Carhart, A.M.; Drake, D.C.; Jankowski, K.J.; Kalas, J.E.; Larson, D.M.; Lund, E.M.; et al. Using Long-Term Data to Understand the Causes and Consequences of Changes in Water Clarity and Aquatic Vegetation in the Upper Impounded Reach of the Upper Mississippi River. In Ecological Status and Trends of the Upper Mississippi and Illinois Rivers; U.S. Geological Survey Open-File Report, 2022-1039; Houser, J.N., Ed.; Upper Midwest Environmental Sciences Center: La Crosse, WI, USA, 2022; Volume 1, pp. 167–177. [Google Scholar] [CrossRef]
- Sims, L.; Pastor, J.; Lee, T.; Dewey, B. Nitrogen, Phosphorus and Light Effects on Growth and Allocation of Biomass and Nutrients in Wild Rice. Oecologia 2012, 170, 65–76. [Google Scholar] [CrossRef]
- Devendorf, R.D. A Dabbling Duck Migration Model for the Upper Mississippi River: St. Paul, Minn., U.S. Army Corps of Engineers, St. Paul District. 2013. Available online: https://cw-environment.erdc.dren.mil/model-library.cfm?CoP=Restore&Option=View&Id=622 (accessed on 9 January 2023).
- Devendorf, R.D. A Migratory Habitat Model for Diving Ducks Using the Upper Mississippi River: St. Paul, Minn., U.S. Army Corps of Engineers, St. Paul District. 2013. Available online: https://cw-environment.erdc.dren.mil/model-library.cfm?CoP=Restore&Option=View&Id=200 (accessed on 9 January 2023).
- Wang, H.; Xiao, K.; Wu, Z.; Chen, J.; Xiong, W.; Wang, Z.; Wang, Q.; Zhu, H.; Bowler, P. Delta Arrowhead (Sagittaria platyphylla) in the Yangtze River: An Invasive Aquatic Plant and the Potential Ecological Consequences. BioInvasions Rec 2020, 9, 618–626. [Google Scholar] [CrossRef]
- Liao, Y.Y.; Gichira, A.W.; Wang, Q.-F.; Chen, J.-M. Molecular Phylogeography of Four Endemic S. Agittaria Species (Alismataceae) in the Sino-Japanese Floristic Region of East Asia: Phylogeography of East Asian Sagittaria. Bot. J. Linn. Soc. 2016, 180, 6–20. [Google Scholar] [CrossRef] [Green Version]
- Jarvis, J.C.; Moore, K.A. Influence of Environmental Factors on Vallisneria americana Seed Germination. Aquat. Bot. 2008, 88, 283–294. [Google Scholar] [CrossRef]
- Long Term Resource Monitoring—Aquatic Vegetation. Available online: https://umesc.usgs.gov/data_library/vegetation/vegetation_page.html (accessed on 22 September 2021).
- Long Term Resource Monitoring—Water Quality. Available online: https://umesc.usgs.gov/data_library/water_quality/water_quality_page.html (accessed on 22 September 2021).
- Rohweder, J.J.; Carhart, A.M.; Larson, D.M. 22 Years of Aquatic Plant Spatiotemporal Dynamics in the Upper Mississippi River—Derived Spatial Data (Pools 4, 8, and 13); U.S. Geological Survey Data Release; USGS: La Crosse, WI, USA, 2023. [Google Scholar] [CrossRef]


| Common Name | Scientific Name | Species Code | Life Form | Number of Occurrences | Mean Relative Abundance |
|---|---|---|---|---|---|
| Coontail | Ceratophyllum demersum L. | CEDE4 | S | 7975 | 4.477 |
| Canadian waterweed | Elodea canadensis Michx. | ELCA7 | S | 6802 | 3.967 |
| American wild celery | Vallisneria americana Michx. | VAAM3 | S | 5734 | 4.177 |
| Water stargrass | Heteranthera dubia (Jacq.) MacMill. | ZODU | S | 5126 | 1.857 |
| Narrow-leaved pondweed | Potamogeton foliosus Raf., P. pusillus L. | NLPW | S | 4486 | 1.891 |
| Filamentous algae | not identified further | ALGA | A | 4212 | 1.928 |
| Duckweeds | Lemna, Spirodela, Wolfia spp., combined | NRFL | FF | 4176 | 6.811 |
| Sago pondweed | Stuckenia pectinata (L.) Börner | POPE6 | S | 4078 | 1.403 |
| White waterlily | Nymphaea odorata Aiton | NYTU | RFL | 3686 | 4.322 |
| Eurasian watermilfoil * | Myriophyllum spicatum L. | MYSP2 | S | 3279 | 0.942 |
| Curly pondweed * | Potamogeton crispus L. | POCR3 | S | 3060 | 0.945 |
| American lotus | Nelumbo lutea Willd. | NELU | RFL | 2679 | 4.117 |
| Flatstem pondweed | Potamogeton zosteriformis Fern. | POZO | S | 2151 | 0.704 |
| Broadleaf arrowhead | Sagittaria latifolia Willd. | SALA2 | E | 1743 | 2.855 |
| Stiff arrowhead | Sagittaria rigida Pursh. | SARI | E | 1257 | 1.593 |
| Longleaf pondweed | Potamogeton nodosus Poir | PONO2 | S | 1218 | 0.306 |
| Wild rice | Zizania aquatica L. | ZIAQ | E | 1073 | 1.120 |
| Nodding waternymph | Najas flexilis (Willd.) Rostk. and Schmidt | NAFL | S | 744 | 0.267 |
| Reed canarygrass * | Phalaris arundinacea L. | PHAR3 | E | 464 | 0.556 |
| Giant burreed | Sparganium eurycarpum Engelm. | SPEU | E | 434 | 0.520 |
| Southern waternymph | Najas guadalupensis (Spreng.) Magnus | NAGU | S | 433 | 0.202 |
| River bulrush | Bolboschoenus fluviatilis Torr. Soják | SCFL | E | 423 | 0.576 |
| Longbeak buttercup | Ranunculus longirostris Godr. | RALO2 | S | 341 | 0.113 |
| Brittle waternymph | Najas minor All. | NAMI | S | 257 | 0.105 |
| Northern watermilfoil | Myriophyllum sibiricum Komarov | MYSI | S | 247 | 0.071 |
Disclaimer/Publisher’s Note: The statements, opinions and data contained in all publications are solely those of the individual author(s) and contributor(s) and not of MDPI and/or the editor(s). MDPI and/or the editor(s) disclaim responsibility for any injury to people or property resulting from any ideas, methods, instructions or products referred to in the content. |
© 2023 by the authors. Licensee MDPI, Basel, Switzerland. This article is an open access article distributed under the terms and conditions of the Creative Commons Attribution (CC BY) license (https://creativecommons.org/licenses/by/4.0/).
Share and Cite
Carhart, A.M.; Rohweder, J.J.; Larson, D.M. 22 Years of Aquatic Plant Spatiotemporal Dynamics in the Upper Mississippi River. Diversity 2023, 15, 523. https://doi.org/10.3390/d15040523
Carhart AM, Rohweder JJ, Larson DM. 22 Years of Aquatic Plant Spatiotemporal Dynamics in the Upper Mississippi River. Diversity. 2023; 15(4):523. https://doi.org/10.3390/d15040523
Chicago/Turabian StyleCarhart, Alicia M., Jason J. Rohweder, and Danelle M. Larson. 2023. "22 Years of Aquatic Plant Spatiotemporal Dynamics in the Upper Mississippi River" Diversity 15, no. 4: 523. https://doi.org/10.3390/d15040523