Article

Spatiotemporal Distributions of Scolytinae Beetles in the Subtropical Forests of Southern China

1
Guangdong Key Laboratory of Animal Conservation and Resource Utilization, Guangdong Public Laboratory of Wild Animal Conservation and Utilization, Institute of Zoology, Guangdong Academy of Sciences, Guangzhou 510260, China
2
Innovative Institute for Plant Health, Zhongkai University of Agriculture and Engineering, Guangzhou 510225, China
3
Ministry of Agriculture and Rural Affairs/Key Laboratory of Green Prevention and Control on Fruits and Vegetables in South China, Zhongkai University of Agriculture and Engineering, Guangzhou 510225, China
4
Key Laboratory of Zoological Systematics and Evolution, Institute of Zoology, Chinese Academy of Sciences, Beijing 100101, China
5
Technical Center of Gongbei Customs District People’s Republic of China, Zhuhai 519001, China
*
Authors to whom correspondence should be addressed.
These authors contributed equally to this work.
Diversity 2023, 15(4), 499; https://doi.org/10.3390/d15040499
Submission received: 28 February 2023 / Revised: 21 March 2023 / Accepted: 23 March 2023 / Published: 1 April 2023

Abstract

:
Scolytinae beetles serve as important regulators of ecosystem integrity. However, some of these species have been identified as important pests. The Guangdong region of China exhibits unique geographic characteristics, but is also subject to substantial anthropogenic disturbances, making it an important region for ecological research. This study was designed to assess the biodiversity and abundance of these Scolytinae beetles in subtropical areas, to define indicators associated with environmental disturbances, and to thereby provide additional valuable information that can support the conservation of the ecosystem and the monitoring and controling of pest species. For these analyses, a two-season survey of Scolytinae communities was performed across three habitats to examine the patterns of variation within these communities. These analyses revealed that environmental disturbances were associated with a drop in Scolytinae beetle population diversity, with Hypothenemus sp.2, Xyleborinus andrewesi, and Xyleborinus artestriatus offering particular value as indicators associated with severe environmental disruptions. Plant diversity and composition also impacted Scolytinae beetle communities through a range of complex mechanisms. Scolytinae beetle diversity was also found to be higher during the rainy season relative to the dry season, with beetle abundance being responsive to average temperatures, but unrelated to average relative humidity levels.

1. Introduction

The Scolytinae (Coleoptera: Curculionidae) subfamily is a highly diversified group of ~6000 beetle species distributed across 26 tribes and 247 genera [1]. While scolytine beetles are distributed throughout the world, most are found in subtropical or tropical regions, with over half of all known species restricted to these warmer environments.
Scolytine beetles feed on a wide variety of woody and herbaceous plants [2], and they are among the most important insect facilitators of wood decomposition in agricultural and forest ecosystems [3]. However, certain scolytine species are primarily regarded as pests that can have significant adverse economic and ecological effects [4]. Scolytines are often classified in terms of their feeding strategies and host preferences into bark and ambrosia beetle subtypes. While bark beetles are primarily monophagous or oligophagous species that bore into the phloem of trees and feed on plant tissues, ambrosia beetles are polyphagous and are capable of boring into the xylem and feeding on symbiotic fungi that they introduce and cultivate within established galleries [1,4]. Given the pronounced differences in the feeding habits of these species, leading to cascade effects in ecosystems, there is clear value in examining the distributions of these beetles to better protect or prevent their colonization of particular regions.
Prior research has shown that the spatiotemporal distributions of scolytine species can be determined through regional studies primarily focusing on community composition and the responsiveness of these communities to specific environmental factors and trapping techniques [2,5,6,7,8,9,10]. The distribution patterns of scolytine beetles vary according to region, implying that the means of monitoring and control will differ. However, studies on these beetle communities have been unevenly distributed throughout the world, and there is limited information on the influence of habitat and season on the diverstiy and ecology of scolytine beetles in China.
Although roughly 500 scolytine species have been described in China to date [11,12,13], there are few detailed studies on their ecological diversity within the country. Approximately 50 Scolytinae species have been reported in Guangdong Province [11,12,13,14,15], located in a subtropical region where high abundance and genetic diversity of scolytine beetle communities would be expected. However, to date, the diversity of the beetles in this region appears to have been significantly underestimated. Thus, there is a clear need for investigation into the diversity and ecological characteristics of Scolytinae communities in the subtropical forests of southern China. While most regions at the same latitude as Guangdong Province are desertified, Guangdong is a vibrant oasis-like area. However, it is also exposed to high levels of economic development and international transport, and has, thus, been subjected to significant anthropogenic disturbance. These factors make studies of ecological issues in Guangdong Province particularly important. Notably, Guangdong is also one of the most important hubs of international import and export activity in China, and scolytine beetles can, thus, be readily transported across the world in dunnage and solid wood-packing materials [16,17,18,19,20]. This can result in the unintentional introduction of non-native pest species that can adversely impact native ecosystems and their associated economic development [21]. Thus, the diversity of native Scolytinae species in Guangdong Province and the high risk of their spread to other regions suggest the importance of comprehensively documenting both the abundance and diversity of these beetle communities in the large subtropical forests of this province.
This study was undertaken to explore the scolytine beetle community spatiotemporal distributions in three different southern subtropical forests in Guangdong Province, China. We compared the scolytine beetle communities in these broad-leaved forests and assessed species preferences for forest habitats in an attempt to examine the impact of forest composition, structure, disturbances, and climatic conditions on the composition and diversity of these ecologically important beetle communities. The goal of these analyses was to identify the indicators associated with environmental disturbances and provide valuable information for both biodiversity conservation and the monitoring and control of pest species.

2. Materials and Methods
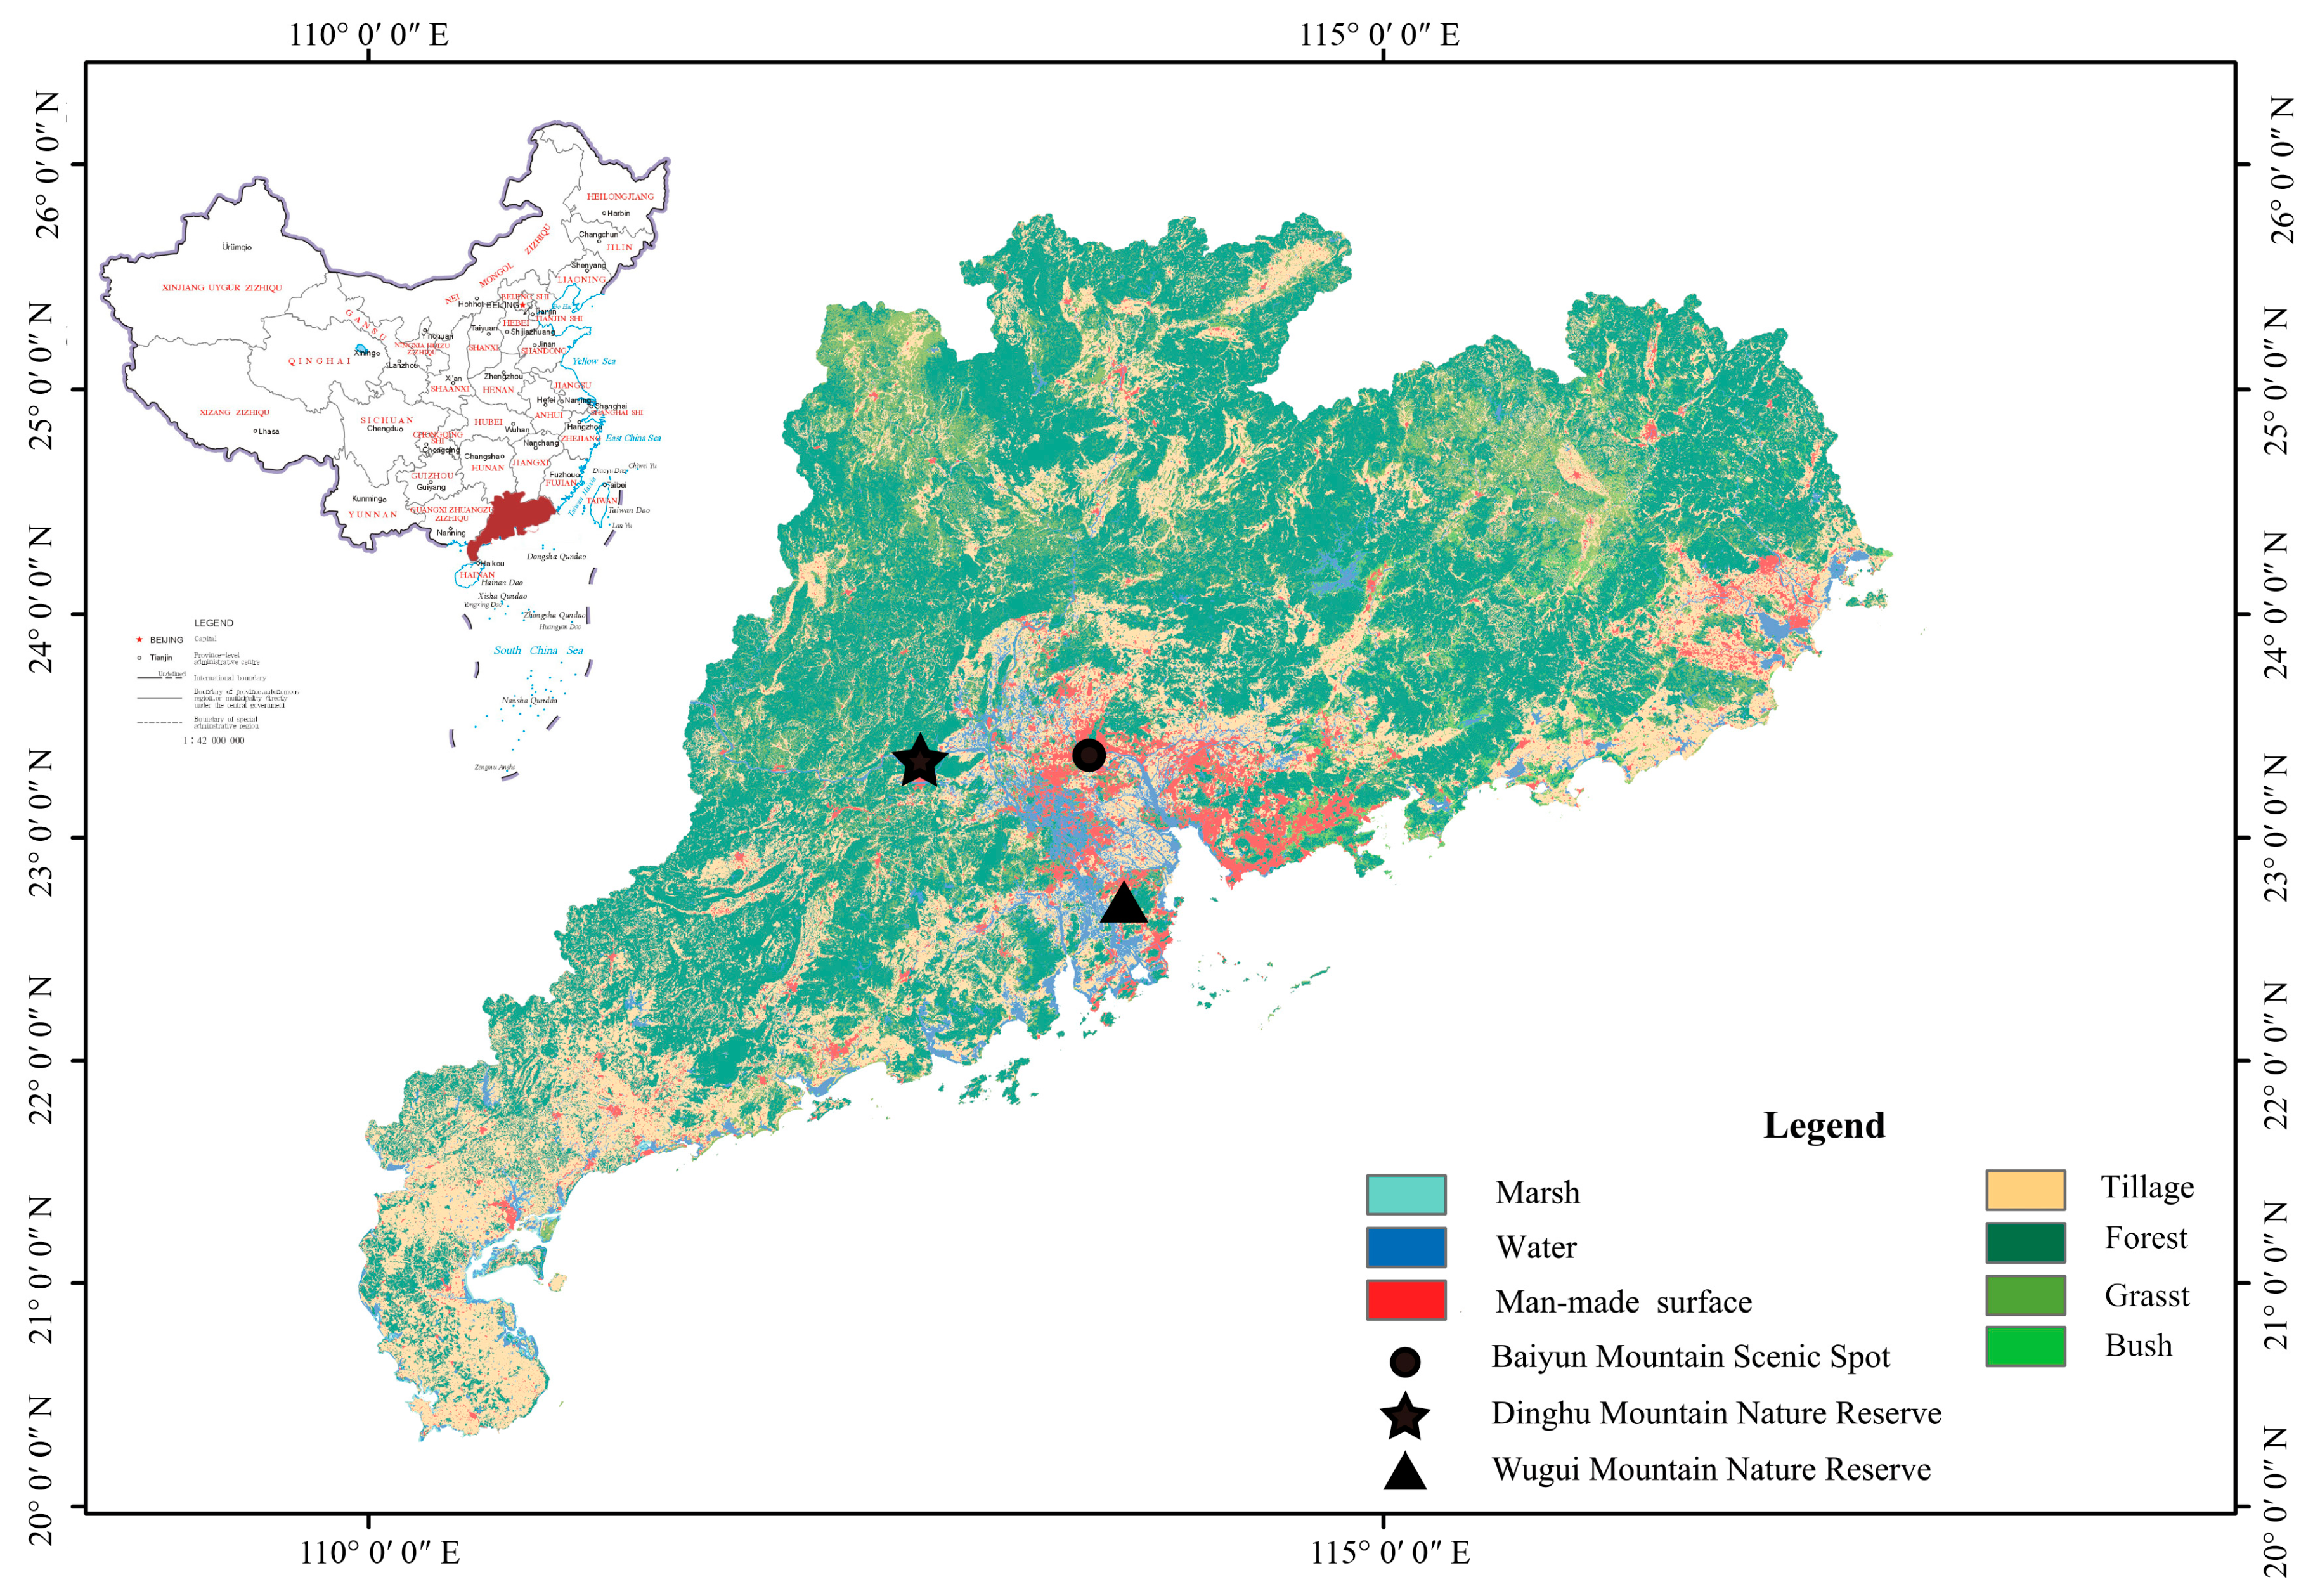
2.1. Study Areas

This study was conducted at three sites within Guangdong Province in southeastern China (Figure 1), which exhibits a typical southern subtropical monsoon climate and two seasons: a hot rainy season, during which most rainfall occurs (April–September), as well as a dry season (October–March) [22,23,24,25]. The native vegetation in this region consists of subtropical monsoon evergreen broadleaved forests, coniferous forests, and mixed coniferous and broadleaved forests [25,26,27]. The three study sites were similar in latitude, longitude, and altitude (Table S1), with no significant differences in the degree of plant diversity, but clear variations in the degree of disturbance (Table S2). The vegetation also differs significantly between the areas, allowing for analysis of the specific influences of vegetation on beetle ecology.
The first selected study site was in the Baiyun Mountain Scenic Spot (23°09′ N–23°13′ N, 113°16′ E–113°19′ E), which is a 2180 ha site in central Guangdong Province with a mixture of natural secondary forests and plantations [26,28]. The mean annual temperature and rainfall at this site are ~21.8 °C and ~1694 mm, respectively [29]. The second selected study site was in Dinghu Mountain National Nature Reserve (23°09′21″ N–23°11′30″ N, 112°32′39″ E–112°35′41″ E), which was established in 1956 as the first National Nature Reserve in China. This 1156-ha site is located 84 km west of Guangzhou and exhibits vegetation consisting of primary and secondary forests [22], with respective mean annual temperature and rainfall levels of ~20.9 °C and ~1860 mm [25]. The third selected study site was located on Wugui Mountain in the Zhongshan Nature Reserve (22°20′–22°30′ N, 113°10′–113°30′ E) in central southern Guangdong Province. This 20,314-ha reserve is home to vegetation consisting primarily of secondary forests [30], with a mean annual temperature of ~21.8 °C and an annual rainfall of ~1731 mm [27].

2.2. Scolytinae Sampling

In each study site, four 10 × 10 m plots were selected at similar altitudes with similar forms of vegetation (12 total plots). These plots were sampled 18 times in 2021, including 9 times in April-June and 9 times in October-November, during the rainy and dry seasons, respectively. Beetles were collected using flight intercept traps placed at the center of the plots for 3–4 days during the collection period, with one trap per plot containing a mixture of SDS (27.5%), EDTA (51.2%), and NaCl (21.3%). The collected insects were transferred to 50-mL vials containing 100% alcohol, and the solution in the trap was replenished. A Leica SAPO stereomicroscope was used to examine the morphology of the beetles using several taxonomic keys [13,31]. The numbers of species and specimens for each sampling session were calculated, and voucher specimens were deposited in the Institute of Zoology, Guangdong Academy of Sciences, Guangzhou.

2.3. Climatic Variables and Vegetation Conditions

Mean temperature and relative humidity data for the selected study sites were obtained from the nearest station of the Resources and Environmental Science and Data Center of the Chinese Academy of Sciences. In addition, hygrothermograph recorders were used in each study site. The tree species and numbers of all tree species with a circumference at breast height (CBH) >1 cm and a height >1.3 m were assessed, along with the tree height, CBH, and herbaceous layer coverage in each study plot.

2.4. Data Analyses

R v4.2.0 was used for all statistical analyses. Species accumulation curves were used to gauge the adequacy of sampling before analysis [32,33]. Species diversity was assessed using the Margalef richness index, Shannon–Wiener diversity index, species abundance, and species richness [34]. Discrepancies between communities were evaluated with the Jaccard similarity coefficient [35], while relationships between Scolytinae abundance and forest habitats were examined with the IndVal value method established by Dufrêne and Legendre [36]. Student’s t-tests and one-way analyses of variance (ANOVA) with Tukey’s HSD test were, respectively, used to compare differences in Scolytinae species diversity between seasons and study sites. Pearson’s correlation analyses were used to assess the effects of different environmental variables on Scolytinae species diversity in these three sampling areas. Analyses of covariance (ANCOVA) were used when comparing relationships between Scolytinae species abundance and either mean temperatures or relative humidity. Data that did not conform to the criteria of ANOVA or Student’s t-tests were analyzed with Kruskal–Wallis tests.

2.5. Abbreviations

Baiyun Mountain Scenic Spot (BY); Dinghu Mountain National Nature Reserve (DH); Wugui Mountain of Zhongshan Nature Reserve (WG). BY1, BY2, BY3, and BY4 represent sample plots in the Baiyun Mountain Scenic Spot; DH1, DH2, DH3, and DH4 represent sample plots in Dinghu Mountain National Nature Reserve; WG1, WG2, WG3, and WG4 represent sample plots on Wugui Mountain in the Zhongshan Nature Reserve. Species abundance of trees (Tabundance); species richness of trees (Trichness); Shannon–Wiener diversity index of trees (Tshannon); Margalef richness index of trees (Tmargalef); species abundance for host trees (HTabundance); species richness for host trees (HTrichness); Shannon–Wiener diversity index for host trees (HTshannon); Margalef richness index of host trees (HTmargalef); average circumference at breast height (CBH); average height of trees (height); average herbaceous layer coverage (herb); average tree density (density). Scolytinae beetle species abundance (SCabundance); Scolytinae beetle species richness (SCrichness); Shannon–Wiener diversity index for Scolytinae beetles (SCshannon); Margalef richness index for Scolytinae beetles (SCmargalef).

3. Results

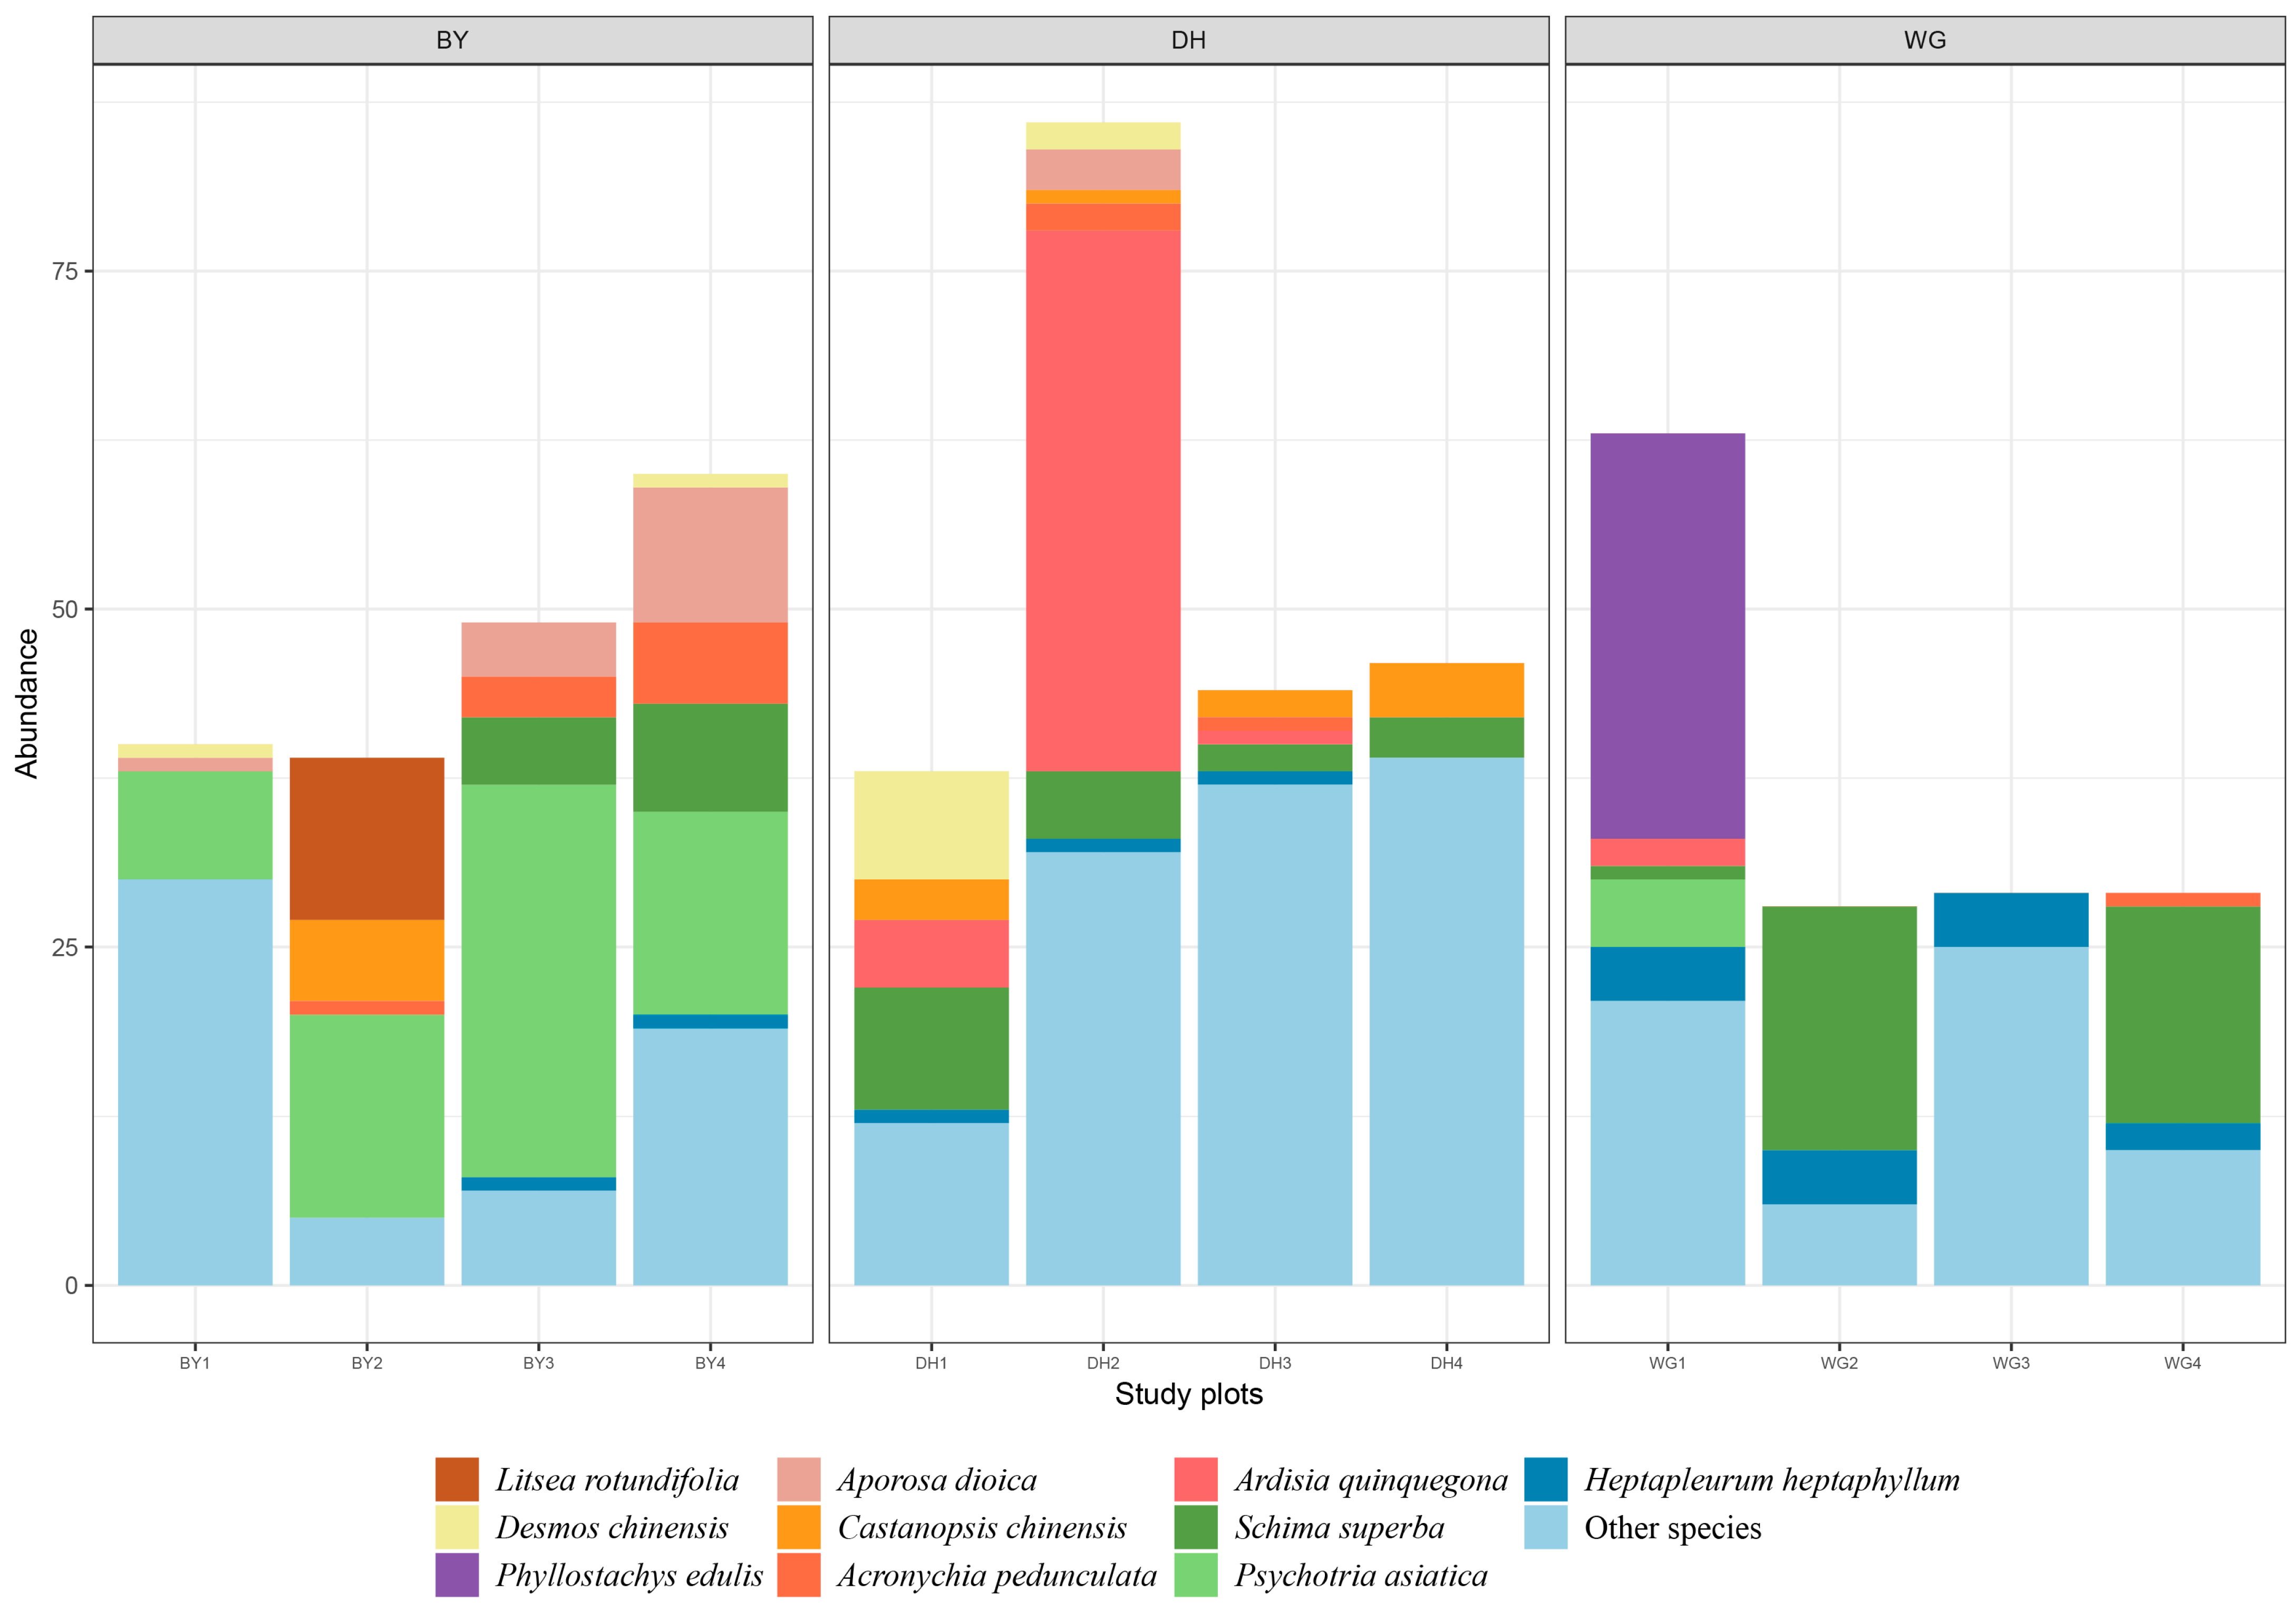
3.1. General Vegetation Conditions in the Three Study Areas

In total, 551 trees belonging to 43 families and 83 species were identified across the 12 experimental plots during this two-season survey study (Table S3). These included 188 trees (21 families, 29 species) in the BY sample sites, 214 trees (29 families, 44 species) in DH sample sites, and 149 trees (25 families, 33 species) in EG sample sites (Figure 2). In the BY sample sites, Rubiaceae (36.17% of the total tree) was the most abundant tree family, followed by Rutaceae (9.04%), Euphorbiaceae (7.98%), and Fagaceae (6.91%), while Psychotria asiatica, Aporosa dioica, Schima superba, and Litsea rotundifolia were the dominant plant species. In DH sample sites, Myrsinaceae (21.96%) was the most abundant family, followed by Fagaceae (9.35%), Lauraceae (8.88%), and Theaceae (8.88%), while Ardisia quinquegona, Schima superba, Cryptocarya concinna, and Desmos chinensis were the dominant plant species. In WG sample sites, Theaceae (24.83%) was the most abundant tree family, followed by Poaceae (20.13%), Araliacea (9.40%), and Cupressaceae (5.37%), while Schima superba, Phyllostachys chinensis, Heptapleurum heptaphyllum, and Cunninghamia lanceolata were the dominant plant species. No significant differences in species abundance, species richness, Shannon–Wiener diversity index, Margalef richness index, average CBH, average height, or average density of trees were detected across the three study areas, while there were significant differences in the average herbaceous layer coverage among these three study areas (Table 1). Specifically, the average herbaceous layer coverage in the DH sample sites was significantly higher than that in the WG sample sites, whereas there were no significant differences between the DH and BY sample sites.

3.2. Endemic and Shared Trees

Relatively few tree species (3.6%) were shared across all three study areas, and endemic tree species (32.5%) were the richest in DH sample sites (Figure 3). Overall, 12.0%, 12.0%, and 7.2% were shared between the DH and BY, DH and WG, and WG and BY study sites, respectively. In total, 16 endemic species including Litsea rotundifolia, Chukrasia tabularis, Lithocarpus glaber, and Caryota maxima were identified in the BY sample sites. Additionally, 27 endemic species, including Cryptocarya concinna, Memecylon ligustrifolium, Garcinia oblongifolia, and Calamus rhabdocladus, were identified in DH sample sites, and 20 endemic species, including Phyllostachys edulis, Ficus variegata, Cunninghamia lanceolata, and Michelia macclurei, were identified in WG sample sites. The Jaccard similarity coefficient values, when comparing tree communities between DH and BY, DH and WG, and BY and WG, were 0.16, 0.14, and 0.11, respectively, indicating a high level of dissimilarity, with respect to the tree communities between these pairs of study areas.

3.3. Host Tree Diversity Indices

The key references used to confirm Scolytinae beetle home trees included Yin et al., 1984, Hulcr et al., 2007, Huang and Lu, 2015, and Raffa et al., 2015 [11,16,37,38]. With respect to host tree diversity, the highest species abundance was observed in the WG sample sites, followed by DH and BY, although the only significant difference was observed between the WG and BY sites (Figure 4A). Significantly higher species richness was observed in the DH and WG sites, relative to the BY sites, whereas no differences were detected between DH and WG (Figure 4B). The Shannon–Wiener diversity index was highest in the DH study sites, followed by WG and BY, although significant differences were only found between the DH and BY study sites (Figure 4C). The Margalef richness index exhibited identical trends to those observed for the Shannon–Wiener diversity index (Figure 4D).

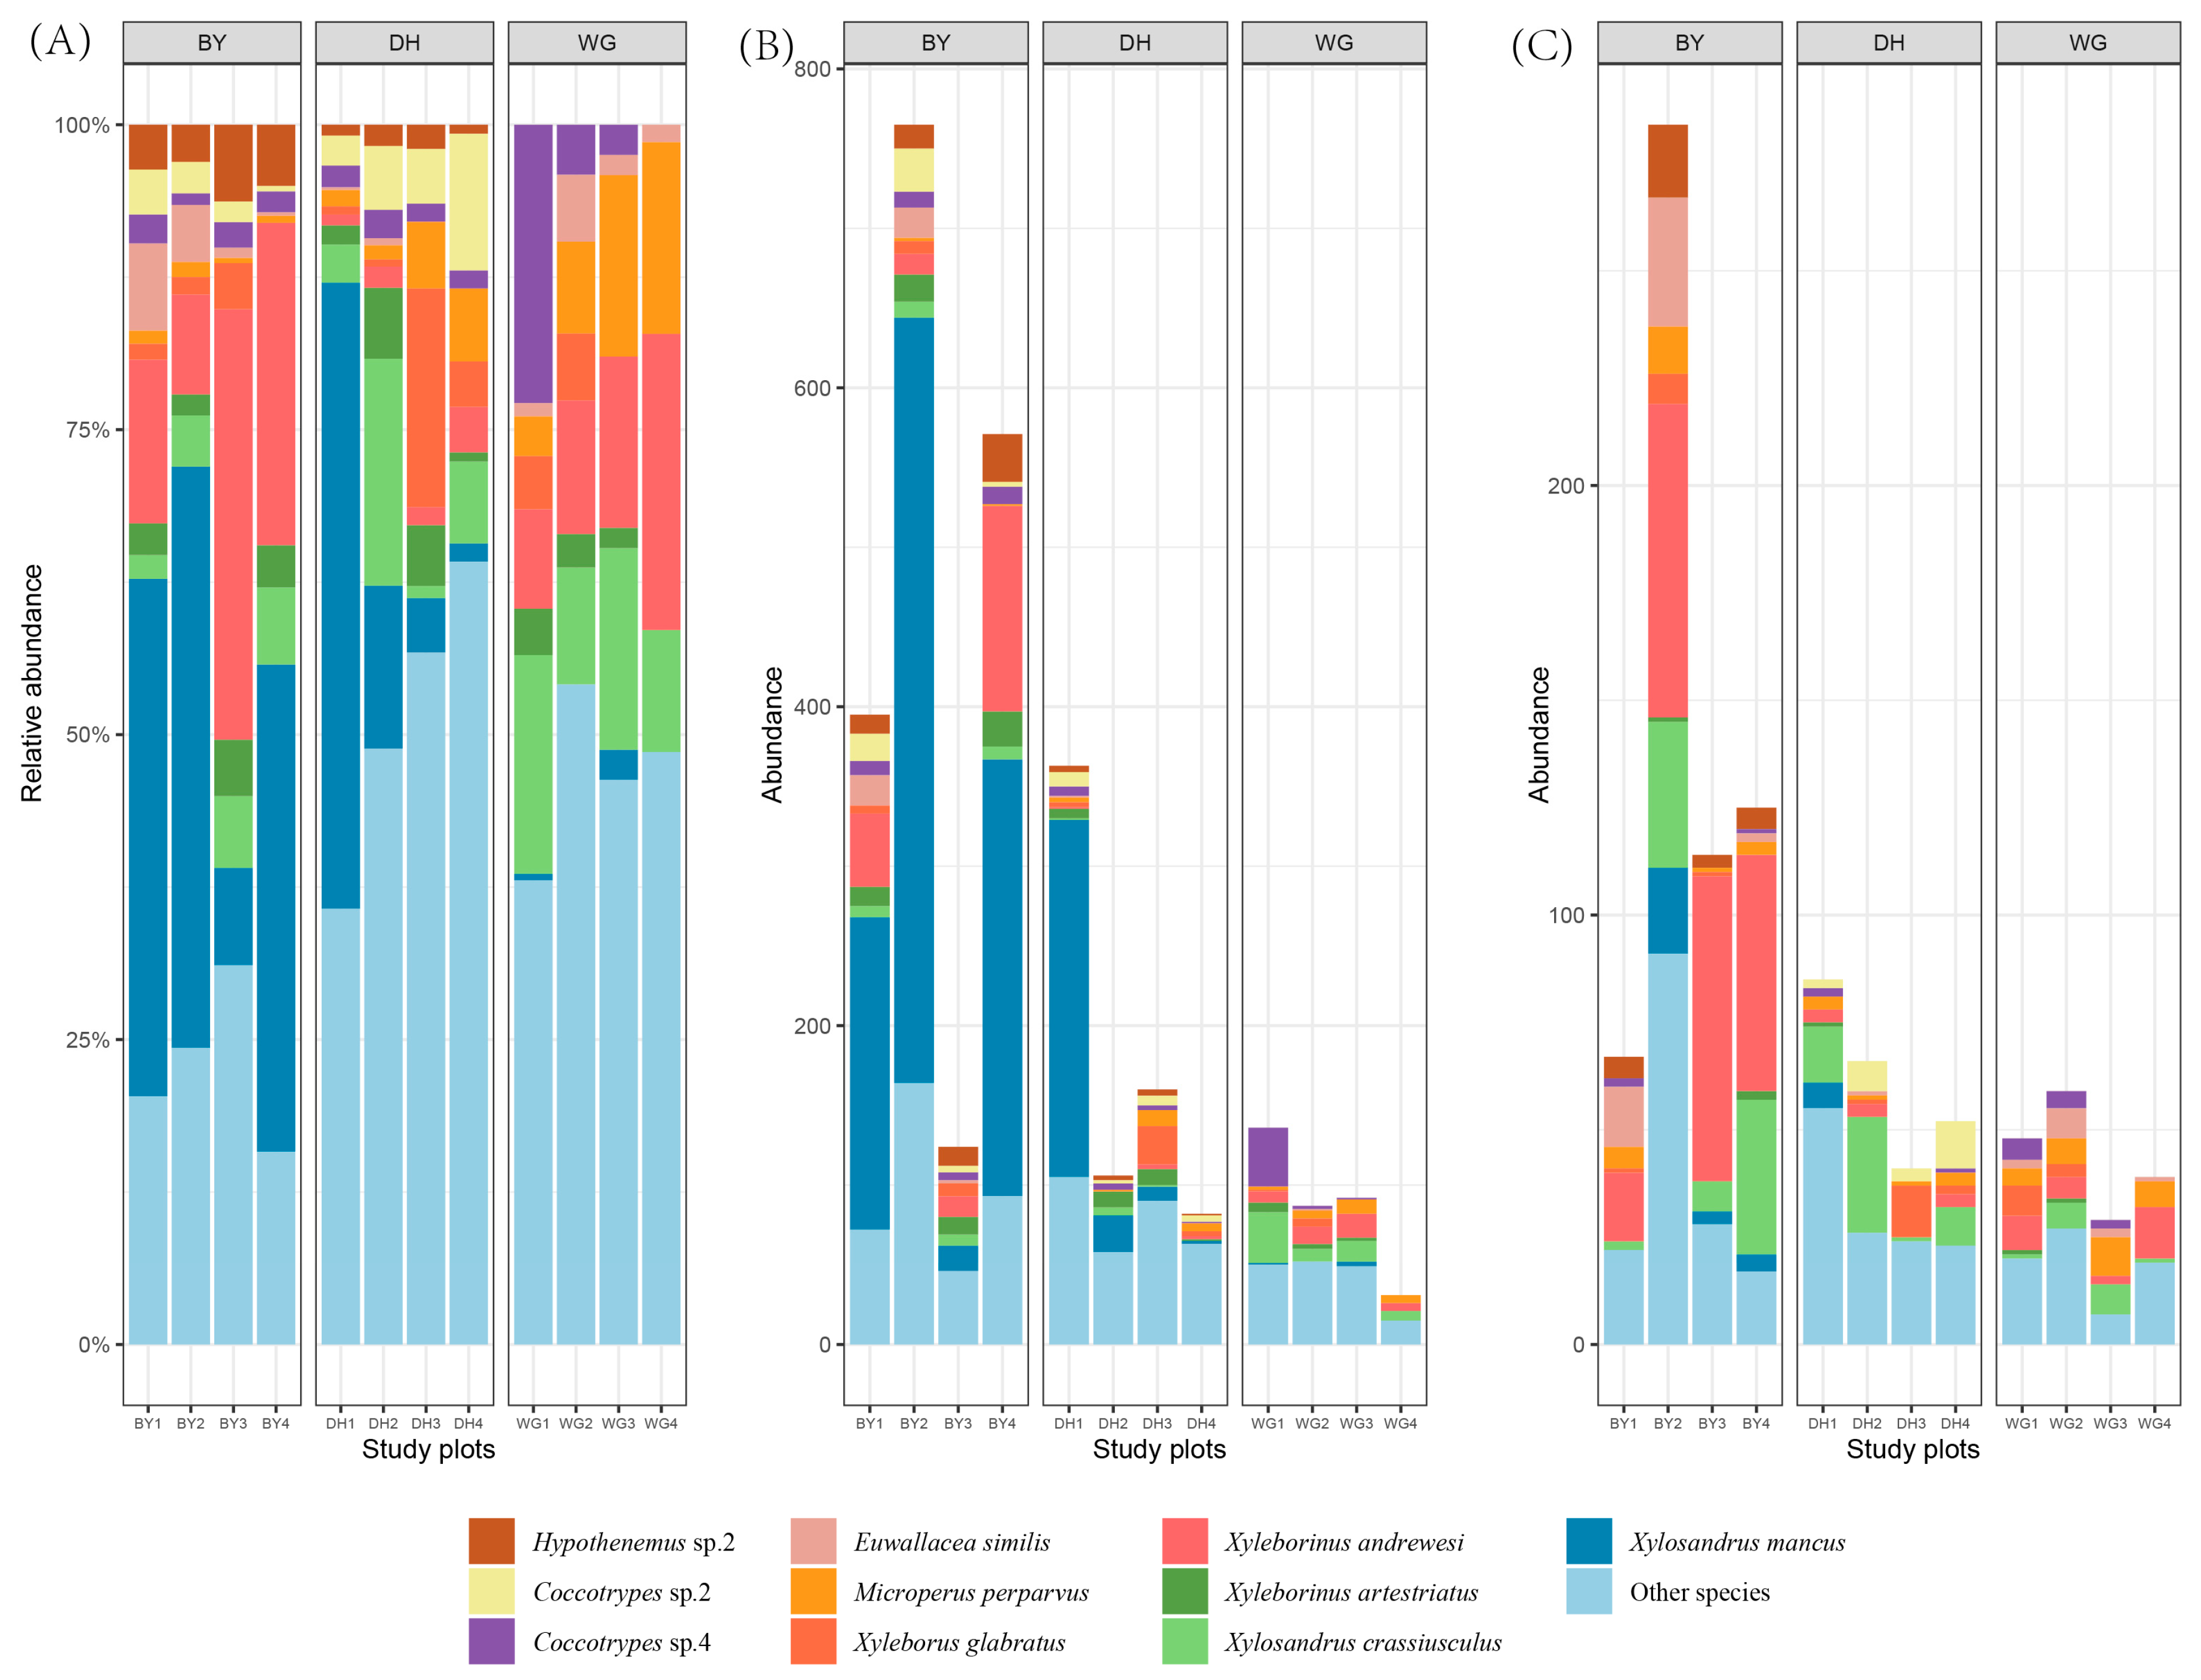
3.4. Scolytinae Beetle Community Composition in the Three Study Areas

When assessing Scolytinae beetles, the species accumulation curve for the overall dataset approached an asymptote consistent, with sufficient sampling having been achieved to provide reliable estimates of Scolytinae beetle diversity (Figure 5). Overall, 3921 individual Scolytinae beetles, assigned to 30 genera and 78 species, were captured (Figure 6A), with a much higher abundance of Scolytinae species observed during the rainy season, relative to the dry season (Figure 6B,C).
The most abundant (84.3% of the total catch) and diverse (69.2% of the total species) tribe was Xyleborini, followed by Dryocoetini (8.4% of the total catch; 12.8% of the total species). The most abundant genus was Xylosandrus (Xyleborini; 40.9% of total catch; 8 species), followed by Xyleborinus (Xyleborini; 17.1% of total catch; 6 species) and Coccotrypes (Dryocoetini; 8.0% of total catch; 7 species), respectively. Of these specimens, 2445 individuals (22 genera, 50 species) were captured in the BY sample sites, 955 individuals (24 genera, 59 species) were captured in DH sample sites, and 521 (25 genera, 46 species) were captured in WG sample sites (Table 2). The most common species in the BY sample sites was Xylosandrus mancus (40.61% of the total Scolytinae beetles in the BY sites), followed by Xyleborinus andrewesi (17.01%) and Xylosandrus crassiusculus (4.54%). The dominant species in DH sample sites were Xylosandrus mancus (27.64%), Microperus kadoyamaensis (6.49%), and Xylosandrus crassiusculus (5.97%), while Xylosandrus crassiusculus (14.20%), Xyleborinus andrewesi (12.48%), and Coccotrypes sp.4 (9.79%) were dominant in WG sample sites.

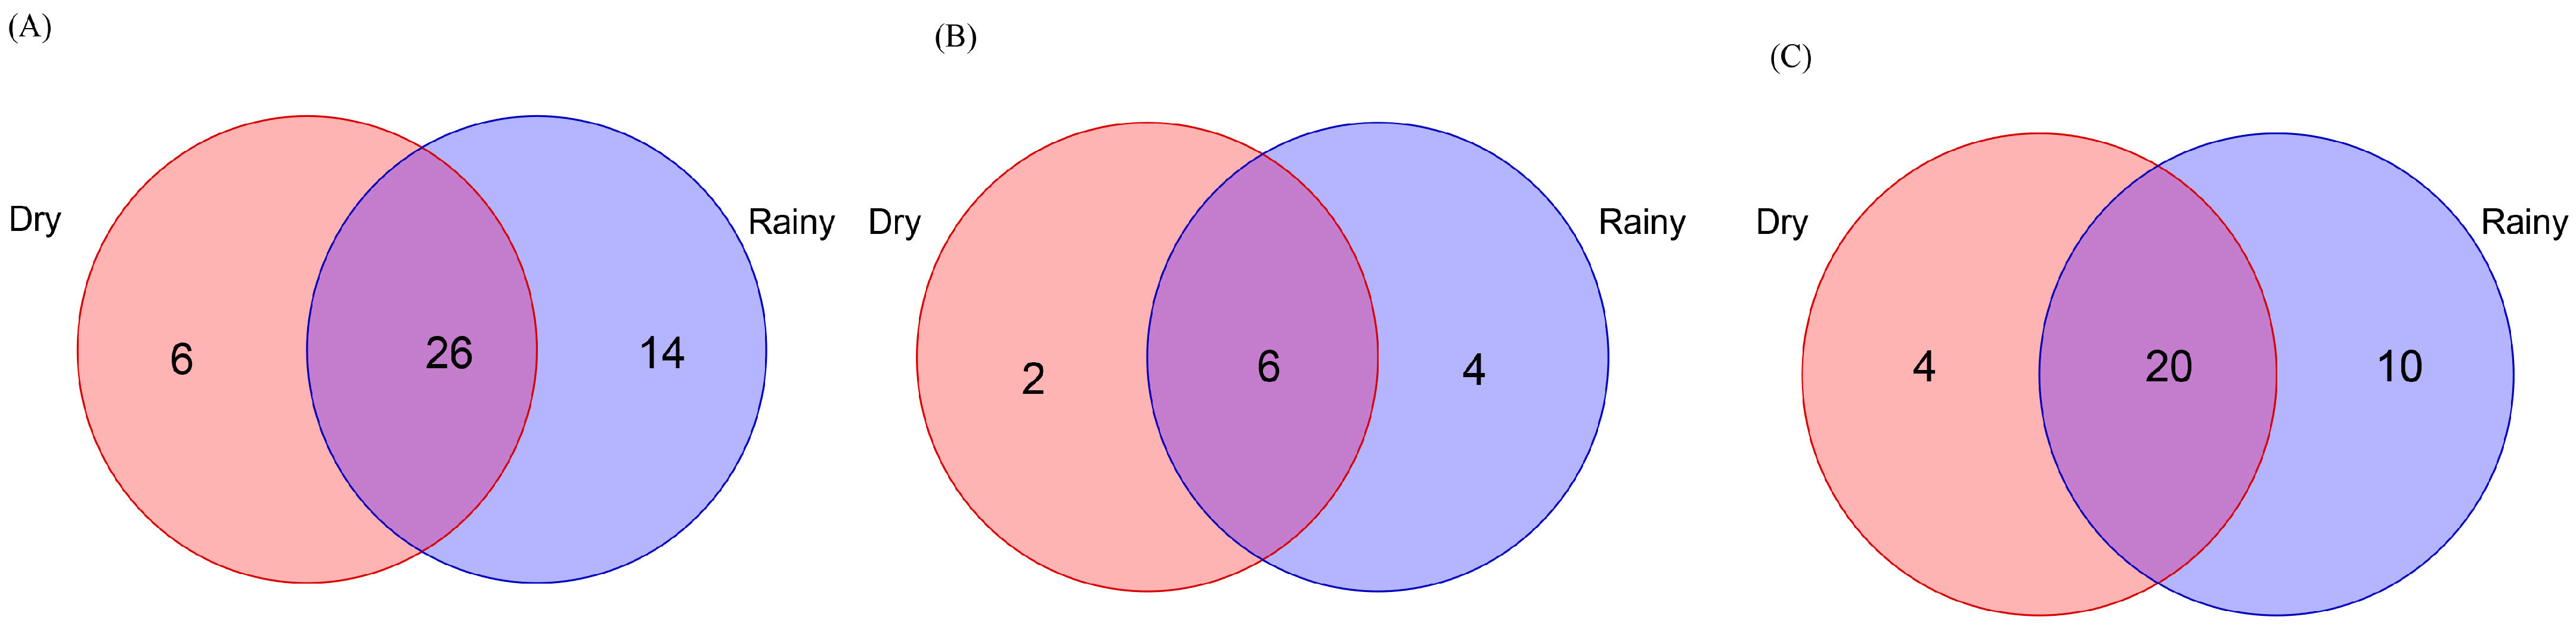
3.5. Endemic and Shared Scolytinae Beetles

There was notable overlap in Scolytinae beetles among the three study sites, with ~35.9% of species shared among the sites. Endemic Scolytinae species (20.5%) were the richest in DH study sites (Figure 7A). Overall, 50.0%, 41.0%, and 43.6% of Scolytinae species were shared between the DH and BY, DH and WG, and WG and BY study areas. A total of five endemic species were identified in the BY sample sites, including Cryphalus dilutus, Xyleborinus cf. jianghuasuni, Euwallacea andamanensis, and Microperus cf. chrysophylli, while 16 endemic species, including Scolytoplatypus sinensis, Anisandrus ursulus, Xylosandrus amputatus, and Xyleborinus ephialtodes, were detected in DH sites, and 8 endemic species, including Xyleborini sp., Coccotrypes sp.7, Dryocoetini sp., and Phloeosinus sp., were detected in WG sites. The Jaccard similarity coefficient of Scolytinae communities when comparing the DH and BY sites was 0.56, with a similar value of 0.55 when comparing BY and WG sites, consistent with moderate similarity between these pairs of study sites. The Jaccard similarity coefficient of Scolytinae communities when comparing the DH and WG sites was 0.44, consistent with a moderate level of dissimilarity between the communities found in these two study areas.
In total, 558 bark beetles (10 genera, 22 species) and 3363 ambrosia beetles (20 genera, 56 species) were collected over the course of this study (Table S4). Limited bark species overlap was observed across the three study sites (~18.2% of species shared), with the lowest numbers of endemic bark beetle species (4.5%) detected in the BY sample sites (Figure 7B). Overall, 40.9%, 27.3%, and 27.3% of bark beetle species were shared when comparing the DH and BY, DH and WG, and WG and BY study sites. The Jaccard similarity coefficient values for bark beetle communities, when comparing the DH and BY, BY and WG, and DH and WG sites, were 0.50, 0.33, and 0.29, respectively, consistent with moderate dissimilarity for these pairs of study areas, with the exception of DH and BY.
There was a substantial overlap of 42.9% of ambrosia beetle species across these three study areas, and endemic ambrosia beetle species (21.4%) were the richest in DH study sites (Figure 7C). Overall, 53.6%, 46.4%, and 50.0% of the ambrosia beetle species were shared between DH and BY, DH and WG, and WG and BY study sites. The Jaccard similarity coefficient values, when comparing the DH and BY, BY and WG, and DH and WG study areas, were 0.58, 0.64, and 0.50, respectively, consistent with moderate ambrosia beetle community similarity between these pairs of study areas.
A total of 1855 Scolytinae beetles, including 211 bark beetles (5 genera, 9 species) and 1644 ambrosia beetles (14 genera, 34 species), were collected in the BY sample sites during the rainy season (Table S4). However, only 590 Scolytinae were collected in the BY sample sites during the dry season, including 66 bark beetles (5 genera, 9 species) and 524 ambrosia beetles (10 genera, 28 species) (Table S4). Of the total Scolytinae beetle species (50 species), 60.0% were shared between the rainy and dry seasons, including 50.0% and 63.2% of the bark and ambrosia beetles, respectively (Figure 8). The Jaccard similarity coefficients for the overall Scolytinae beetle community, the ambrosia beetle community, and the bark beetle community were 0.60, 0.63, and 0.50, respectively, consistent with moderate similarity for these communities between the two seasons at the BY sample sites.
In total, 711 Scolytinae beetles, including 97 bark beetles (7 genera, 11 species) and 614 ambrosia beetles (16 genera, 36 species), were collected in DH sample sites during the rainy season (Table S4). During the dry season, just 244 Scolytinae beetles, including 55 bark beetles (6 genera, 10 species) and 189 ambrosia beetles (11 genera, 31 species), were detected in DH sample sites (Table S4). Of the overall Scolytinae beetle species (59 species), 49.2% were shared between the rainy and dry seasons, including 40.0% of bark beetle species and 52.3% of ambrosia beetle species (Figure 9). The Jaccard similarity coefficients for overall Scolytinae beetle and bark beetle communities, when comparing these two seasons were 0.49 and 0.40, respectively, consistent with moderate community dissimilarity between these two seasons. In contrast, the Jaccard similarity coefficient for the ambrosia beetle community was 0.52, consistent with moderate community similarity between the rainy and dry seasons.
During the rainy season, 346 Scolytinae beetles, including 104 bark beetles (6 genera, 10 species) and 242 ambrosia beetles (16 genera, 30 species), were collected in the WG study sites (Table S4). During the dry season, just 175 Scolytinae beetles, including 25 bark beetles (7 genera, 8 species) and 150 ambrosia beetles (12 genera, 24 species), were collected in WG study sites (Table S4). Of the 46 species collected on this site, 56.5% of the overall Scolytinae beetles, 50.0% of bark beetles, and 58.8% of ambrosia beetles were shared between seasons (Figure 10). The Jaccard similarity coefficients, when comparing these two seasons for the Scolytinae beetle, ambrosia beetle, and bark beetle communities, were 0.57, 0.59, and 0.50, respectively, suggesting a moderate degree of similarity between the two seasons for all these communities.

3.6. Scolytinae Beetle Diversity Indices

Scolytinae beetle community structures differed significantly across habitats and seasons in these three subtropical forest areas in southern China. Species richness, Shannon–Wiener diversity index, and Margalef richness index values in DH were significantly higher than those for other study areas during both seasons, whereas species abundance was highest in the BY (Figure 11B–D). The lowest species abundance and species richness were evident in WG, although the abundance only differed significantly when comparing WG and BY (Figure 11A) and the richness only differed significantly when comparing WG and DH (Figure 11B). The Shannon–Wiener diversity index was the lowest in the BY, but only differed significantly between DH and BY (Figure 11C). The Margalef richness index was significantly lower in the BY and WG, relative to DH, while it did not differ significantly between the BY and WG (Figure 11D).
Diversity indices, including species abundance, species richness, and the Margalef richness index, were significantly higher during the rainy season, relative to the dry season, at all study sites, whereas the Shannon–Wiener diversity index did not exhibit any significant seasonal variations (Figure 12).

3.7. Indicator Species

In total, 12 morphospecies exhibited significant IndVal values (p < 0.05), of which 7, 2, and 3 were, respectively, identified as significant indicators in the BY, WG, and DH study sites (Table 2). The Xyleborini tribe comprised more indicator species in BY (n = 5) than in WG and DH (n = 1 and n = 2, respectively), whereas the Trypophloeini tribe included indicator species present only in BY (n = 1), and Scolytoplatypodini was consistent of indicator species present only in DH (n = 1). The Dryocoetini tribe included one indicator species each in the WG and BY sites, but none in the DH sites.

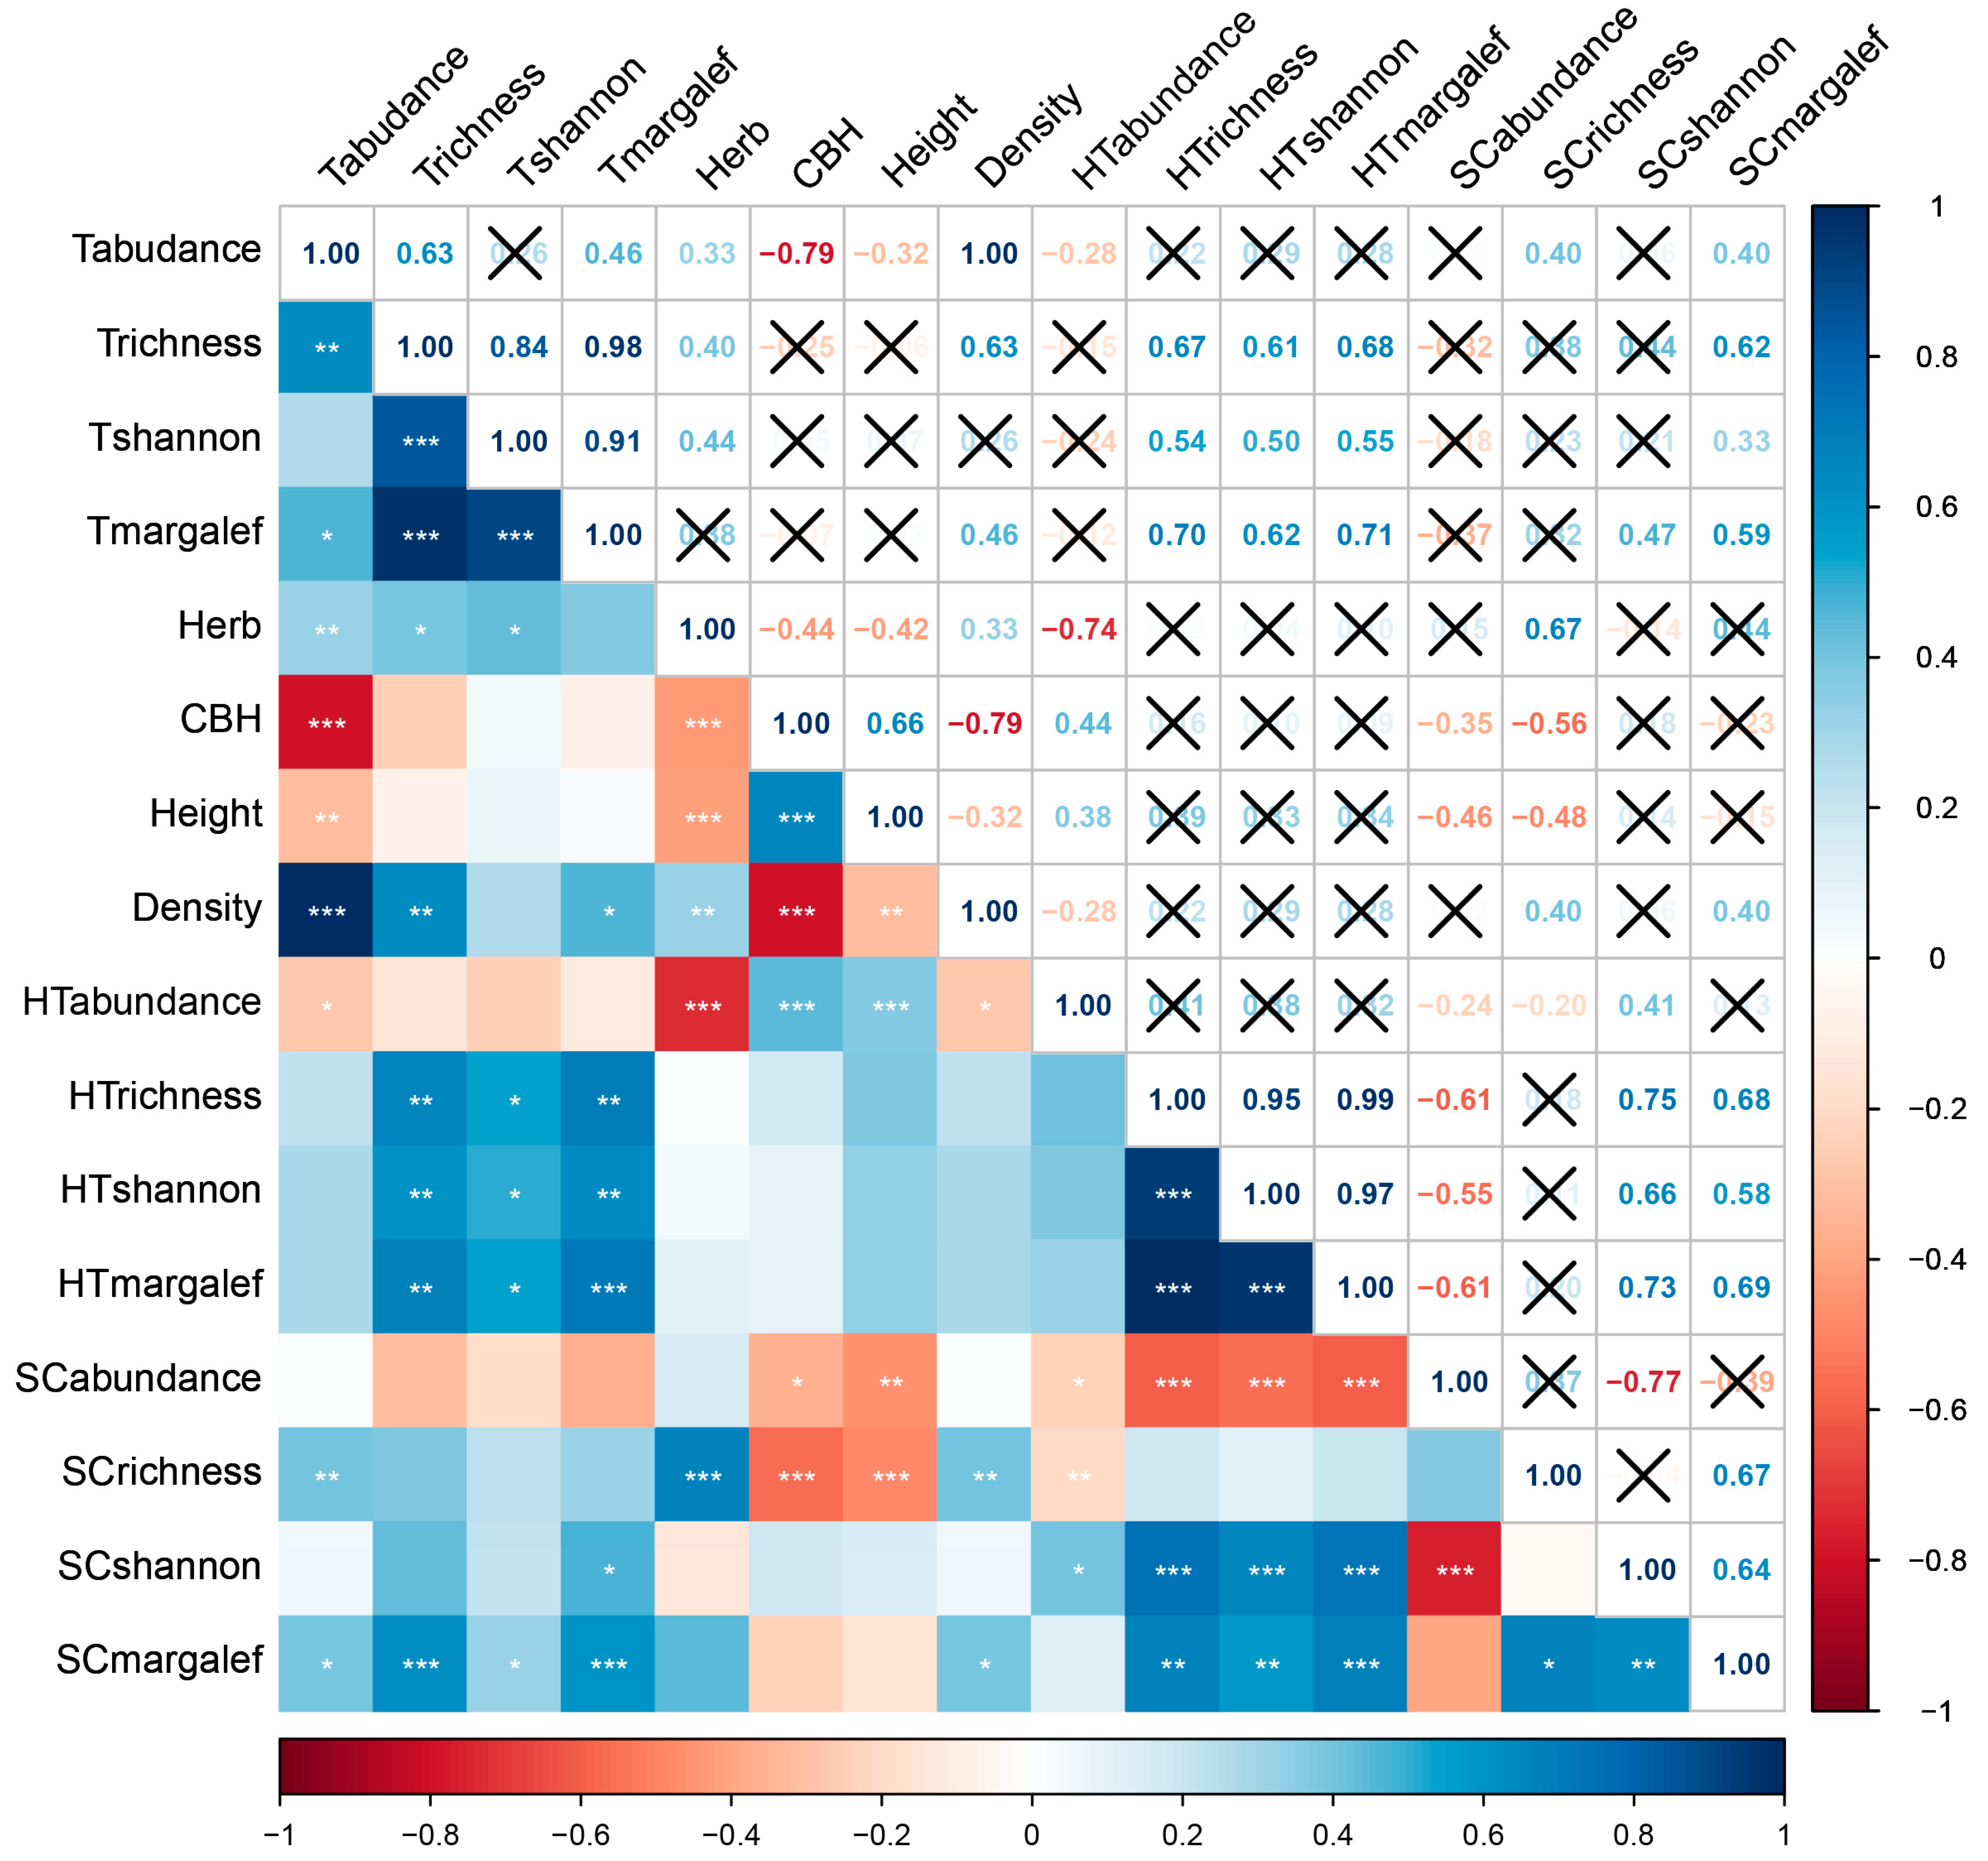
3.8. Relationships between Plants and Scolytinae Beetles

As shown in Figure 13, the average circumference at breast height, average tree height, host tree abundance, host tree species richness, host tree Shannon–Wiener diversity index, and host tree Margalef richness index values were negatively correlated with Scolytinae beetle abundance. Tree species abundance, average herbaceous layer coverage, and average tree density were positively correlated with Scolytinae beetle species richness, whereas the average circumference at breast height, average tree height, and host tree abundance were negatively correlated with Scolytinae beetle species richness. Tree and host tree Margalef richness index values, host tree abundance, host tree species richness, and host tree Shannon–Wiener diversity index values were positively correlated with Scolytinae beetle Shannon–Wiener diversity index values. Similarly, tree abundance, tree species richness, tree Shannon–Wiener diversity index values, tree Margalef richness index values, average tree density, host tree species richness, host tree Shannon–Wiener diversity index values, and host tree Margalef richness index values were positively correlated with Scolytinae beetle Margalef richness index values.

3.9. Associations between the Abundance of Dominant Plants and Dominant Scolytinae Beetles

As shown in Figure 14, the abundance of Psychotria asiatica was positively correlated with the abundance of Xylosandrus mancus, Xyleborinus andrewesi, Xylosandrus crassiusculus, Hypothenemus sp.2, and Xyleborinus artestriatus, whereas it was negatively correlated with Microperus perparvus abundance. Schima superba abundance was negatively correlated with that of Xylosandrus mancus, Hypothenemus sp.2, Euwallacea similis, Coccotrypes sp.2, and Xyleborus glabratus. Ardisia quinquegona abundance was negatively correlated with that of Microperus perparvus. While Phyllostachys edulis abundance was positively correlated with Coccotrypes sp.4 abundance, it was negatively correlated with Xylosandrus mancus, Hypothenemus sp.2, and Coccotrypes sp.2 abundance. Moreover, Heptapleurum heptaphyllum abundance was positively correlated with that of Coccotrypes sp.4, but negatively correlated with that of Xylosandrus mancus, Xyleborinus andrewesi, Hypothenemus sp.2, Xyleborinus artestriatus, Euwallacea similis, and Coccotrypes sp.2. Aporosa dioica was positively correlated with Xyleborinus andrewesi, Xylosandrus crassiusculus, Hypothenemus sp.2, and Xyleborinus artestriatus, while negatively correlated with the abundance of Microperus perparvus, and Xyleborus glabratus. Castanopsis chinensis abundance was positively correlated with that of Xylosandrus mancus, Euwallacea similis, Coccotrypes sp.2, and Xyleborus glabratus. Acronychia pedunculata abundance was significantly positively correlated with that of Xyleborinus andrewesi, Xylosandrus crassiusculus, Hypothenemus sp.2, and Xyleborinus artestriatus, whereas it was negatively correlated with Microperus perparvus abundance. Litsea rotundifolia abundance was positively correlated with the abundance of Xylosandrus mancus, Hypothenemus sp.2, Euwallacea similis, Coccotrypes sp.2, and Xyleborus glabratus.

3.10. Relationships between Climatic Factors and Scolytinae Beetle Abundance

While average temperature was found to affect Scolytinae beetle abundance, average relative humidity had no such effect (Figure 15). The Scolytinae beetle abundance increased in correspondence with increasing temperature. The slope of the regression line corresponding to this correlative relationship differed among study sites, with the highest slope in BY, followed by DH and WG. This suggests that the abundance of Scolytinae beetles is more responsive to temperature changes in temperature in the BY habitat, compared to the other two study areas.

4. Discussion

This study offers valuable insight into the spatiotemporal patterns of Scolytinae community diversity in three subtropical forest ecosystems in southern China. The identification of 78 Scolytinae species over the two seasons of the study suggests that the previous report indicating that Guangdong Province is home to only 50 species underestimated the true scolytine diversity in this region. Xyleborini was found to be the most abundant tribe in the present study, in line with prior work [6,39], as the biological characteristics of these beetles make them effective colonizers [8,40].
In the subtropical forests analyzed in this study, ambrosia beetles were found to be more common than bark beetles, in line with prior research [37,41,42], whereas the opposite tends to be true in dry forests [43]. Long rainy seasons can contribute to the growth of fungi on wood, providing an ideal setting for ambrosia beetle colonization.

4.1. Tree Composition Primarily Affects Bark Beetle Community Composition

One key finding of this study was that the scolytine communities in the analyzed subtropical forest habitats differed in both species composition and diversity. While all three of these habitats showed similar vegetation, in terms of tree density and average CBH, the actual tree species composition was observed to be highly dissimilar, with just 7.2–12% of tree species being shared. In contrast, significantly greater similarity was observed in terms of the Scolytinae species composition (41.0–50.0% shared species).
As ambrosia beetles have the potential to be less sensitive to plant diversity [44] and accounted for the majority of the captured scolytines in this study, moderate scolytine community similarity was observed across habitats (41.0–50.0% shared species), despite the markedly dissimilar tree communities, with the same also being true for the specific ambrosia beetle communities (46.4–53.6% shared species). As bark beetles are highly dependent on tree species, their community similarity levels were more closely related to tree diversity, with lower levels of similarity (27.3–40.9% shared species), as compared to ambrosia beetles. Unexpectedly, moderate similarity in the bark beetle communities was observed between the BY and DH sites, likely because these two areas share the most similar vegetation profiles (See Table 1).

4.2. Environmental Disturbances Reduce Scolytinae Beetle Diversity

Substantial variability was observed with respect to scolytine community diversity indices across the three analyzed forest habitats. The highest Shannon–Wiener diversity index, Margalef richness index, and species richness values were observed when analyzing DH study sites, whereas the Shannon–Wiener diversity index and the Margalef richness index were lowest in the BY study sites. Biodiversity and species richness can offer valuable insight into anthropogenic or environmental disturbances [45]. Given these findings and the information regarding pollution levels, environmental disturbances are likely linked to declines in Scolytinae beetle diversity, as has been shown previously for several other insect species [46,47].
BY is a suburban forest near Guangzhou that is affected by urbanization and is, thus, exposed to domestic sewage discharge and an extensive organic pollution of nearby bodies of water [48]. Daytime noise pollution levels in many areas also exceed the permitted limits [48]; as one of a wide range of disturbances associated with human activities, noise has been shown to have a detrimental impact on insect diversity [49]. However, as almost all areas in BY are subject to visitation or are adjacent to sightseeing areas, the scolytine communities in this area are likely to have suffered severe environmental disturbance. The decline of many insect populations can be attributed to environmental disturbances (including air, water, light, and heat pollution), habitat fragmentation, road hardening, and clustering of buildings [50]. Some insects, including scolytine beetles, select host plants according to physicochemical signals. Changes in the waxy texture, color, and odor of plant surfaces are induced by pollutants, thus adversely affecting their recognition as hosts by insects [51]. These complex disturbances may have caused the reduced diversity of Scolytinae species in BY.
Conversely, the Dinghu Mountain National Nature Reserve lies far from any overcrowded industrialized cities and is divided into three functional zones, namely the core, transition, and buffer zones. The site we investigated was situated in the core zone, which is closed to visitors and is used only for scientific observation and research. The relatively low fragmentation of the forest landscape in the core zone indicates a low level of disturbance [52], and its water and air quality are relatively good. For example, the individual contents and total concentrations of a variety of nonmethane hydrocarbons were higher in BY than in DH, especially the highly toxic compounds of the BTEX benzene series [53]. The total concentration of BTEX in BY was 4.8 times that in DH [53]. The overall surface water quality of DH is good and meets the quality standards of a Class I water source. The level of water pollution in the area is low, and most of the indicators are in line with drinking water sanitation standards [54]. Furthermore, environmental disturbances, such as ecotourism, can potentially adversely community diversity and structure through a number of processes, such as soil compaction, erosion, and habitat alteration, among many others [55]. The DH study site has low levels of tourism (with no tourism in the core zone), compared with the BY study site that experiences high levels of tourism, and it accordingly exhibited the highest levels of Scolytinae species diversity.

4.3. Scolytinae Beetle Diversity Exhibits Seasonal Variability

While most species identified in this study were more abundant during the rainy season, a limited subset was only detected during the dry season. In total, 12 species were only observed during the dry season, including nine rare species (singletons or doubletons) and Cryphalus dilutus, which likely exhibits a preference for the dry given that nine specimens were captured during this season (Table S4). Significant differences were observed, with respect to the three analyzed diversity indices (species abundance, species richness, Margalef richness index), indicating that scolytine species diversity is highly responsive to seasonal changes.
Although most species were present in both seasons in this study, just 49.2–60% of species were detected in both the rainy and dry seasons at a given study site. This suggested that the degree of response of the Scolytinae species composition varies in specific habitats. Consistent with the seasonal responses of these Solytinae populations was the fact that Scolytinae abundance was found to vary with temperature. Rising temperatures are associated with more rapid Scolytinae development and a shorter generation time [56], and average temperatures were, thus, positively correlated with abundance. Scolytinae species, and particularly, the predominate species, exhibit specific climatic and habitat preferences that contributed to differences in response levels across these study sites.
However, the study found that Scolytinae abundance was largely unaffected by the average relative humidity, in line with prior data showing the limited effects of precipitation on scolytine activity [42]. Seasonal influences also include a range of non-climatic environmental factors [6,43,57], and these would inevitably have complex interacting effects on the Scolytinae community.

4.4. Indicator Species Associated with Environmental Disturbances

While all indicator species were preferentially associated with particular forest habitats, no details regarding the relationships between the biology of the other nine species and the study sites were identified. Here, only three species were identified as significant indicators in the BY study sites, including Hypothenemus sp.2, Xyleborinus andrewesi, and Xyleborinus artestriatus. These species may, thus, offer value as indicators of serious environmental disturbances.
The genus Hypothenemus includes many species that are more abundant in ecologically disrupted areas, including those subject to monoculture or non-monoculture artificial planting relative to natural or native forests [58]. Other reports have suggested that several Hypothenemus and Xyleborinus species are more abundant in the centers and edges of new gaps relative to old ones [59]. As compared to the other two study sites, the BY study area was subject to frequent serious disturbances and was occupied by a large proportion of plantation land. This likely contributed to the development of new gaps, making it unsurprising that these indicator species were present in the BY study sites.

4.5. Plants Exhibit a Complex Relationship with Scolytinae Diversity

Differences in host plant Shannon–Wiener diversity indices among the three study areas were consistent with the Shannon–Wiener diversity indices for Scolytinae beetles across these study areas, with significant positive correlations having been detected between the two. The highest host plant Margalef richness index was observed in DH sample sites, followed by the WG and BY study sites, consistent with the trend observed for the Margalef richness indices for Scolytinae beetles. While these two sets of Margalef richness indices were significantly positively correlated, the actual degree of significance was not consistent for host plants and Scolytinae beetles. While the host plant Margalef richness index did not differ significantly between DH and WG study sites, there was a significant difference in the average herbaceous layer coverage at these sites and a corresponding difference in the Margalef richness index for Scolytinae beetles when comparing these study sites. This may suggest that the average herbaceous layer has some influence on the Margalef richness index for Scolytinae beetles.
While the species richness of host plants was unrelated to that of Scolytinae beetles, there was a significant positive correlation between the average herbaceous layer coverage and the beetle species richness. Differences in average herbaceous layer coverage across the three study sites were consistent with observed variations in Scolytinae beetle species richness. This suggests that the average herbaceous layer coverage has a clear impact on the species richness of Scolytinae beetles. Higher herbaceous layer coverage corresponds to higher levels of habitat heterogeneity under similar vegetation conditions, and such heterogeneity can strongly influence arthropod species diversity [60]. Increases in habitat heterogeneity contribute to the availability of a diverse array of ecological niches conducive to greater Scolytinae richness. Certain Scolytinae beetles have also been observed in woody herbs and ferns [4], with higher herbaceous layer coverage potentially increasing the odds of these beetle species coming into contact with appropriate herbaceous hosts.
An important aspect of these study results is the uncertainty regarding which factors shape Scolytinae species abundance. The correlation analyses suggested that Scolytinae species abundance was negatively correlated with average CBH and average plant height, whereas other studies have demonstrated an increased tree CBH corresponding to greater Scolytinae beetle abundance [59]. The discrepancy in these results may be attributable to differences in forest types, with larger tree CBH values likely being suitable for Scolytinae community habitation in dry forests, whereas the study sites in the present study are subject to a long rainy season and high average temperatures. Larger tree CBH and higher tree height can contribute to increased odds of finding resources for wood-dwelling species, with a corresponding increase in diversity [61]. This can also increase competition for Scolytinae beetles, contributing to smaller population sizes and lower abundance. Correlation analyses indicated that Scolytinae species abundance was also negatively correlated with all four host plant diversity indices. Diverse host plants may, thus, represent one important source of scolytine diversity, contributing to the greater spatial dispersal of these species, such that forming large populations and reaching high abundance levels may be difficult.
Woody plants including Fagaceae, Lauraceae, and Euphorbiaceae species have been identified as hosts for many Scolytinae species, as in the case of Xyleborus glabratus, which exhibit a clear preference for Lauraceae plants [62], whereas members of the Coccotrypes genus target Fagaceae plants [63] and Euphorbiaceae plants are known hosts for Xylosandrus crassiusculus, Xyleborinus andrewesi, and Xyleborinus artestriatus [62,64]. These findings are consistent with the results of the present correlation analyses regarding the dominant Scolytinae beetles and plants in this study. Moreover, Rubiaceae (Psychotria asiatica) and Rutaceae (Acronychia pedunculata) were herein found to be significantly positively correlated with almost half of all dominant Scolytinae species. Randia sp. is a Rubiaceae species that have been reported as a host plant for Xyleborinus andrewesi [64], making it highly likely that other Rubiaceae plants can similarly serve as hosts for Scolytinae beetles. Rutaceae species are also likely hosts for these beetles, as they release specific odors that are likely to attract these insects. However, further research focused on host plants is warranted to help improve pest control efforts.

5. Conclusions

This study was a two-season survey of Scolytinae communities across three habitats. The abundance, species richness, and species composition of the beetles were found to differ across forest habitat types and seasons. The lowest Shannon–Wiener diversity and the Margalef richness indices were observed in the BY study sites, suggesting the adverse influence of environmental disturbance on Scolytinae beetle diversity, although seven Scolytinae species preferred this habitat and were identified as indicator species of serious environmental disturbances.
The data also showed a diverse array of spatiotemporal distributions among the bark and ambrosia beetle guilds. Both the spatial and temporal factors interact to shape the observed patterns, with the main differences among guilds reflecting their use of resources. In summary, bark beetles are more sensitive to tree composition than ambrosia beetles. Further, while the average temperatures were positively correlated with scolytine abundance, there was little effect of the average relative humidity on abundance.
While the detection of spatial and temporal patterns in Scolytinae beetles is not an easy task, our study provides additional valuable information that can support ecosystem conservation and the monitoring and control of pest species.

Supplementary Materials

The following supporting information can be downloaded at: https://www.mdpi.com/article/10.3390/d15040499/s1, Table S1: Geography of the study sites; Table S2: The degree of anthropogenic disturbance at each survey site; Table S3: Tree species abundance in sampling plots in southern China; Table S4: Scolytinae species abundance measured across three study areas during two seasons [11,12,16,64,65,66,67].

Author Contributions

Conceptualization, Y.Y. and Z.L.; methodology, Y.Y., Q.H. and Z.L.; investigation, L.L. and W.L.; resources, Y.Y. and Z.L.; writing—original draft preparation, Y.Y. and L.L.; writing—review and editing, Y.Y., L.L., X.Y., W.L., Q.H. and Z.L.; visualization, Y.Y. and L.L.; project administration, Y.Y., X.Y. and Z.L.; funding acquisition, Y.Y., X.Y. and Z.L. All authors have read and agreed to the published version of the manuscript.

Funding

This research was funded by the following grants awarded to Y.Y.: The National Natural Science Foundation of China (grant numbers 32070471 and 31702039), the GDAS Special Project of Science and Technology Development (grant number 2021GDASYL-20210103049) and Guangzhou Basic and Applied Basic Research Foundation (grant number 2023A04J1483); X.Y.: the GDAS Special Project of Science and Technology Development (grant numbers 2020GDASYL-20200301003 and 2020GDASYL-20200102021).

Institutional Review Board Statement

Not applicable.

Data Availability Statement

The data presented in this study are available in this article and supplementary material here.

Acknowledgments

We thank two anonymous reviewers for their positive and helpful feedback on the earlier version of the manuscript.

Conflicts of Interest

The authors declare that they have no conflict of interest with the contents of this article.

References

  1. Hulcr, J.; Atkinson, T.H.; Cognato, A.I.; Jordal, B.H.; McKenna, D.D. Morphology, Taxonomy and Phylogenetics of Bark Beetles. Bark Beetles. In Biology and Ecology of Native and Invasive Species; Vega, F.E., Hofstetter, R.W., Eds.; Academic Press: London, UK, 2015; pp. 41–84. [Google Scholar]
  2. Dole, S.A.; Hulcr, J.; Cognato, A.I. Species-rich bark and ambrosia beetle fauna (Coleoptera, Curculionidae, Scolytinae) of the ecuadorian amazonian forest canopy. ZooKeys 2021, 1044, 797–813. [Google Scholar] [CrossRef] [PubMed]
  3. Pistone, D.; Gohli, J.; Jordal, B.H. Molecular phylogeny of bark and ambrosia beetles (Curculionidae: Scolytinae) based on 18 molecular markers. Syst. Entomol. 2018, 43, 387–406. [Google Scholar] [CrossRef]
  4. Kirkendall, L.; Biedermann, P.H.W.; Jordal, B.H. Evolution and diversity of bark and ambrosia beetles. Bark Beetles. In Biology and Ecology of Native and Invasive Species; Vega, F.E., Hofstetter, R.W., Eds.; Academic Press: London, UK, 2015; pp. 85–156. [Google Scholar]
  5. Wermelinger, B.; Flückiger, P.F.; Obrist, M.K.; Duelli, P. Horizontal and vertical distribution of saproxylic beetles (Col., Buprestidae, Cerambycidae, Scolytinae) across sections of forest edges. J. Appl. Entomol. 2007, 131, 104–114. [Google Scholar] [CrossRef]
  6. Hulcr, J.; Beaver, R.A.; Puranasakul, W.; Dole, S.A.; Sonthichai, S. A comparison of bark and ambrosia beetle communities in two forest types in Northern Thailand (Coleoptera: Curculionidae: Scolytinae and Platypodinae). Environ. Entomol. 2008, 37, 1461–1470. [Google Scholar] [CrossRef]
  7. Kalapanida-Kantartzi, M.; Milonas, D.N.; Buchelos, C.T.; Avtsiz, D.N. How does pollution affect insect diversity? A study on bark beetle entomofauna of two pine forests in Greece. J. Biol. Res. 2010, 13, 67–74. [Google Scholar]
  8. Martínez, M.; Cognato, A.I.; Guachambala, M.; Boivin, T. Bark and ambrosia beetle (Coleoptera: Curculionidae: Scolytinae) diversity in natural and plantation forests in Ecuador. Environ. Entomol. 2019, 48, 603–613. [Google Scholar] [CrossRef]
  9. Sanguansub, S.; Buranapanichpan, S.; Beaver, R.A.; Saowaphak, T.; Tanaka, N.; Kamata, N. Influence of seasonality and climate on captures of wood-boring Coleoptera (Bostrichidae and Curculionidae (Scolytinae and Platypodinae)) using ethanol-baited traps in a seasonal tropical forest of northern Thailand. J. Forest Res. 2020, 25, 223–231. [Google Scholar] [CrossRef]
  10. Cavaletto, G.; Faccoli, M.; Marini, L.; Spaethe, J.; Rassati, D. Effect of trap color on captures of bark- and wood-boring beetles (Coleoptera; Buprestidae and Scolytinae) and associated predators. Insects 2020, 11, 749. [Google Scholar] [CrossRef]
  11. Huang, F.S.; Lu, J. The Classification Outline of Scolytidae from China; Tongji University Press: Shanghai, China, 2015. [Google Scholar]
  12. Johnson, A.J.; Li, Y.; Mandelshtam, M.Y.; Park, S.; Lin, S.C.; Gao, L.; Hulcr, J. East Asian Cryphalus Erichson (Curculionidae, Scolytinae): New species, new synonymy and redescriptions of species. ZooKeys 2020, 995, 15–66. [Google Scholar] [CrossRef]
  13. Smith, S.M.; Beaver, R.A.; Cognato, A.I. A monograph of the Xyleborini (Coleoptera, Curculionidae, Scolytinae) of the Indochinese Peninsula (except Malaysia) and China. Zookeys 2020, 983, 1–442. [Google Scholar] [CrossRef]
  14. Cognato, A.I.; Smith, S.M.; Li, Y.; Pham, T.H.; Hulcr, J. Genetic variability among Xyleborus glabratus populations native to Southeast Asia (Coleoptera: Curculionidae: Scolytinae: Xyleborini) and the description of two related species. J. Econom. Entomol. 2019, 112, 1274–1284. [Google Scholar] [CrossRef] [PubMed]
  15. Lin, W.; Xu, M.F.; Gao, L.; Ruan, Y.Y.; Lai, S.C.; Xu, Y.; Li, Y. New records of two invasive ambrosia beetles (Curculionidae: Scolytinae: Xyleborini) to mainland China. BioInvas. Records 2021, 10, 74–80. [Google Scholar] [CrossRef]
  16. Yin, H.F.; Huang, F.S.; Li, Z.L. Economic Insect Fauna of China. Fasc. 29. Coleoptera: Scolytidae; Science Press: Beijing, China, 1984. [Google Scholar]
  17. Brockerhoffff, E.G.; Liebhold, A.M. Ecology of forest insect invasions. Biol. Invas. 2017, 19, 3141–3159. [Google Scholar] [CrossRef]
  18. Kirkendall, L.R.; Faccoli, M. Bark beetles and pinhole borers (Curculionidae, Scolytinae, Platypodinae) alien to Europe. Zookeys 2010, 56, 227–251. [Google Scholar] [CrossRef] [PubMed] [Green Version]
  19. Haack, R.A.; Rabaglia, R.J. Non-native bark and ambrosia beetles in the USA: Potential and current invaders. In Potential Invasive Pests of Agricultural Crops; Peña, J.E., Ed.; CAB International: Wallingford, UK, 2013; pp. 48–74. [Google Scholar]
  20. Brockerhoff, E.G.; Bain, J.; Kimberley, M.O.; Knizek, M. Interception frequency of non-native bark and ambrosia beetles (Coleoptera: Scolytinae) and relationship with establishment in New Zealand and worldwide. Can. J. Forest Res. 2006, 36, 289–298. [Google Scholar] [CrossRef]
  21. Chang, H.; Liu, Q.; Hao, D.; Liu, Y.; An, Y.; Qian, L.; Yang, X. DNA barcodes and molecular diagnostics for distinguishing introduced Xyleborus (Coleoptera: Scolytinae) species in China. Mito. DNA 2013, 25, 63–69. [Google Scholar] [CrossRef]
  22. Zhou, G.Y.; Wei, X.H.; Wu, Y.P.; Liu, S.G.; Huang, Y.H.; Yan, J.H.; Zhang, D.Q.; Zhang, Q.M.; Liu, J.X.; Meng, Z.; et al. Quantifying the hydrological responses to climate change in an intact forested small watershed in Southern China. Glob. Chang. Biol. 2011, 17, 3736–3746. [Google Scholar] [CrossRef]
  23. Qiao, Y.; Xiong, Y.M.; Wu, Q.H. Structure and diversity of soil macrofauna and mesofauna communities in the Baiyun Mountain, Guangzhou. Guangdong Landsc. Archit. 2018, 5, 17–20. [Google Scholar]
  24. Yang, G.; Liao, K.Y. Analysis on the development law of couapse and landslide disaster in zhongshan city. Quat. Sci. 2019, 39, 1246–1251. [Google Scholar]
  25. Liu, P.L.; Chen, L.; Liu, X.D.; Dai, Y.H.; Feng, Y.J.; Zhang, Q.M.; Chu, G.W.; Meng, Z. Temporal and spatial variability of soil moisture in a forest succession series in Dinghushan. Acta Ecol. Sin. 2021, 41, 1798–1807. [Google Scholar]
  26. Zhang, J.Q. The Characteristics of the Vegetation and It’s Stand Reforms in Bai Yun Mountain Scenic Spots and Historical Sites, Guangzhou. Ecol. Sci. 1995, 1, 31–39. [Google Scholar]
  27. Xiao, J. Present situation of Natural forest and ecological problem in Wugui Mountain. Trop. Forest. 1985, 4, 25–29. [Google Scholar]
  28. Wang, Y.H.; Chen, B.G.; Yao, S.Z. Vegetation landscape types and characteristics of Baiyunshan Scenic Spot, Guangzhou. J. South China Agric. Univ. 2003, 24, 56–59. [Google Scholar]
  29. Xu, C.Y.; Feng, Z.J.; Li, Z.K. An investigation of vascular plant resources at the Recreation Landscape Greenbelt on Western Side of Baiyun Mountain, Guangzhou. J. South China Agric. Univ. 2002, 23, 56–59. [Google Scholar]
  30. Wang, J.B.; Tan, Z.J.; Jiang, Q.C.; Gu, J.M.; Liu, C.K.; Zhang, Y.S. A catalogue of insects investigation from Wugui Mountain of Zhongshan Nature Reserve (I). Modern Agr. Sci. Technol. 2011, 13, 304–306. [Google Scholar]
  31. Wood, S.L. A reclassification of the genera of Scolytidae (Coleoptera). Great Basin Nat. Mem. 1986, 10, 1–126. [Google Scholar]
  32. Ugland, K.I.; Gray, J.S.; Ellingsen, K.E. The species-accumulation curve and estimation of species richness. J. Animal Ecol. 2003, 72, 888–897. [Google Scholar] [CrossRef] [Green Version]
  33. Li, Q. Species accumulation curves and its application. Chin. J. Appl. Entomol. 2011, 48, 1882–1888. [Google Scholar]
  34. Magurran, E.A. Measuring Biological Diversity; Blackwell Publishing: Oxford, UK, 2004. [Google Scholar]
  35. Jaccard, P. The distribution of the flora in the alpine zone.1. New Phytol. 1912, 11, 37–50. [Google Scholar] [CrossRef]
  36. Dufrêne, M.; Legendre, P. Species assemblages and indicator species: The need for a flexible asymmetrical approach. Ecol. Monographs 1997, 67, 345–366. [Google Scholar] [CrossRef]
  37. Hulcr, J.; Mogia, M.; Isua, B.; Novotny, V. Host specifificity of ambrosia and bark beetles (Col., Curculionidae: Scolytinae and Platypodinae) in a New Guinea rainforest. Ecol. Entomol. 2007, 32, 762–772. [Google Scholar] [CrossRef]
  38. Raffa, K.F.; Grégoire, J.C.; Lindgren, B.S. Natural History and Ecology of Bark Beetles. Bark Beetles. In Biology and Ecology of Native and Invasive Species; Vega, F.E., Hofstetter, R.W., Eds.; Academic Press: London, UK, 2015; pp. 1–40. [Google Scholar]
  39. Tanner, L.D.; Kanga, L.H.; Haseeb, M.; Whilby, L.; Onokpise, O.U. Efficacy of selected attractants for monitoring the populations of the redbay ambrosia beetle, Xyleborus glabratus Eichhoff (Coleoptera: Scolytidae) and other bark beetles in the Florida Panhandle. Curr. Investig. Agr. Curr. Res. 2018, 1, 1–7. [Google Scholar]
  40. Cognato, A.I.; Sari, G.; Smith, S.; Beaver, R.A.; Li, Y.; Hulcr, J.; Jordal, B.H.; Kajimura, H.; Lin, C.S.; Pham, T.H.; et al. The essential role of taxonomic expertise in the creation of DNA databases for the identifification and delimitation of Southeast Asian ambrosia beetle species (Curculionidae: Scolytinae: Xyleborini). Front. Ecol. Evol. 2020, 8, 27. [Google Scholar] [CrossRef] [Green Version]
  41. Beaver, R.A. Host specifificity of temperate and tropical animals. Nature 1979, 281, 139–141. [Google Scholar] [CrossRef]
  42. Abreu, R.L.S.; de Ribeiro, G.A.; Vianez, B.F.; Sales-Campos, C. Insects of the subfamily Scolytinae (Insecta: Coleoptera, Curculionidae) collected with pitfall and ethanol traps in primary forests of central Amazonia. Psyche 2015, 2012, 480520. [Google Scholar]
  43. Macedo-Reis, L.E.; de Novais, S.M.A.; Monteiro, G.F.; Flechtmann, C.A.H.; de Faria, M.L.; de Siqueira Neves, F. Spatio-Temporal distribution of bark and ambrosia beetles in a Brazilian tropical dry forest. J. Insect Sci. 2016, 16, 48. [Google Scholar] [CrossRef] [Green Version]
  44. Sittichaya, W.; Permkam, S.; Cognato, A.I. Species composition and flight pattern of Xyleborini ambrosia beetles (Col.: Curculionidae: Scolytinae) from agricultural areas in southern Thailand. Environ. Entomol. 2012, 41, 776–784. [Google Scholar] [CrossRef]
  45. Freedman, B. Environmental ecology: The impact of pollution and other stresses on ecosystem structure and function. Ecol. Econom. 1989, 4, 168–169. [Google Scholar]
  46. Perry, J.; Lojka, B.; Ruiz, L.G.Q.; Damme, P.V.; Houška, J.; Cusimamani, F.E. How natural forest conversion affects insect biodiversity in the Peruvian Amazon: Can agroforestry help? Forests 2016, 7, 82. [Google Scholar] [CrossRef] [Green Version]
  47. Noriega, J.A.; March-Salas, M.; Castillo, S.; García-Q, H.; Hortal1, J.; Santos, A.M.C. Human perturbations reduce dung beetle diversity and dung removal ecosystem function. Biotropica 2021, 3, 753–766. [Google Scholar] [CrossRef]
  48. Zhao, J.L. Study on Tourism Carrying Capacity Management in Bai-Yun Mountain Scenic Area. Master’s Thesis, Guangzhou University, Guangzhou, China, 2011. [Google Scholar]
  49. Senzaki, M.; Kadoya, T.; Francis, C.D. Direct and indirect effects of noise pollution alter biological communities in and near noise-exposed environments. Proc. R. Soc. B 2020, 287, 20200176. [Google Scholar] [CrossRef] [PubMed] [Green Version]
  50. Ye, S.S.; Fang, Y.; Li, K. Impacts of urbanization process on insect diversity. Biodivers. Sci. 2013, 21, 260–268. [Google Scholar]
  51. Renwick, J.A.A. Nonpreference mechanisms: Plant characteristics influencing insect behavior. In Plant Resistance to Insects: A Fundamental Approach; Smith, C.M., Ed.; Wiley-Interscience: New York, NY, USA, 1983; pp. 199–213. [Google Scholar]
  52. Peng, Y.; Zhou, K.; He, B.H.; Wang, J.L.; Wei, H. Analysis on Dynamic Changes of Forest Landscape in Different Zones of Dinghu Mountain Nature Reserve. For. Resour. Manag. 2011, 3, 76–81. [Google Scholar]
  53. Kuang, Y.W.; Wen, Z.D.; Zhou, G.Y.; Li, Z.A. Light atmospheric Nonmethane Hydrocarbons at areas around Guangzhou, China. J. Agro-Environ. Sci. 2003, 22, 570–573. [Google Scholar]
  54. Ouyang, X.J.; Zhou, G.Y.; Huang, Z.L.; Huang, M.H. Analysis on Runoff Water Quality in Dinghushan Biosphere Reserve. Acta Ecol. Sin. 2002, 22, 1373–1379. [Google Scholar]
  55. Noriega, J.A.; Zapata-Prisco, C.; García, H.; Hernández, E.; Hernández, J.; Martínez, R.; Santos-Santos, J.R.; Pablo-Cea, J.D.; Calatayud, J. Does ecotourism impact biodiversity? An assessment using dung beetles (Coleoptera: Scarabaeinae) as bioindicators in a tropical dry forest natural park. Ecol. Indic. 2020, 117, 106580. [Google Scholar] [CrossRef]
  56. Hlásny, T.; Krokene, P.; Liebhold, A.; Montagné-Huck, C.; Müller, J.; Qin, H.; Raffa, K.; Schelhaas, M.J.; Seidl, R.; Svoboda, M.; et al. Living with Bark Beetles: Impacts, Outlook and Management Options; European Forest Institute: Joensuu, Finland, 2019; Volume 8. [Google Scholar] [CrossRef]
  57. Wollmann, J.; Garcia, M.S.; Flechtmann, C.A.H.; Finkenauer, E.; Garcia, F.R.M. Scolytinae assemblage structure (Coleoptera: Curculionidae) in forested areas with Eucalyptus spp. in southern Rio Grande do Sul state. Cien. Florest. 2007, 27, 1167–1177. [Google Scholar] [CrossRef] [Green Version]
  58. Müller, J.A.; Andreiv, J. Caracterização da família Scolytidae (Insecta: Coleoptera) em três ambientes florestais. Cerne 2004, 10, 39–45. [Google Scholar]
  59. Ulyshen, M.D.; Hanula, J.L.; Horn, S.; Kilgo, J.C.; Moorman, C.E. Spatial and temporal patterns of beetles associated with coarse woody debris in managed bottomland hardwood forests. Forest Ecol. Manag. 2004, 199, 259–272. [Google Scholar] [CrossRef] [Green Version]
  60. Hou, X.Y.; Song, B.; Zhao, S.; Ding, S.Y. Effect of agro-landscape heterogeneity as affected by scale on diversity of Coleoptera in Fengqiu county in the lower reaches of the Yellow River. J. Ecol. Rural Environ. 2015, 31, 77–81. [Google Scholar]
  61. Grove, S.J. Saproxylic insect ecology and the sustainable management of forests. Ann. Rev. Ecol. Syst. 2002, 33, 1–23. [Google Scholar] [CrossRef]
  62. Lv, J.; Lai, S.C.; Tian, S.; Zhou, Q.; Xiao, L.F.; He, P.S.; Wang, J.G. Taxonomic studies on the Xyleborini beetles from Jiangxi Province, China. J. Environ. Entomol. 2018, 40, 840–852. [Google Scholar]
  63. Spennemann, D.H.R. Biology, ecology and distribution of the Date Stone Beetle, Coccotrypes dactyliperda (Coleoptera: Curculionidae). Zool. Middle East 2019, 65, 163–182. [Google Scholar] [CrossRef]
  64. Zhang, L. Taxonomy and Phylogeny of Xyleborini in Fujian Province; Jiangxi Agricultural University: Nangchang, China, 2021. [Google Scholar]
  65. Lv, J. Taxonomy and Phylogeny of Xyleborini (Coleoptera: Scolytinae) Beetles in Jiangxi Province. Master’s Thesis, Jiangxi Agricultural University, Nangchang, China, 2018. [Google Scholar]
  66. Zhou, Q. Species Investigation and DNA Barcoding of Rubberwood-Destroying Beetles of Scolytinae in Yunnan Province. Master’s Thesis, Jiangxi Agricultural University, Nangchang, China, 2020. [Google Scholar]
  67. Tian, S. Biodiversity and Molecular Identification of the Scolytinae Reinvestigation in Chongqing Area. Master’s Thesis, Jiangxi Agricultural University, Nangchang, China, 2018. [Google Scholar]
Figure 1. Study sampling areas in Guangdong Province in South China. Modified from http://211.159.153.75/index.html (accessed on 20 July 2022) and National Earth System Science Data Center https://www.geodata.cn/index.html (accessed on 20 July 2022).
Diversity 15 00499 g001
Figure 2. Tree abundance at the species level across 12 sample plots. BY1, BY2, BY3, and BY4 represent the Baiyun Mountain Scenic Spot (BY) sample sites. DH1, DH2, DH3, and DH4 represent the Dinghu Mountain Nature Reserve (DH) sample sites and WG1, WG2, and WG3 represent the Wugui Mountain Nature Reserve (WG) sample sites. The top 10 species are shown, with all other species designated as “Other species”. Different colors correspond to different species.
Diversity 15 00499 g002
Figure 3. Venn diagram showing exclusive and shared tree species across the three study areas. BY represents Baiyun Mountain Scenic Spot sample sites, while DH indicates Dinghu Mountain Nature Reserve sample sites and WG represents Wugui Mountain Nature Reserve sample sites. Numbers represent the numbers of tree species.
Diversity 15 00499 g003
Figure 4. Diversity index box plots for host trees in the three study areas. (A) Abundance of host trees; (B) Richness of host trees; (C) Shannon index of host trees; (D) Margalef index of host trees. Study sites are indicated by different colors, while different letters denote significant differences between study sites (Tukey’s HSD test, p < 0.05). Data that did not conform to the ANOVA criteria were analyzed with Kruskal–Wallis tests.
Diversity 15 00499 g004
Figure 5. Species accumulation curve corresponding to total Scolytinae beetle species richness across the 12 sampling plots. “+” denoted the point beyond the 95% confidence interval.
Diversity 15 00499 g005
Figure 6. Scolytinae beetle abundance at the species level in the 12 sampling plots. BY1, BY2, BY3, and BY4 represent Baiyun Mountain Scenic Spot (BY) sample sites. DH1, DH2, DH3, and DH4 represent Dinghu Mountain Nature Reserve (DH) sample sites and WG1, WG2, and WG3 represent Wugui Mountain Nature Reserve (WG) sample sites. The top 10 most abundant Scolytinae beetles are shown, while all others are designated as “Other species”. Different colors correspond to different species. (A) Relative abundance across both seasons. (B) Absolute abundance during the rainy season. (C) Absolute abundance during the dry season.
Diversity 15 00499 g006
Figure 7. Venn diagrams showing shared and exclusive species in the three study areas. Numbers correspond to the number of detected species. BY represents the Baiyun Mountain Scenic Spot sample site. DH represents the Dinghu Mountain Nature Reserve sample site and WG represents the Wugui Mountain Nature Reserve sample site. (A) Exclusive and shared Scolytinae species in the three study areas. (B) Exclusive and shared bark beetle species in the three study areas. (C) Exclusive and shared ambrosia beetle species in the three study areas.
Diversity 15 00499 g007
Figure 8. Venn diagrams showing shared and exclusive species from the Baiyun Mountain Scenic Spot. Numbers correspond to the number of identified species. (A) Exclusive and shared Scolytinae species in the rainy and dry seasons. (B) Exclusive and shared bark beetle species in the rainy and dry seasons. (C) Exclusive and shared ambrosia beetle species in the rainy and dry seasons.
Diversity 15 00499 g008
Figure 9. Venn diagrams showing shared and exclusive species from Dinghu Mountain in the National Nature Reserve. Numbers correspond to the number of identified species. (A) Exclusive and shared Scolytinae species in the rainy and dry seasons. (B) Exclusive and shared bark beetle species in the rainy and dry seasons. (C) Exclusive and shared ambrosia beetle species in the rainy and dry seasons.
Diversity 15 00499 g009
Figure 10. Venn diagrams showing shared and exclusive species from Wugui Mountain in the Zhongshan Nature Reserve. Numbers correspond to the number of identified species. (A) Exclusive and shared Scolytinae species in the rainy and dry seasons. (B) Exclusive and shared bark beetle species in the rainy and dry seasons. (C) Exclusive and shared ambrosia beetle species in the rainy and dry seasons.
Diversity 15 00499 g010
Figure 11. Diversity index box plots for Scolytinae beetles in the three study areas. (A) Abundance of Scolytinae beetles; (B) Richness of Scolytinae beetles; (C) Shannon index of Scolytinae beetles; (D) Margalef Index of Scolytinae beetles. Study sites are indicated by different colors, while different letters denote significant differences between study sites (Tukey’s HSD test, p < 0.05). Data that did not conform to the ANOVA criteria were analyzed with Kruskal–Wallis tests.
Diversity 15 00499 g011
Figure 12. Diversity index box plots for Scolytinae beetles in the rainy and dry seasons. (A) Abundance of Scolytinae beetles; (B) Richness of Scolytinae beetles; (C) Shannon index of Scolytinae beetles; (D) Margalef Index of Scolytinae beetles. Seasons are indicated by different colors. Differences between seasons were compared with Student’s t-tests with p < 0.05 as the significance threshold. Data that did not conform to the Student’s t-tests were analyzed with Kruskal–Wallis tests.
Diversity 15 00499 g012
Figure 13. Heatmap depicting the relationships among plants and Scolytinae beetles, analyzed by Pearson’s correlation analyses. Correlation coefficients are shown in individual squares, with a black “X” denoting a lack of any correlation. Red and blue are respectively used to depict negative and positive correlations. “*” indicated p < 0.05, “**” indicated p < 0.01, and “***” indicated p < 0.001. p < 0.05, p < 0.01, and p < 0.001, respectively, denote low, moderate, and high correlation strength.
Diversity 15 00499 g013
Figure 14. Heatmap depicting the relationships between dominant plants and dominant Scolytinae beetles, analyzed by Pearson’s correlation analyses. Correlation coefficients are shown in individual squares, with a black “X” denoting a lack of any correlation. Red and blue are, respectively, used to depict negative and positive correlations. “*” indicated p < 0.05, “**” indicated p < 0.01, and “***” indicated p < 0.001. p < 0.05, p < 0.01, and p < 0.001, respectively, denote low, moderate, and high correlation strength.
Diversity 15 00499 g014
Figure 15. Covariance analyses of the relationships between climatic factors and Scolytinae beetle abundance. (A) Relationships between average temperature and Scolytinae beetle abundance. (B) Relationships between average relative humidity and Scolytinae beetle abundance.
Diversity 15 00499 g015
Table 1. General vegetation conditions in the three study areas. Different letters denote significant differences between study sites (Tukey’s HSD test, p < 0.05). Data that did not conform to the ANOVA criteria were analyzed with Kruskal–Wallis tests.
General Vegetation Conditions BYDHWG
Abundance of trees47 ± 8.46 a53.5 ± 18.99 a37.25 ± 14.87 a
Richness of trees10.75 ± 3.49 a18.75 ± 4.60 a11 ± 3.54 a
Shannon–Wiener diversity index of trees1.84 ± 0.39 a2.48 ± 0.29 a1.78 ± 0.46 a
Margalef richness index of trees2.52 ± 0.85 a4.49 ± 1.02 a2.78 ± 0.86 a
Average CBH of trees18.91 ± 1.80 a21.14 ± 6.32 a28.06 ± 6.09 a
Average height of trees4.72 ± 0.47 a5.43 ± 0.98 a7.76 ± 1.22 a
Average coverage of herbaceous layer0.67 ± 0.21 ab0.77 ± 0.13 a0.29 ± 0.19 b
Average density of trees0.50 ± 0.08 a0.54 ± 0.19 a0.37 ± 0.15 a
Table 2. Abundance and frequency of occurrence (%) for Scolytinae species collected in the three study areas in Guangdong Province.
SpeciesBYDHWGTotal%Habitat Preference (IndVal)p
Phloeosinus sp.00110.03 //
Cryphalus dilutus90090.23 //
Cryphalus itinerans24115401.02 //
Cryphalus meridionalis00110.03 //
Cryphalus sp.12030.08 //
Hypothenemus birmanus01010.03 //
Hypothenemus sp.10715220.56 //
Hypothenemus sp.2991201112.83 BY(0.89)0.003
Coriacephilus sp.11418330.84 //
Eidophelus fulvipennis01010.03 //
Eidophelus sp.110230.08 //
Ernoporini sp.02020.05 //
Cyrtogenius luteus01120.05 //
Coccotrypes sp.131360671.71 //
Coccotrypes sp.251440952.42 //
Coccotrypes sp.310106260.66 //
Coccotrypes sp.43817511062.70 //
Coccotrypes sp.501010.03 //
Coccotrypes sp.630580.20 //
Coccotrypes sp.70010100.26 WG(1.00)0.007
Dryocoetiops moestus930120.31 BY(0.75)0.025
Dryocoetini sp.00440.10 //
Sueus niisimai22310350.89 //
Amasa schlichii10780.20 //
Ambrosiodmus asperatus71080.20 BY(0.88)0.02
Ambrosiodmus rubricollis2773370.94 //
Ambrosiophilus atratus03030.08 //
Ambrosiophilus cristatulus43180.20 //
Ambrosiophilus osumiensis30140.10 //
Anisandrus ursulus0100100.26 //
Arixyleborus cf. silvanus10010.03 //
Arixyleborus sp.00110.03 //
Beaverium magnus11130.08 //
Cnestus aterrimus41160.15 //
Cnestus mutilatus02020.05 //
Cyclorhipidion armiger04040.10 //
Cyclorhipidion beaveri01010.03 //
Cyclorhipidion bodoanum68162862.19 BY(0.79)0.036
Cyclorhipidion distinguendum8170250.64 //
Cyclorhipidion japonicum3130340.87 //
Cyclorhipidion cf. xeniolum01010.03 //
Diuncus haberkorni074110.28 //
Diuncus mucronatus3415220.56 //
Euwallacea andamanensis20020.05 //
Euwallacea fornicatus8414260.66 WG(0.75)0.049
Euwallacea interjectus4115200.51 //
Euwallacea minutus01010.03 //
Euwallacea semiermis00110.03 //
Euwallacea similis862131012.58 //
Euwallacea sp.1440180.46 //
Fraudatrix melas00110.03 //
Hadrodemius comans1100110.28 DH(0.91)0.008
Microperus alpha18295521.33 //
Microperus cf. chrysophylli10010.03 //
Microperus diversicolor7911812.07 BY(0.98)0.007
Microperus kadoyamaensis11620731.86 DH(0.85)0.008
Microperus perparvus232746962.45 //
Planiculus bicolor41365822.09 //
Xyleborinus andrewesi416156549612.65 BY(0.84)0.007
Xyleborinus artestriatus6528131062.70 BY(0.61)0.007
Xyleborinus ephialtodes08080.20 //
Xyleborinus cf. jianghuasuni20020.05 //
Xyleborinus octiesdentatus40260.15 //
Xyleborinus saxesenii23820511.30 //
Xyleborus affinis392313751.91 //
Xyleborus festivus01010.03 //
Xyleborus glabratus304516912.32 //
Xyleborus perforans176140.36 //
Xylosandrus nr. adherescens01010.03 //
Xylosandrus amputatus08080.20 //
Xylosandrus borealis10120.05 //
Xylosandrus compactus181114431.10 //
Xylosandrus crassiusculus11157742426.17 //
Xylosandrus discolor17182370.94 //
Xylosandrus germanus065110.28 //
Xylosandrus mancus9932644126132.16 //
Xyleborini sp.0010100.26 //
Scolytoplatypus sinensis0220220.56 DH(1.00)0.007
Disclaimer/Publisher’s Note: The statements, opinions and data contained in all publications are solely those of the individual author(s) and contributor(s) and not of MDPI and/or the editor(s). MDPI and/or the editor(s) disclaim responsibility for any injury to people or property resulting from any ideas, methods, instructions or products referred to in the content.

