Article

Analysis of the Genetic Diversity of the European Bison (Bison bonasus) Population in Lithuania

by
Romualdas Lapickis
1,
Loreta Griciuvienė
1,
Artūras Kibiša
1,
Indrė Lipatova
1,
Asta Aleksandravičienė
1,
Irma Ražanskė
1,
Marlena Wojciechowska
2,
Marta Kloch
2,
Wanda Olech
2 and
Algimantas Paulauskas
1,*
1
Faculty of Natural Sciences, Vytautas Magnus University, K. Donelaičio 58, LT-44248 Kaunas, Lithuania
2
Department of Animal Genetics and Conservation, Warsaw University of Life Sciences-SGGW, Ciszewskiego 8, 02-786 Warsaw, Poland
*
Author to whom correspondence should be addressed.
Diversity 2023, 15(3), 406; https://doi.org/10.3390/d15030406
Submission received: 7 February 2023 / Revised: 1 March 2023 / Accepted: 7 March 2023 / Published: 10 March 2023
(This article belongs to the Special Issue Conservation of Bison Populations – Achievements and Problems)

Abstract

:
The European bison is a species well known for its low genetic variability due to historical bottleneck incidents. Restoration of the European bison population in Lithuania began at the end of the 20th century, and the Lithuanian population was re-established with ten individuals from the Prioksko-Terrasny reserve in Russia and one free-roaming individual captured in Lithuania. This research focused on the genetic diversity and genetic structure of European bison in Lithuania based on microsatellite markers and mtDNA sequences. The results of the microsatellite analysis revealed that the Lithuanian population (n = 34) has a different genetic structure to individuals in Poland (n = 16), Germany (n = 10), and Sweden (n = 6). The analysis of the mtDNA sequences showed a low level of variation, with two haplotypes observed in the Lithuanian bison population. H1 was more frequent and was also found in Poland, Romania, and Russia. The results of this investigation show that individuals should be continuously genetically monitored, registering their migrations and relocations for the successful management of the species in Lithuania.

1. Introduction

The European bison (Bison bonasus), also known as wisent, is the largest herbivore in Europe, and its distribution used to stretch from Central and Eastern Europe to Western Asia [1]. By the beginning of the 20th century, the species had experienced a dramatic bottleneck. No free-living individuals were left in the wild or in semi-wild settings. Habitat selection and the behaviour of the European bison reintroduced from an enclosure to an anthropogenic landscape were based on a few individuals left in zoos and private collections [2]. Eleven Lowland (Bison bonasus bonasus) and just one Caucasian “M 100 KAUKASUS” (Bison bonasus caucasicus) wisents established two genetic lines of the European bison: the Lowland line (LB) and the Lowland-Caucasian line (LC) [1,3,4,5].
The European bison has near-threatened (NT) status on the IUCN Red List [6]. Despite the world population at the end of 2021 consisting of 9554 individuals, according to the European Bison Pedigree Book, of which 7266 were free roaming [7], the European bison has a low genetic variability and a high level of inbreeding [8,9]. It is possible that the low level of genetic variability is due to the small number of founders arising out of a serious bottleneck [10]. There are other issues too that go beyond the small number of founders: for example, around 90% of the males in the current population have a copy of the Y chromosome from its founder Plebejer, while two other male founders are under-represented [1,4,11,12].
The low genetic variability of the European bison population in Lithuania is not an exception. The European bison restoration project began in Lithuania in the 1970s, and just ten wisents (two males and eight females) from the Prioksko-Terrasny reserve in Russia were used to establish the population in the country. In addition, one individual was captured in Lithuania in 1971 and moved to the enclosure, and together they formed a group of 11 ancestors of today’s Lithuanian population [13]. Currently, there are three subpopulations in Lithuania: one in the district of Panevėžys (Figure 1, yellow) and two others in the districts of Kėdainiai (Figure 1, green and blue). Another subpopulation of 18 individuals migrated to Dzūkija from Belarus (the region of Grodno) in 2020 (Figure 1, orange). The Grodno population of the European bison was translocated from Poland (Białowieża) in 1998. The population reached its optimal number of individuals in 2011 (160 individuals). Since 2019, the population has continued to grow to 400 individuals [14]. The Lithuanian government has prepared a plan to manage the sustainability of the European bison population in Lithuania, and individuals are being relocated from the central part of the country (Panevėžys and Kėdainiai) to Dzūkija.
To maintain as high a genetic variability as possible, it is important to continually monitor the genetic status of the current population [15]. Moreover, many studies suggest that the effective population size should be increased because small subpopulations have a greater possibility of being affected by genetic drift, which may lead to a decrease in genetic variability and an increase in inbreeding levels [16,17,18]. Previous genetic studies revealed that the genetic composition of European bison may be complex due to historical events, such as their reintroduction from various locations, the unknown or mixed origin of herds, and breeding with domestic cattle [19]. Microsatellite markers are commonly applied for genetic variability analysis because they are abundant, require a small amount of DNA for the analysis, and show codominant inheritance [20,21]. Meanwhile, only a few studies have used mitochondrial DNA (mtDNA) markers to analyse the variability of maternal lineages [15,19,22]. The current study focuses on genetic diversity and genetic structure using two types of markers, nuclear microsatellite and the mitochondrial DNA D-loop, for the analysis of the European bison population in Lithuania. To prepare a future plan for the conservation of the European bison population in Lithuania, the genetic variability within and between herds should be analysed. These studies are crucial before making any decisions or actions to restore the genetic diversity of the Lithuanian bison population.

2. Materials and Methods

2.1. Sample Collection and DNA Isolation

The tissue samples for genetic research were collected from dead animals (muscle, n = 27) (e.g., killed by car or train accidents or natural mortality or culled due to illness or anatomical injuries) and from live animals (ear, n = 4) immobilised for identification purposes. All samples were collected under permits AAA 2019-04-01 No. 12 and 2020-03-09 No 14. The population of free-living bison, consisting of 276 individuals, was divided into 3 main herds based on the geographical territory. One herd of 61 bison (17 males, 32 females and 12 young ones) lives in an area of 17,572 ha in Panevėžys district. Two herds live in Kėdainiai district: the first herd of 151 bison (47 males, 71 females, and 33 young ones) live in an area of 13,035 ha; the second herd of 64 bison (18 males, 30 females, and 16 young ones) live in an area of 12,243 ha. Samples were taken from a total of 31 European bison from Lithuania’s three subpopulations in the period 2019–2022 (subpopulation Panevėžys 1, n = 10; subpopulation Kėdainiai 2, n = 14; subpopulation Kėdainiai 3, n = 7) (Figure 1). One ear tissue sample was collected from the new herd in Dzūkija (subpopulation Dzūkija 4), and two ear tissue samples were collected from the individuals at Kaunas Zoo, Lithuania (pedigree numbers: 14,137, 14,985). A further 32 samples (muscle, n = 17; blood, n = 15) for comparative analysis were randomly taken from the European Bison Gene Resource Bank (the collection of biological material) located at the Department of Animal Genetics and Conservation in the Warsaw University of Life Sciences. The tissue samples originated from Poland (Białowieża, n = 11; Bieszczady, n = 5), Germany (Damerower, n = 5; Hardehausen, n = 2; Springe, n = 2; Karlsruhe, n = 1), and Sweden (Avesta, n = 6).
Genomic DNA from tissue samples was extracted with the “Genomic DNA Purification Kit” (Thermo Fisher Scientific Baltics, Vilnius, Lithuania) using the standard protocol and following the manufacturer’s instructions. DNA from the blood was extracted using a GeneJet Whole Blood Genomic DNA Purification Kit (Thermo Fisher Scientific Baltics, Vilnius, Lithuania) according to the manufacturer’s instructions. The purity and concentration of the extracted DNA were determined using UV spectrophotometry. The DNA was then diluted to 100 ng/uL.

2.2. Microsatellite Analysis

All the samples were genotyped using 13 microsatellite markers (BOVIRBP, BTJAB1, BM6438, BM2830, TGLA122, ETH10, BM1225, BM1818, BM723, ETH121, TGLA53, TGLA227, and HEL9) recommended by the International Society of Animal Genetics (ISAG)—Food and Agriculture Organization (FAO) (Table 1) [23]. The polymerase chain reaction was performed in a 15 μl solution containing 1U DreamTaq DNA Polymerase, 1X DreamTaq Green buffer, 0.4 mM dNTP, 4 mM MgCl2, and 0.3 μM of each primer, ~100 ng DNA, and nuclease-free water up to the final volume. The markers were grouped into four multiplex reactions based on their size and annealing temperature. The first group (BOVIRBP, BTJAB1, BM6438, BM2830, and TGLA122) and second group (ETH10, BM1225, BM1818, and TGLA53) were subjected to the following thermocycling conditions: 95 °C denaturation for 5 min, 35 cycles at 95 °C for 45 s, 55 °C for 45 s and 72 °C for 30 s, and an extension for 10 min at 72 °C. The third group (BM723 and ETH121) was subjected to the following thermocycling conditions: 95 °C for 15 min, followed by three cycles at 84 °C for 2 min, 55 °C for 20 s, and 72 °C for 10 s, then 35 cycles at 94 °C for 15 s, 55 °C for 20 s, and 72 °C for 10 s, and finally at 72 °C for 30 min. The fourth group (TGLA227 and HEL9) was subjected to the following thermocycling conditions: 95 °C for 1 min followed by 30 cycles at 95 °C for 1 min, 56 °C for 1 min, and 72 °C for 1 min, and a final elongation at 72 °C for 5 min. The 1.5% agarose gel electrophoresis of the PCR products was used to determine the specificity and the amplification efficiency of each microsatellite primer. After determining the successfully amplified microsatellite loci, multiplex PCR amplification with primers labelled with different fluorescent dyes (FAM and CY) was carried out. All PCR products were genotyped through capillary electrophoresis (ABI 3100 Genetic Analyzer, Applied Biosystems, Waltham, MA, USA), and the GeneScanTM-500 LIZ size standard (Applied Biosystems, Waltham, MA, USA) was used as the internal standard. The resulting fragment sizes were read using GeneMapper™ 6.0 (Applied Biosystems, Foster, CA, USA) software.

2.3. mtDNA Analysis

Sequencing of the mtDNA was performed for samples collected from Lithuania (n = 31). An 884 bp fragment of the mtDNA control region was amplified using the primers (FBIS F 5′-CCCCTTCCATTAGATCACGA-3′ and RBISR 5′-CGCCGTACTCCTGTTADCTT-3′) [22]. PCR was performed in 20 μL total volume containing 1X PCR Master Mix buffer (Thermo Fisher Scientific Baltics, Vilnius, Lithuania), 0.16 pmol of each primer, and 50 ng of template DNA. The cycling parameters were an initial denaturation step at 95 °C for 5 min, followed by steps at 94 °C for 1 min, 61 °C for 1 min, and 72 °C for 1 min. This cycle was repeated 30 times, followed by 4 min of a final extension at 72 °C. The PCR products were visualized on 1.5% agarose gel stained with ethidium bromide. DNA was extracted using the GeneJET™ Gel Extraction Kit (Thermo Fisher Scientific Baltics, Vilnius, Lithuania) according to the manufacturer’s instructions. Purified PCR products were sent to a sequencing service (Macrogen, the Netherlands).

2.4. Data Analysis

Genetic diversity was analysed by locus. Allele frequencies, the number of private alleles, observed heterozygosity (Ho), expected heterozygosity (He), and inbreeding coefficient (Fis) were calculated using GenAlEx version 5.5 software [24]. An allele was considered to be a private allele when it was found only in a single population, but was absent in others. To evaluate the genetic divergence between populations, Principal Coordinates Analysis (PCoA) based on Nei’s genetic distances was conducted using GenAlEx software. The genetic structure was analysed by conducting Bayesian cluster analysis with a Markov chain algorithm (MCMC) for 100,000 iterations with 100,000 replications, repeating each assumed value of K (1–10) ten times using STRUCTURE version 2.3.4 [25]. To find the most probable number of clusters, the ad hoc statistic ∆K was calculated using the Evanno method [26] implemented in STRUCTURE HARVESTER, version 0.6.94 [27]. Mean posterior probability (LnP(D)) was considered in order to determine the number of clusters within the dataset.
The obtained mtDNA sequences were edited, and then aligned with each other and with the previously published sequences in GenBank by using BLASTn and ClustalW computer algorithms implemented in the MegaX software package [28]. The representative samples obtained in this study were submitted to the GenBank database under accession numbers OQ442722–OQ442723. The phylogenetic tree of European bison mtDNA sequences was constructed by maximum likelihood method with the Tamura–Nei parameter model and bootstrap analysis of 1000 replicates. Numbers from the tree indicate bootstrap support values < 50% (not shown). mtDNA sequences were compared with previously published GenBank sequences of European bison under the accession numbers U34294, KY055664, EU272053-EU272055, KP866323, KP866326-KP866328, and HQ437665 (originating from Poland, Romania, and Russia). Sequences of Indian bison (Bos gaurus) (GenBank: MK770201 and MK584900) and cattle (Bos taurus) (GenBank: AB085920 and FN562624) were used for the outgroup. The software DnaSP version 6.12.03 was used to estimate the diversity parameters, including the number of haplotypes, haplotype, and nucleotide diversity [29].

3. Results

3.1. Microsatellite Genetic Diversity and Genetic Structure

A total of 66 European bison were successfully genotyped at 13 microsatellite loci, and a total of 47 alleles were detected. Two of the thirteen loci (BOVIRBP and TGLA227) were monomorphic in all the studied European bison. In total, 10 private alleles were found in the analysed individuals. Eight private alleles were found in the Lithuanian population, while one was found in the German one, and one was found in the Swedish one. Six private alleles were found with very low frequencies. The high-frequency private alleles (frequency rate ≥ 0.100) were found at three polymorphic microsatellite loci in Lithuania: BM6438 262 (0.190), BM723 146 (0.371), ETH121 204 (0.100), and 214 (0.217) (Table 2). One private allele (ETH121 194) was detected at a low frequency (0.083) in individuals from Sweden. The number of private alleles per population based on location varied due to the different number of samples (n) (Table 3). The mean number of alleles (Na) and expected heterozygosity (He) were highest for the individuals from Lithuania (Na = 2.91, He = 0.34) and lowest for those from Poland (Bieszczady) (Na = 2.10, He = 0.27). The values of Ho observed across all loci ranged from 0.23 to 0.32 (average, 0.29). The inbreeding coefficient across the analysed samples (Fis) was in the range of −0.148 to 0.026, with a mean of −0.076 (Table 3). Non-significant negative values of the inbreeding coefficient were identified for European bison from Lithuania.
In the structure analysis, LnP(D) and ∆K statistics were used to determine the most likely value of genetic cluster K. After plotting the results using STRUCTURE HARVESTER, the most probable number of clusters was obtained at the K = 2 value (Figure 2). However, since there are individuals from four different countries, the K = 4 value was also examined (Figure 3). The STRUCTURE analysis revealed that Lithuanian subpopulations tend to group into a separate genetic cluster and are highly genetically distinct from the other analysed European bison individuals. The Polish population from Białowieża has a strong structuring pattern, but a few individuals have German–Swedish structural patterns. The Polish population from Bieszczady is grouped with the German–Swedish cluster, but one individual shows structural relatedness with the Polish population from Białowieża. The STRUCTURE analysis at a K = 4 value showed that two individuals in Kaunas Zoo in Lithuania are more genetically related to the German–Swedish and Polish clusters (Figure 3). Furthermore, another individual from Dzūkija, which migrated from Belarus, has patterns similar to those of both the Lithuanian and Białowieża populations.
PCoA was also performed to provide the genetic structure among the studied European bison individuals. The first three principal coordinates explained 17.80%, 9.58%, and 8.48% of the total variance, respectively (Figure 4). Individuals from the populations in Germany and Sweden are more genetically related to each other, but still form separate genetic groups based on PCoA (Figure 4).

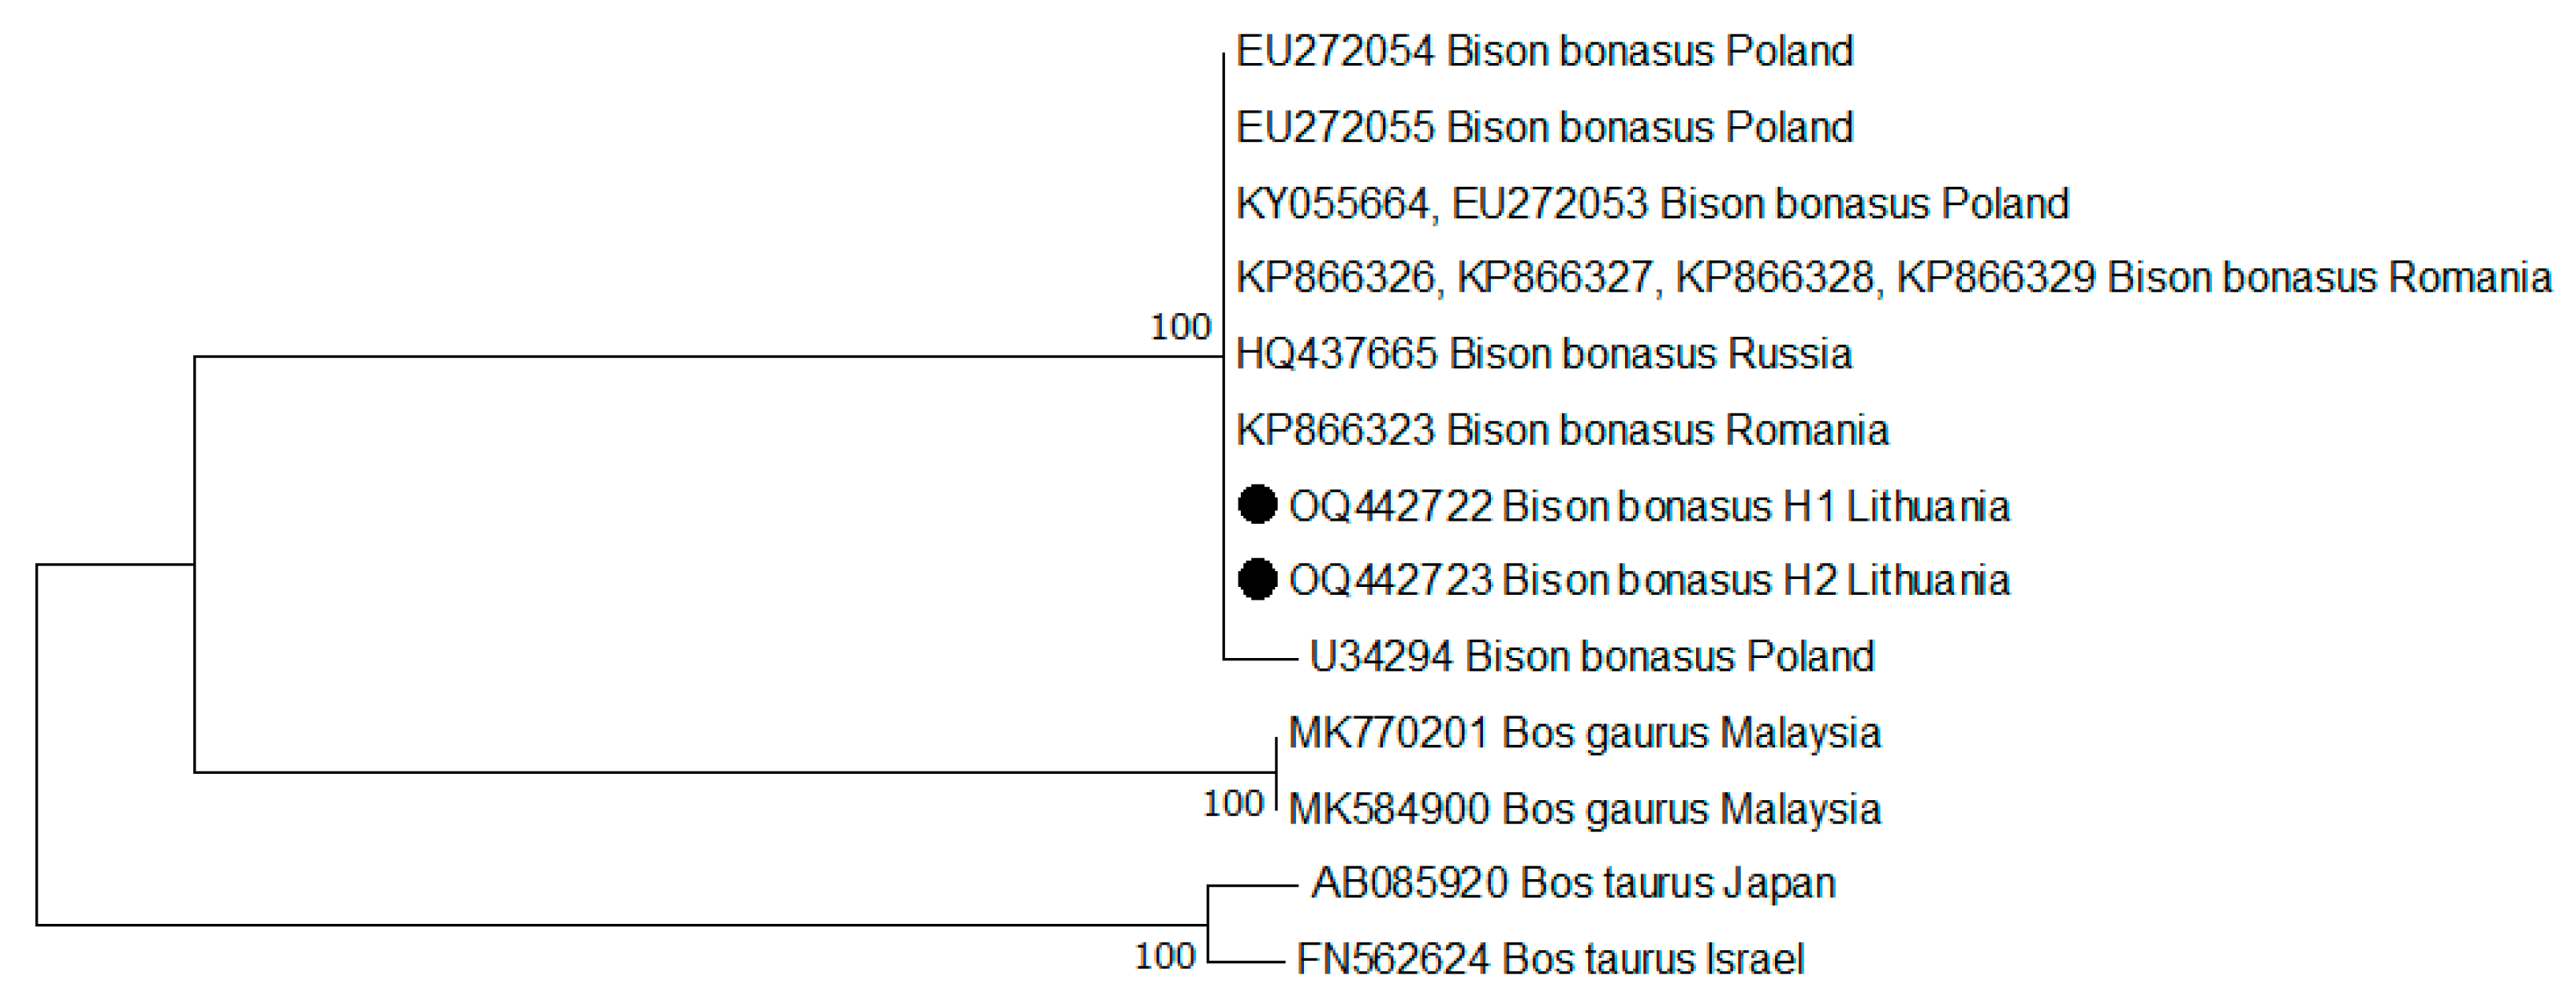
3.2. Genetic Variation Based on mtDNA

Thirty-one mtDNA sequences of the European bison from Lithuania revealed only two haplotypes. H1 was observed in 28 individuals, and H2 was observed in 3 individuals. The difference between the two haplotypes was a single base deletion at position 379. Haplotype diversity (Hd) among the 31 samples was estimated to be 0.1806, and nucleotide diversity (π) was 0.000.
The phylogenetic tree shows that the sequences obtained from Lithuanian bison clustered with the sequences from other countries (Figure 5). However, the genetic relationships were left unresolved due to the small number of variable sites. For this reason, the distribution of variable sites among the nucleotide sequences was determined by MEGAX software. Among all the analysed sequences, five haplotypes were defined by five variable sites (Table 4). Comparative analysis of the sequences from GenBank showed that Lithuanian individuals belonging to H1 (GenBank: OQ442722) were identical to those obtained in Poland (GenBank: KY055664, EU272053), Romania (GenBank: KP866326-KP866329), and Russia (GenBank: HQ437665). The Lithuanian individuals belonging to H2 (GenBank: OQ442723) were 100% identical to European bison from Poland (GenBank: EU272054).

4. Discussion

The genetic diversity of the European bison population in Lithuania has not previously been studied. However, a few studies have been performed on the genetic diversity of European bison due to the fact that this species is protected and the collection of material for any studies is complicated.
The results of this study showed that the Lithuanian population is genetically distinct from the Polish, German, and Swedish individuals. Two individuals from the Lithuanian population, whose samples were obtained from the zoo in Kaunas, Lithuania (pedigree numbers: 14,137 and 14,985), show their relatedness to the cluster from the Polish, German, and Swedish populations. An individual from the Dzūkija region, which borders Belarus (Figure 2 and Figure 3, indicated by an arrow) also has a strong genetic structure pattern of the Polish–German–Swedish genetic cluster (Figure 2, green). This is unsurprising because the majority of European bison herds in Belarus originate from Białowieża in Poland because of their reintroduction in 1952. In addition, Białowieża territories in Poland and Belarus were separated in 1981 by a border fence [30].
A small number of alleles per locus was observed in the Polish (NaMAX = 3.64) [12], Belarusian (NaMAX = 2.73) [31], and German (NaMAX = 2.36) [32] populations, and these values were close to that quantified in our study (NaMAX = 2.91). It should be noted that a low heterozygosity was found between three subpopulations in Lithuania (Kėdainiai district (1) and (2), and Panevėžys district), but the weighted average mean of the number of alleles was 2.91. Population genetic parameters might be influenced by differences in sample size. The analysis performed using STRUCTURE HARVESTER showed the most probable number of clusters: analysed individuals could be divided into two clusters (K = 2), with the first formed by the Lithuanian population and the other by individuals from Poland, Germany, and Sweden. A few bison from Lithuania are more similar to the second cluster: two individuals from Kaunas Zoo and one from the new herd in Dzūkija. One possible explanation for this could be the pedigree of the bison samples.
In this study, a negative coefficient of inbreeding in the European bison from Lithuania was observed. A possible explanation for such values could be a low number of alleles for a number of loci. It shows that heterozygous genotypes occur more often compared with the expected frequency of genotypes in accordance with the Hardy–Weinberg equilibrium. Similar findings have also been reported for European bison in earlier studies conducted in Belarus and Poland [31,33]. In general, the inbreeding coefficient for the European bison population has been estimated to be positive [34,35]. A high inbreeding coefficient could be associated with a small number of founders. It is also important to notice that inbreeding and heterozygosity can be related to increasing European bison susceptibility to vector-borne pathogens [36].
Despite a visible genetic difference between the populations in Lithuania and those in Poland, Germany, and Sweden, the results obtained in this study confirm that there is a very low genetic diversity among European bison. In several previous studies, a low level of genetic diversity has been confirmed in European bison, not only based on microsatellite markers, but also mitochondrial DNA [15,22,31,37,38] and whole genome single nucleotide polymorphism (SNP) markers [34,39].
In the current study, two mitochondrial haplotypes for European bison were found in Lithuania. The mtDNA analyses indicated the absence of nucleotide diversity (π = 0). These findings were not surprising because a small number of haplotypes was also identified in European bison populations from other countries [15,22]. Meanwhile, the American bison (Bison bison) shows higher levels of mtDNA diversity despite the fact that the population has undergone a bottleneck phenomenon during their history [19]. The high levels of mtDNA diversity could be explained by a higher number of founders from different American bison herds. As previously reported, the European bison populations were restored from a limited number of founders, which resulted in lower genetic diversity [15,33]. Studies of the European and American bison mtDNA revealed evidence of hybridization between bison and cattle (Bos taurus) [15,40,41,42]. Such cattle DNA introgression may influence the purity of bison herds.
To practise proper genetic management of the Lithuanian bison population, it is crucial to understand the actual genetic structure of all the subpopulations. The genetic difference between the Lithuanian bison subpopulations and other populations is probably due to isolation and/or their different founding groups. After releasing individuals in the 1970s, the bison population in Lithuania was isolated from other populations due to geographic distance, and no new animals were transported to Lithuania for many years. Such isolation and the small effective population number could have caused the differences observed due to low genetic diversity. The results of the current study show that the microsatellite markers used in this analysis could be applied to identify the population structure of European bison and determine their level of heterozygosity. The analysis of mtDNA sequences demonstrates low genetic diversity in the Lithuanian bison population. The reason for this is that mtDNA represents a single locus, and therefore it may require to be used with a larger number of markers.

5. Conclusions

This study demonstrates the loss of genetic diversity of the European bison in Lithuania based on the analysis of the microsatellite loci and mtDNA D-loop sequences. It should be noted that the genetic structure of the Lithuanian population has a specific genetic background because it was formed from individuals from the Prioksko-Terrasny reserve in Russia. In addition, the new population in the Dzūkija region is being formed, which based on data from 2020, consists of 18 individuals. This subpopulation has a different genetic structure given that it migrated from Grodno in Belarus in 2019. Currently, the Lithuanian government is relocating individuals to Dzūkija (seven European bison have already been relocated) from the central region (Panevėžys, Kėdainiai) and is planning to continue this relocation.

Author Contributions

Conceptualization, A.P. and A.K.; methodology, R.L., L.G., I.L., A.A. and I.R.; software, R.L., L.G., I.L., A.A. and I.R.; investigation, R.L., L.G., I.L., A.A. and I.R.; resources, A.P., A.K., M.W., M.K. and W.O.; writing—original draft preparation, R.L., L.G., A.K., I.L., A.A., I.R., M.W., M.K., W.O. and A.P.; writing—review and editing, R.L., L.G., A.K., I.L., A.A., I.R., M.W., M.K., W.O. and A.P. All authors have read and agreed to the published version of the manuscript.

Funding

Part of this research was funded by the European Regional Development Fund, project numbers 05.5.1-APVA-V-018-01-0006 and 09.3.3-LMT-K-712-22-0272.

Institutional Review Board Statement

The study was conducted with permission from the Environmental Protection Department under the Ministry of Environment (permit No. AAA 2019-04-01 to use protected species No. 12 in accordance with the protection plan for Bison bonasus L.).

Informed Consent Statement

Not applicable.

Data Availability Statement

The data presented in this study are available within the article.

Conflicts of Interest

The authors declare no conflict of interest.

References

  1. Pucek, Z.; Belousove, I.P.; Krasińska, M.; Krasiński, Z.A.; Olech, W. European Bison. Status Survey and Conservation Action Plan; IUCN: Gland, Switzerland, 2004. [Google Scholar]
  2. Krasińska, M.; Krasiński, Z.A. European Bison: The Nature Monograph; Mammal Research Institute Polish Academy of Sciences: Białowieża, Poland, 2007. [Google Scholar]
  3. Slatis, H.M. An analysis of inbreeding in the European bison. Genetics 1960, 45, 275–287. [Google Scholar] [CrossRef] [PubMed]
  4. Olech, W. The number of ancestors and their contribution to European bison (Bison bonasus L.) population. Ann. Wars. Agric. University. Anim. Sci. 1999, 35, 111–117. [Google Scholar]
  5. Olech, W. The changes of founders’ numbers and their contribution to the European bison population during 80 years of species’ restitution. Eur. Bison Conserv. Newsl. 2009, 2, 54–60. [Google Scholar]
  6. Plumb, G.; Kowalczyk, R.; Hernandez-Blanco, J.A. Bison bonasus. The IUCN Red List of Threatened Species 2020: e.T2814A45156279. Available online: https://www.iucnredlist.org/species/2814/45156279 (accessed on 7 October 2022).
  7. Raczyński, J.; Bolbot, M. European Bison Pedigree Book 2020; Białowieski Park Narodowy: Białowieża, Poland, 2020. [Google Scholar]
  8. Olech, W. The genetic variability within Bison bonasus species 90 years after bottleneck. In Restoration of Endangered and Extinct Animals; Słomski, R., Ed.; Poznan University of Life Sciences: Poznan, Poland, 2010; pp. 48–57. [Google Scholar]
  9. Wojciechowska, M.; Nowak, Z.; Gurgul, A.; Olech, W.; Drobik, W.; Szmatoła, T. Panel of informative SNP markers for two genetic lines of European bison: Lowland and lowland-caucasian. Anim. Biodivers. Conserv. 2017, 40, 17–25. [Google Scholar] [CrossRef] [Green Version]
  10. Olech, W.; Klich, D.; Perzanowski, K. An approach towards an improvement of genetic structure of a wisent (Bison bonasus) population in the Carpathians. Eur. Bison Conserv. Newsl. 2021, 13, 11–20. [Google Scholar]
  11. Tokarska, M.; Pertoldi, C.; Kowalczyk, R.; Perzanowski, K. Genetic status of the European bison Bison bonasus after extinction in the wild and subsequent recovery. Mamm. Rev. 2011, 41, 151–162. [Google Scholar] [CrossRef]
  12. Tokarska, M.; Bunevich, A.N.; Demontis, D.; Sipko, T.; Perzanowski, K.; Baryshnikov, G.; Kowalczyk, R.; Voitukhovskaya, Y.; Wójcik, J.M.; Marczuk, B.; et al. Genes of the extinct Caucasian bison still roam the Białowieza Forest and are the source of genetic discrepances between Polish and Belarusian populations of the European bison, Bison bonasus. Biol. J. Linn. Soc. 2015, 114, 752–763. [Google Scholar] [CrossRef] [Green Version]
  13. Balčiauskas, L. European Bison (Bison Bonasus) in Lithuania: Status and possibilities of range extension. Acta Zool. Litu. 1999, 9, 3–18. [Google Scholar] [CrossRef]
  14. Yanuta, G.; Klich, D.; Balcerak, M. Free living European bison population in Belarus. Eur. Bison Conserv. Newsl. 2021, 13, 57–72. [Google Scholar]
  15. Kostyunina, O.V.; Mikhailova, M.E.; Dotsev, A.V.; Zemlyanko, I.I.; Volkova, V.V.; Fornara, M.S.; Akopyan, N.A.; Kramarenko, A.S.; Okhlopkov, I.M.; Aksenova, P.V.; et al. Comparative Genetic characteristics of the Russian and Belarusian populations of wisent (Bison bonasus), North American Bison (Bison bison) and Cattle (Bos taurus). Cytol. Genet. 2020, 54, 116–123. [Google Scholar] [CrossRef]
  16. Daleszczyk, K.; Bunevich, A. Population viability analysis of European bison populations in Polish and Belarusian parts of Bialowieza Forest with and without gene exchange. Biol. Conserv. 2009, 142, 3068–3075. [Google Scholar] [CrossRef]
  17. Frankham, R.; Ballou, J.D.; Briscoe, D.A. Introduction to Conservation Genetics; Cambridge University Press: Cambridge, UK, 2010. [Google Scholar]
  18. Hartway, C.; Hardy, A.; Jones, L.; Moynahan, B.; Traylor-Holzer, K.; McCann, B.; Aune, K.; Plumb, G. Long-Term Viability of Department of the Interior Bison under Current Management and Potential Metapopulation Management Strategies; Natural Resource Report NPS/NRSS/BRD—2020/2097; National Park Service: Fort Collins, CO, USA, 2020.
  19. Davies, G.; McCann, B.; Jones, L.; Liccioli, S.; Penedo, M.C.; Ovchinnikov, I.V. Genetic variation of the mitochondrial DNA control region across plains bison herds in USA and Canada. PLoS ONE 2022, 17, e0264823. [Google Scholar] [CrossRef] [PubMed]
  20. De Barba, M.; Miquel, C.; Lobréaux, S.; Quenette, P.Y.; Swenson, J.E.; Taberlet, P. High-throughput microsatellite genotyping in ecology: Improved accuracy, efficiency, standardization and success with low-quantity and degraded DNA. Mol. Ecol. Resour. 2017, 17, 492–507. [Google Scholar] [CrossRef] [PubMed]
  21. Demir, E.; Karsli, T.; Balcioğlu, M.S. A comprehensive review on genetic diversity and phylogenetic relationships among native Turkish cattle breeds based on microsatellite markers. Turk. J. Vet. Anim. Sci. 2021, 45, 1–10. [Google Scholar] [CrossRef]
  22. Wójcik, J.M.; Kawałko, A.; Tokarska, M.; Jaarola, M.; Vallenback, P.; Pertoldi, C. Post-bottleneck mtDNA diversity in a free-living population of European bison: Implications for conservation. J. Zool. 2009, 277, 81–87. [Google Scholar] [CrossRef]
  23. FAO. Molecular Genetic Characterization of Animal Genetic Resources. FAO Animal Production and Health Guidelines. 2011. Available online: https://www.fao.org/3/i2413e/i2413e00.pdf (accessed on 7 October 2022).
  24. Peakall, R.; Smouse, P.E. GenAlEx 6.5: Genetic analysis in Excel. Population genetic software for teaching and research-an update. Bioinformatics 2012, 28, 2537–2539. [Google Scholar] [CrossRef] [Green Version]
  25. Pritchard, J.K.; Stephens, M.; Donnelly, P. Inference of Population Structure Using Multilocus Genotype Data. Genetics 2000, 155, 945–959. [Google Scholar] [CrossRef]
  26. Evanno, G.; Regnaut, S.; Goudet, J. Detecting the number of clusters of individuals using the software STRUCTURE: A simulation study. Mol. Ecol. 2005, 14, 2611–2620. [Google Scholar] [CrossRef] [Green Version]
  27. Earl, D.A.; vonHoldt, B.M. STRUCTURE HARVESTER: A website and program for visualizing STRUCTURE output and implementing the Evanno method. Conserv. Genet. Resour. 2012, 4, 359–361. [Google Scholar] [CrossRef]
  28. Kumar, S.; Stecher, G.; Li, M.; Knyaz, C.; Tamura, K. MEGA X: Molecular evolutionary genetics analysis across computing platforms. Mol. Biol. Evol. 2018, 35, 1547–1549. [Google Scholar] [CrossRef]
  29. Rozas, J.; Ferrer-Mata, A.; Sánchez-DelBarrio, J.C.; Guirao-Rico, S.; Librado, P.; Ramos-Onsins, S.E.; Sánchez-Gracia, A. DnaSP 6: DNA sequence polymorphism analysis of large datasets. Mol. Biol. Evol. 2017, 34, 3299–3302. [Google Scholar] [CrossRef] [PubMed]
  30. Kowalczyk, R.; Schmidt, K.; Jedrzejewski, W. Do fences or humans inhibit the movements of large mammals in Białowieża Primeval Forest? In Fencing for Conservation; Somers, M.J., Hayward, M.W., Eds.; Springer: New York, NY, USA, 2012; pp. 235–244. [Google Scholar]
  31. Homel, K.V.; Śliwińska, K.; Valnisty, A.A.; Nikiforov, M.E. New data on the genetic diversity of European bison Bison bonasus (Linnaeus, 1758) in Belarus. Theriol. Ukr. 2020, 19, 45–53. [Google Scholar] [CrossRef]
  32. Roth, T.; Pfeiffer, I.; Weising, K.; Brenig, B. Application of bovine microsatellite markers for genetic diversity analysis of European bison (Bison bonasus). J. Anim. Breed. Genet. 2006, 123, 406–409. [Google Scholar] [CrossRef] [PubMed]
  33. Tokarska, M.; Kawałko, A.; Wójcik, J.M.; Pertoldi, C. Genetic variability in the European bison (Bison bonasus) population from Białowieża forest over 50 years. Biol. J. Linn. Soc. 2009, 97, 801–809. [Google Scholar] [CrossRef] [Green Version]
  34. Tokarska, M.; Marshall, T.; Kowalczyk, R.; Wójcik, J.M.; Pertoldi, C.; Kristensen, T.N.; Loeschcke, V.; Gregersen, V.R.; Bendixen, C. Effectiveness of microsatellite and SNP markers for parentage and identity analysis in species with low genetic diversity: The case of European bison. Heredity 2009, 103, 326–332. [Google Scholar] [CrossRef] [Green Version]
  35. Machová, K.; Štruncová, P.; Calta, J.; Tichý, L.; Vostrý, L. Genealogical analysis of European bison population revealed a growing up population despite very low genetic diversity. PLoS ONE 2022, 17, e0277456. [Google Scholar] [CrossRef]
  36. Larska, M.; Krzysiak, M.K. Infectious disease monitoring of European bison (Bison bonasus). In Wildlife Population Monitoring; Ferretti, M., Ed.; IntechOpen: London, UK, 2019; pp. 248–269. [Google Scholar]
  37. Gralak, B.; Krasińska, M.; Niemczewski, C.; Krasiński, Z.A.; Żurkowski, M. Polymorphism of bovine microsatellite DNA sequences in the lowland European bison. Acta Theriol. 2004, 49, 449–456. [Google Scholar] [CrossRef]
  38. Luenser, K.; Fickel, J.; Lehnen, A.; Speck, S.; Ludwig, A. Low level of genetic variability in European bisons (Bison bonasus) from the Bialowieza National Park in Poland. Eur. J. Wildl. Res. 2005, 51, 84–87. [Google Scholar] [CrossRef]
  39. Wojciechowska, M.; Puchała, K.; Nowak-Życzyńska, Z.; Perlińska-Teresiak, M.; Kloch, M.; Drobik-Czwarno, W.; Olech, W. From wisent to the lab and back again—A complex SNP set for population management as an effective tool in European Bison conservation. Diversity 2023, 15, 116. [Google Scholar] [CrossRef]
  40. Yudin, N.S.; Kulikov, I.V.; Gunbin, K.V.; Aitnazarov, R.B.; Kushnir, A.V.; Sipko, T.P.; Moshkin, M.P. Detection of mitochondrial DNA from domestic cattle in European bison (Bison bonasus) from the Altai Republic in Russia. Anim. Genet. 2012, 43, 362. [Google Scholar] [CrossRef]
  41. Cronin, M.A.; MacNeil, M.D.; Vu, N.; Leesburg, V.; Blackburn, H.D.; Derr, J.D. Genetic variation and differentiation of bison (Bison bison) subspecies and cattle (Bos taurus) breeds and subspecies. J. Hered. 2013, 104, 500–509. [Google Scholar] [CrossRef] [PubMed] [Green Version]
  42. Herman, J.A.; Piaggio, A.J.; Halbert, N.D.; Rhyan, J.C.; Salman, M.D. Genetic analysis of a Bison bison herd derived from the Yellowstone National Park population. Wildl. Biol. 2014, 20, 335–343. [Google Scholar] [CrossRef]
Figure 1. Distribution of European bison subpopulations in Lithuania (adapted from the map on the official page of the State Service for Protected Areas under the Ministry of Environment of Lithuania).
Diversity 15 00406 g001
Figure 2. STRUCTURE analysis with a value of K = 2. 1: Lithuania, Panevėžys, 2: Lithuania, Kėdainiai (1), 3: Lithuania, Kėdainiai (2), 4: Poland, Białowieża, 5: Poland Bieszczady, 6: Sweden, and 7: Germany.
Diversity 15 00406 g002
Figure 3. STRUCTURE analysis with K = 4 value. 1: Lithuania, Panevėžys, 2: Lithuania, Kėdainiai (1), 3: Lithuania, Kėdainiai (2), 4: Poland, Białowieża, 5: Poland, Bieszczady, 6: Sweden, and 7: Germany.
Diversity 15 00406 g003
Figure 4. PCoA for seven subpopulations of the European bison based on 13 microsatellite markers.
Diversity 15 00406 g004
Figure 5. Maximum likelihood phylogenetic tree of the European bison based on the partial D-loop sequences of mtDNA.
Diversity 15 00406 g005
Table 1. Characteristics of the 13 microsatellite loci used in this study.
MarkerForward Primer Sequence (5′-3′)Reverse Primer Sequence (5′-3′)Fluorescent Dye
BOVIRBP5′-GTATGATCACCTTCTATGCTTC-3′5′-GCTTTAGGTAATCATCAGATAGC-3′6FAM
BTJAB15′-CATTAAGGGCTGGGATTCCT-3′5′-AGATTTCTGGAGGAGGCTCACAGCA-3′6FAM
BM64385′-TTGAGCACAGACACAGACTGG-3′5′-ACTGAATGCCTCCTTTGTGC-3′6FAM
BM28305′- ATGGGCGTATAAACACAGATG-3′5′-TGAGTCCTGTCACCATCAGC-3′CY3
TGLA1225′-CCCTCCTCCAGGTAAATCAGC-3′5′-AATCACATGGCAAATAAGTACATAC-3′6FAM
ETH105′-GTTCAGGACTGGCCCTGCTAACA-3′5′-CCTCCAGCCCACTTTCTCTTCTC-3′6FAM
BM12255′-TTTCTCAACAGAGGTGTCCAC-3′5′-ACCCCTATCACCATGCTCTG-3′6FAM
BM18185′-AGCTGGGAATATAACCAAAGG-3′5′-AAGTGCTTTCAAGGTCCATGC-3′CY3
TGLA535′-GCTTTCAGAAATAGTTTGCATTCA-3′5′-ATCTTCACATGATATTACAGCAGA-3′CY3
BM7235′-ACCCTTGGTTTTCTGCTGG-3′5′-CATCCTGTGTGAGTGTTGTGG-3′6FAM
ETH1215′-CCAACTCCTTACAGCAAATGTC-3′5′-ATTTAGAGCTGGCTGGTAAGTG-3′6FAM
HEL95′-CCCATTCAGTCTTCAGAGGT-3′5′-CACATCCATGTTCTCACCAC-3′6FAM
TGLA2275′-CGAATTCCAAATCTGTTAATTTGCT-3′5′-ACAGACAGAAACTCAATGAAAGCA′-3′CY3
Table 2. Allele frequency by the population of the selected three loci. Populations from Lithuania, Poland, (Białowieża and Bieszczady), Sweden, and Germany were analysed. Unique (private) alleles with a frequency rate of ≥0.100 are in bold.
LociAlleleLithuaniaPoland (Białowieża)Poland (Bieszczady)SwedenGermany
BM64382620.1900000
2640.7760.7270.4000.5000.500
2740.0340.2730.6000.5000.500
BM7231460.3710000
1480.6290.8640.6000.6670.650
15200.1360.4000.3330.350
ETH1211860.0500.0910.1000.5000.350
1920.6330.9090.9000.4170.650
1940000.0830
2040.1000000
2140.2170000
Table 3. Mean values, weighted mean values, and standard errors (SE) of the genetic diversity indices (number of alleles (Na), observed heterozygosity (Ho), expected heterozygosity (He), and inbreeding coefficient (Fis)) at 13 microsatellite loci among the European bison populations.
PopulationN NaHoHeFis
Lithuania31Mean2.910.320.34−0.038
SE0.590.050.050.102
Poland, Białowieża11Mean2.210.230.24−0.148
SE0.290.060.040.111
Poland, Bieszczady5Mean2.100.250.27−0.122
SE0.260.050.030.077
Sweden6Mean2.230.270.250.026
SE0.200.050.030.100
Germany10Mean2.390.300.30−0.098
SE0.260.050.050.095
Total63Weighted mean2.580.290.30−0.076
SE0.140.020.020.043
Table 4. Variable sites observed among mtDNA sequences of European bison from Lithuania and other countries. Dot indicates the same base; dash indicates the insertion/deletion base.
HaplotypeGenBank Accession NumbersNucleotide PositionCountry
35355381382465
H1OQ442722CCLithuania
KP866326, KP866327, KP866328, KP866329Romania
KY055664 EU272053Poland
HQ437665Russia
H2OQ442723Lithuania
EU272054Poland
H3EU272055CPoland
H4U34294GTPoland
H5KP866323ARomania
Disclaimer/Publisher’s Note: The statements, opinions and data contained in all publications are solely those of the individual author(s) and contributor(s) and not of MDPI and/or the editor(s). MDPI and/or the editor(s) disclaim responsibility for any injury to people or property resulting from any ideas, methods, instructions or products referred to in the content.

