Article

Impact of No-Tillage on Soil Invertebrate Communities in the Southern Forest Steppe of West Siberia: Preliminary Research

by
Ilya I. Lyubechanskii
1,*,
Elena V. Golovanova
2,
Roman Yu. Dudko
1,
Galina N. Azarkina
1,
Olga A. Rusalimova
3,
Ekaterina S. Samoylova
4,
Sergei V. Shekhovtsov
5 and
Pavel A. Barsukov
3
1
Institute of Systematics and Ecology of Animals, SB RAS, Frunze Str., 11, 630091 Novosibirsk, Russia
2
Research Laboratory of Systematics and Ecology of Invertebrates, Omsk State Pedagogical University, Tukhachevsky Embankment 14, 644099 Omsk, Russia
3
Institute of Soil Science and Agrochemistry SB RAS, Lavrentiev Avenue 8/2, 630090 Novosibirsk, Russia
4
Department of Soil Science and Soil Protection, Faculty of Agrobiology, Food and Natural Resources, Czech University of Life Sciences Prague, Kamýcká 129, CZ-16500 Prague, Czech Republic
5
Institute of Cytology and Genetics SB RAS, Prospekt Lavrentyeva 10, 630090 Novosibirsk, Russia
*
Author to whom correspondence should be addressed.
Diversity 2023, 15(3), 402; https://doi.org/10.3390/d15030402
Submission received: 29 December 2022 / Revised: 6 March 2023 / Accepted: 8 March 2023 / Published: 10 March 2023
(This article belongs to the Special Issue Soil Invertebrate Diversity, Ecology and Zoogeographic Structure)

Abstract

:
The aim of our study is to assess changes in soil macroinvertebrate biodiversity when conventional tillage (CT) is replaced by no-tillage (NT) in agroecosystems of the southern part of the West Siberian forest steppe. The research was conducted in the Novosibirsk region at the end of May 2017, May 2018, and in June 2018. The agricultural plots with CT and NT were located close to each other on identical soils, at a distance of about 200 m from the nearest forest shelterbelts. NT technology has been applied on the experimental plot since 2007. Sampling of invertebrates was conducted in two ways, namely soil sampling and pitfall trapping. The majority of basic physicochemical properties of soil were the same or similar between the CT and NT plots. However, depending on the type of tillage, different soil invertebrate communities had already developed in the control (CT) and experimental (NT) plots during this time. The community of the CT plot includes a large number of flying predatory Carabidae species typical of early successional stages (such as Bembidion properans and B. quadrimaculatum, Poecilus spp.) and phytophages, i.e., larvae of Elateridae. The NT plot has significantly higher density and species richness of earthworms (Eisenia nordenskioldi and synanthropic E. fetida in the NT plot versus one individual of E. nordenskioldi in the CT plot). The NT plot has a significantly richer and more abundant assemblage of spiders (especially in spring) and a poor assemblage of insect predators (except for the superdominant ground beetle Poecilus cupreus and the subdominant P. versicolor in summer 2018). Large numbers of larvae of some carabids (e.g., Amara consularis) were found in the NT soil, suggesting that they complete a full life cycle in this habitat.

1. Introduction

No-till technology eliminates the need to mix soil and leave crop residues on the soil surface. In addition to the absence of plowing costs, no-tillage has a positive effect on the environment. Over the past two decades, no-tillage technology has been actively spreading in Siberia, especially in West Siberia.
The biodiversity of soil biota is closely related to the concept of “soil health”, which has been widely used in recent years, and the ability of soil to provide a variety of ecological/biospheric functions, as well as utilitarian services. Because soil invertebrates are the most responsive to agricultural treatments, a comprehensive study of the abundance and composition of their communities is required to evaluate the effects of this particular technology [1].
It is generally accepted that no-tillage, compared with traditional technology, preserves the biological diversity of soil invertebrate, such as macroarthropods and earthworms [2,3], as well as microarthropods (soil mites and springtails) [4,5]. No-till increases the number of predatory invertebrates that contribute to pest control in agrocenoses [6,7]. This is largely a result of the more complex structure of the soil profile that develops in no-till fields, and because of the greater amount of plant residue that serves as both food resource and shelter for many invertebrates [8]. At the same time, no-till farming sometimes requires more intensive application of plant protection chemicals, which can have a negative impact on the fauna of such agroecosystems [9] and on the rate of degradation of plant residues [10]. Different invertebrate groups have been shown to respond differently to the transition to no-tillage from conventional tillage; for example, earthworms increase their numbers [2], while collembolans may not change [11]. In the southern part of European Russia (Stavropol Region), it was shown that the density of Myriapoda, spiders, beetles, and earthworms for no-till variants was always higher than for plowed fields, regardless of crop type [1].
In Siberia, sporadic studies on this subject have been performed so far. In the forest steppe of West Siberia, it was found that the tillage practice had no significant effect on aphidophagous predatory insects, inhabiting wheat stalks, such as lacewings (Chrysopidae, Neuroptera), and bugs from the family Nabidae (Hemiptera) [12,13].Therefore, the aim of our study is to assess changes in soil invertebrate biodiversity when conventional tillage is replaced by no-till in agroecosystems in the southern part of the West Siberian forest steppe, i.e., where no-till has been most commonly practiced in recent years.

2. Object of Study, Material and Methods

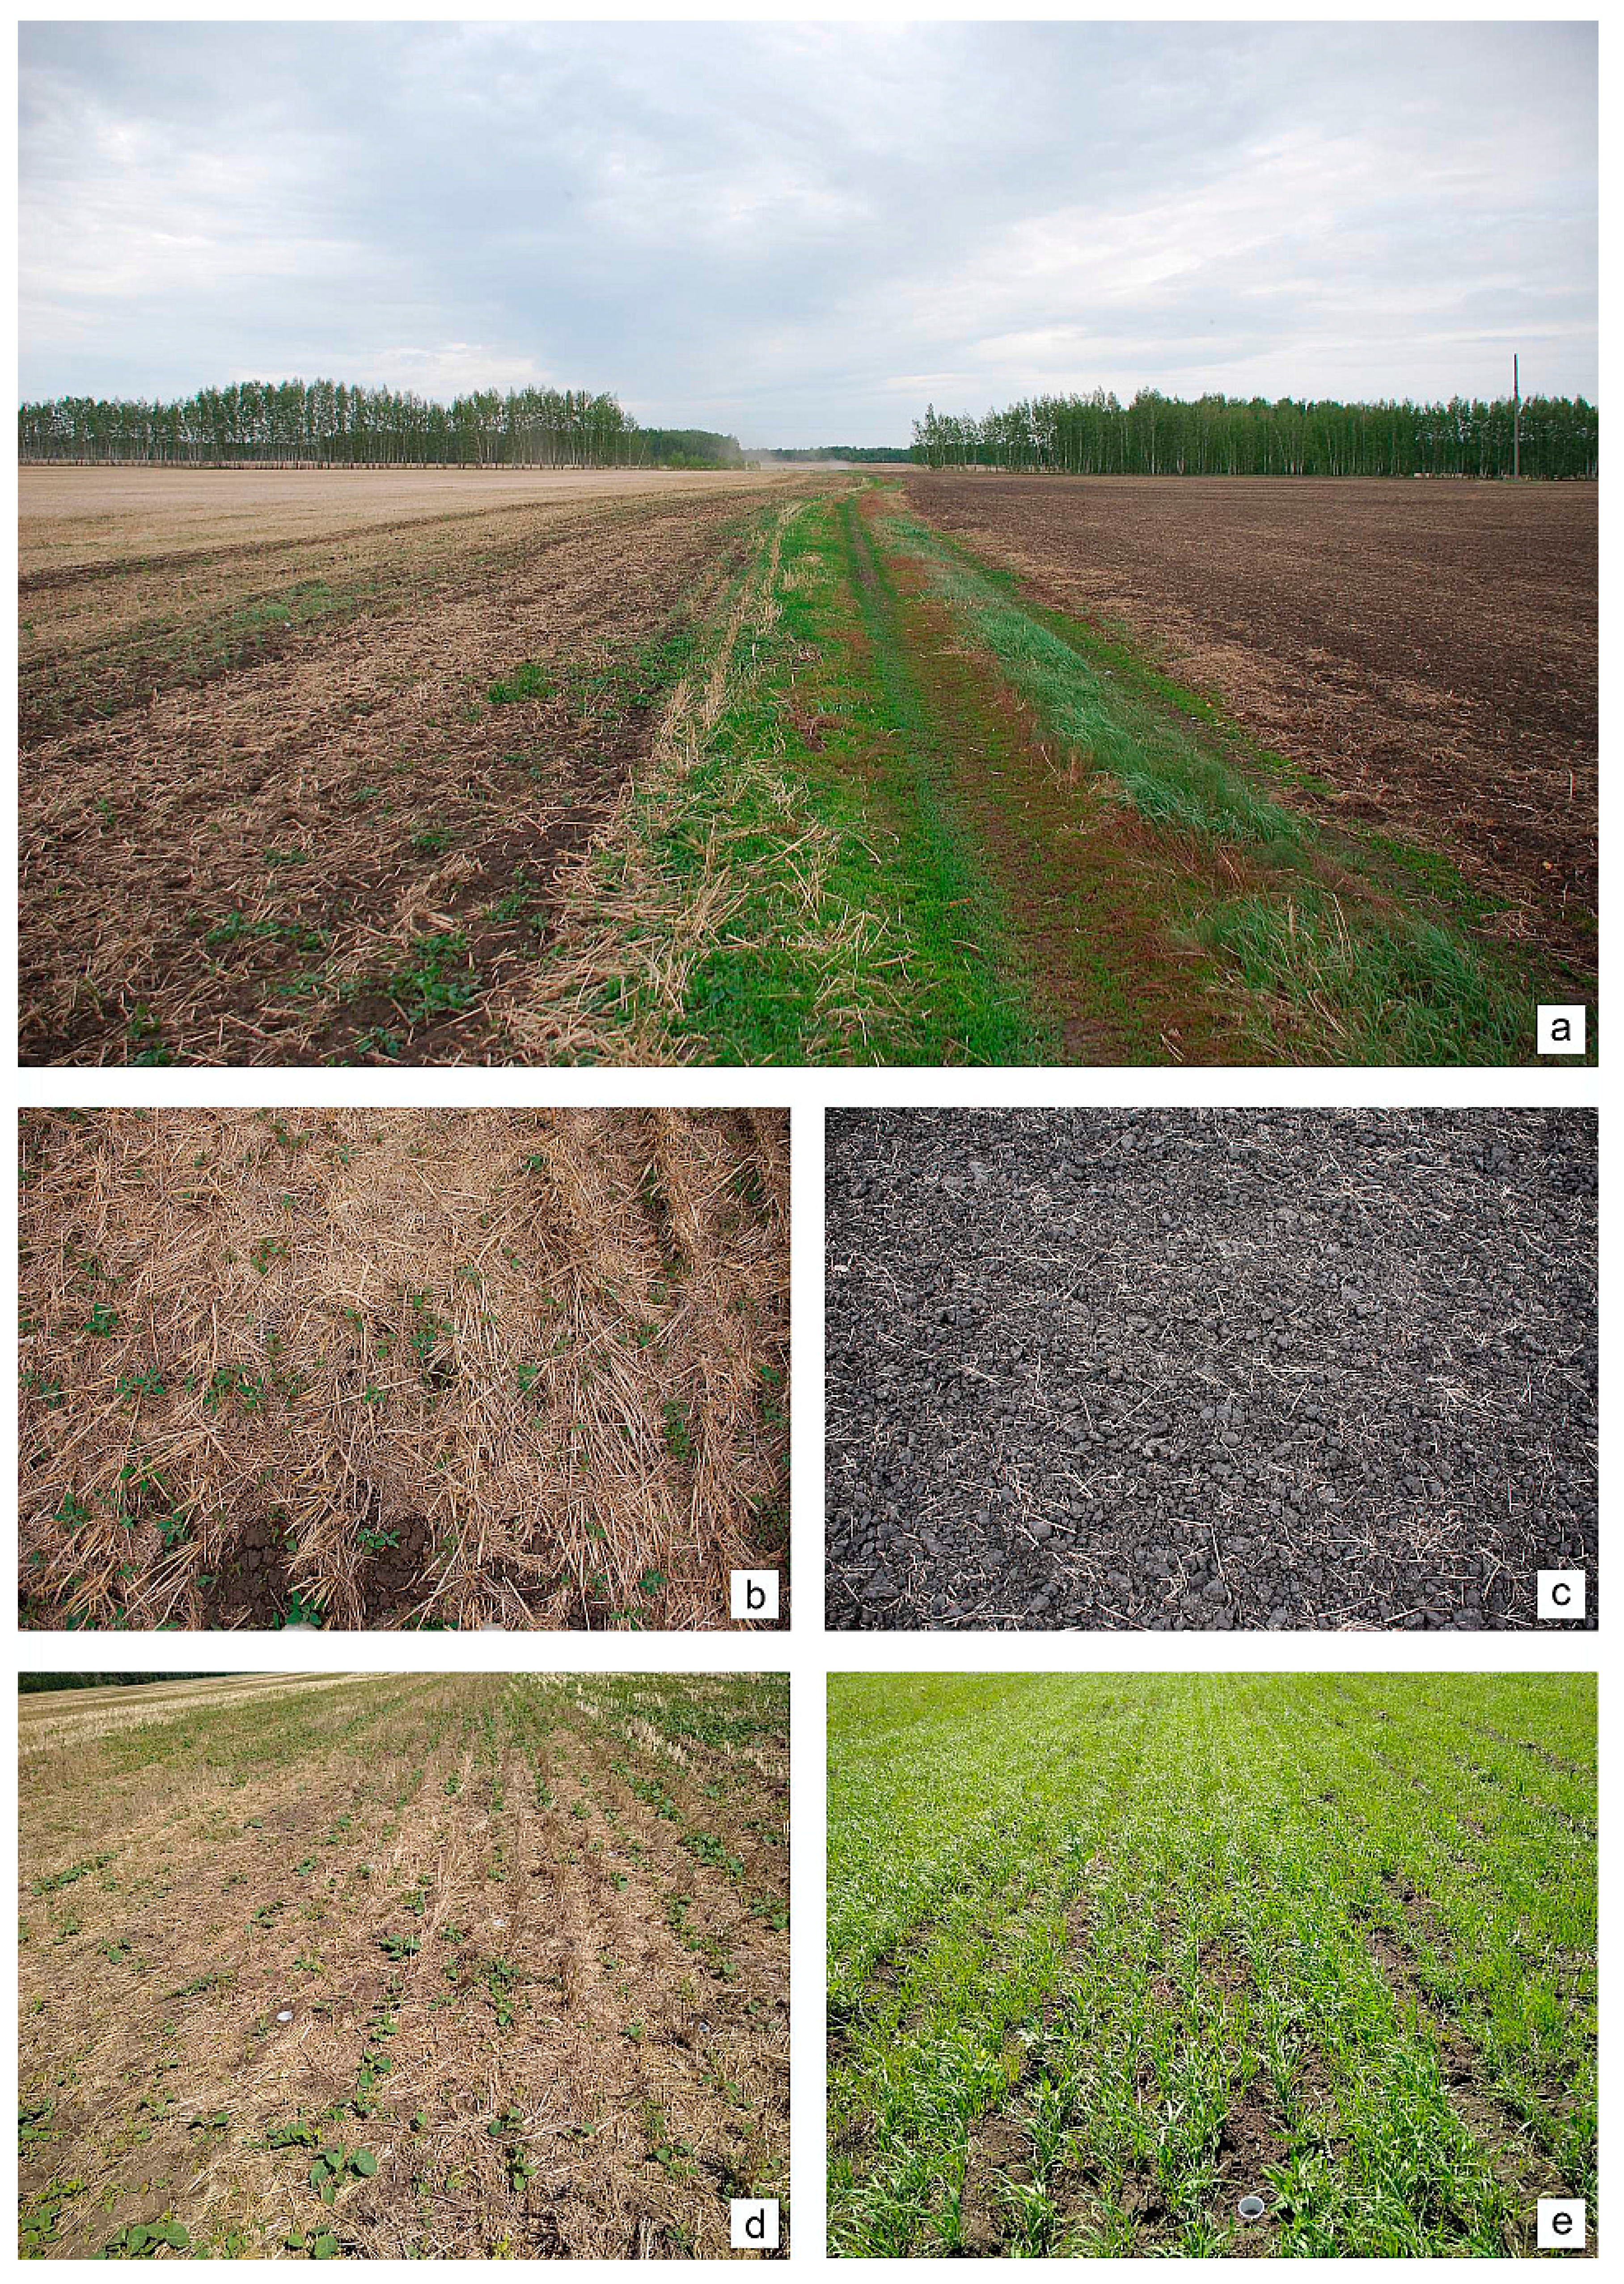
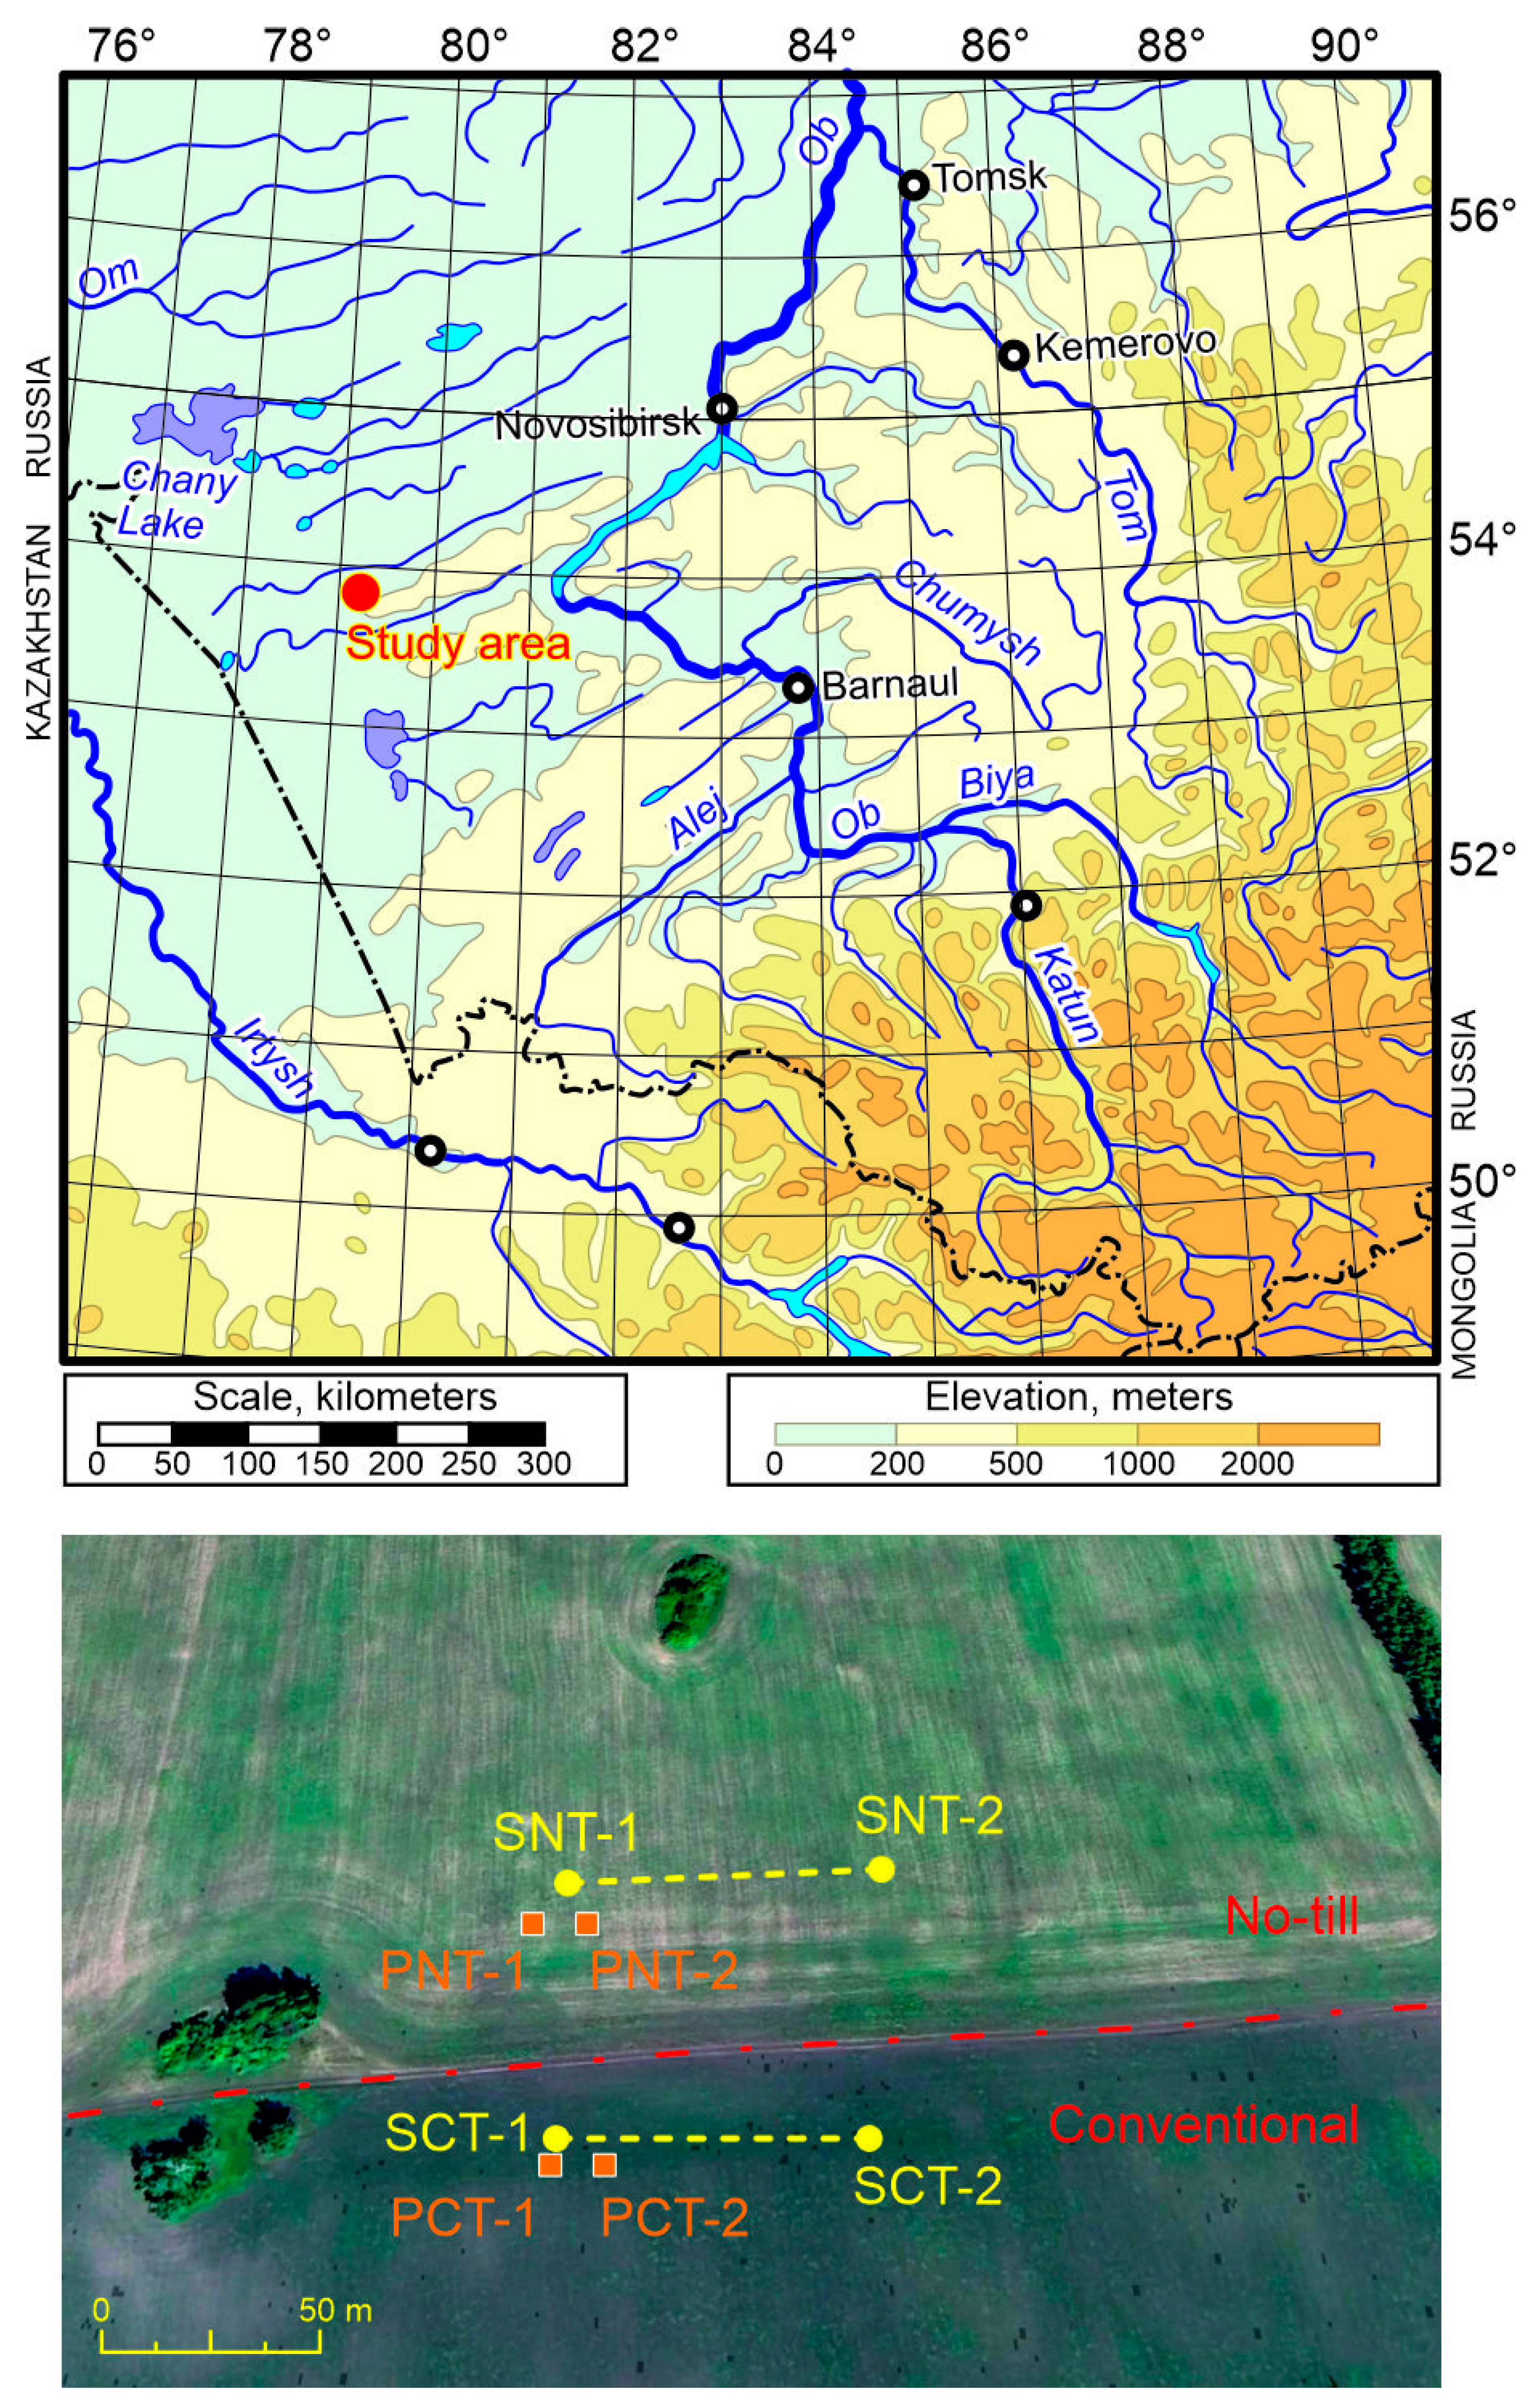
2.1. Experimental Sites and Soils of the Agrocenoses Studied

The research was conducted in West Siberia in the southern part of the forest steppe zone, near the natural bioclimatic boundary of the steppe zone (53.82° N, 79.24° E). Administratively, the area belongs to the Krasnozerskiy district of the Novosibirsk region. Agricultural use of the territory (plowing of previously undisturbed meadow ecosystems and subsequent tillage in the traditional way, i.e., moldboard tillage to the depth of 20–25 cm) began in around 1930 (Figure 1).
For our research, we selected a study area of an agricultural field where no-tillage (NT) has been used since 2007 and a control area with conventional tillage (CT). These areas were located close to each other (separated only by a field road) in conditions of leveled meso- and microrelief and were several hundred meters away from the nearest forest shelterbelts. The exact geographic coordinates of the plots and their brief characteristics in the years immediately preceding sampling are given in Table 1.
The soils of both plots were classified as Luvic Endocalcic Chernozem (Aric, Siltic), according to the World Reference Base for Soil Resources [14], and had the same granulometric composition (24% sand, 54% silt, and 22% clay), characterized as silt loam.

2.2. Sampling of Soil Invertebrates and Processing

The following manipulations were performed to study the macrofauna of soil invertebrates:
  • Taking soil samples to assess communities of soil-inhabiting invertebrates (earthworms, soil arthropods, etc.). We took soil monoliths 50 cm ∗ 25 cm in size (area 1/8 m2) to a depth of 15 cm in 10-fold replication. Soil samples were taken along transects about 70 m long, passing at a distance of 20–40 m from the field boundaries; the distance between individual samples was about 5–8 m (Figure 2). Samples were taken twice (22–24 May 2017 and 15 May 2018). Samples were placed in ventilated bags made of synthetic fabric, delivered to the laboratory, and disassembled by hand a short time after being obtained. During manual sorting of samples, if possible, all representatives of the macrofauna larger than 1–2 mm were extracted from them. Springtails and small soil mites such as Oribatida (soil mesofauna) were not taken into account.
2.
Installation of pitfall traps for the study of the soil-surface arthropods (carabids, spiders, etc.). A total of 10 plastic cups with a diameter of 6.5 cm (1/3 filled with a 3% solution of acetic acid used as a fixing liquid) were exhibited at both plots from 22–30 May 2017 (before sowing) and 13–20 June 2018 (after emergence of crops, but before insecticidal treatment, see Table 1). Short-duration pitfall trapping was used due to the rapid change in fauna and the developmental stages of ground beetles and other soil invertebrates during spring and summer. A long recording period contributes to the registration of species random for the habitat [15,16]. The change in fauna on agricultural fields is determined not only by the peculiarities of the phenology of specific species, but also by the sequence of agrotechnical measures (for example, the use of pesticides), which radically change the structure of soil animal communities. Traps were placed about 20–40 m from the edge of the field in two groups of five in the form of a square “envelope” with a central trap (five-spot pattern). The length of one side of the square was about 4 m. The distance between the groups of traps was about 7–10 m (see Figure 2). Thus, the location of the traps was a rectangle approximately 4 ∗ 15 m, inside which 10 traps were placed in a checkerboard pattern. We did not use trap covers in order to make the results comparable to our previous studies. Our 25 years of experience shows that traps of such a small diameter, standing on a flat surface, are almost never flooded, even with heavy rain. The traps’ short exposure period also avoids flooding. If traps are shaded with covers, they become more attractive in the open field as a refuge for soil-dwelling animals and thus distort the counting results.
3.
All invertebrates from soil samples were placed in 70% alcohol. They were determined in order or (in the case of Coleoptera) to families in the laboratory. Invertebrates of the most numerous groups (earthworms (Lumbricidae), spiders (Aranei), ground beetles (Carabidae), and click beetles (Elateridae)) were determined at the species level.
4.
After exposure, pitfall traps were placed in individual zip bags and delivered to the laboratory, where spiders and beetles were extracted from them. Ground beetles and spiders were identified according to species.
5.
Earthworm species were identified by E.V. Golovanova according to the key to the earthworms of Russia [17]. DNA was extracted from ethanol-fixed specimens. A sample of the body wall (about 100 µg) was dissolved in guanidiniumisothiocyanate and transferred to silica columns (BioSilica, Russia). After several rounds of washing with guanidiniumisothiocyanate and ethanol, DNA was transferred to a clean tube and used as a PCR matrix. Amplification of the mitochondrial cox1 gene fragment was conducted using universal primers LCO1490m (5′-TACTC-AACAA-ATCAC-AAAGA-TATTG-G-3′) and HCO2198 (5′-TAAAC-TTCAG-GGTGA-CCAAA-AAATC-A-3′) [18] with the Biomaster HS-Taq PCR Mix (Biolabmix, Russia). Sequencing was performed in the SB RAS Genomics Core Facility (ICBFM SB RAS, Novosibirsk, Russia). Sequences were edited using Chromas 2.6.6 (http://technelysium.com.au, accessed on 6 March, 2023). Unique haplotypes were submitted to GenBank under accession numbers OQ271318 and OQ271319.
The following literature sources were used for taxa determination: [17,19,20,21]. When determining ground beetles and spiders, the collections of the Siberian Zoological Museum of the Institute of Systematics and Ecology of Animals of the Siberian Branch of the Russian Academy of Sciences (ISEA SB RAS), Novosibirsk, Russia (SZMN) were used as a reference. The determined specimens were stored there.

2.3. Statistics

To analyze the structure of the invertebrate communities as a whole and considering the structure of Carabidae and Aranei assemblages separately, we calculated indices of species richness and diversity, as well as indicators of evenness in species structure [22]. To determine the significance of the differences, the indicators for the NT and CT plots were compared using the diversity permutation test, which calculates a set of diversity indices for two samples and then compares the diversities using random permutations. A total of 999 random matrices with two columns (samples) are generated, each with the same row and column sums as in the original data matrix [23]. To compare the effect of tillage on total invertebrate species richness and abundance, as well as the abundance of individual taxa, we calculated the mean, median, and quartile (25%, 75%) values of the number of species and individuals of different taxa per soil sample and per trap per week. As the distribution of invertebrates differed from normal, the values for each site within each year were compared in pairs using the non-parametric Kruskal–Wallis test. The PAST 4 program [23] was used for all statistical data processing.
Statistical analysis of soil properties was performed via two-way ANOVA (STATISTICA 12.6), where one factor is the cultivation practice (CT and NT) and the second factor is the analyzed soil layer (0–10 and 10–20 cm). All soil properties were analyzed once in 2017. Basic analyses of soil samples were performed in five-fold replications and soil microbial biomass in three-fold replications. Soil total carbon (STC) and nitrogen (STN) contents were estimated using an elemental analyzer (CHNS/O 2400 Serie II, Perkin Elmer, Waltham, MA, USA); soil organic matter content was estimated by the amount of soil mass loss on ignition at 550 °C for 12 h; and other soil properties were measured by standard techniques [24] Biomass of soil microorganisms was determined using the fumigation extraction method [25].

3. Results

3.1. Soils

Many basic soil properties were the same or similar for both sites (NT and CT). For the upper 0–20 cm layer, the following average characteristics were obtained: soil density, 1.06 g/cm3; soil porosity, 59%; pH, 6.9; total nitrogen, 0.3%; and atomic (molar) C/N ration, 14.4. However, such an important indicator as soil microbial mass was significantly higher (by 66–71%) in NT than in CT (676 vs. 407 mg C/kg in the 0–10 cm layer, and 447 vs. 262 mg C/kg in the 10–20 cm layer, respectively, p < 0.05). Obviously, this is associated with a significantly higher (7.6 times) stock of plant residues on the soil surface in the NT plot than in the CT plot (566 g/m2 vs. 74 g/m2, p < 0.001). In addition, the soil of the NT plot contained more agronomically valuable aggregates in the 0–10 cm layer, but no significant changes in aggregate composition were found in the 10–20 cm layer. The following fractions of macro-aggregates were significantly (p < 0.05) higher in the top 10 cm of the NT plot than in the CT plot: >10 mm (23% vs. 16%); 7–10 mm (15% vs. 11%); 5–7 mm (10% vs. 5%); 3–5 mm (9% vs. 6%); and 3–1 mm (16% vs. 12%).
When comparing the soil of NT and CT plots directly in the field during sampling, the presence of a formed layer of litter 2–3 cm thick, more homogeneous in structure and wetter to the touch, in the NT plot is remarkable. Furthermore, the CT plot soil is characterized by the presence of quite a large number of relatively big clods 1–3 cm in diameter with an almost dry surface.

3.2. Common Features of Soil Invertebrate Communities

Representatives of two phyla of animals were found in soil samples, namely annelids and arthropods. Annelids were represented by oligochaetes of the families Enchytraeidae and Lumbricidae. Arthropods were represented by Arachnida, i.e., spiders (Aranei) and velvet mites (Acari: Trombidioidea), Myriapoda (Chilopoda: Lithobiidae), and insects of the following five orders: Coleoptera; Hymenoptera (ants and wingless parasitic wasps); Hemiptera (Cicadellidae, Pentatomidae); Lepidoptera (cut worm of the subfamily Noctuinae); and Diptera. Representatives of three orders of insects (except for Coleoptera and Hymenoptera (ants)) were noted singly.

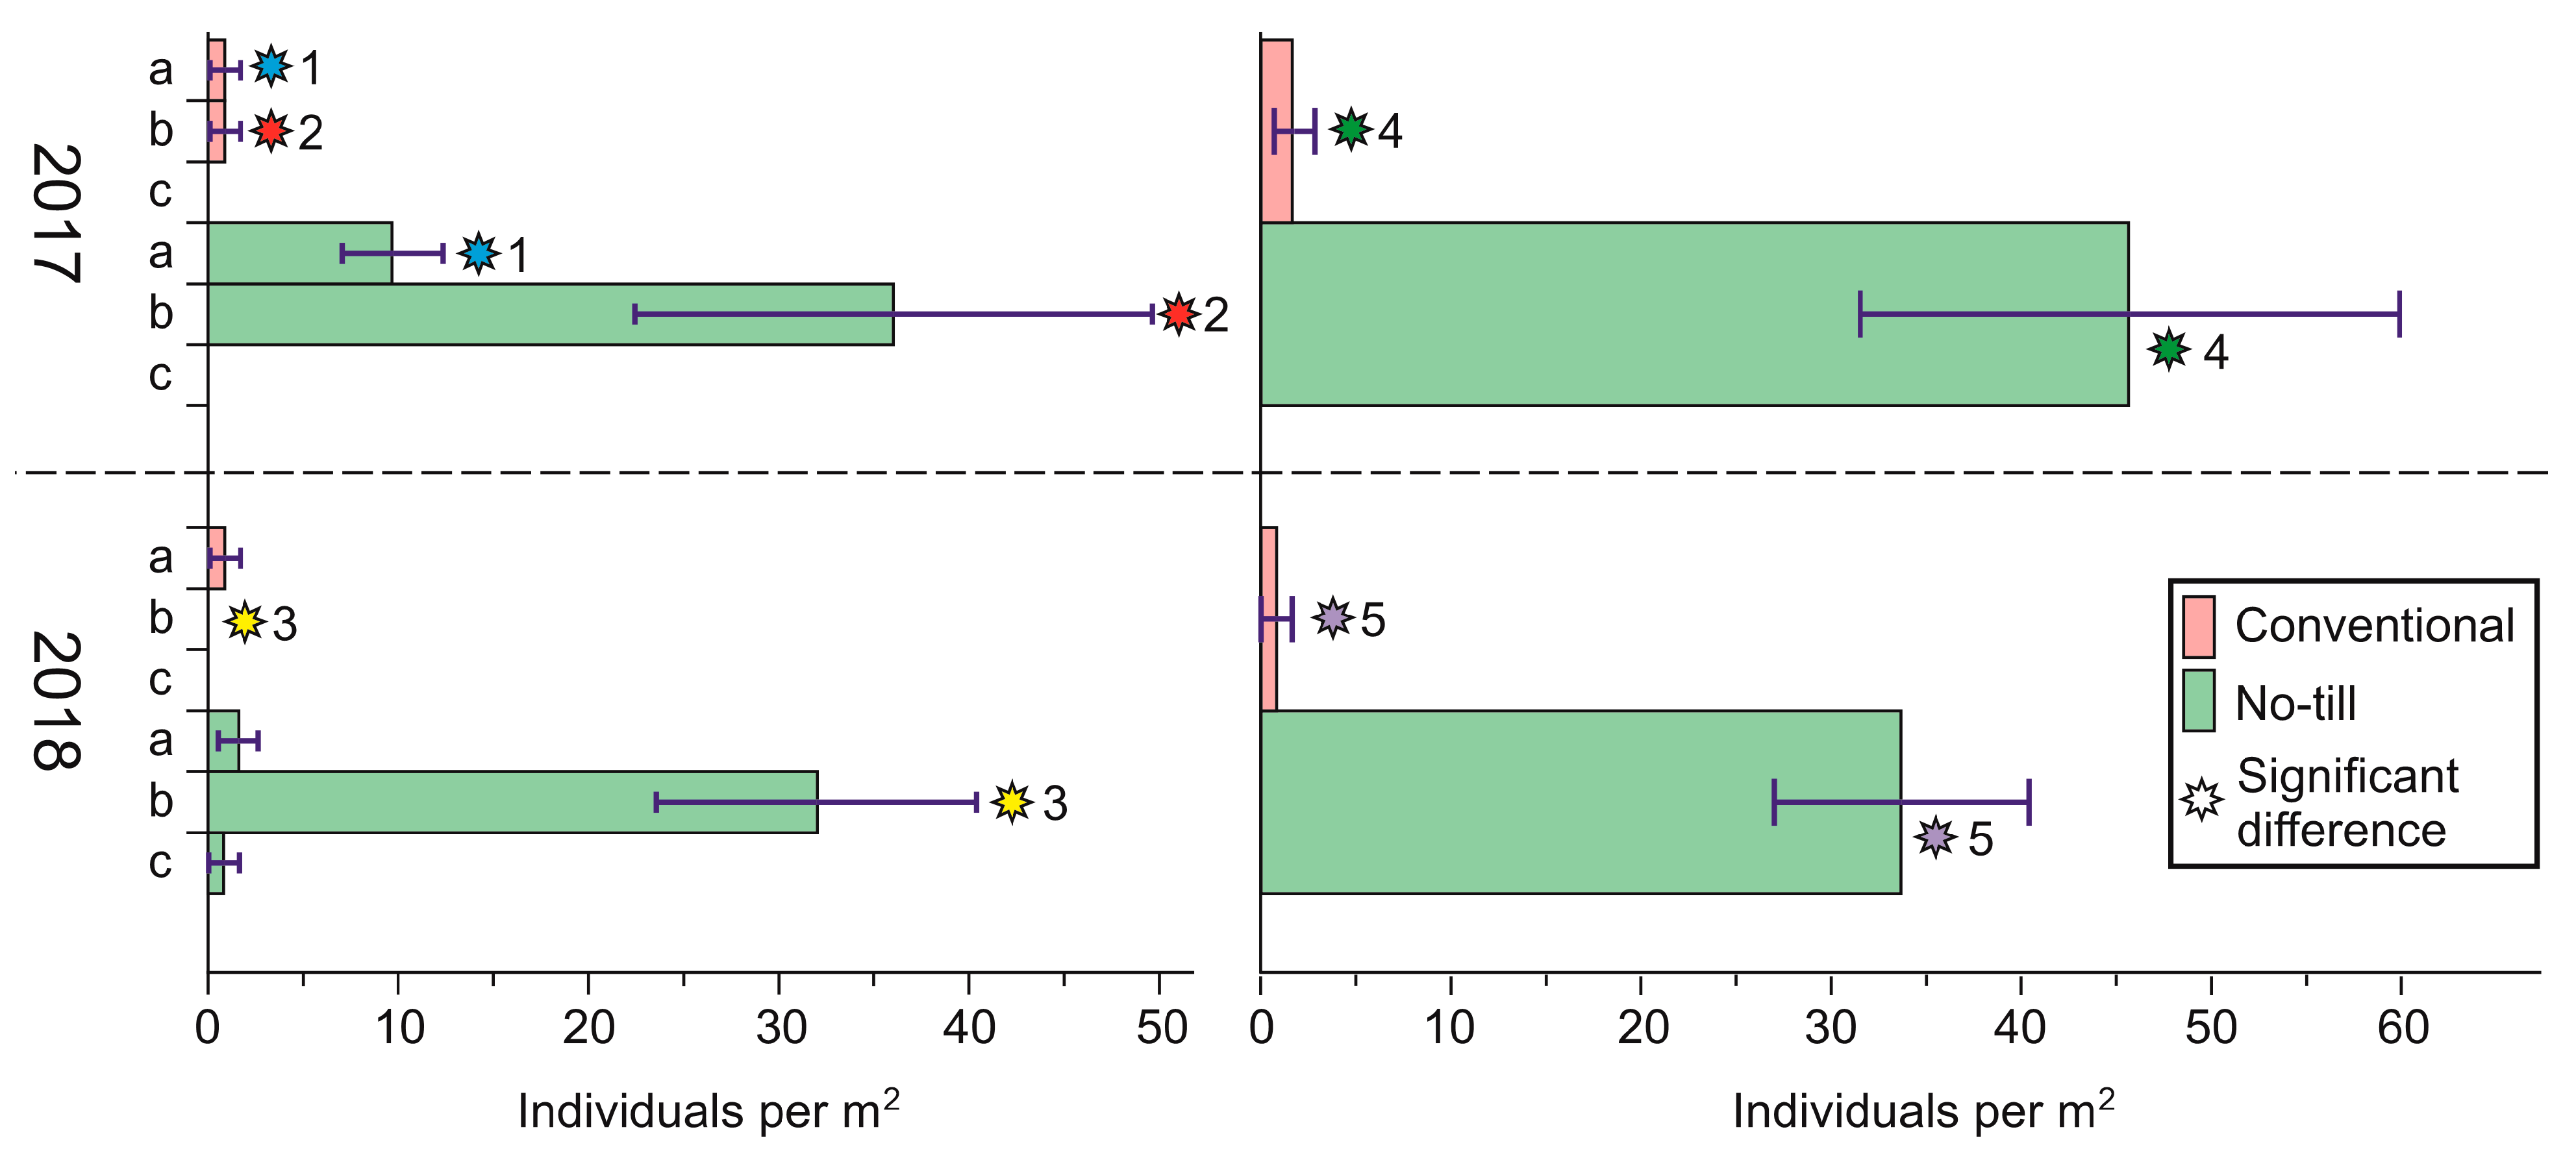
3.3. Analysis of the Diversity and Abundance of Soil Invertebrate Communities
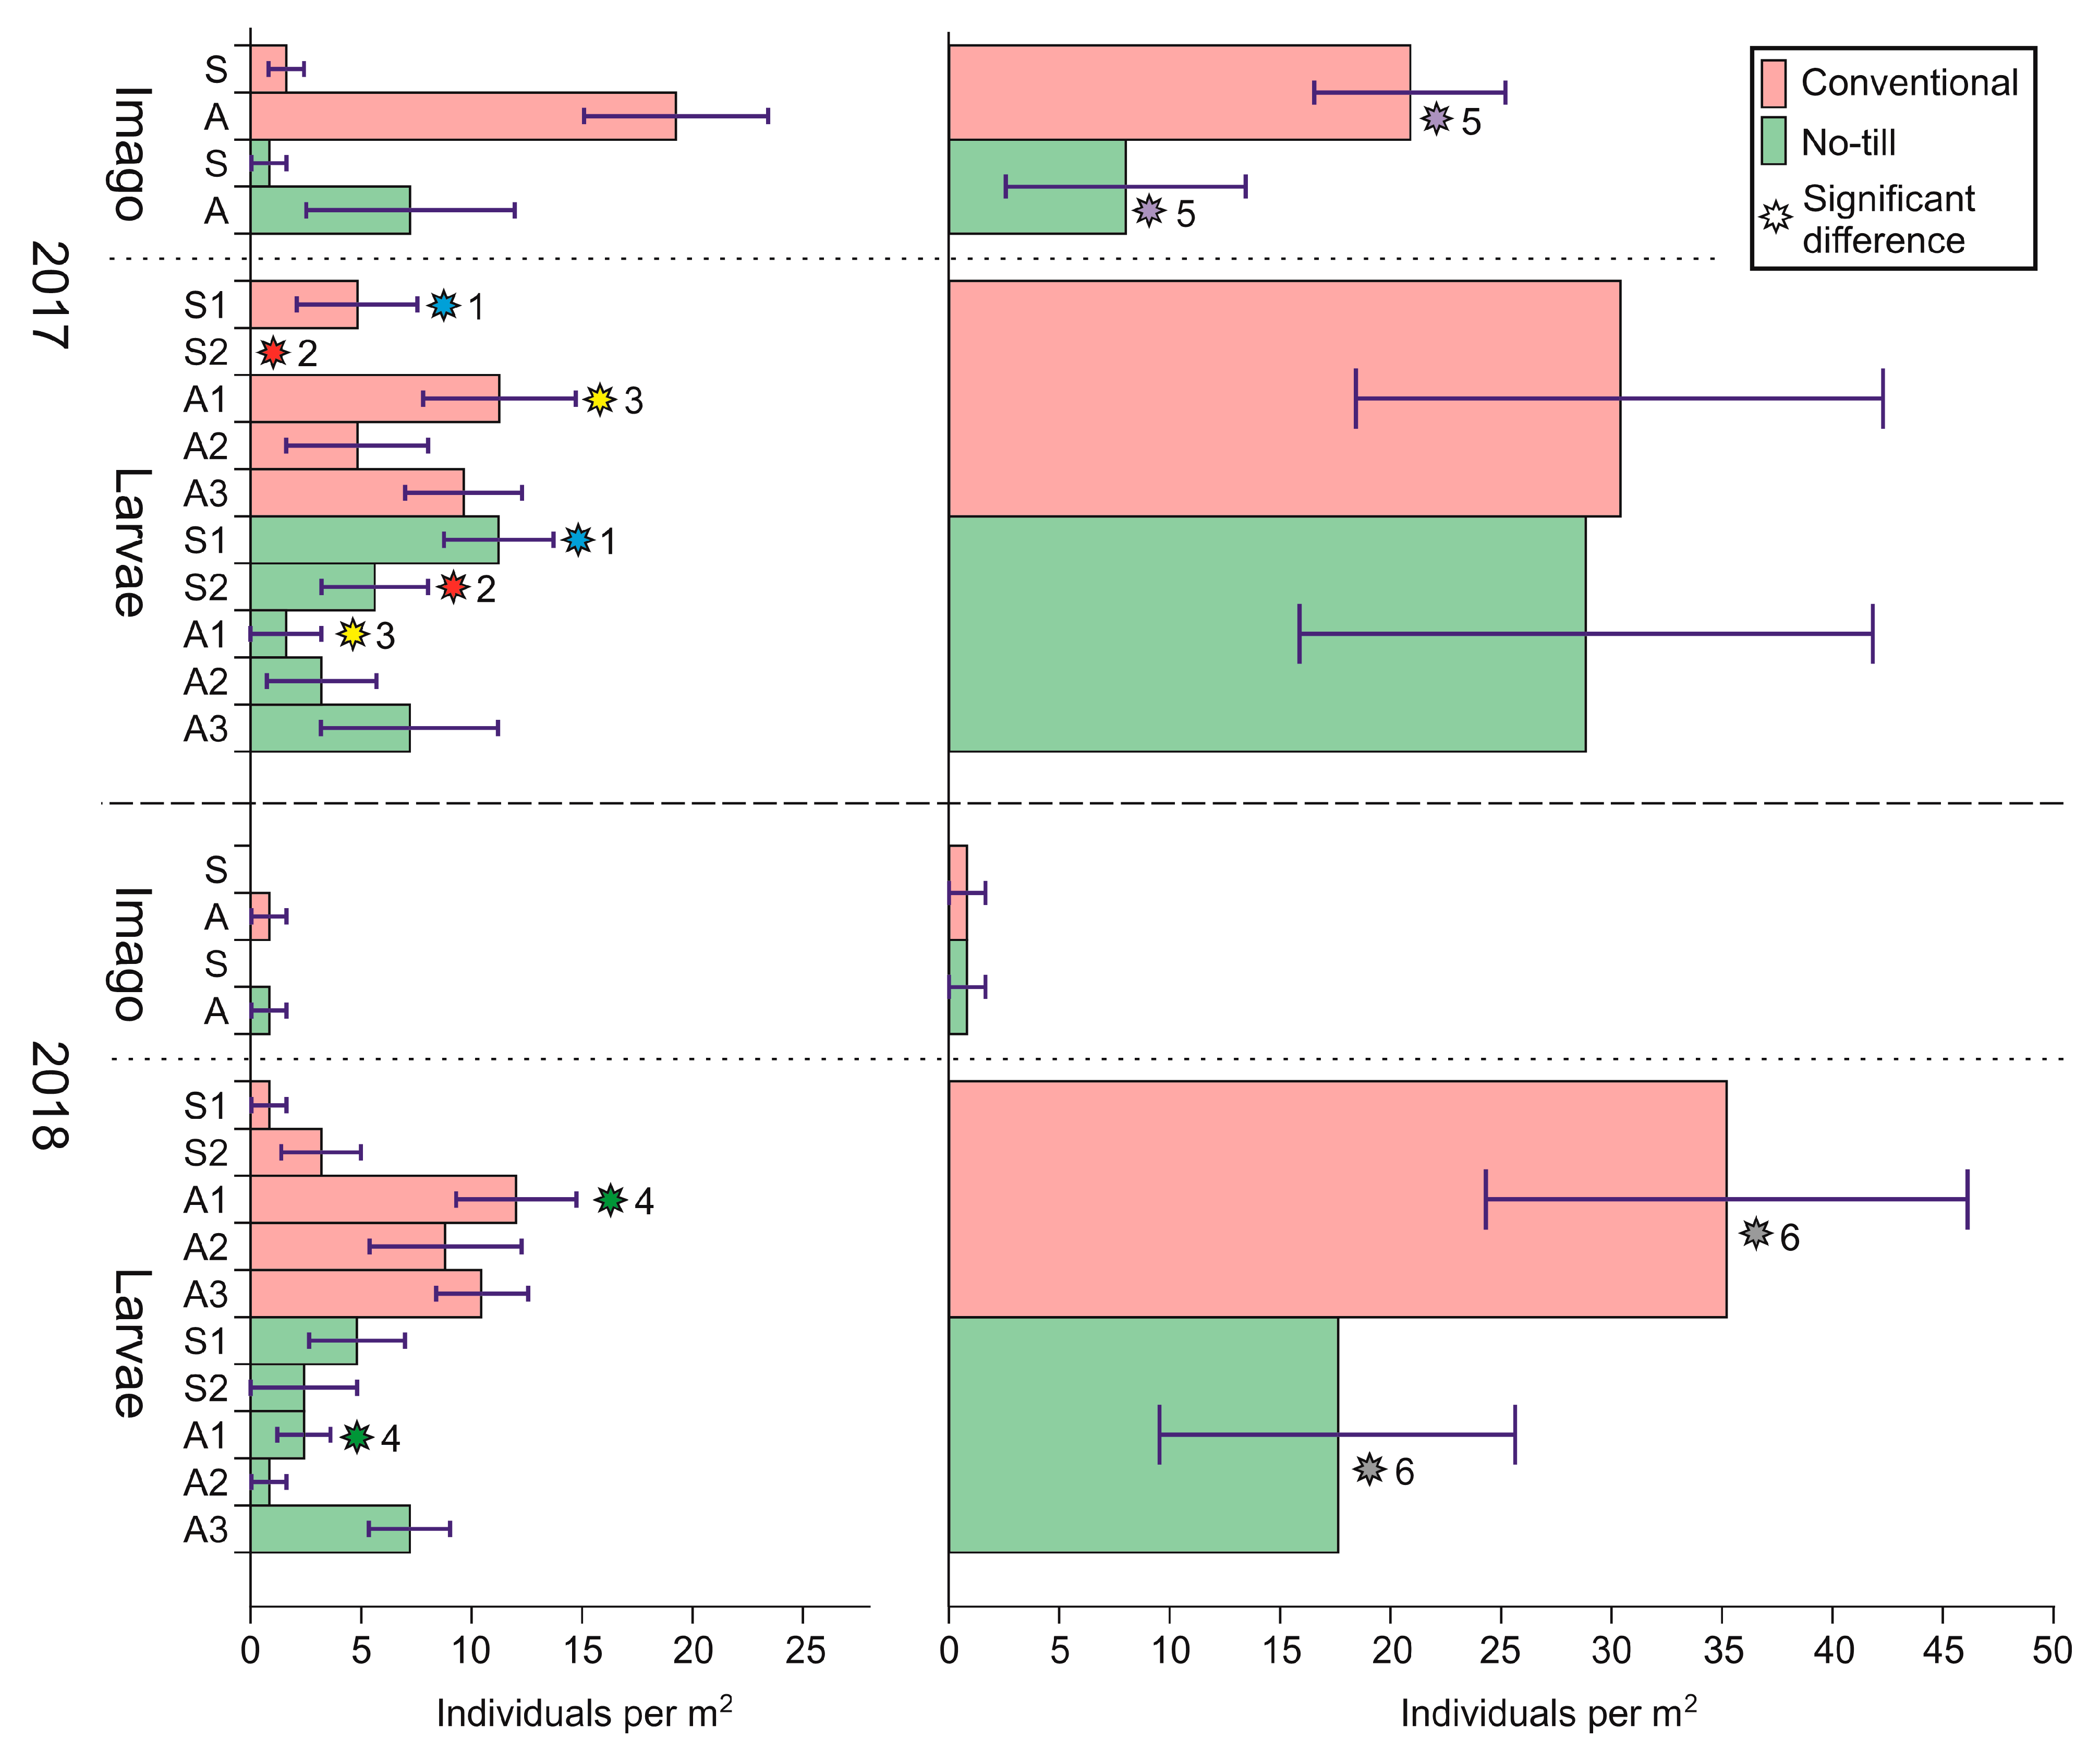
In the soil samples of 2017, invertebrates of 13 taxonomic groups including 162 individuals were found in the NT plot, and 15 taxonomic and functional groups and 118 individuals were found in the CT plot (differences between the average values were not significant). In 2018, group diversity (13 groups) was higher in the NT plot than in the CT one (8 groups), but the differences were not statistically significant. The total number of invertebrates (211 individuals) was significantly higher (p = 0.001) in NT than in the CT plot (64 individuals) (Table 2).
In 2017, no difference was found in species richness, diversity, evenness of the species structure, etc., between the CT plot and the NT plot. However, in 2018, there were differences at a high level of significance for Simpson’s Diversity Index, the Shannon Information Index, the evenness of the species structure (J), and the Berger–Parker Index. All reported values in the NT plot were higher (Table 2).
Below, we focus on groups that had a noticeable number (Table 3). The most numerous groups (ground beetles and spiders) are considered in separate sections of the article below.
Enchytraeidae in the spring of 2017 were equally frequent in the plots of both types of cultivation (about one specimen per sample). In 2018, in the NT plot, clusters of several dozen enchytraeids were found in some samples, so their total number became about 10 times higher than in the CT plot. Due to the highly aggregated horizontal distribution of Enchytraeidae in the NT plot, the differences between NT and CT remained unreliable.
Earthworms (Lumbricidae) are represented by two species, namely Eisenia nordenskioldi and E. fetida. We identified most of our specimens as belonging to the E. nordenskioldi complex. Sequences of the mitochondrial cox1 gene were obtained for five individuals. Four of the sequences were identical, while the fifth differed from them by one nucleotide substitution.
Only a single specimen of E. fetida was found in an NT plot in 2018. The total number of earthworms was significantly higher in the NT plot than in the CT (4–5 individuals versus 0.1–0.2, p = 0.0001). Among all the collected individuals of earthworms, there were several times more immature worms in both 2017 and 2018. (Figure 3).
Centipedes of the family Lithobiidae were found only in the NT plot. In 2018, their number grew, and the differences became significant.
Ants were practically not found in 2017, and in 2018 they were found only in the NT plot.
Coleoptera. Representatives of several families were found, such as Carabidae, Elateridae, Curculionidae, Staphylinidae, Scarabaeidae, Histeridae, etc. (Table 3). Only Carabidae and Elateridae were numerous and diverse, while the remaining families were each represented by only several individuals.
Elateridae. In soil samples, both the imagoes and larvae of elaterids of five species were found (Figure 4). In the spring of 2017, adult click beetles clearly preferred the soil of traditional cultivation; their number was 2.5 times higher than in the NT plot, mainly due to small elaterids of the genus Agriotes. In the spring of 2018, only single imagoes of click beetles were found in both plots. As for their larvae (wireworms), in the spring of 2017, there was no difference in total number between the plots. However, different elaterid species preferred plots of different types, i.e., CT or NT. Wireworms of the genus Selatosomus were more abundant in the no-till plot (p = 0.007), while Agriotes were more abundant in the conventional plot (A. sputator: p = 0.01). In 2018, there were twice as many elaterid larvae in the CT plot as in the NT plot (p = 0.02). For individual species, except for A. sputator, the values were unreliable, but the trend towards specialization of genera in different types of fields persisted.

3.4. Carabidae

Analysis of species richness and diversity in the assemblage of carabid beetles based on soil samples showed that, in 2017, diversity indicators were higher in the NT plot (seven species of ground beetles instead of two) and in the associated indexes of Menhinick, Shannon, Simpson, etc. (Table 4). Almost all differences in diversity and evenness indices between the CT and NT communities were significant. At the same time, the number of carabids in both plots was very low and did not differ significantly. There were no significant differences between evenness in species structure. In 2018, the same differences remained at the trend level, but due to the extremely low number of ground beetles in the CT plot, they were not statistically significant (Table 4).
Differences between the ground beetles’ communities in sites with different methods of tillage also apply to individual species of ground beetles. Thus, Bembidion properans and B. quadrimaculatum were predominantly noted in samples taken from the CT plot (such a habitat is typical for them), while Poecilus cupreus and P. versicolor, also usually confined to habitats of this type, were not noted in samples from the CT plot. Significant differences in abundance in different plots were found only for B. quadrimaculatum (p = 0.03). In 2018, P. cupreus and Amara consularis were relatively abundant in the NT plot (species were represented by both imagoes and larvae), and only one P. cupreus larva was found in the CT plot (Table 5).
The assemblage of ground beetles was also studied using the pitfall trap method (Table 6). The results were similar to those obtained using soil samples, but the trap method made it possible to identify the community of ground beetles in both plots much more accurately. In the spring of 2017, the absolute dominant species in both plots was Poecilus cupreus with an equal dynamic density of 280–300 individuals per 100 trap days. In the soil samples in the CT plot, the dynamic density was significantly higher in Bembidion properans and B. quadrimaculatum. Poecilus fortipes also had a higher density, although not significantly. In the NT plot, the only species of Coleoptera, P. versicolor, had significantly higher density. Ground beetle species typical for intact steppes, namely Pseudotaphoxenus tillesii, Poecilus punctulatus, and Pterostichus macer were found only with the NT plot. However, Carabus sibiricus, which is relatively rare in the region, was found in the CT plot.
In the summer of 2018, the species diversity of ground beetles turned out to be lower, but dynamic density was much higher. About 2600 ground beetles were collected in the CT plot and about 30 were collected in the NT one. The aforementioned Bembidion species still had significantly higher density in the CT plot. There were significantly more imagoes of Poecilus cupreus (more than 1000 times), P. fortipes, and P. versicolor. The dynamic density of P. koyi and Agonum gracilipes was also higher in the CT plot, although not significantly. Amara consularis was found only in the NT plot, and its numerous larvae were also found there (see above).

3.5. Spiders

In the spring of 2017, spiders were found mainly in the NT plot (6 species on average; 1.4 species per sample), while 2 species were found in the CT plot (on average, 0.2 species per sample, p = 0.0004). The number of spiders in the NT plot was also 10-fold higher (2.1 individuals per sample versus 0.2, p = 0.0003, mainly due to the species Robertus arundineti (family Theridiidae)), collected only using soil samples. Another species found only in the CT plot, Tibellus maritimus (family Philodromidae), was also not collected in the traps (Table 7). In 2018, we extracted only one specimen of spiders from soil samples in the NT plot (Drassylus pusillus (family Gnaphosidae). In the same year, spiders were absent in soil samples of the CT plot.
The permutation test, due to the overall small number of spiders, did not show statistically significant differences between abundance and diversity indicators; the differences are not statistically significant (Table 8).
According to pitfall trap data, in the spring of 2017, spiders were represented by a single specimen of Alopecosa schmidti (family Lycosidae) in the CT plot. This species was not found in the NT. There were 11 spider species in the NT plot (Table 9), with an average of 3.11 individuals and 2.88 species per trap. The most numerous species was Drassyllus pusillus (family Gnaphosidae) (0.67 individuals per trap); however, in general, the distribution of species was very even (from 0.11 to 0.67 individuals per trap).
In the summer of 2018, the trend reversed. In general, there were more species (p = 0.02) and a higher number of spiders (p = 0.01) per trap in the CT plot. There were spider species that were more common in the CT plots (Pardosa plumipes, Xerolycosa miniata) or the NT plots (Pardosa bifasciata) (all of the family Lycosidae) with a statistically significant difference between their numbers on different sites.

4. Discussion

As found in most of the studies conducted in other soil and climatic conditions [1,2,3], the agrocenoses we studied with no-till have a richer and more diverse population of soil invertebrates, the first of which are earthworms. It is known that the E. nordenskioldi complex contains very high cryptic diversity with multiple genetic lineages that have deep genomic differences that can be described as separate species [26,27]. BLAST search showed that the obtained sequences did not fall into any known genetic lineage of this species. It is most closely related to lineages 7 and 9 of this species, which are widespread in the far north of Eurasia and west of the Urals [28,29], and fall into one of the two major clades of the complex, E. nordenskioldi s. str. [30]. Our sequences differed by about 10% in terms of nucleotide substitutions from lineages 7 and 9. We can conclude that they belong to a new lineage of the complex, which we call lineage 10.
The Eisenia nordenskjoldi we found are typical of natural forest steppe ecosystems in West Siberia, in contrast to the synanthropic species E. fetida, which is often found in humus-rich soils. Reports from Russia [17] and the USSR [31] indicate a native species for the plains of Siberia, namely E. n. nordenskioldi, supplemented in the southern part of the range by E. n. pallida. Earthworm invasions in Siberia are relatively recent and have been observed along river valleys with large tributaries from the European part of Russia and Kazakhstan, for example, in the valley of the Irtysh River [32,33]; however, even in these areas of agricultural soils, it is mainly Aporrectodea caliginosa. The research area is located on the border of the Altai Territory, far from large rivers. The current state of earthworm fauna in the territory has not been studied at all and requires research.
The earthworm E. nordenskioldi (which is the predominant epigean form typical of zonal ecosystems and feeds on plant debris) probably dominates in no-till plots because of the much greater (by almost an order of magnitude) amount of plant debris on the soil surface. A second factor attracting Lumbricidae to NT plots may be the soil structure, where moisture is more evenly distributed than in a conventionally plowed field. Although the water content in NT soils is not higher than in CT soils, it appears that in CT soils, moisture is retained in surface-hardened large soil clods, whereas in NT soils (where there are significantly fewer large clods), moisture is likely to be more evenly distributed among macro-, meso-, and micro-soil aggregates. A period of 10 years was sufficient for earthworms to migrate from adjacent natural forest steppe ecosystems and densely colonize the no-till field.
The higher diversity and abundance of carabids in NT soil may be due to the fact that no-till fields are suitable for the overwintering of more ground beetle species than conventional tillage fields. Only a few species are able to overwinter in the latter. The total number of ground beetle specimens per sample did not differ between fields with different tillage practices.
Significant difference between the number of spiders, as well as the ratio between larvae and adults of beetles (Carabidae and Elateridae), according to soil samples in different years, are explained by different weather conditions and the slightly dissimilar timing of sampling conducted in 2017 and 2018. The latter year was characterized by a cooler and wetter spring and an earlier sampling time.
In 2018, due to an extremely cold May, the soil sampling period for invertebrates fell into an earlier phenophase, which may have resulted in the detection of large numbers of soil-dwelling larvae of the Amara genus that had not completed ontogeny and whose imagoes are characterized by an early summer peak of activity. The 2017 and 2018 pitfall trap data reflect not only interannual but also seasonal dynamics of the soil invertebrate community, as well as in 2018 fall during the peak abundance of soil-surface ground beetles.
The difference between the number of spiders in various years may be related to the end of hibernation of spiders and an increase in their activity at the beginning of summer. Highly mobile wolf spiders and gnaphosids, depending on specialization, migrate rapidly between fields with one or another type of tillage.
Thus, different soil animal communities are formed in agrocenoses depending on the type of tillage (conventional or no-till). The community of a conventionally tilled field includes a greater number of flying predatory ground beetles, typical of early succession stages, as well as phytophages, i.e., click beetle larvae with hard, desiccation-resistant covers. The abundance of large soil clods in the soil of a CT field allows relatively large beetles of the genus Poecilus, as well as adults and larvae of click beetles, to move easily through the space between soil structural units.
A no-till field with more homogeneous soil in the surface layer (with fewer large clods), permanently covered with a layer of crop residues, has high density and species richness of earthworms, a significantly richer spider population (especially in spring), and few other predators (except the superdominant Poecilus cupreus and the subdominant P. versicolor). In such soils, some ground beetles (e.g., Amara consularis) complete their full life cycle.

Author Contributions

Conceptualization, I.I.L. and P.A.B.; Methodology, I.I.L., E.V.G., R.Y.D. and P.A.B.; Validation, I.I.L., G.N.A., S.V.S. and E.S.S.; Formal analysis, I.I.L.; Investigation, I.I.L., E.V.G., R.Y.D., G.N.A., O.A.R., E.S.S., S.V.S. and P.A.B.; Resources, I.I.L. and P.A.B.; Data curation, I.I.L., R.Y.D. and P.A.B.; Writing—original draft, I.I.L.; Writing—review and editing, E.V.G., R.Y.D., G.N.A., O.A.R., E.S.S. and P.A.B.; Visualization, R.Y.D.; Supervision, I.I.L. and P.A.B.; Project administration, I.I.L., O.A.R. and P.A.B.; Funding acquisition, I.I.L. and P.A.B. All authors have read and agreed to the published version of the manuscript.

Funding

The study was financially supported by the Ministry of Science and Higher Education of the Russian Federation, project No. 122011800263-6 (I.I.L., R.Y.D., G.N.A.) and project No. 121031700309-1 (O.A.R., P.A.B.). Field studies in 2017–2018 were partially supported by the Russian Foundation for Basic Research, grant No. 17-04-01369 (I.I.L., G.N.A.).

Institutional Review Board Statement

Ethical review and approval were waived for this study due to the study concerned exclusively invertebrates not included in any lists of animals subject to protection.

Data Availability Statement

Unique haplotypes of Lumbricidae examined in this study were submitted to GenBank under accession numbers OQ271318 and OQ271319.

Acknowledgments

The authors are grateful to K.V. Makarov (Moscow State Pedagogical University. Moscow) for the identification of ground beetle larvae.

Conflicts of Interest

The authors declare no conflict of interest.

References

  1. Kutovaya, O.V.; Nikitin, D.A.; Geraskina, A.P. No-till technology as a factor of activity of soil invertebrate in agricultural chernozems of Stavropol region. Sel’skokhozyaistvennaya Biol. Agric. Biol. 2021, 56, 199–210. (In Russian) [Google Scholar] [CrossRef]
  2. House, G.J.; Parmelee, R.W. Comparison of soil arthropods and earthworms from conventional and no-tillage agroecosystems. Soil Tillage Res. 1985, 5, 351–360. [Google Scholar] [CrossRef]
  3. Errouissi, F.; Ben Moussa-Machraoui, S.; Ben-Hammouda, M.; Nouira, S. Soil invertebrates in durum wheat (Triticum durum L.) cropping system under Mediterranean semi arid conditions: A comparison between conventional and no-tillage management. Soil Tillage Res. 2011, 112, 122–132. [Google Scholar] [CrossRef]
  4. Winter, J.P.; Voroney, R.P.; Ainsworth, D.A. Soil microarthropods in long-term no-tillage and conventional tillage corn production. Can. J. Soil Sci. 1990, 70, 641–653. [Google Scholar] [CrossRef] [Green Version]
  5. Bedano, J.C.; Cantú, M.P.; Doucet, M.E. Influence of three different land management practices on soil mite (Arachnida: Acari) densities in relation to a natural soil. Appl. Soil Ecol. 2006, 32, 293–304. [Google Scholar] [CrossRef]
  6. Warburton, D.B.; Klimstra, W.D. Wildlife use of no-till and conventionally tilled corn fields. J. Soil Water Conserv. 1984, 39, 327–330. [Google Scholar]
  7. Robertson, L.; Kettle, B.; Simpson, G. The influence of tillage practices on soil macrofauna in a semi-arid agroecosystem in northeastern Australia. Agric. Ecosyst. Environ. 1994, 48, 149–156. [Google Scholar] [CrossRef]
  8. Hendrix, P.F.; Parmelee, R.W.; Crossley, D.A.; Coleman, D.C.; Odum, E.P.; Groffman, P. Detritus Food Webs in Conventional and No-Tillage Agroecosystems. Bioscience 1986, 36, 374–380. [Google Scholar] [CrossRef]
  9. Lins, V.S.; Santos, H.R.; Gonçalves, M.C. The effect of the glyphosate, 2,4-D, atrazine e nicosulfuron herbicides upon the Edaphic collembola (Arthropoda: Ellipura) in a no tillage system. Neotropical Entomol. 2007, 36, 261–267. [Google Scholar] [CrossRef] [Green Version]
  10. House, G.J.; Worsham, A.D.; Sheets, T.J.; Stinner, R.E. Herbicide effects on soil arthropod dynamics and wheat straw decom-position in a North Carolina no-tillage agroecosystem. Biol. Fertil. Soils 1987, 4, 109–114. [Google Scholar] [CrossRef]
  11. Tabaglio, V.; Gavazzi, C.; Menta, C. Physico-chemical indicators and microarthropod communities as influenced by no-till, conventional tillage and nitrogen fertilisation after four years of continuous maize. Soil Tillage Res. 2009, 105, 135–142. [Google Scholar] [CrossRef]
  12. Bokina, I.G. Bugs (Heteroptera, Nabidae) in agrocenoses of cereals in the forest-steppe of Western Siberia. Zool. Zhurnal 2013, 92, 450–456. [Google Scholar] [CrossRef]
  13. Bokina, I.G. Lacewing insects (Neuroptera: Chrysopidae, Hemerobiidae) Neuroptera insects (Chrysopidae, Hemerobiidae) according to different spring wheat cultivation practices in the northern forest-steppe of Western Siberia. Euroasian Entomol. J. 2020, 19, 67–74. [Google Scholar] [CrossRef]
  14. IUSS Working Group. WRB, World Reference Base for Soil Resources 2015. International Soil Classification System for Naming Soils and Creating Legends for Soil Maps; FAO: Rome, Italy, 2015. [Google Scholar]
  15. Matalin, A.V. Peculiarities of Spatial and Temporal Differentiation of Carabids (Coleoptera, Carabidae) in the Steppe Zone. Entomol. Rev. 1997, 77, 1155–1166. [Google Scholar]
  16. Matalin, A.V.; Makarov, K.V. Using demographic data to better interpret pitfall trap catches. Zookeys 2011, 100, 223–254. [Google Scholar] [CrossRef]
  17. Vsevolodova-Perel, T.S. Dozhdevye Chervi Fauny Rossii. Kadastr i Opredelitel [The Earthworms of the Fauna of Russia. Cadaster and Key]; Nauka: Moscow, Russia, 1997; 102p. [Google Scholar]
  18. Folmer, O.; Hoeh, W.R.; Black, M.B.; Vrijenhoek, R.C. Conserved primers for PCR amplification of mitochondrial DNA from different invertebrate phyla. Mol. Mar. Biol. Biotechnol. 1994, 3, 294–299. [Google Scholar]
  19. Mamaev, B.M. , Medvedev, L.N., Pravdin, F.N. Opredelitel Nasekomykh Evropeiskoi Chasti SSSR [Identification Keys to the insects of the European part of the USSR]; Prosveschenie: Moscow, Russia, 1976; 304p. (In Russian) [Google Scholar]
  20. Dolin, V.G. Opredelitel Lichinok Zhukov-Stchelkunov Fauny SSSR [Identification Keys to the Elateridae Larvae of the Fauna of the USSR]; Urozhai: Kiev, Russia, 1978; 124p. [Google Scholar]
  21. Byzova, Y.B.; Ghilyarov, M.S.; Dunger, V.; Zakharov, A.A.; Kozlovskaya, L.S.; Korganova, G.A.; Mazantseva, G.P.; Meletsis, V.I.; Prasse, I.; Puzachenko, J.G.; et al. Kolichestvennye Metody v Pochvennoi Zoologii [Quantitative Methods in Soil Zoology]; Nauka: Moscow, Russia, 1987; 288p. (In Russian) [Google Scholar]
  22. Magurran, A.E. Ecological Diversity and Its Measurement; Springer: Dordrecht, The Netherlands, 1988. [Google Scholar]
  23. Hammer, Ø.; Harper, D.A.T.; Ryan, P.D. PAST: Paleontological statistics software package for education and data analysis. Palaeontol. Electron. 2001, 4, 9. [Google Scholar]
  24. Carter, M.R.; Gregorich, E.G. (Eds.) Soil Sampling and Methods of Analysis, 2nd ed.; CRC Press: Boca Raton, FL, USA, 2008. [Google Scholar]
  25. Joergensen, R.G.; Mueller, T. The fumigation-extraction method to estimate soil microbial biomass: Calibration of the kEN value. Soil Biol. Biochem. 1996, 28, 33–37. [Google Scholar] [CrossRef]
  26. Shekhovtsov, S.; Golovanova, E.; Peltek, S. Cryptic diversity within the Nordenskiold's earthworm, Eisenia nordenskioldi subsp. nordenskioldi (Lumbricidae, Annelida). Eur. J. Soil Biol. 2013, 58, 13–18. [Google Scholar] [CrossRef]
  27. Shekhovtsov, S.V.; Berman, D.I.; Golovanova, E.; Peltek, S.E. Genetic diversity of the earthworm Eisenia nordenskioldi (Lumbricidae, Annelida). Vavilov J. Genet. Breed. 2017, 21, 589–595. [Google Scholar] [CrossRef] [Green Version]
  28. Shekhovtsov, S.V.; Golovanova, E.V.; Peltek, S.E. Mitochondrial DNA variation in Eisenia n. nordenskioldi (Lumbricidae) in Europe and Southern Urals. Mitochondrial DNA Part A 2015, 27, 4643–4645. [Google Scholar] [CrossRef] [PubMed]
  29. Shekhovtsov, S.V.; Berman, D.I.; Bulakhova, N.A.; Vinokurov, N.N.; Peltek, S.E. Phylogeography of Eisenia nordenskioldi nordenskioldi (Lumbricidae, Oligochaeta) from the north of Asia. Polar Biol. 2018, 41, 237–247. [Google Scholar] [CrossRef]
  30. Shekhovtsov, S.V.; Shipova, A.A.; Poluboyarova, T.V.; Vasiliev, G.V.; Golovanova, E.V.; Geraskina, A.P.; Bulakhova, N.A.; Szederjesi, T.; Peltek, S.E. Species Delimitation of the Eisenia nordenskioldi Complex (Oligochaeta, Lumbricidae) Using Transcriptomic Data. Front. Genet. 2020, 11, 598196. [Google Scholar] [CrossRef] [PubMed]
  31. Perel, T.S. Distribution and Patterns of Distribution of Earthworms in the Fauna of the USSR (with Key Tables); Nauka: Moscow, Russia, 1979. [Google Scholar]
  32. Golovanova, E.V.; Kniazev, S.Y.; Babiy, K.A.; Tsvirko, E.I.; Karaban, K.; Solomatin, D.V. Dispersal of earthworms from the Rudny Altai (Kazakhstan) into Western Siberia. Ecol. Montenegrina 2021, 45, 48–61. [Google Scholar] [CrossRef]
  33. Kniazev, S.Y.; Kislyi, A.A.; Bogomolova, I.N.; Golovanova, E.V. Territorial Heterogeneity of the Earthworm Population (Opisthopora, Lumbricidae) of Omsk Oblast and Environmental Factors: A Quantitative Assessment of the Relationship. Contemp. Probl. Ecol. 2022, 15, 484–493. [Google Scholar] [CrossRef]
Figure 1. General view of the agricultural field with plots of conventional plowing and no-tillage. (a) No-till plot (left) and conventional tillage plot (right), 22 May 2017; (b) no-till plot, 22 May 2017, closer; (c) plot with conventional tillage, 22 May 2017, closer; (d) pitfall traps at the no-till plot, 20 June 2018; (e) pitfall traps at the plot with conventional tillage, 20 June 2018.
Diversity 15 00402 g001
Figure 2. Geographic position (top), location of points with pitfall traps (squares), and the transects along which soil samples were taken (circles with dash line) (bottom). The boundary between the fields (passing along the road) is marked with a stippled line. SNT-1, SNT-2, SCT-1, SCT-2: west and east points of the transect of soil samples in no-till (NT) and in conventional (CT) plots, respectively; PNT-1, PNT-2, PCT-1, PCT-2: locations of pitfall trap “five spot patterns” in no-till (NT) and in conventional (CT) plots, respectively.
Diversity 15 00402 g002
Figure 3. Mean earthworm abundance per square meter in CT and NT plots. (Left): by species (a: Eisenia nordenskioldi (mature), b: Eisenia nordenskioldi (immature), c: Eisenia fetida (immature). (Right): overall density of earthworms. Standard error is shown by whiskers. Stars of one color with same figures show the significant difference between certain parameters.
Diversity 15 00402 g003
Figure 4. Density distribution of adults and larvae of click beetles (Coleoptera, Elateridae) in CT and NT plots. (Left): by species (S1, Selatosomus aeneus; S2, Selatosomus latus; A1, Agriotes sputator; A2, Agriotes lineatus; A3, Agriotes obscurus). (Right): overall density of Elateridae. Standard error is shown by whiskers. Stars of one color with same figures show the significant difference between certain parameters.
Diversity 15 00402 g004
Table 1. Agrotechnical and agrochemical treatments for two farming systems.
ItemConventional Farming SystemNo-Till Farming System
Geographical coordinatesSoil samples:
SCT1—53.81663° N, 79.24866° E;
SCT2—53.81663° N, 79.24980° E.
Pitfall traps:
PCT1—53.81660° N, 79.24866° E;
PCT2—53.81659° N, 79.24885° E.
Soil samples:
SNT1—53.81732° N, 79.24862° E;
SNT2—53.81731° N, 79.24992° E.
Pitfall traps:
PNT1—53.81718° N, 79.24850° E;
PNT2—53.81718° N, 79.24871°E.
Soil tillageDump plowing to a depth of 18–20 cm, moisture nailing with harrows and spring pre-sowing cultivation to a depth of 10 cmComplete absence of tillage, starting from 2007
Cultivated crop in 2017Spring wheatSpring Wheat
Cultivated crop in 2018PeasRape
Fertilization, annually in the period (more than 3 years) prior to samplingWithout fertilizers35–42 kgN/ha (ammoniumnitrate) and 10 kgN/ha + 26 kgP2O5/ha + 26 K2O/ha (di-ammoniumphosphate)
Application of pesticides immediately before sampling in 2017Was not appliedWas not applied
Application of pesticides in 2017Elant herbicides 0.6 L/ha + Stalker 0.02 kg/ha + Taipan 0.5 L/ha during the growing seasonKernell herbicides 2 L/ha + Esteron 0.5 L/ha before sowing; herbicides Agrokson 0.6 L/ha + Trizlak 0.02 kg/ha + Foxtrot Extra 0.5 L/ha during the growing season; fungicide Abakus Ultra 1 L/ha; insecticide Fastak 0.1 L/ha
Application of pesticides immediately before sampling in 2018Was not appliedWas not applied until the end of May, at the beginning of June Kernell herbicides 2 L/ha + Esteron 0.5 L/ha
Table 2. General indicators of taxonomic diversity of invertebrate communities depending on the type of tillage (conventional or no-till). Significant differences (permutation test) are given with asterisks. *—p < 0.05, **—p < 0.01.
Year20172018
Type of Soil TreatmentNo-TillConventionalNo-TillConventional
Diversity Parameter
Simpson_1-D0.790.800.75 **0.46 **
Shannon_H1.871.991.74 **1.06 **
Evenness_e^H/S0.500.490.440.36
Menhinick1.021.380.901
Margalef2.362.942.241.68
Equitability_J0.730.740.68 *0.51 *
Fisher_alpha3.334.563.062.41
Berger–Parker0.350.350.42 **0.72 **
Table 3. Mean numbers and standard errors for specimens and taxa of soil invertebrates of the main systematic and functional groups per one square meter (for the number of taxa, per soil sample) depending on the type of tillage (conventional or no-till).
Year20172018
Type of Soil TreatmentNo-TillConventionalNo-TillConventional
Taxa, Functional Group
Enchytraeidae8.80 ± 4.2110.40 ± 7.1671.20 ± 34.51 *6.40 ± 1.07 *
Lumbricidae45.60 ± 14.16 **1.60 ± 1.07 **33.60 ± 6.73 **0.80 ± 0.80 **
Trombidiformes1.60 ± 1.074.80 ± 2.1300
Aranei21.60 ± 5.73 **0.80 ± 0.80 **0.80 ± 0.800
Chilopoda0.80 ± 0.8005.60 ± 2.930
Carabidae8.80 ± 3.2611.20 ± 6.106.40 ± 2.611.60 ± 1.07
Carabidae. l1.60 ± 1.07016.00 ± 4.77 **1.60 ± 1.07 **
Elateridae8.00 ± 5.47 *20.80 ± 4.33 *0.80 ± 0.800.80 ± 0.80
Elateridae. l31.20 ± 8.5532.80 ± 10.2217.60 ± 4.89 *36.80 ± 5.49 *
Staphylinidae3.20 ± 1.772.40 ± 1.7100
Curculionidae2.40 ± 1.712.40 ± 1.220.80 ± 0.801.60 ± 1.07
Curculionidae. l01.60 ± 1.0700
Other Coleoptera00.80 ± 0.801.60 ± 1.070
Other Coleoptera. l02.40 ± 1.220.80 ± 0.800
Hymenoptera0.8 ± 0.80.80 ± 0.8012.00 ± 7.930
Hemiptera0.8 ± 0.800.80 ± 0.800
Diptera. l et pupae0.8 ± 0.80.80 ± 0.8001.60 ± 1.60
Lepidoptera. l00.80 ± 0.8000
Number of individuals
per square meter
136.00 ± 22.2894.40 ± 17.72168.00 ± 42.88 **51.2 ± 6.00 **
Number of taxa per one soil sample5.30 ± 0.564.90 ± 0.485.10 ± 0.48 **2.70 ± 0.33 **
Notes. Sample volume: 25 ∗ 50 ∗ 15 cm, n = 10. Significant differences (Kruskal–Wallis) are given with asterisks. * p < 0.05, ** p < 0.01. l: larvae.
Table 4. General indicators of species diversity of ground beetle communities (Coleoptera, Carabidae) depending on the type of tillage (conventional or no-till). Significant differences (permutation test) are given with asterisks. * p < 0.05; ** p < 0.01.
Year20172018
Type of Soil TreatmentNo-TillConventionalNo-TillConventional
Diversity Parameter
Simpson_1-D0.81 **0.49 **0.540.44
Shannon_H1.80 **0.68 **1.130.64
Evenness_e^H/S0.860.990.520.94
Menhinick2.11 **0.53 **1.111.16
Margalef2.50 **0.38 **1.490.91
Equitability_J0.920.990.630.92
Fisher_alpha8.29 *0.64 *2.302.62
Berger–Parker0.27 **0.57 **0.660.67
Table 5. Mean numbers and standard errors of the abundance of ground beetles (Coleoptera, Carabidae) per square meter (for number of species, per one soil sample) depending on the type of tillage (conventional or no-till).
Year20172018
Type of Soil TreatmentNo-TillConventionalNo-TillConventional
Carabid Species
Amara consularis2.40 ± 2.4002.40 ± 1.710
Amara consularis, l0015.20 ± 4.69 **0 **
Bembidion properans0.80 ± 0.804.80 ± 3.200.80 ± 0.800.80 ± 0.80
Bembidion varium0.80 ± 0.80000
Bembidion quadrimaculatum0 *6.40 ± 3.33 *00
Calathus melanocephalus0.80 ± 0.80000
Harpalus rufipes0.80 ± 0.80000
Poecilus cupreus2.40 ± 1.7103.20 ± 1.31 *0 *
Poecilus cupreus, l000.80 ± 0.801.60 ± 1.07
Poecilus fortipes000.80 ± 0.800
Poecilus versicolor0.80 ± 0.8000
Number of individuals
per square meter
8.80 ± 3.2611.20 ± 6.1023.20 ± 4.21 **2.40 ± 1.22 **
Number of species per one soil sample0.80 ± 0.330.70 ± 0.211.70 ± 0.26 **0.20 ± 0.13 **
Notes. Sample volume: 25 ∗ 50 ∗ 15 cm, n = 10, Significant differences (Kruskal–Wallis) are given with asterisks. * p < 0.05; ** p < 0.01; l: larvae.
Table 6. Average dynamic density of ground beetles per trap on the conventional and no-till plots in 2017 and 2018. Significant differences are given with asterisks. * p < 0.05, ** p < 0,01. ±: standard error.
Year2017. May2018. June
Type of Soil TreatmentConventionalNo-TillConventionalNo-Till
Species
Agonum gracilipes0.10 ± 0.100.000.30 ± 0.150.00
Amara consularis0.000.10 ± 0.100.000.56 ± 0.29
Amara apricaria0.000.000.000.22 ± 0.15
Amara bifrons0.000.000.10 ± 0.100.00
Anisodactylus signatus0.000.000.20 ± 0.130.00
Bembidion properans3.70 ± 1.15 *0.30 ± 0.15 *17.80 ± 3.97 *1.33 ± 0.50 *
Bembidion quadrimaculatum3.90 ± 1.05 *0.10 ± 0.10 *3.60 ± 1.09 *0.33 ± 0.17 *
Bembidion gilvipes0.000.000.10 ± 0.100.00
Calosoma denticolle0.000.000.10 ± 0.100.00
Carabus convexus0.000.000.10 ± 0.100.00
Carabus sibiricus0.10 ± 0.100.000.000.00
Curtonotus aulicus0.000.000.10 ± 0.100.00
Harpalus cisteloides0.000.000.30 ± 0.210.00
Microlestes minutulus0.20 ± 0.130.20 ± 0.130.60 ± 0.270.33 ± 0.24
Notiophilus germinyi0.10 ± 0.100.000.000.00
Poecilus cupreus23.00 ± 4.0724.70 ± 6.85216.00 ± 26.98 *0.11 ± 0.11 *
Poecilus fortipes1.00 ± 0.370.20 ± 0.1316.20 ± 1.20 *0.00*
Poecilus lepidus0.000.000.30 ± 0.210.00
Poecilus punctulatus0.000.10 ± 0.100.20 ± 0.130.00
Poecilus koyi0.20 ± 0.130.000.60 ± 0.400.00
Poecilus versicolor1.70 ± 0.54 *6.80 ± 2.41 *3.10 ± 0.60 *0.11 ± 0.11 *
Pseudotaphoxenus tillesii0.000.10 ± 0.100.000.00
Pterostichus macer0.000.10 ± 0.100.20 ± 0.130.00
Individuals per one trap per week34.00 ± 4.4932.70 ± 9.16259.90 ± 31.14 **3.00 ± 0.71 **
Species per one trap4.7 ± 0.37 *3.00 ± 0.42 *7.1 ± 0.43 **1.89 ± 0.42 **
Number of species1010187
Table 7. Mean numbers and standard errors of the abundance of spiders (Arachnida, Aranei) per square meter (for number of species, per one soil sample) depending on the type of tillage in 2017.
Type of Soil TreatmentNo-TillConventional
Spider Species
Robertus arundineti6.40 ± 2.32 *0.80 ± 0.80 *
Robertus sp. Juv.6.40 ± 3.760
Clubiona caerulescens0.80 ± 0.800
Drassyllus pusillus0.80 ± 0.800
Gnaphosa sp. Juv.0.80 ± 0.800
Haplodrassus signifer0.80 ± 0.800
Tibellus maritimus00.80 ± 0.80
Haplodrassus pseudosignifer+0
Number of individuals per
square meter
16.80 ± 3.44 **1.60 ± 1.04 **
Number of species per one soil sample0.20 ± 0.13 **1.30 ± 0.15 **
Notes. Sample volume: 25 ∗ 50 ∗ 15 cm. n = 10. Significant differences (Kruskal–Wallis) are given with asterisks. * p < 0.05. ** p < 0.01. Juv.: juveniles.
Table 8. General indicators of species diversity in spider (Aranei) communities depending on the type of tillage in 2017. There are no significant differences (permutation test).
Type of Soil TreatmentNo-TillConventional
Diversity Parameter
Simpson_1-D0.690.5
Shannon_H1.440.69
Evenness_e^H/S0.601
Menhinick1.491.41
Margalef1.941.44
Equitability_J0.741
Fisher_alpha3.540
Berger–Parker0.410.5
Table 9. Average dynamic density of spiders per trap on conventional and no-till plots in 2017 and 2018. Significant differences are given with asterisk. * p < 0.05; ±: standard error.
Year2017. May2018. June
Type of Soil TreatmentConventionalNo-TillConventionalNo-Till
Species
Alopecosa albostriata000.20 ± 0.130
Alopecosa dimidiata0000.10 ± 0.10
Alopecosa cuneata00.40 ± 0.1600.10 ± 0.10
Alopecosa cursor000.10 ± 0.100
Alopecosa farinosa00.10 ± 0.1000
Alopecosa schmidti0.11 ± 0.11 *0 *00
Arctosa sp. Juv.00.10 ± 0.1000
Drassyllus pusillus00.60 ± 0.220.30 ± 0.150.40 ± 0.22
Erigone atra000.10 ± 0.100
Gnaphosa licenti00.10 ± 0.1000.20 ± 0.13
Gnaphosa sp. Juv.00.10 ± 0.1000
Haplodrassus pseudosignifer00.10 ± 0.100.60 ± 0.160.20 ± 0.13
Haplodrassus signifer00.20 ± 0.130.30 ± 0.150
Pardosa agrestis00.20 ± 0.130.50 ± 0.170.10 ± 0.10
Pardosa bifasciata00.20 ± 0.130 *0.50 ± 0.22 *
Pardosa fulvipes000.10 ± 0.100
Pardosa palustris000.20 ± 0.130.10 ± 0.10
Pardosa plumipes001.70 ± 0.37 *0.10 ± 0.10 *
Pardosa sp. Juv.0000.20 ± 0.13
Robertus arundineti000.10 ± 0.100.10 ± 0.10
Talavera aequipes0000.10 ± 0.10
Thanatus striatus0000.10 ± 0.10
Trochosa robusta000.10 ± 0.100
Xerolycosa miniata000.50 ± 0.17 *0 *
Xysticus cristatus00.40 ± 0.160.10 ± 0.100
Zelotes mundus00.20 ± 0.1300
Individuals per one trap per week0.11 ± 0.11 *3.11 ± 0.68 *4.90 ± 0.59 *2.20 ± 0.63 *
Species per one trap0.11 ± 0.11 *2.89 ± 0.61 *3.70 ± 0.37 *2.00 ± 0.29 *
Number of species1111412
Disclaimer/Publisher’s Note: The statements, opinions and data contained in all publications are solely those of the individual author(s) and contributor(s) and not of MDPI and/or the editor(s). MDPI and/or the editor(s) disclaim responsibility for any injury to people or property resulting from any ideas, methods, instructions or products referred to in the content.

