
Variation in Leaf Pigment Complex Traits of Wetland Plants Is Related to Taxonomy and Life Forms

1
Institute Botanic Garden, Ural Branch, Russian Academy of Sciences, 202a 8 Marta Str., 620144 Ekaterinburg, Russia
2
Institute of Environmental and Agricultural Biology (X-BIO), Tyumen State University, 6 Volodarskogo Str., 625003 Tyumen, Russia
Diversity 2023, 15(3), 372; https://doi.org/10.3390/d15030372
Submission received: 31 December 2022
/
Revised: 25 February 2023
/
Accepted: 1 March 2023
/
Published: 4 March 2023
Abstract
:The leaf pigment complex traits of 44 wetland plant species from the Middle Urals (Russia) were studied to analyze their diversity in relation to taxonomy and life forms. The chlorophyll content per dry weight (ChlDW) and leaf area (ChlArea), the ratio of chlorophylls a and b, and CO2 uptake rates (ADW) were determined. ChlDW varied by 10-fold from 2.20 to 21.9 mg g−1 among the wetland plant species. The influence of taxonomy at the level of classes on the variation of the pigment complex traits was revealed. Dicots had greater ChlDW and had a greater proportion of chlorophylls in the light-harvesting complex (ChlLHC) than monocots. In dicots, ChlLHC was positively correlated with leaf area ratio (r = 0.63, p < 0.01), and the effect of life forms on the content and ratio of pigments was determined. In monocots, chlorophyll content was positively correlated with ADW (r = 0.75, p < 0.001) and plant height (r = 0.66, p < 0.001). In monocots, the effect of families on the pigment content was observed. The lack of differences in ChlArea between the different systematic groups and life forms indicates a similar ability of the leaf area unit to absorb a solar energy.
Keywords:
chlorophyll; Chl a/b; carotenoids; light-harvesting complex; LMA; LAI; CO2 uptake rate; dicots; monocots1. Introduction
Chlorophyll is the primary photon acceptor in the pathway through which sunlight is harvested to produce energy for the creation of the chemical bonds of organic compounds. It has been established that the composition of photosynthetic pigments is fairly constant among vascular plants and is represented by two chlorophylls (Chl a and Chl b) and six carotenoids [1]. Chlorophylls are the main light-harvesting pigments, while carotenoids are involved in both collecting light as well as photoprotection [2]. Within chloroplasts, pigments are structured in photosystems (photosystem I and photosystem II), which are multi-subunit membrane complexes [3]. Chl a is located in the reaction centers and antennas of both photosystems, while Chl b is only present in the light-harvesting complex [4]. Carotenoids are always associated with the proteins of antenna complexes, except for β-carotene, which is mostly located in the core complexes of both photosystems, where it quenches Chl triplets and singlet oxygen [5].
The chlorophyll content, as well as the ratio of chlorophylls a and b (Chl a/b) and the ratio of chlorophylls and carotenoids (Chl a+b/Car), alter under stressful conditions [6,7,8]. This adaptation of the photosynthetic apparatus occurs due to changes in the composition and size of the photosystem II antenna and the adjustment of photosystem II/photosystem I ratio [6].
Chlorophyll content in leaves affects their photosynthesis rate and thus has an effect on plant growth and productivity [9,10,11,12,13,14]. Positive correlations have been observed between chlorophyll concentration and several leaf traits, such as the leaf mass per area (LMA) and leaf nitrogen content [10,11,15,16,17,18,19].
The relationship between plant productivity and chlorophyll content, and the important role of leaf pigment complex traits in the photosynthetic system’s acclimation in different environments, contributes to the high levels of interest in the study of these parameters in plants of various taxonomic groups as well as life and growth forms in different biomes. It has been shown that plant species of the taiga zone in European Northeast Russia contain a relatively small concentration of chlorophylls, ranging from 2 to 6 mg g−1 DW [20]. It was also found that arctic and arctic–alpine plant species had a low Chl a+b/Car under these conditions [20,21]. When studying the plant species of forest ecosystems in China along the latitudinal transect, a large variation in the chlorophyll content (from 1.45 to 19.2 mg g−1), as well as a tendency for a decrease in the plants’ chlorophyll content with increasing latitude, was revealed [18]. A comparative analysis of the pigment content in the leaves of plants from different biomes showed that steppe and desert species are characterized by low concentrations of chlorophylls [11,22], and within arid regions, the chlorophyll content declines with an increase in the climate’s aridity [16,23,24]. When studying steppe plant species in the South Urals along the latitudinal transect, the results revealed an increase in the Chl a/b ratio from 1.8 to 2.8, and, on the contrary, a decrease in the ratio of Chl a+b/Car from 5.6 to 3.5, with increasing latitude [25]. It was noted that under the same climatic conditions, plants in habitats with a high moisture level contain more chlorophylls in their leaves (for example, oasis plants) compared to desert species [11].
Many authors have revealed significant variations in plants’ pigment complex parameters within biomes [10,11,18,21,25]. One of the factors contributing to this variation has been the diversity of life forms among the studied species. In the taiga zone of European Northeast Russia, herbs had two to three times greater chlorophyll concentrations compared to trees [20]. In the forest ecosystems of Eastern China, the leaf chlorophyll content increased in the order trees—shrubs—herbs, while the Chl a/b ratio, on the contrary, declined in this series [26]. In the desert ecosystems of Mongolia, the leaf chlorophyll content increased in the order subshrubs—perennial herbs—annuals [11]. Several studies have established the effect of taxonomy on plants’ chlorophyll content. A high chlorophyll concentration was noted in species of the Fabaceae family [20]. It was found that the source of variation in the pigment content in plants of the same life form is the taxonomic origin [26].
The variation in leaf pigment complex traits among wetland plant species and the factors that determine it have been studied to a lesser extent compared to plants in other ecosystems. The research on macrophytes in the Middle Urals and European Northeast Russia has shown a large variation in the chlorophyll content from 3 to 17 and from 3 to 13 mg g−1 DW, respectively, as well as a low ratio of chlorophylls to carotenoids from 2.3 to 3.5 in plant leaves [10,27]. In both studies, this variation was predominantly due to the presence of hydrophytes of different groups (submerged and emergent).
Thus, the variation in leaf pigment complex traits in hydrophytes with emerged leaves and riparian plants, as well as the factors that affect it, remains poorly understood. In this study, a hypothesis is proposed wherein the variation in leaf pigment parameters in wetland plants is associated with taxonomy and life forms, similar to plant species in other ecosystems.
The objectives of this work were as follows: (a) to study the variation of the leaf pigment complex traits of wetland plants in the Middle Urals; (b) to analyze whether the variation in the content of pigments is associated with taxonomy and life forms; and (c) to reveal the relationship of pigment complex parameters with leaf traits and plant aboveground biomass.
2. Materials and Methods
2.1. Study Area and Plant Material
The plants analyzed in this study were collected on the banks of the Iset’ (56.841191 N, 60.509337 E), Aramilka (56.681439 N, 60.786025 E), and Povarnya (56.442116 N, 60.190558 E) rivers in the south of the Sverdlovsk region (Russia). The study area is located on the eastern macroslope of the Ural Mountains in the southern taiga subzone. The climate of this region is temperate continental. The mean annual air temperature is about +3 °C. The mean temperature of the warmest month (July) is +19 °C. The annual precipitation is 470–540 mm. The level of photosynthetically active radiation is over 2000 µmol m−2 s −1 at midday in July. The duration of the growing season is up to 130 days.
Chlorophyll and carotenoid content, leaf traits, leaf canopy parameters, and aboveground biomass of 44 wetland plant species were determined. The species studied account for 75% of the species frequently found in the wetlands of the Middle Urals [28]. A list of the species under study with the designated families, life forms, and sampling sites is provided in Table S1. The species examined are herbaceous plants, including 41 perennials and 3 annuals. Raunkiaer’s system, which is based on the position of the perennating buds during the unfavorable season [29], was used to classify the studied herbaceous plant species into life forms. The life form of each species has been derived from the research presented in [30], which includes a list of species with their biological and ecological attributes. Five life forms were defined among wetland plant species studied: (1) chamaephytes—plants with perennating buds located at a low level (up to 30 cm) above the soil surface in an unfavorable season; (2) hemicryptophytes—plants with buds located at the level of the soil surface; (3) geophytes—plants with buds located at some depth in the soil; (4) helophytes—plants with buds located at some depth in water or waterlogged soil; and (5) therophytes—annuals surviving an unfavorable season in the form of seeds [29]. All these life forms were found in dicots and four (excluding chamaephyte) were found in monocots (Figure 1A). Dicot plant species from 12 families accounted for 43% of the species studied and monocot plant species from 9 families accounted for 57% (Figure 1B).
Well-developed flowering plants from open, wet habitats (riversides without trees and shrubs) were selected for analysis. The measurements were carried out on third and fourth leaves located below the inflorescence. The CO2 uptake rate was measured on the third leaf. After that, the pieces from the third leaf were frozen in liquid nitrogen and kept in the dark until the chlorophyll and carotenoid concentrations were determined. The fourth leaf was used to determine leaf mass per area (LMA). In the aphyllous species Eleocharis palustris and Schoenoplectus lacustris, all parameters were studied on the upper third of photosynthetic stems. The pigment content, leaf traits, and CO2 uptake rates were determined in 5 biological replicates. Plant height and aboveground biomass were determined in 10 biological replicates.
2.2. Plant Sizes and Canopy Parameters
Plant height was measured from the soil surface to the maximum location of its leaf canopy. Plant diameter was determined to calculate the projection area of the plant canopy onto the soil surface. After that, the aboveground part of the plant was severed, and all leaves were photographed. Then, the aboveground part was dried and weighed to determine the aboveground biomass. Leaf photos were used to measure leaf area using a digital analyzer (Simagis Mesoplant, OOO SIAMS, Russia). Leaf area ratio (LAR, cm2 g−1) was calculated by dividing the total leaf area of the plant by its dry aboveground mass. Leaf area index (LAI) was calculated by dividing the total leaf area of the plant by the projected area of its leaf canopy on the soil surface.
2.3. Leaf Traits
Freshly harvested leaves were photographed, dried, and weighed. Leaf photos were used to measure leaf area using a digital analyzer (Simagis Mesoplant, OOO SIAMS, Russia). Then, leaf mass per area (LMA, g m−2) was calculated.
2.4. Leaf Pigment Content and CO2 Uptake Rate
Pigments were extracted with 5 mL of 80% acetone from 25 mg fresh weight leaf pieces. The optical density of the extracts was measured using a spectrophotometer (Odyssey DR/2500, HACH, Loveland, CO, USA) at wavelength 663, 646, and 470 nm. The chlorophyll and carotenoid concentrations were calculated according to the formulas presented in [31]. Using the mass and area of leaf pieces, the content of pigments per unit of fresh weight (ChlFW, mg g−1; CarFW, mg g−1) and per leaf area (ChlArea, μg cm−2; CarArea, μg cm−2) was calculated. Using LMA, the content of pigments per dry weight (ChlDW, mg g−1; CarDW, mg g−1) was recalculated. The proportion of chlorophyll in the light-harvesting complex (ChlLHC, %) was determined according to the technique presented in [32,33] using the following formula:
where Chl a and Chl b are the concentrations of chlorophylls a and b.
The CO2 uptake rate was measured using a gas analysis system (Li-6400xt, Li-COR, USA) at irradiance of 2000 μmol m−2 s−1, CO2 concentration of 380 ppm, air humidity of 50%, and air temperature of 24 °C. The photosynthetic rate was calculated per dry weight (ADW µmol CO2 g−1 DW s−1) and per unit of chlorophyll weight (AChl, µmol CO2 g−1 Chl s−1).
2.5. Data Analysis
To estimate the variation in leaf pigment complex traits in wetland plant species, the coefficient of variation (CV) was calculated. A one-way analysis of variance (ANOVA) was carried out to determine the effects according to class, family, and life form on the parameters studied. Families and life forms in which the number of species was less than two were excluded from the analysis. Tukey HSD was used to assess the significance of differences between the means. Differences are considered to be significant at p < 0.05. Statistical analysis was performed using STATISTICA 13 (StatSoft Inc., Tulsa, OK, USA).
3. Results
3.1. Variation of Leaf Pigment Complex Traits across Wetland Plant Species
The Chl and Car content per fresh weight, per dry weight, and per unit area as well as AChl varied significantly among the wetland plant species (Table 1). ChlDW varied by ten-fold, from 2.20 to 21.91 mg g−1; CarDW by six-fold, from 0.79 to 4.80 mg g−1; and AChl by over eight-fold, from 11 to 95 µmol CO2 g−1 Chl s–1. Chl a/b and ChlLHC were the least variable (9 and 7% respectively).
ChlFW, CarFW, ChlArea, CarDW, and AChl did not differ between the dicotyledonous and monocotyledonous wetland plant species (Table 1). ChlDW in the dicots was 1.4 times higher than that in the monocots, while CarArea, on the contrary, was lower by the same margin. Chl a/b in the dicots was lower than in the monocots, whereas Chl a+b/Car and ChlLHC were higher.
The variation in ChlDW, CarDW, and CarArea in the dicots and monocots was similar (Table 1). The variation in Chl a/b, ChlLHC, and AChl was greater in the dicots compared to the monocots, and the reverse was true for the other studied parameters.
Considering the influence of factors on the variation in leaf pigment complex traits, the sampling site was not significant with respect to the dicots and monocots (Table S2). The type of family also did not affect the parameter values in the dicots, whereas the type of life form influenced certain traits, namely, ChlDW, CarDW, Chl a/b, Chl a+b/Car, and ChlLHC (Table 2). In the monocots, on the contrary, the type of life form did not have a significant effect, and the type of family influenced pigment complex parameters, such as ChlFW, CarFW, ChlDW, and CarDW.
3.2. Variation of Leaf Pigment Complex Traits in Dicots of Different Life Forms
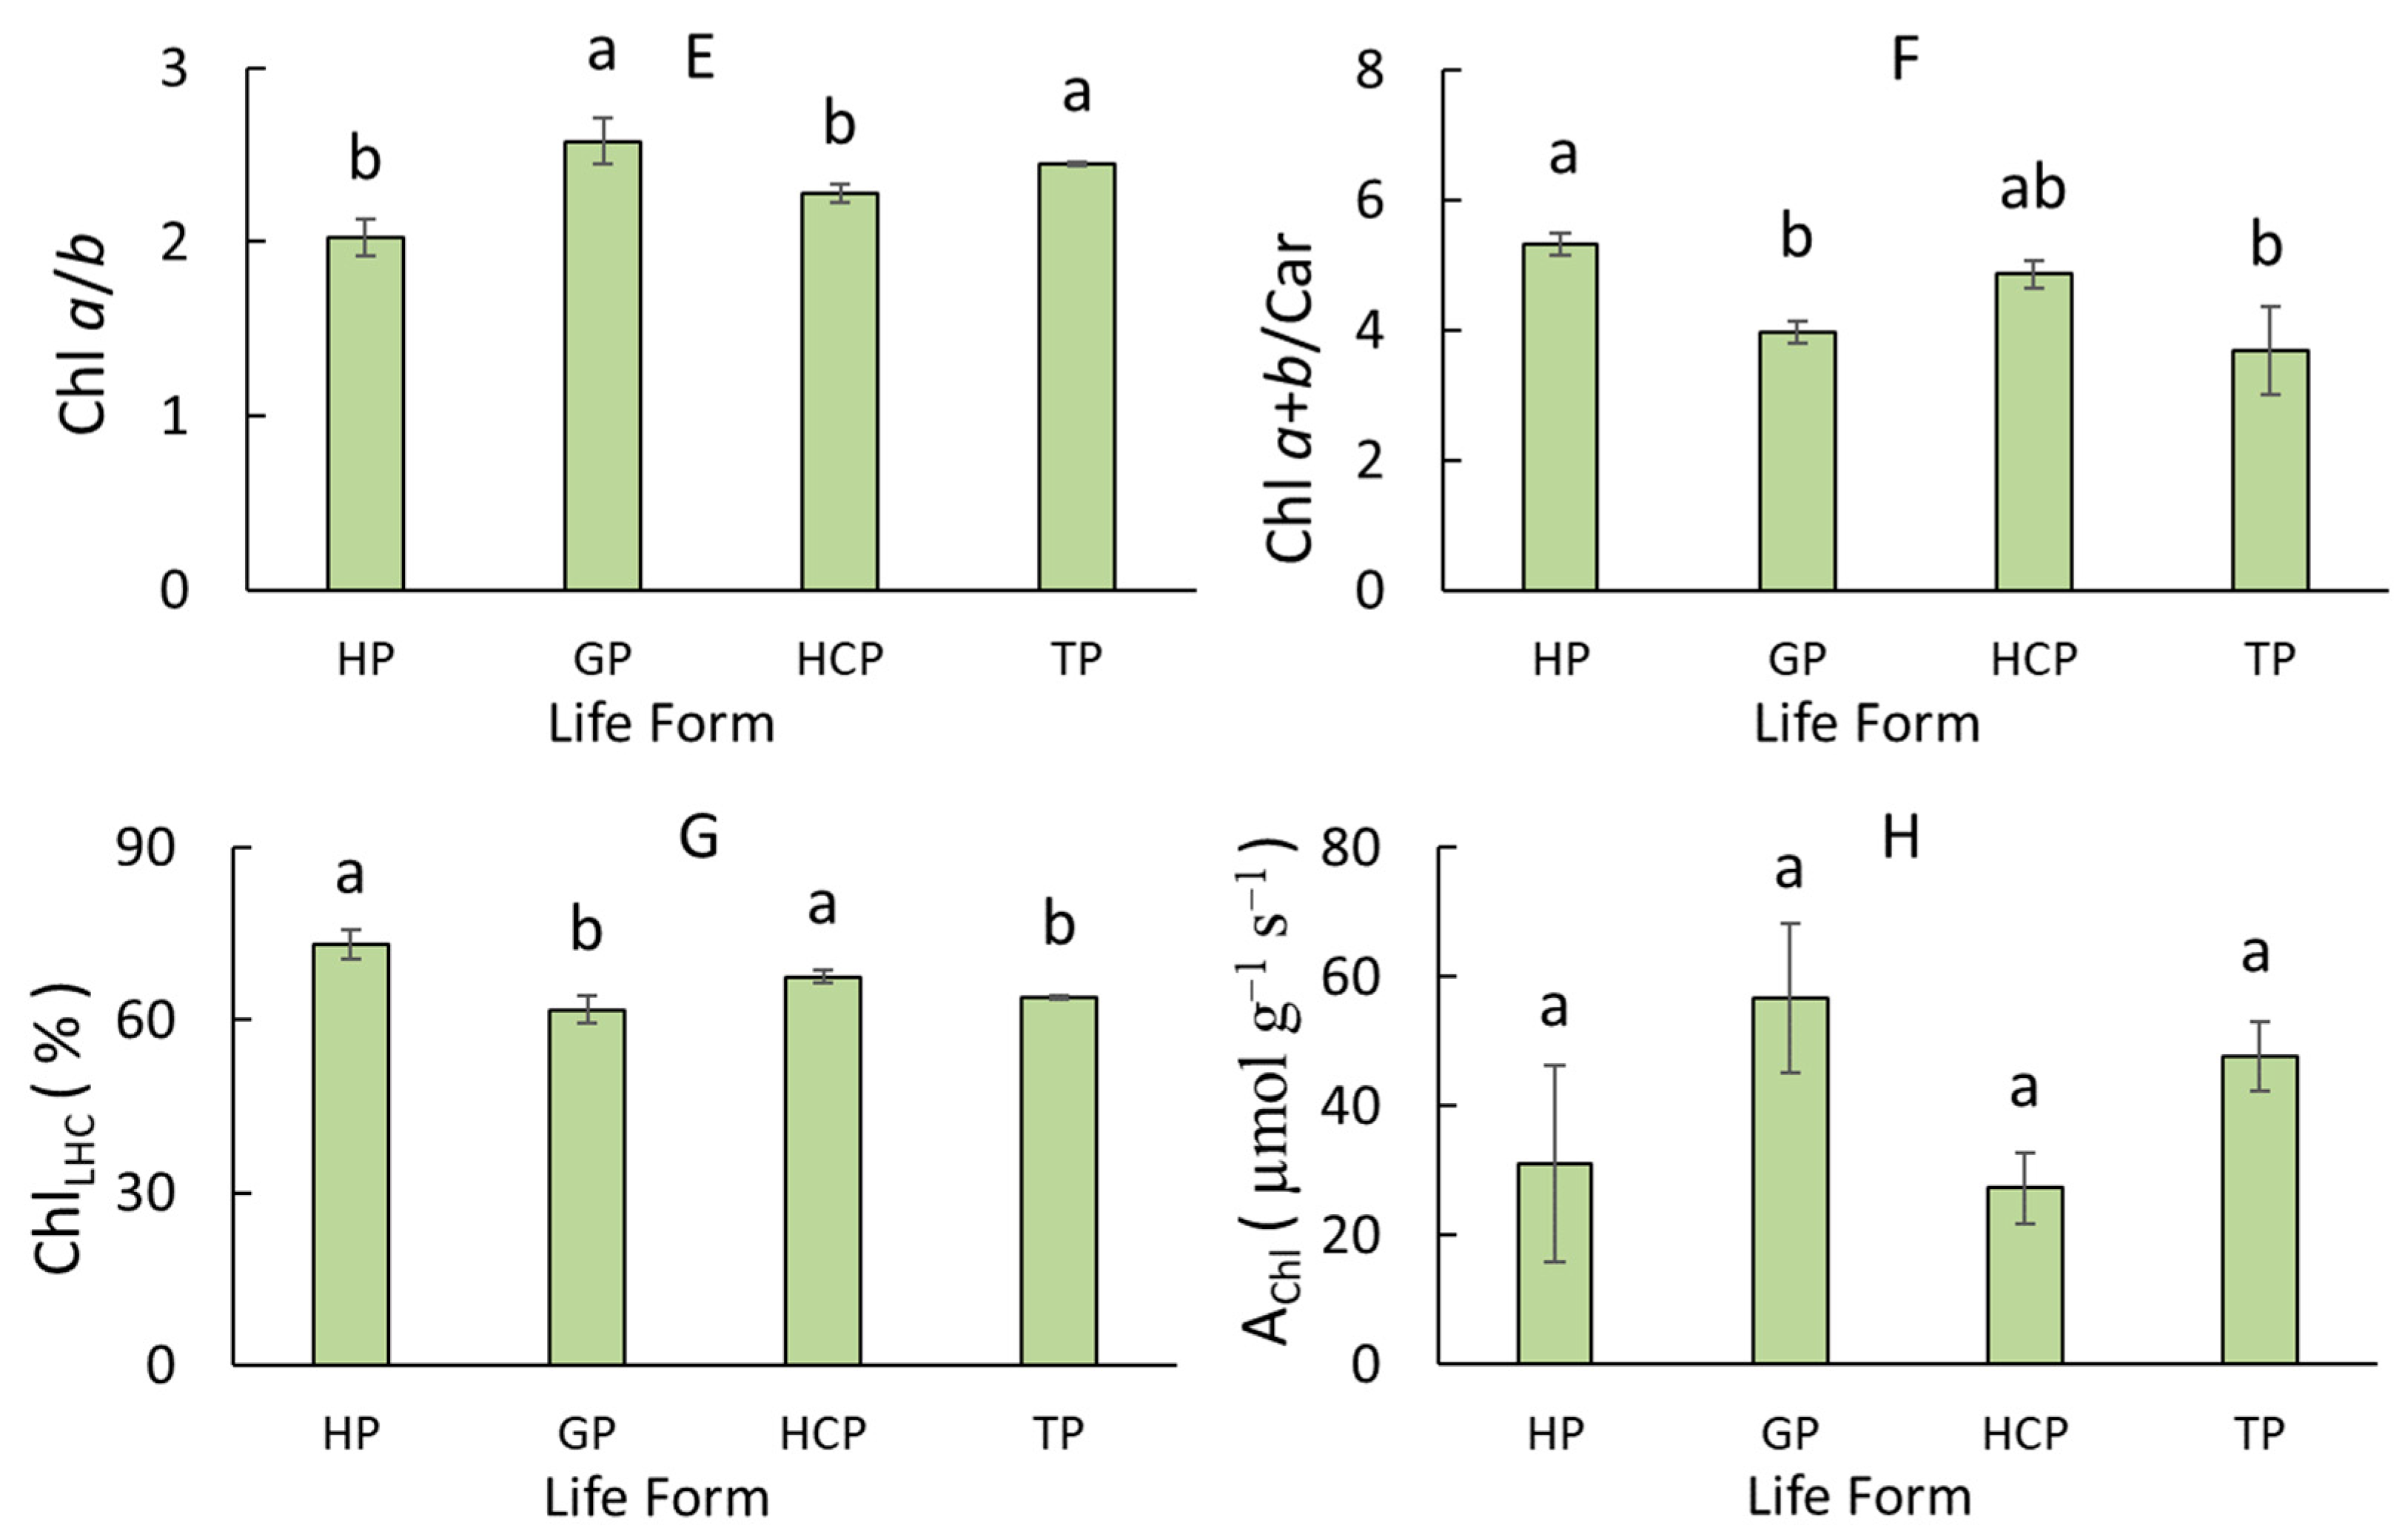
Among the dicotyledonous wetland plants, species of various life forms differed in terms of ChlDW, CarDW, Chl a/b, Chl a+b/Car, and ChlLHC (Figure 2C–G). Geophytes and hemicryptophytes contained lower ChlDW than helophytes by 2.5- and 1.6-fold, respectively (Figure 2C). The CarDW in the geophytes and hemicryptophytes was also about two-fold lower than in the helophytes and therophytes (Figure 2D). The Chl a/b was higher in the geophytes and therophytes compared to the helophytes and hemicryptophytes, and the reverse was true for Chl a+b/Car and ChlLHC (Figure 2E–G). The ChlFW, CarFW, and AChl did not differ in the various life forms (Figure 2A,B,H).
3.3. Variation of Leaf Pigment Complex Traits in Monocots of Different Families
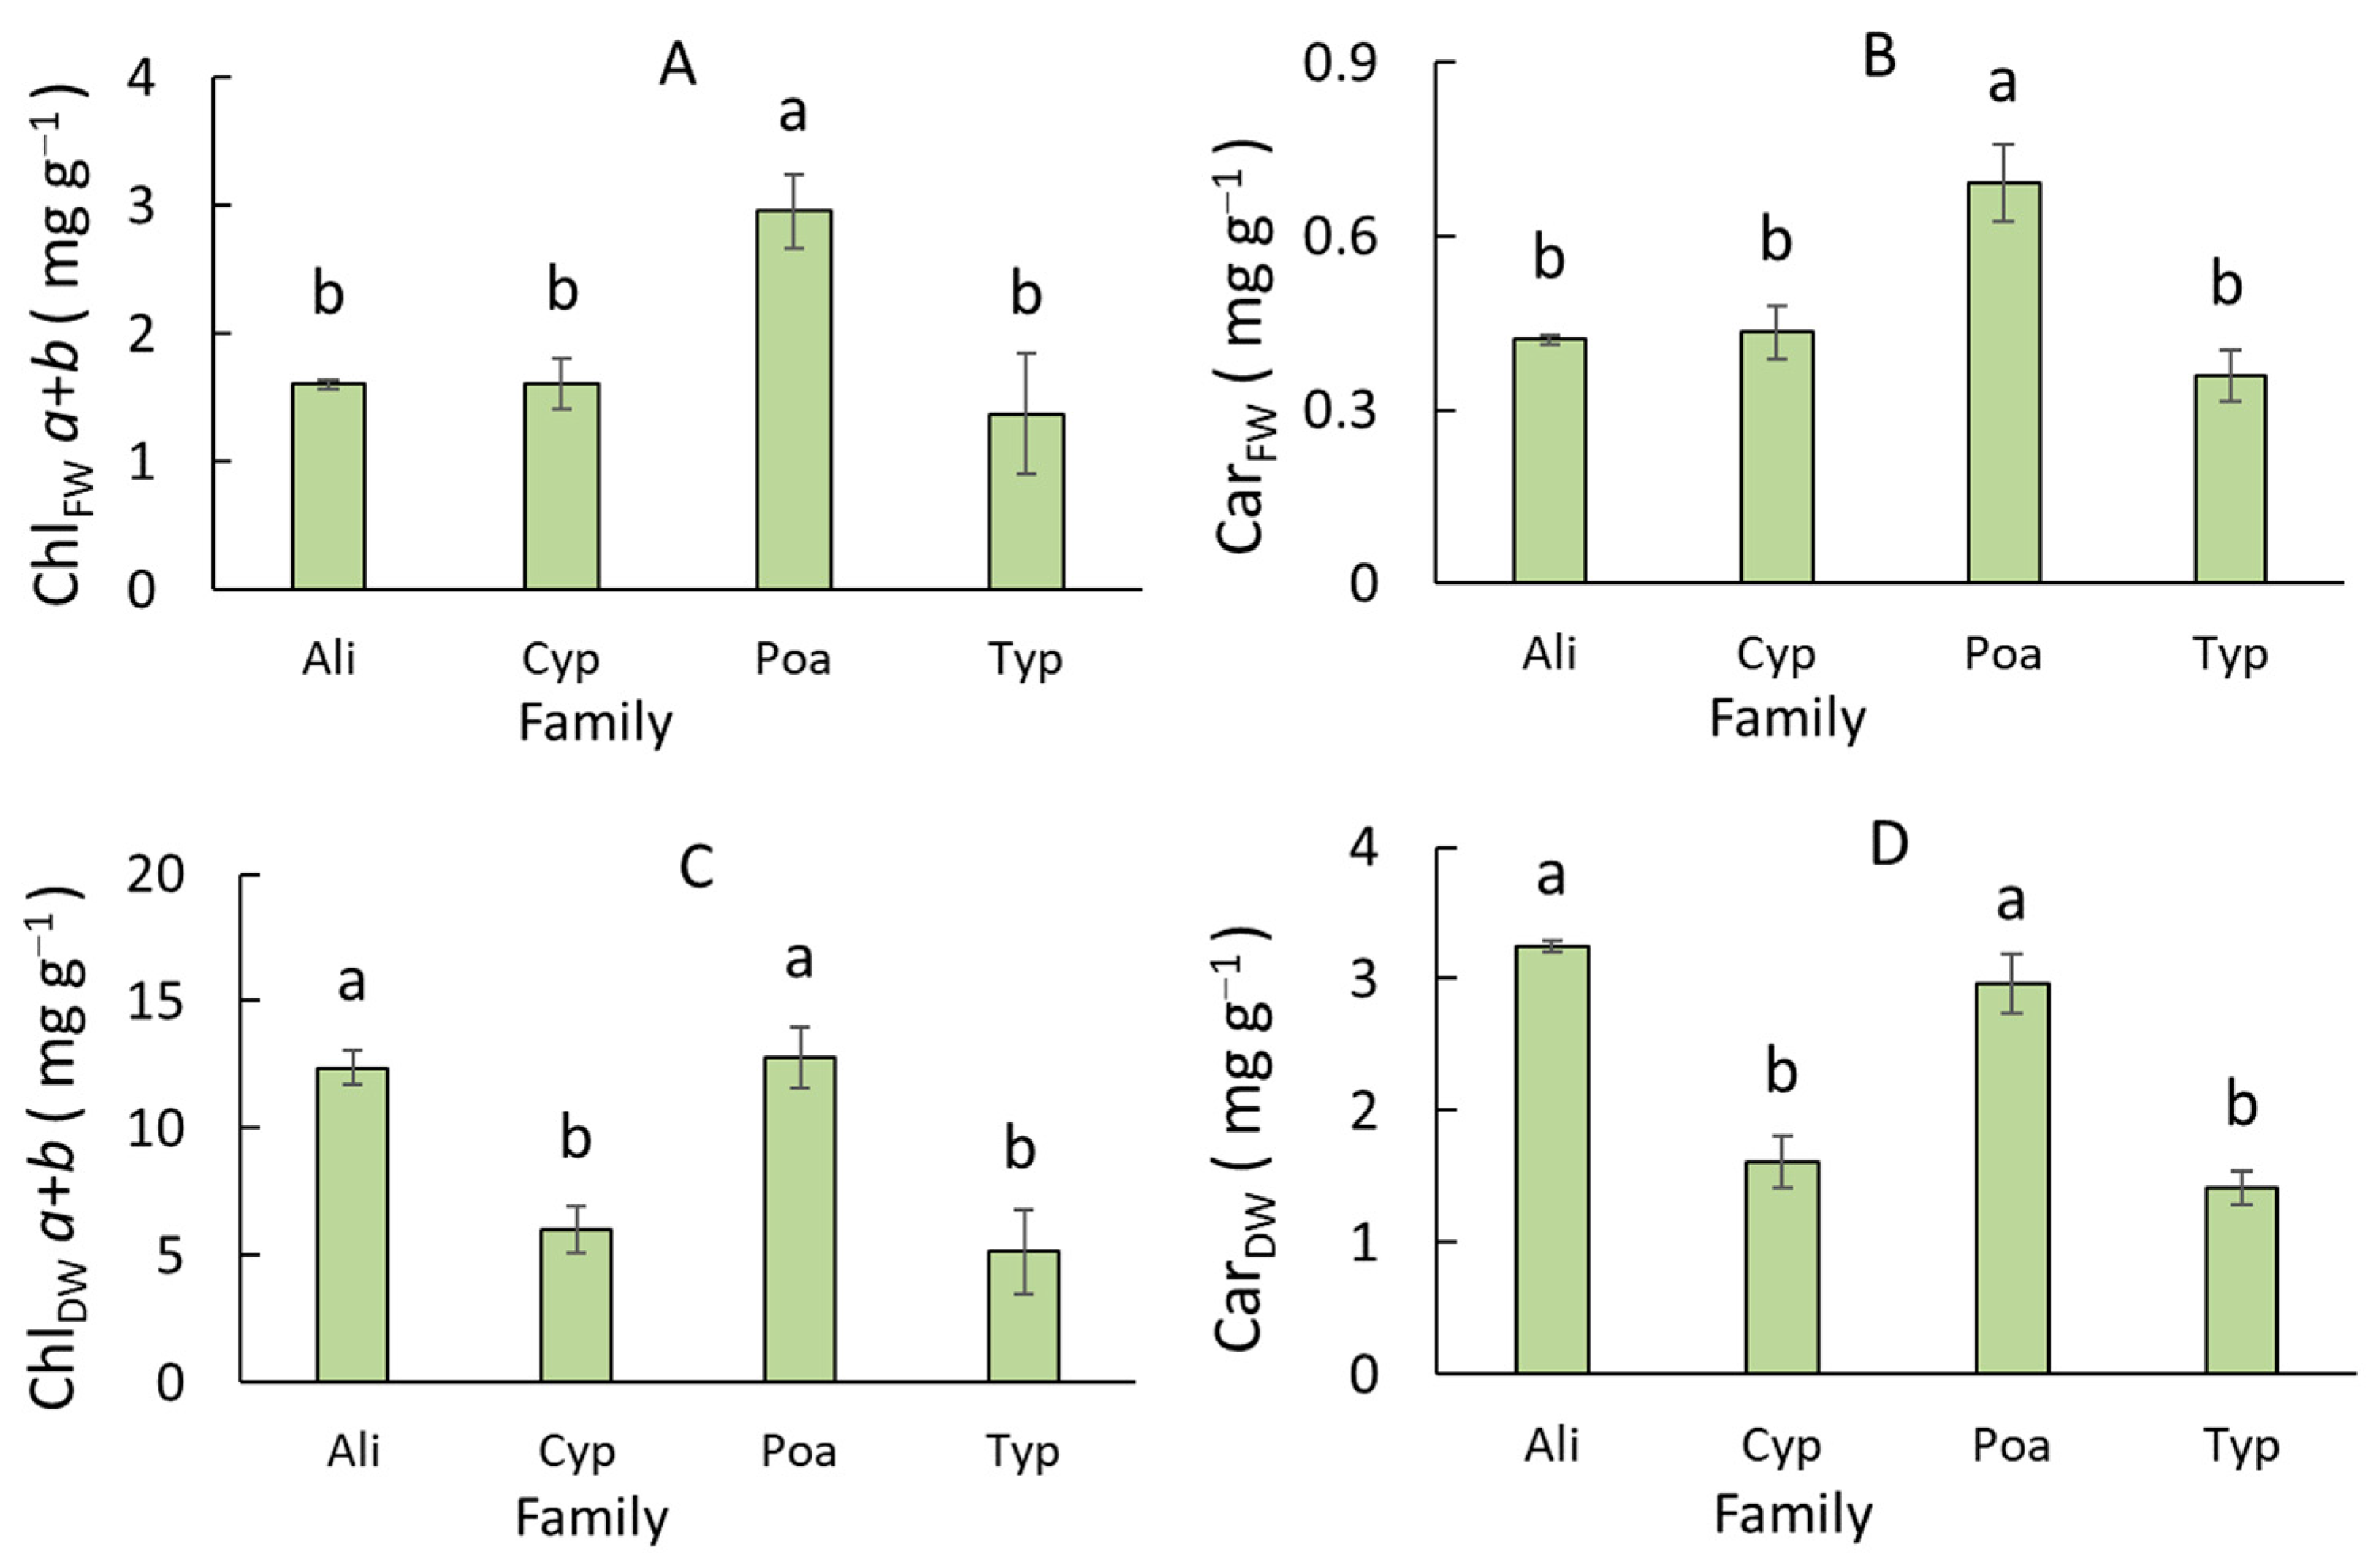
Among the monocotyledonous wetland plants, species of various families differed in terms of ChlFW, CarFW, ChlDW, and CarDW (Figure 3A–D). Species in the Poaceae family contained 1.7-fold greater ChlFW and CarFW compared to species in other families (Figure 3A,B). The ChlDW and CarDW in Cyperaceae and Typhaceae were about 2-fold lower than in Alismataceae and Poaceae (Figure 3C,D). The Chl a/b, Chl a+b/Car, ChlLHC, and AChl did not differ in various families (Figure 3E–H).
3.4. Relationships between Leaf Pigment Complex Parameters, Leaf Traits, and Plant Productivity
In the wetland plants, the ChlDW was significantly negatively correlated with LMA in the dicotyledonous and monocotyledonous species (Figure 4A). In contrast to the monocots, the dicots presented a significant positive correlation between Chl a/b and LMA (Figure 4B). In addition, the dicots presented significant positive correlations between ChlLHC and leaf canopy traits, LAR, and LAI (Figure 4C,D), and a negative correlation between ChlDW and aboveground biomass (Figure 4G). Unlike the dicots, the monocots showed significant positive relationships between ChlDW and ADW, and ChlArea was positively correlated with plant height (Figure 4E,F). In the dicots and monocots, ChlArea was positively correlated with aboveground biomass (Figure 4H).
4. Discussion
The light environment is the main factor influencing the content and ratio of photosynthetic pigments in plants [6,8,11,34,35]. Despite similar light conditions (open, wet habitats without trees and shrubs), the plants of the Middle Ural wetlands studied herein showed a significant variation in their leaf pigment complex traits. Thus, the ChlFW and ChlDW changed by 10-fold, and the CarFW and CarDW varied by 4.5- and 6-fold, respectively, among wetland plant species (Table 1). This ChlDW variation was higher than that found previously in forest species (from 3.9 to 16.0 mg g−1) and in species of steppe slopes (from 2.8 to 7.8 mg g−1) in the same southern taiga subzone of the Middle Urals [36]. The variation in ChlDW and CarDW in wetland plants in the Middle Urals was also higher compared to macrophytes in the European Northeast Russia, in which ChlDW and CarDW changed only three-fold [27]. In the wetland plants in the Middle Urals, the ratios of pigments were the least variable (Table 1). Similar results have been previously obtained for emergent plants in the European Northeast Russia [27] and species from other terrestrial ecosystems [16,26,36].
This research revealed the influence of taxonomy at the level of classes on the variation of leaf pigment complex traits among wetland plants (Table 1). First, the dicots had 1.4-fold greater ChlDW and had a higher Chl a+b/Car and lower Chl a/b than the monocots. Second, different relationships were found between pigment complex parameters and leaf traits and aboveground biomass among the dicots and monocots. In the dicots, the ChlLHC was positively correlated with parameters of the leaf canopy, LAR and LAI (Figure 4C,D), and ChlDW was negatively correlated with aboveground biomass (Figure 4G). In monocots, the chlorophyll content was positively correlated with CO2 uptake rate and plant height (Figure 4E,F). In addition, different influences of life forms and families on the variation of leaf pigment complex traits in the dicots and monocots were found (Table 2). In the dicots, the effect of the type of life form on certain parameters was revealed. Geophytes and hemicryptophytes contained lower ChlDW and CarDW than helophytes and therophytes (Figure 2C,D). In addition, geophytes and therophytes had a higher Chl a/b and lower Chl a+b/Car and ChlLHC compared to helophytes and hemicryptophytes (Figure 2E–G). This suggests that helophytes and hemicryptophytes are more shade-tolerant than geophytes and therophytes.
Unlike the wetland dicots, an influence of the type of family on several leaf pigment complex traits was revealed in the monocots (Table 2). Species of the Poaceae family had greater ChlDW and CarDW due to their higher concentrations of pigments per fresh weight compared to species of other families (Figure 3A,B). A negative correlation between ChlDW and LMA was found in the monocots as well (Figure 4A); thus, high ChlDW and CarDW were detected in species of the family Alismataceae (Figure 3C,D). The positive relationship between ChlDW and ADW suggests the greater productivity of the species from the families Alismataceae and Poaceae (Figure 4E).
The peculiarities of the photosynthetic pigment compositions and content found in dicotyledonous and monocotyledonous wetland plants have adaptive implications. The high ChlDW in the dicots compared to the monocots (Table 1) due to low LMA (Figure 4A) corresponds to the concept of plant leaf acclimation to shading [10,11,17,22,36,37]. So, a high ChlDW was partially associated with an increase in chlorophyll b content, which was confirmed by a significantly lower Chl a/b and a greater ChlLHC level in the dicots compared to the monocots. Previously, such pigment complex traits were found in plant species inhabiting the lower layers of wetland communities of tall helophytes or shrubs and possessing stress-tolerant characteristics [38]. In dicots, the level of ChlLHC was positively correlated with the parameters of the leaf canopy, i.e., LAR and LAI (Figure 4C,D). These relationships demonstrate that species with a larger total leaf area surface, and as a result, with a greater degree of self-shading, contain more chlorophylls in the light-harvesting complex. An increase in the content of light-harvesting complex chlorophylls rather than chlorophylls of reaction centers demonstrated the lack of correlation between chlorophyll content and photosynthetic rates and plant height in the dicots (Figure 4E,F). Since dicotyledonous plant species are rarely dominant in wetland communities [39], their pigment complex is highly flexible, which allows them to regulate the content and the ratio of pigments depending on the light conditions within plant communities.
The wetland monocots presented a greater degree of variation in pigment content (ChlFW, CarFW, and ChlArea) but a lower degree of variation in the parameters describing the light-harvesting complex (Chl a/b and ChlLHC) than the dicots (Table 1). This indicates that there was a difference in the number of reaction centers rather than the light-harvesting complex bulk with a change in the chlorophyll content of the monocots. Therefore, there was no relationship between ChlLHC and leaf canopy parameters (LAR and LAI) (Figure 4C,D), while the chlorophyll content was positively correlated with CO2 uptake rate and plant height (Figure 4E,F). The latter relationship may provide a greater growth rate for wetland monocots, allowing them to occupy dominant positions in plant communities. Previously, a relationship between chlorophyll content and photosynthetic capacity was observed in plants of different functional groups [9,10,11,12,13,14].
A lack of differences in ChlArea between the different systematic groups and life forms was found in a prior meta-analysis of about 800 plant species [1]. Plants in different habitats (except for those with strong shading) within the same locality also had a comparable ChlArea [3,29]. In this research, despite the significant differences in the ChlDW between the dicots and monocots (Table 1) as well as among the different life forms (Figure 2C) and families (Figure 3C), a relationship between ChlDW and LMA was common for both classes (Figure 4A), which led to a comparable ChlArea in the different wetland plant groups (Table 1 and Table 2). The negative correlation between ChlDW and LMA found in the wetland plants in this study had previously been established in plants of different functional types and biomes [10,11,16,19]. Similar positive relationships between ChlArea and aboveground biomass were found for dicots and monocots (Figure 4H). Differences in AChl between the different systematic groups and life forms were also not detected in this study (Table 1 and Table 2). This indicates a similar ability of the leaf area unit to absorb solar energy and comparable functional activity of chlorophyll in wetland plants of different life forms and families.
The uncovered relationships between leaf chlorophyll content, CO2 uptake rate, and aboveground biomass could be used to model the productivity of wetland plant communities. Since a plant’s leaf chlorophyll content is an indicator of both productivity and plant environmental stress, the estimation of plant viability in terrestrial biomes by the chlorophyll content is widely used to predict their alterations under climate change [14,40,41]. The revealed differences between dicots and monocots are useful for planning the restoration of wetlands with the level of productivity required for communities to regulate carbon sinks.
5. Conclusions
The wetland plants of the Middle Urals showed significant variation in leaf chlorophyll and carotenoid content per fresh and dry weight. Influences of taxonomy at the level of classes and families on the variation of leaf pigment complex traits in wetland plants were revealed. In dicots only, an effect of the type of life form on the content and the ratio of pigments was found. Dicots had greater ChlDW and a lower Chl a/b and a greater ChlLHC than monocots. An increase in the content of light-harvesting complex chlorophylls was related to the enlarging of leaf canopy parameters. Generally, a highly flexible pigment complex of dicots allows for the regulation of the content and ratio of pigments, depending on the light conditions within the plant communities.
Unlike the dicots, the wetland monocots presented a degree of lower variation in the parameters describing the light-harvesting complex (Chl a/b and ChlLHC). In the monocots only, an effect of the type of family on the pigment content was found. The chlorophyll content was positively correlated with CO2 uptake rate and plant height. Such relationships in wetland monocots could enable higher growth rates, thereby allowing them to occupy dominant positions in plant communities.
The lack of differences in ChlArea and AChl between the different systematic groups and life forms indicates a similar ability of the leaf area unit to absorb solar energy and comparable functional activity of chlorophyll in wetland plants. Evidently, this contributed to a similar positive relationship between ChlArea and aboveground biomass in the monocotyledonous and dicotyledonous wetland species.
Supplementary Materials
The following supporting information can be downloaded at: https://www.mdpi.com/article/10.3390/d15030372/s1, Table S1: List of studied wetland plant species with designation of families, life forms, and sampling sites. Table S2: Results of one-way ANOVA of leaf pigment complex traits for dicotyledonous and monocotyledonous wetland plants from different sampling sites.
Funding
This research was funded by the budget theme of the Institute Botanic Garden of the Ural Branch of the Russian Academy of Sciences No. 1022040100468-6-1.6.11;1.6.20 and the state assignment FEWZ-2020-0009 from the Ministry of Education and Science of the Russian Federation.
Institutional Review Board Statement
Not applicable.
Informed Consent Statement
Not applicable.
Data Availability Statement
The data are available upon request from the corresponding author.
Conflicts of Interest
The author declares no conflict of interest. The funders had no role in the design of the study; in the collection, analyses, or interpretation of data; in the writing of the manuscript, or in the decision to publish the results.
References
- Esteban, R.; Barrutia, O.; Artetxe, U.; Fernandez-Marin, B.; Hernandez, A.; Garcia-Plazaola, J.I. Internal and external factors affecting photosynthetic pigment composition in plants: A meta-analytical approach. New Phytol. 2015, 206, 268–280. [Google Scholar] [CrossRef]
- Demmig-Adams, B.; Adams, W.W., III. Photoprotection in an ecological context: The remarkable complexity of thermal energy dissipation. New Phytol. 2006, 172, 11–21. [Google Scholar] [CrossRef]
- Gao, J.; Wang, H.; Yuan, Q.; Feng, Y. Structure and Function of the Photosystem Supercomplexes. Front. Plant Sci. 2018, 9, 357. [Google Scholar] [CrossRef] [Green Version]
- Croce, R. Chlorophyll-binding proteins of higher plants and cyanobacteria. In Photosynthesis: Plastid Biology, Energy Conversion and Carbon Assimilation, Advances in Photosynthesis and Respiration; Eaton-Rye, J.J., Tripathy, B.C., Sharkey, T.D., Eds.; Springer: Dordrecht, The Netherlands, 2012; pp. 127–149. [Google Scholar]
- Cazzaniga, S.; Li, Z.; Niyogi, K.K.; Bassi, R.; Dall’Osto, L. The Arabidopsis szl1 mutant reveals a critical role of b-carotene in photosystem I photoprotection. Plant Physiol. 2012, 159, 1745–1758. [Google Scholar] [CrossRef] [Green Version]
- Ballottari, M.; Dall’Osto, L.; Morosinotto, T.; Bassi, R. Contrasting behavior of higher plant photosystem I and II antenna systems during acclimation. J. Biol. Chem. 2007, 282, 8947–8958. [Google Scholar] [CrossRef] [Green Version]
- Lichtenthaler, H.K.; Ač, A.; Marek, M.V.; Kalina, J.; Urban, O. Differences in pigment composition, photosynthetic rates and chlorophyll fluorescence images of sun and shade leaves of four tree species. Plant Physiol. Biochem. 2007, 45, 577–588. [Google Scholar] [CrossRef]
- Rossatto, D.R.; de Araújo, P.E.; da Silva, B.H.P.; Franco, A.C. Photosynthetic responses of understory savanna plants: Implications for plant persistence in savannas under tree encroachment. Flora 2018, 240, 34–38. [Google Scholar] [CrossRef]
- Lippert, I.; Rolletschek, H.; Kohl, J.-G. Photosynthetic pigments and efficiencies of two Phragmites australis stands in different nitrogen availabilities. Aquat. Bot. 2001, 69, 359–365. [Google Scholar] [CrossRef]
- Ronzhina, D.A.; Nekrasova, G.F.; P’yankov, V.I. Comparative characterization of the pigment complex in emergent, floating, and submerged leaves of hydrophytes. Rus. J. Plant Physiol. 2004, 51, 21–27. [Google Scholar] [CrossRef]
- Slemnev, N.N.; Sheremet’ev, S.N.; Maslova, T.G.; Tsoozh, S.; Altantsoozh, A. Variety of photosynthetic plant apparatus of Mongolia: Analysis of biological, ecological and evolutionary series. Bot. Zhurnal 2012, 97, 1377–1396. (In Russian) [Google Scholar]
- Houborg, R.; Cescatti, A.; Migliavacca, M.; Kustas, W. Satellite retrievals of leaf chlorophyll and photosynthetic capacity for improved modeling of GPP. Agric. For. Meteorol. 2013, 177, 10–23. [Google Scholar] [CrossRef]
- Dymova, O.; Dalke, I.; Golovko, T. Pigment characteristics of the plants of northern ecosystems and their correlation with photosynthetic activity. In Photosynthetic Pigments—Chemical Structure, Biological Function and Ecology; Golovko, T.K., Gruszeski, W.I., Prasad, M.N.V., Strzalka, K., Eds.; Komi Scientific Centre of the Ural Branch of the Russian Academy of Sciences: Syktyvkar, Russia, 2014; pp. 221–236. [Google Scholar]
- Croft, H.; Chen, J.M.; Luo, X.; Bartlett, P.; Chen, B.; Staebler, R.M. Leaf chlorophyll content as a proxy for leaf photosynthetic capacity. Glob. Chang. Biol. 2017, 23, 3513–3524. [Google Scholar] [CrossRef] [Green Version]
- Sack, L.; Grubb, P.J.; Marañón, T. The functional morphology of juvenile plants tolerant of strong summer drought in shaded forest understories in southern Spain. Plant Ecol. 2003, 168, 139–163. [Google Scholar] [CrossRef]
- Ivanov, L.A.; Ronzhina, D.A.; Ivanova, L.A. Changes in leaf characteristics as indicator of the alteration of functional types of steppe plants along the aridity gradient. Russ. J. Plant Physiol. 2008, 55, 301–307. [Google Scholar] [CrossRef]
- Zunzunegui, M.; Diaz-Barradas, M.C.; Jauregui, J.; Rodriguez, H.; Alvarez-Cansino, L. Season-dependent and independent responses of Mediterranean scrub to light conditions. Plant Physiol. Biochem. 2016, 102, 80–91. [Google Scholar] [CrossRef]
- Li, Y.; Liu, C.; Zhang, J.; Yang, H.; Xu, L.; Wang, Q.; Sack, L.; Wu, X.; Hou, J.; He, N. Variation in leaf chlorophyll concentration from tropical to cold-temperate forests: Association with gross primary productivity. Ecol. Ind. 2018, 85, 383–389. [Google Scholar] [CrossRef]
- Liu, C.; Li, Y.; Zhang, J.; Baird, A.S.; He, N. Optimal community assembly related to leaf economic- hydraulic-anatomical traits. Front. Plant Sci. 2020, 11, 341. [Google Scholar] [CrossRef]
- Golovko, T.; Dymova, O.; Yatsco, Y.; Tabalenkova, G. Photosynthetic pigments apparatus in the northern plants. In Handbook of Plant and Crop Stress, 3rd ed.; Pessarakli, M., Ed.; Marcel Dekker Inc.: New York, NY, USA, 2011; pp. 391–405. [Google Scholar]
- Dymova, O.; Golovko, T. Photosynthetic pigments in native plants of the taiga zone at the European Northeast Russia. Russ. J. Plant Physiol. 2019, 66, 384–392. [Google Scholar] [CrossRef]
- Maslova, T.G.; Popova, I.A. Adaptive properties of the pigment systems. Photosynthetica 1993, 29, 195–203. [Google Scholar]
- Voronin, P.Y.; Ivanova, L.A.; Ronzhina, D.A.; Ivanov, L.A.; Anenkhonov, O.A.; Black, C.C.; Gunin, P.D.; P’yankov, V.I. Structural and functional changes in the leaves of plants from steppe communities as affected by aridization of the Eurasian climate. Russ. J. Plant Physiol. 2003, 50, 604–611. [Google Scholar] [CrossRef]
- Ivanova, L.A.; Yudina, P.K.; Ronzhina, D.A.; Ivanov, L.A.; Hölzel, N. Quantitative mesophyll parameters rather than whole-leaf traits predict response of C3 steppe plants to aridity. New Phytol. 2018, 217, 558–570. [Google Scholar] [CrossRef] [PubMed] [Green Version]
- Ivanov, L.A.; Ivanova, L.A.; Ronzhina, D.A.; Yudina, P.K. Changes in the chlorophyll and carotenoid contents in the leaves of steppe plants along latitudinal gradient in South Ural. Russ. J. Plant Physiol. 2013, 60, 812–820. [Google Scholar] [CrossRef]
- Li, Y.; He, N.; Hou, J.; Xu, L.; Liu, C.; Zhang, J.; Wang, Q.; Zhang, X.; Wu, X. Factors influencing leaf chlorophyll content in natural forests at the biome scale. Front. Ecol. Evol. 2018, 6, 64. [Google Scholar] [CrossRef] [Green Version]
- Dymova, O.V.; Dalke, I.V. Photosynthetic pigments and CO2-exchange of macrophytes in the middle taiga subzone. Proc. Komi Sci. Centre Ural Branch Russ. Acad. Sci. 2016, 25, 37–44. (In Russian) [Google Scholar]
- Gorchakovskii, P.L.; Shurova, E.A.; Knyazev, M.S. (Eds.) Opredelitel’ Sosudistykh Rastenii Srednego Urala (Identifier of Vascular Plants in the Middle Urals); Nauka: Moscow, Russia, 1994; 525p. (In Russian) [Google Scholar]
- Raunkiaer, C. The Life Forms of Plants and Statistical Plant Geography; Oxford at the Clarendon Press: Oxford, UK, 1934; 632p. [Google Scholar]
- Kulikov, P.V. Opredelitel’ Sosudistykh Rrastenii Chelyabinskoi Oblasti (Synopsis of the Flora of the Chelyabinsk Region (Vascular Plants); Geotour: Yekaterinburg–Miass, Russia, 2005; 537p. (In Russian) [Google Scholar]
- Wellburn, A.R. The spectral determination of chlorophylls a and b, as well as total carotenoids, using various solvents with spectrophotometers of different resolution. J. Plant Physiol. 1994, 144, 307–317. [Google Scholar] [CrossRef]
- Sofronova, V.E.; Chepalov, V.A.; Dymova, O.V.; Golovko, T.K. The role of pigment system of an evergreen dwarf shrub Ephedra monosperma in adaptation to the climate of Central Yakutia. Russ. J. Plant Physiol. 2014, 61, 246–254. [Google Scholar] [CrossRef]
- Dymova, O.V.; Golovko, T.K. Pigment apparatus in Ajuga reptans plants as affected by adaptation to light growth conditions. Russ. J. Plant Physiol. 2007, 54, 39–45. [Google Scholar] [CrossRef]
- Lichtenthaler, H.K. Chlorophylls and carotenoids: Pigments of photosynthetic biomembranes. Methods Enzymol. 1987, 148, 350–382. [Google Scholar]
- Chen, F.; Zhao, G.; Shen, Y.; Li, Z.; Tan, B.; Zhu, H.; Wang, Q.; Fu, X. Shading gradients drive differential responses of leaf traits in an early community germinated by forest topsoil. Diversity 2022, 14, 600. [Google Scholar] [CrossRef]
- Ivanov, L.A.; Ronzhina, D.A.; Yudina, P.K.; Kalashnikova, I.V.; Ivanova, L.A.; Zolotareva, N.V. Seasonal dynamics of the chlorophyll and carotenoid content in the leaves of steppe and forest plants on species and community level. Russ. J. Plant Physiol. 2020, 67, 453–462. [Google Scholar] [CrossRef]
- Valladares, F.; Martinez-Ferri, E.; Balaguer, L.; Perez-Corona, E.; Manrique, E. Low leaf-level response to light and nutrients in Mediterranean evergreen oaks: A conservative resource-use strategy. New Phytol. 2000, 148, 79–91. [Google Scholar] [CrossRef] [Green Version]
- Ronzhina, D.A. Ecological differentiation between invasive and native species of the genus Epilobium in riparian ecosystems is associated with plant functional traits. Russ. J. Biol. Invas. 2020, 11, 132–142. [Google Scholar] [CrossRef]
- Chemeris, E.V. Rastitel’nyi Pokrov Istokovykh Vetlandov Verkhnego Povolzh’ya (Vegetation Cover of the Upper Volga Region Source Wetlands); Rybinskii Dom Pechati: Rybinsk, Russia, 2004; 158p. (In Russian) [Google Scholar]
- Luo, X.; Croft, H.; Chen, J.M.; He, L.; Keenan, T.F. Improved estimates of global terrestrial photosynthesis using information on leaf chlorophyll content. Glob. Chang. Biol. 2019, 25, 2499–2514. [Google Scholar] [CrossRef] [Green Version]
- Zhang, Y.; He, N.; Yu, G. Opposing shifts in distributions of chlorophyll concentration and composition in grassland under warming. Sci. Rep. 2021, 11, 15736. [Google Scholar] [CrossRef]
Figure 1.
Ratios of life forms (A) (HP, helophyte; GP, geophyte; HCP, hemicryptophyte; TP, therophyte; CP, chamaephyte) and families (B) (Dicots: Ast, Asteraceae; Lam, Lamiaceae; Ona, Onagraceae; Pol, Polygonaceae; Pri, Primulaceae; Ran, Ranunculaceae; Oths, all other families in which only one species has been studied. Monocots: Ali, Alismataceae; Cyp, Cyperaceae; Poa, Poaceae; Typ, Typhaceae; Oths, all other families in which only one species has been studied) in the total sample of dicotyledonous and monocotyledonous wetland plant species studied.

Figure 2.
Leaf pigment complex traits in dicotyledonous wetland plants of different life forms (HP, helophyte; GP, geophyte; HCP, hemicryptophyte; TP, therophyte). (A) Chlorophyll and (B) carotenoid content per fresh weight. (C) Chlorophyll and (D) carotenoid content per dry weight. (E) Ratio of chlorophylls a and b. (F) Ratio of chlorophylls and carotenoids. (G) Proportion of chlorophyll in the light-harvesting complex. (H) CO2 uptake rate per unit of chlorophyll weight. Different letters indicate significant differences between life forms (p < 0.05). Error bars represent standard error (SE).


Figure 3.
Leaf pigment complex traits in monocotyledonous wetland plants of different families (Ali, Alismataceae; Cyp, Cyperaceae; Poa, Poaceae; Typ, Typhaceae). (A) Chlorophyll and (B) carotenoid content per fresh weight. (C) Chlorophyll and (D) carotenoid content per dry weight. (E) Ratio of chlorophylls a and b. (F) Ratio of chlorophylls and carotenoids. (G) Proportion of chlorophyll in the light-harvesting complex. (H) CO2 uptake rate per unit of chlorophyll weight. Different letters indicate significant differences between life forms (p < 0.05). Error bars represent standard error (SE).


Figure 4.
The relationship between (A) chlorophyll content per dry weight and LMA, (B) ratio of chlorophylls a and b and LMA, (C) proportion of chlorophyll in the light-harvesting complex and LAR, (D) proportion of chlorophyll in the light-harvesting complex and LAI, (E) chlorophyll content per dry weight and CO2 uptake rate per dry weight, (F) chlorophyll content per area unit and plant height, (G) chlorophyll content per dry weight and aboveground biomass, and (H) chlorophyll content per area unit and aboveground biomass. D—red, empty squares and dotted line represent dicots; M—blue, filled circles and a solid line denote monocots. Significance of correlation coefficient r: ns, not significant; *, p < 0.05; **, p < 0.01; ***, p < 0.001.


Table 1.
Statistics of leaf pigment complex traits in dicotyledonous (n = 19) and monocotyledonous (n = 25) wetland plant species. Different letters denote significant differences between dicots and monocots at p < 0.05. SE, standard error; CV, coefficient of variation.
Table 1.
Statistics of leaf pigment complex traits in dicotyledonous (n = 19) and monocotyledonous (n = 25) wetland plant species. Different letters denote significant differences between dicots and monocots at p < 0.05. SE, standard error; CV, coefficient of variation.
| Traits | Mean | SE | Minimum | Maximum | CV | |
|---|---|---|---|---|---|---|
| ChlFW a+b, mg g−1 | Dicots | 1.95a | 0.10 | 1.33 | 2.66 | 0.23 |
| Monocots | 1.87a | 0.18 | 0.44 | 4.38 | 0.49 | |
| Total | 1.90 | 0.11 | 0.44 | 4.38 | 0.39 | |
| CarFW, mg g−1 | Dicots | 0.44a | 0.03 | 0.25 | 0.84 | 0.29 |
| Monocots | 0.47a | 0.04 | 0.22 | 0.99 | 0.42 | |
| Total | 0.45 | 0.03 | 0.22 | 0.99 | 0.37 | |
| ChlDW a+b, mg g−1 | Dicots | 11.79a | 1.13 | 5.23 | 21.91 | 0.42 |
| Monocots | 8.56b | 0.85 | 2.20 | 18.51 | 0.50 | |
| Total | 9.95 | 0.72 | 2.20 | 21.91 | 0.48 | |
| CarDW, mg g−1 | Dicots | 2.56a | 0.22 | 1.27 | 4.80 | 0.37 |
| Monocots | 2.14a | 0.19 | 0.79 | 3.82 | 0.44 | |
| Total | 2.32 | 0.14 | 0.79 | 4.80 | 0.41 | |
| ChlArea a+b, µg cm−2 | Dicots | 32.82a | 1.50 | 20.81 | 46.53 | 0.20 |
| Monocots | 40.25a | 3.42 | 11.67 | 81.77 | 0.42 | |
| Total | 37.04 | 2.10 | 11.67 | 81.77 | 0.38 | |
| CarArea, µg cm−2 | Dicots | 7.41b | 0.46 | 3.35 | 11.50 | 0.27 |
| Monocots | 10.05a | 0.62 | 5.18 | 17.37 | 0.31 | |
| Total | 8.91 | 0.45 | 3.35 | 17.37 | 0.33 | |
| Chl a/b | Dicots | 2.34b | 0.05 | 1.92 | 2.83 | 0.10 |
| Monocots | 2.53a | 0.03 | 2.22 | 2.99 | 0.07 | |
| Total | 2.44 | 0.03 | 1.92 | 2.99 | 0.09 | |
| Chl a+b/Car | Dicots | 4.58a | 0.18 | 3.01 | 6.35 | 0.17 |
| Monocots | 3.94b | 0.18 | 1.63 | 5.46 | 0.23 | |
| Total | 4.22 | 0.13 | 1.63 | 6.35 | 0.21 | |
| ChlLHC, % | Dicots | 66.35a | 1.07 | 57.42 | 75.52 | 0.07 |
| Monocots | 62.56b | 0.60 | 55.20 | 68.57 | 0.05 | |
| Total | 64.20 | 0.63 | 55.20 | 75.52 | 0.07 | |
| AChl, µmol CO2 g−1 Chl s−1 | Dicots | 36.67a | 4.74 | 11.05 | 84.13 | 0.56 |
| Monocots | 46.82a | 3.80 | 16.64 | 94.86 | 0.41 | |
| Total | 42.44 | 3.04 | 11.05 | 94.86 | 0.47 |
Table 2.
Results of one-way ANOVA of leaf pigment complex traits in dicotyledonous and monocotyledonous wetland plants. F values and their significance (ns, not significant; *, p ≤ 0.05; **, p ≤ 0.01; ***, p ≤ 0.001) are presented.
Table 2.
Results of one-way ANOVA of leaf pigment complex traits in dicotyledonous and monocotyledonous wetland plants. F values and their significance (ns, not significant; *, p ≤ 0.05; **, p ≤ 0.01; ***, p ≤ 0.001) are presented.
| Traits | Dicots | Monocots | ||
|---|---|---|---|---|
| Life Form n = 18 df = 3, 14 | Family n = 13 df = 5, 7 | Life Form n = 24 df = 2, 21 | Family n = 20 df = 3, 16 | |
| ChlFW a+b, mg g−1 | 0.88 ns | 1.20 ns | 0.57 ns | 6.80 ** |
| CarFW, mg g−1 | 2.60 ns | 0.68 ns | 0.60 ns | 6.09 ** |
| ChlDW a+b, mg g−1 | 6.17 ** | 0.75 ns | 0.55 ns | 9.99 ** |
| CarDW, mg g−1 | 7.15 ** | 0.83 ns | 0.09 ns | 13.35 *** |
| ChlArea a+b, µg cm−2 | 0.04 ns | 0.61 ns | 0.36 ns | 1.39 ns |
| CarArea, µg cm−2 | 1.67 ns | 0.85 ns | 0.18 ns | 1.86 ns |
| Chl a/b | 4.55 * | 2.24 ns | 1.00 ns | 2.34 ns |
| Chl a+b/Car | 4.15 * | 1.46 ns | 1.28 ns | 0.75 ns |
| ChlLHC, % | 4.63 * | 1.93 ns | 0.95 ns | 2.14 ns |
| AChl, µmol CO2 g−1 Chl s−1 | 2.66 ns | 2.97 ns | 0.24 ns | 0.66 ns |
Disclaimer/Publisher’s Note: The statements, opinions and data contained in all publications are solely those of the individual author(s) and contributor(s) and not of MDPI and/or the editor(s). MDPI and/or the editor(s) disclaim responsibility for any injury to people or property resulting from any ideas, methods, instructions or products referred to in the content. |
© 2023 by the author. Licensee MDPI, Basel, Switzerland. This article is an open access article distributed under the terms and conditions of the Creative Commons Attribution (CC BY) license (https://creativecommons.org/licenses/by/4.0/).
Share and Cite
MDPI and ACS Style
Ronzhina, D.A. Variation in Leaf Pigment Complex Traits of Wetland Plants Is Related to Taxonomy and Life Forms. Diversity 2023, 15, 372. https://doi.org/10.3390/d15030372
AMA Style
Ronzhina DA. Variation in Leaf Pigment Complex Traits of Wetland Plants Is Related to Taxonomy and Life Forms. Diversity. 2023; 15(3):372. https://doi.org/10.3390/d15030372
Chicago/Turabian StyleRonzhina, Dina A. 2023. "Variation in Leaf Pigment Complex Traits of Wetland Plants Is Related to Taxonomy and Life Forms" Diversity 15, no. 3: 372. https://doi.org/10.3390/d15030372
Note that from the first issue of 2016, this journal uses article numbers instead of page numbers. See further details here.