Article

Environmental Drivers of Functional Structure and Diversity of Vascular Macrophyte Assemblages in Altered Waterbodies in Serbia

Department of Biology and Ecology, Faculty of Sciences, University of Novi Sad, 21000 Novi Sad, Serbia
*
Author to whom correspondence should be addressed.
Diversity 2023, 15(2), 231; https://doi.org/10.3390/d15020231
Submission received: 30 October 2022 / Revised: 27 January 2023 / Accepted: 3 February 2023 / Published: 6 February 2023

Abstract

:
There is a gap in the knowledge about how environmental factors affect functional diversity and trait structures of macrophyte communities in altered waterbodies. We used macrophyte and environmental data collected from 46 waterbodies; we extracted data on 14 traits with 43 attributes for 59 species and calculated seven functional diversity indices. We used redundancy analysis (RDA) to investigate the response of functional diversity indices to the environmental variables. To relate traits to environment we performed the analysis on three data matrices: site by environmental variables (R), site by species (L), and species by traits (Q)—the RLQ analysis, and the 4th corner analyses. The RDA showed that the environmental variables explained 47.43% of the variability in the functional diversity indices. Elevation, hemeroby (integrative measure of the impact of all human intervention) of the land cover classes on the banks, and water conductivity were correlated with all diversity indices. We found that the traits characteristic of floating and emergent plants represents a strategy to increase efficiency in light interception under high nutrient concentrations in lowland waterbodies, while submerged plants dominate nutrient-poorer waterbodies at higher altitudes. Future investigations should be focused on the role of functional diversity and the structure of macrophyte communities in the indication of tradeoffs and/or facilitation between ecosystem services that altered waterbodies provide, in order to guide their adequate management.

1. Introduction

Three types of ecological processes, or filters (i.e., dispersal, abiotic environment, and biotic interactions), shape local species assemblages by progressively filtering species from the regional species pool to local communities, producing non-random patterns in community structure, by acting on species traits rather than on species themselves [1,2,3,4,5]. Species traits are morphological, physiological, and phenological characteristics, measurable at the species or individual level [2]. Dispersal influences the community structure by selecting species according to their ability to disperse to a site [6]. The abiotic environment acts as filter that selects species with suitable traits that can persist in the given habitat, leading to convergent traits and reducing functional diversity [7,8]. Biotic interactions (niche differentiation) are ecological processes prevailing on a finer scale where coexisting species have small overlaps in their functional niches due to competitive exclusion, leading to divergent traits and increased functional diversity [9]. The interactions of these three filters are complex and can lead to shifts in the community structure, changing the abundance and presence of species [10]. It is suggested that environmental filtering is important under disturbed conditions, while biotic interactions prevail in less-disturbed environments [5,11,12].
Macrophytes are key elements of freshwater ecosystems, playing a central role in biogeochemical processes, and as primary producers, they constitute an important food resource [13,14]. Due to their ecological importance, macrophyte species are formally recognized as one out of four biological quality elements used in the monitoring of surface water ecosystems [15]. Macrophyte communities are strongly influenced by hydrology, reflecting both anthropogenic and natural disturbances, with hydrology having a stronger effect on the trait composition than on the species composition of the community [16,17,18,19].
There is a growing body of literature dealing with the relationships between environmental factors and functional diversity and trait distributions of macrophyte communities in altered waterbodies (e.g., [4,5,6,13,14,15,16,17,18,20,21,22,23]). The methods applied to investigate these relationships include the use of multivariate characterization of functional assemblage structures, functional diversity measures, and/or specific trait–environment correlations. In general, all these studies supported the conclusion first drawn by Baattrup-Pedersen et al. [4] that trait-based rather than species-specific approaches might provide better insight into the biological mechanisms underlying the changes in macrophyte communities induced by habitat disturbances.
When analyzing trait–environment relationships in European lowland streams, Baattrup-Pedersen et al. [4] found that eutrophication affected macrophyte community trait characteristics by filtering species with efficient light utilization, indicating that light is a limiting factor for growth in nutrient-enriched environments. Lukács et al. [5] also found that the mechanisms underlying the changes in stream plant communities are mostly related to light capture and utilization, although their results indicated that the plant traits showed stronger associations with carbon gradient than with nutrient gradients.
It was suggested that the functional trait composition of aquatic plants can distinguish hydromorphological degradation from eutrophication in streams [20]. Mouton et al. [22] demonstrated that native and non-native stream macrophyte assemblages responded differently to habitat disturbances, with riparian shading and hydromorphological conditions being the strongest variables shaping the macrophyte functional structure by selecting the species with suitable traits related to colonization and competition strategies. They found that disturbances such as a lack of riparian shading and eutrophication increase functional diversity. A study carried out in permanent and intermittent streams in Cyprus [14] revealed that hydromorphological factors, primarily flow duration patterns, shape macrophyte communities by filtering species with traits related to population resistance and resilience. Comparing channelized and un-channelized streams, Paz et al. [6] showed that macrophyte communities in channelized streams were dominated by emergent species and had lower functional diversity.
Previous studies conducted in the Danube River section in Serbia showed that both species and functional diversity increased along the anthropogenic pressure gradient (i.e., damming and loss of forest cover in the riparian zone) [24,25]. Since similar pressures operate in the altered waterbodies analyzed here, we hypothesized that a similar functional diversity response of macrophyte communities will be found. We expected a significant influence of the water chemistry, particularly nutrient content, on the functional diversity indices and on the individual traits. A higher nutrient content should favor a higher number of strategies (i.e., traits) to exploit these resources [5,26], leading to higher functional diversity. Similarly, species in nutrient-poor environments are constrained to a smaller range of these strategies [5], which will lead to a decrease in functional diversity.
Therefore, here, we evaluated the functional response of macrophyte communities to the environmental drivers in the waterbodies with altered hydromorphological features, using both functional diversity indices and trait–environment correlations. Our main objectives were: 1. to investigate the effects of water chemistry and river habitat features on macrophyte functional diversity indices; and 2. to identify macrophyte traits that respond to the analyzed environmental factors.

2. Materials and Methods

Original data on the abundance and distribution of macrophytes were collected during the surveys conducted between 2017 and 2019, under the WFD scheme in order to achieve the ecological classification of waterbodies in Serbia. We sampled 72 altered bodies of running water (Figure 1). The macrophytes were surveyed according to EN 14184:2014 Standard [27], using a five-level scale metric for the estimation of their abundance (1—very rare, only single plants, up to 5 specimens; 2—rare, approximately 6 to 10 single plants, loosely scattered over sampling unit, or up to 5 single plant stocks; 3—frequent, cannot be overlooked, but not frequent; 4—abundant, occurring frequently, but not in masses, with incomplete cover, exhibiting large gaps; 5—very abundant, dominant, found more or less everywhere, cover markedly more than 50%) in relation to the volume and length of the sampling unit. The survey of macrophytes was carried out over the whole length of the sampling unit visually and/or by raking, using a small boat. The sampling units were 100 m, 500 m, and 1000 m long, depending on the size and characteristics of the waterbody [27]. In each waterbody, a minimum of three sampling units were surveyed on the left and on the right riverside, and the collected data were averaged for later use. The macrophytes were not recorded in 26 out of a total of 72 surveyed waterbodies. Further analyses included data from the remaining 46 waterbodies.
The environmental data analyzed here were divided into two groups: water chemistry and river habitat features (Table 1). We used time- and space-specific data on water chemistry and water temperature published in yearly reports available on the Serbian Environmental Agency website (www.sepa.gov.rs (accessed on 27 April 2022)) as well as in the European Environmental Agency Central Data Repository—EIONET (https://cdr.eionet.europa.eu/rs/eea (accessed on 13 June 2022)). For the purposes of this study, the annual average values were calculated. Data on the bank slope (1—flat, gentle slope; 2—intermediate; 3—very steep slope) and CORINE Land Cover classes were estimated in the field, according to the guidelines provided by the Copernicus Land Monitoring Service (https://land.copernicus.eu/pan-european/corine-land-cove (accessed on 12 September 2022)). The mean width of the riparian zone and the mean width of the waterbodies (i.e., channel width) were measured using landscape images from Google Earth. Data on the CORINE Land Cover classes were used to extract the number of land cover classes (No_LUt) and average degree of hemeroby (avg.hemeroby) of land cover classes along the banks of the waterbody. To measure hemeroby, we applied the approach used by Walz and Stein [28], where CORINE Land Cover classes were assigned to seven degrees of hemeroby, between degree 1—land cover with almost no human impact (e.g., CORINE class 332—bare rocks), and degree 7, assigned for land cover with excessively strong human impact (e.g., 111—continuous urban fabric, 121—industrial or commercial units, etc.). We treated the degrees of hemeroby as numerical values, and for each waterbody we calculated the average degree of hemeroby.
For 59 recorded vascular macrophyte species, data on 14 traits with 43 trait attributes were extracted from the literature [29,30,31] (Table 2). These encompassed morphological traits including growth forms and traits important for species dispersal, reproduction, and survival. The trait attributes had values of 0 for absence, 1 for occasional, but not general presence, and 2 for general presence of the attribute [20,31]. We also included ecological preference traits in form of Ellenberg’s indicator values on a nine-level scale for temperature, reaction, nitrogen, and light; and a twelve-level scale for water [29,30].
Based on the plant abundance dataset and trait dataset, we computed seven distance-based multi-trait alpha diversity indices: FRic—functional richness, representing the amount of functional space filled by a community; FEve—functional evenness, measuring the regularity of the species abundance distribution along the minimum spanning tree that links the species points in multidimensional functional space; FDiv—functional divergence, relating to how species abundances are distributed within the functional trait space; FDis—functional dispersion, representing the mean distance of individual species to the centroid of all species in the multidimensional trait space, taking into account the species relative abundances; RaoQ—the sum of the dissimilarities between all possible pairs of species, weighted by the product of species proportions; FD—functional diversity, an index based on the Rao quadratic entropy, representing the sum of dissimilarities in functional traits between all possible pairs of species weighted by the product of species proportions; and Fred—functional redundancy, index based on the Rao quadratic entropy, representing the difference between maximum functional diversity—the inverse Simpson taxonomic diversity—and FD [32,33,34,35,36]. Since the trait attribute values were not quantitative and continuous, Principal Coordinate Analysis (PCoA) of the Gower dissimilarity matrix computed on trait attributes matrix was used to obtain the functional trait space [35]. To explore the correlations between functional diversity indices, linear correlation coefficients were calculated and the correlations between paired samples were tested. Analyses were conducted using R package “FD” [37].
To analyze the relations between the functional diversity indices and environmental variables, we applied redundancy analysis (RDA). We chose RDA because: (a) linear relationships between functional diversity indices and environmental variables were indicated in a number of previous studies, e.g., [6,22,23,38,39]; (b) during the data exploration procedure (not shown here), detrended correspondence analysis (DCA) of the functional diversity indices matrix gave gradient lengths <3 standard deviations for the longest axis, indicating that a linear response would adequately fit the data [40]; (c) this method allows the extraction and summarization of variation in the whole set of components of functional diversity, in form of functional diversity indices, explained by the environmental variables. Prior to the analysis, both the functional diversity indices and the environmental variables were standardized. The statistical significance of the final RDA model and of the individual canonical axes was tested using permutation tests. An unbiased amount of variation in the response data (functional diversity indices) explained by environmental variables was measured as an adjusted R2 and was used later in the Variation Partitioning (VarPart). To explore the correlations between the functional diversity indices and environmental variables, linear correlation coefficients were calculated and the correlations between paired samples were tested. VarPart was applied to distinguish between the amount of variation in the response data explained by water chemistry, by river habitat features, and by their joint effect (Table 1). The analyses were carried out using the R package “vegan” [41].
To evaluate the relationships between the species traits and environmental data, mediated by the species abundance data, two complementary methods were applied: RLQ and fourth-corner analysis [21,42,43,44]. RLQ analysis was performed on three data matrices: site by species (L), site by environmental variables (R), and species by traits (Q). RLQ analysis is an ordination method allowing the visualization of the joint structure resulting from the three data tables, based on the coefficients for the environmental variables and species traits. It is followed by single global test [42]. Fourth-corner analysis is a series of statistical tests of individual trait–environment relationships. Since the fourth-corner method involves multiple testing, the overall rate of type I error is increased, and therefore correction for multiple testing should be performed [21,40,43,44]. Here, the false discovery rate (FDR) method with α = 0.05 was applied [41,43,44,45,46,47]. RLQ and fourth-corner analysis were carried out using the “ade4” R package [48,49].

3. Results

We recorded 59 plant species (Supplementary Material Table S1) in 46 out of the 72 surveyed waterbodies. Based on the species traits (Table 2), seven distance-based functional indices were calculated (Table 3).
All linear correlation coefficients between functional diversity indices were statistically significant (Table S2). The highest correlation coefficient was found between Rao quadratic entropy and Rao-based diversity, while the lowest value was found between evenness and redundancy.
The RDA model explained 47.43% of the variation in the response data (Figure 2). According to the permutation tests, both the whole RDA model and the first canonical axes were highly statistically significant (p < 0.001). The first two RDA axes explained 45.42%, and the first RDA axis alone explained 40.16% of the unbiased variation in the response data. Therefore, the major trends were well modeled in the RDA. Furthermore, the first unconstrained eigenvalue (PC1) is relatively small (1.207) compared to the first constrained eigenvalue (3.919), indicating that any dominant residual structure is not displayed in the RDA model. Variables: the elevation (r = 0.822), average hemeroby (r = −0.665), and conductivity (r = −0.531) were strongly correlated with the first RDA axis, whereas the strongest correlation with the second RDA axis was detected for the width of the riparian zone (r = 0.551).
Conductivity and average degree of hemeroby had significant positive correlations and elevation a negative correlation with all functional diversity indices (Figure 3A). a negative correlation was found between bank slope and functional evenness and divergence. These two indices, as well as functional diversity, had a positive correlation with water temperature. The number of CORINE land cover classes had a positive correlation with functional richness, diversity, and redundancy. The coefficients of correlation between the other environmental variables and functional diversity indices were not statistically significant.
The fraction of the variation in the functional diversity indices explained only by river habitat features was the highest at 22.7% (Figure 3B). The joint effect of both subsets of environmental variables on the variability in functional diversity indices was 20.3%, while water chemistry alone had the smallest effect on the response variables, explaining only 4.5% of their variability.
The RLQ analysis (Figure S1) yielded a combined p-value < 0.001, which means that the links between the matrices sites by species (L) and species by traits (Q), and between site by environmental variables (R) and site by species (L) were significant. The fourth-corner analysis revealed eleven positive and seven negative associations (Figure 4). Positive associations were found between the concentration of dissolved oxygen and ecological indicator value for light; water conductivity and extra-large leaf area; nitrite concentration and “surface free-floating” growth form, and low body flexibility; nitrate concentration and low body flexibility, and waxy leaf texture; and altitude and “anchored with submerged leaves” growth form, soft leaf texture, and non-waxy leaf texture. Negative associations were found between the concentration of dissolved oxygen and non-waxy leaf texture; nitrite concentration and “anchored with submerged leaves” growth form, and soft leaf texture; nitrate concentration with ecological indicator value for water, multiple apical growth, and non-waxy leaf texture; and average hemeroby of the land use types on the banks and morphology index between 40 and 100.

4. Discussion

We investigated the effects of environmental factors—water chemistry and river habitat features—on the functional diversity and trait structure of vascular macrophyte assemblages in canals and heavily modified rivers in Serbia.

4.1. Correlations between Macrophyte Functional Diversity Indices

We found significant positive correlations between all functional diversity indices, since they measure different aspects of the same facet of diversity. Notably, a strong positive correlation was observed between RaoQ and FDis. That was expected, since both indices, although different, estimate the dispersion of species in trait space, weighted by their relative abundances [34]. Similarly, a strong positive correlation was found between RaoQ and Rao-based FD. We also found a strong positive correlation between FDiv and FEve, indices that measure two components of functional diversity—divergence and evenness. A high FDiv indicates a high degree of niche differentiation and low resource competition, while a high FEve indicates a high degree to which the biomass of a community is distributed in niche space to allow the effective utilization of the entire range of available resources [50]. Therefore, in the altered waterbodies analyzed here, as the degree of niche differentiation increases, the abundance distribution degree of the macrophyte communities in niche space tends to be even, allowing the effective utilization of resources, with low resource competition. This tends to increase the productivity and reliability of the ecosystem, decreasing the opportunity for invaders [50].

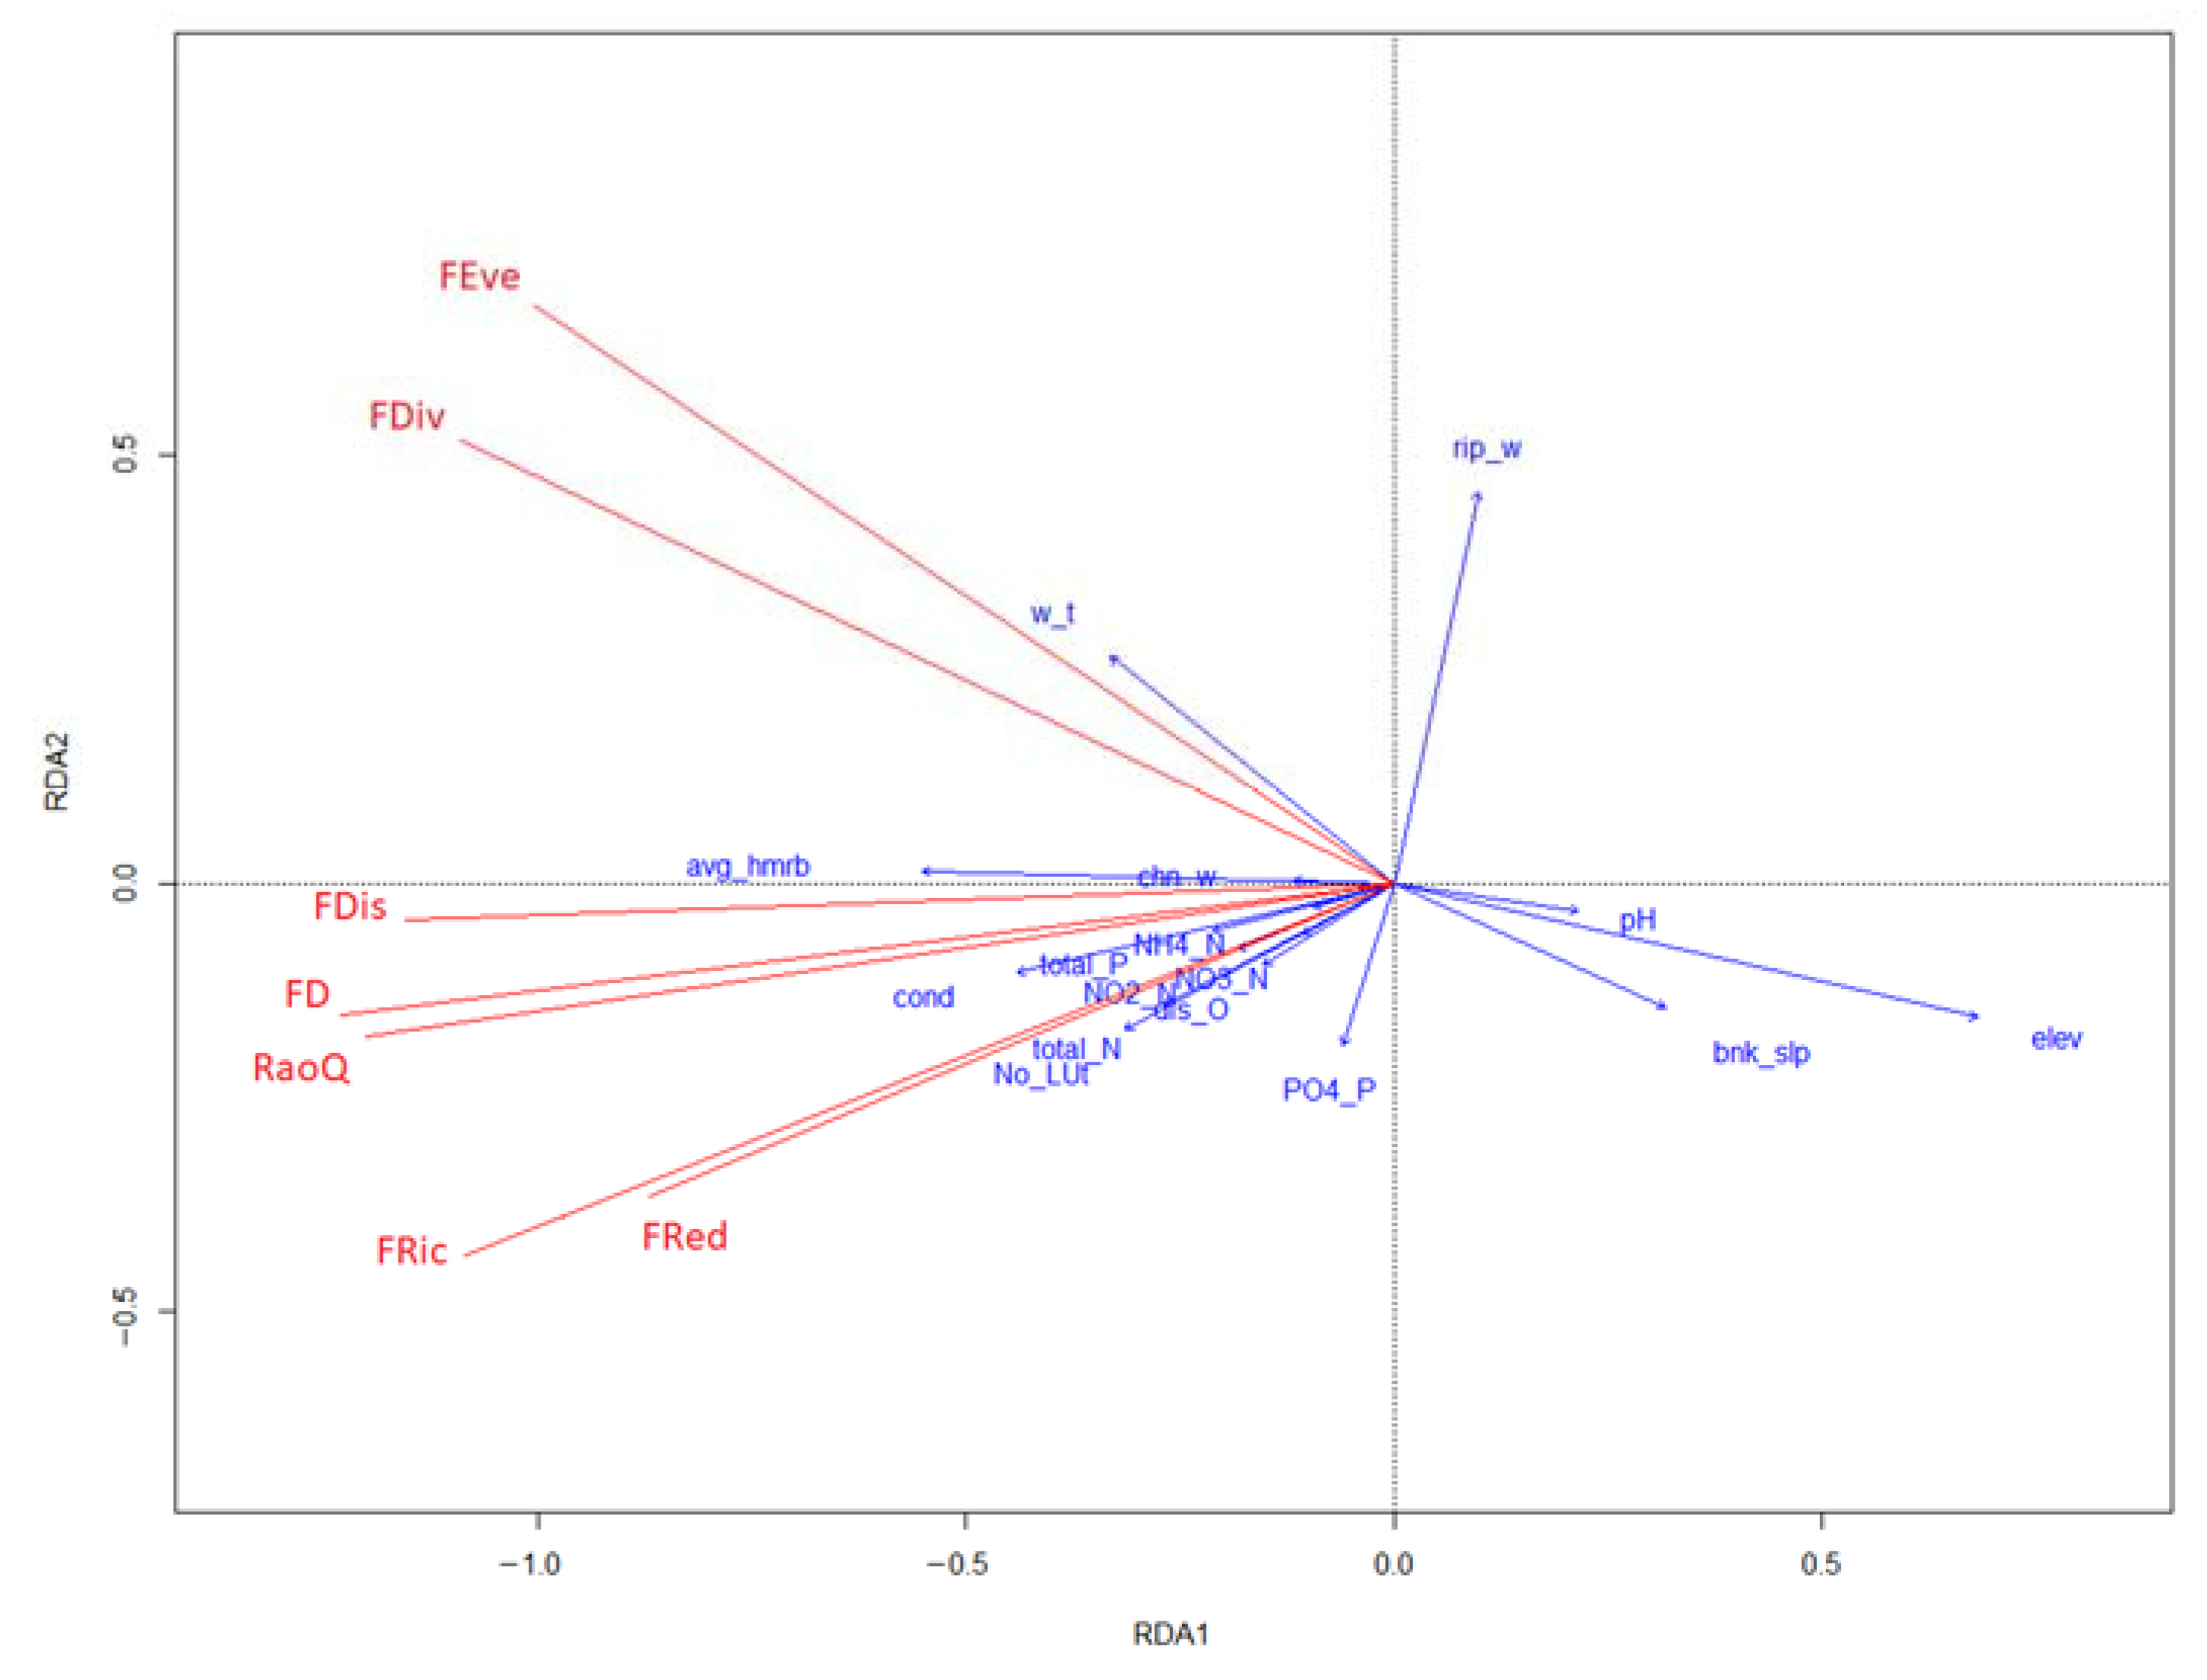
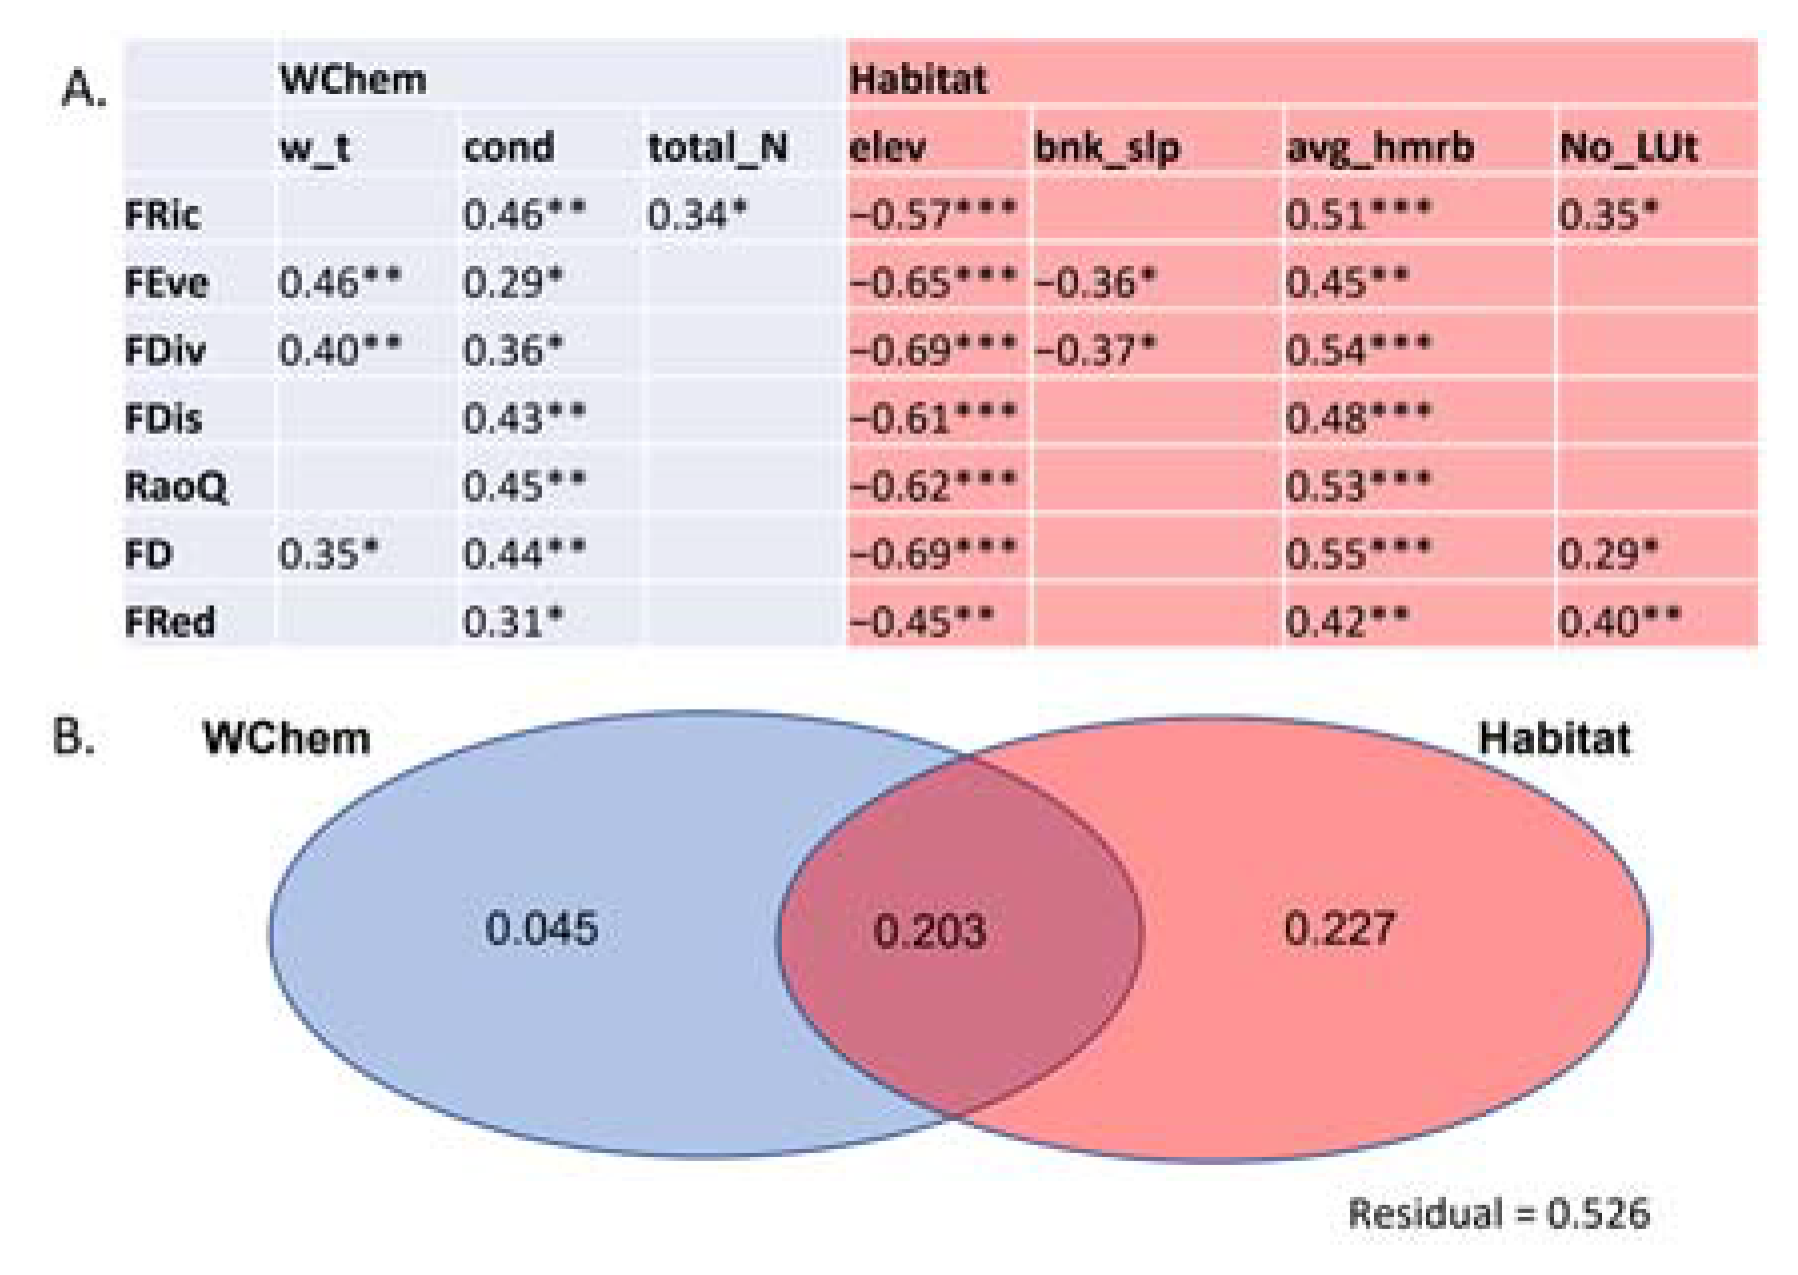
4.2. Effects of Water Chemistry and River Habitat Features on Macrophyte Functional Diversity Indices

The environmental constraints analyzed here were able to explain nearly half of the variability in functional diversity indices. River habitat features, compared to water chemistry, were responsible for the largest part of that variability. Our results showed similar responses of all functional diversity indices to the three main gradients: positive correlations with the essentially related factors—average degree of hemeroby and conductivity; and negative correlations with the elevational gradient, indicating an increase in all components of functional diversity towards the lowland waterbodies that are under stronger anthropogenic influence.
Notably strong negative correlations between elevation and all the analyzed components of functional diversity suggested that species with similar traits were filtered along the elevational gradient. Elevational gradient is a gradient of natural variability [22] and was found to be an important predictor of macrophyte vegetation in lakes and rivers [15,22,51,52,53,54,55]. It reflects changes in slope, type of substrate, water temperature, nutrient load, and the intensity of agricultural pressures typical for lowland reaches. Along the elevational gradient, all factors contributing to the increase in the diversity of vascular macrophyte vegetation are decreasing. Several studies have shown an opposite pattern, suggesting that the observed response of macrophyte communities to altitude might depend on the analyzed range of the elevational gradient [52,53,56,57].
In the studied waterbodies, the water temperature was related to the elevational gradient, with higher values at lower altitudes. Our results showed that a higher water temperature leads to an increase in functional evenness, functional divergence, and Rao-based FD, which measures both components [50]. Although all components of functional diversity shift along the elevational gradient, changes in temperature along this gradient particularly influence niche differentiation and the abundance distribution degree of macrophyte communities in niche space (i.e., functional evenness). At lower altitudes, the abundance distribution in niche space tends to be even, allowing the effective utilization of resources with low resource competition [50].
Functional evenness and divergence were also related to the littoral slope degree. They were found to be lower in waterbodies with a steep littoral slope, indicating the filtering of species with similar traits allowing them to occupy deeper water, with a low degree of niche differentiation, high resource competition, uneven abundance distribution in niche space, and the underutilization of resources [50]. In this case, the average degree of hemeroby was significantly positively correlated to all aspects of functional diversity. Hemeroby represents an integrative measure of the anthropogenic impact on ecosystems [58,59]. Different human activities have shaped the area surrounding the studied waterbodies, decreasing their naturalness [28] and directly and/or indirectly influencing other environmental factors. Similarly, a positive relationship between anthropogenic disturbances and diversity, both taxonomical and functional, was found for macrophytes in the Danube River [24,25,60] and in Slovakian ponds [54]. The intensity of human impact on the waterbodies studied here, reflected mainly in the deforestation of regions in the riparian zone, the reduction in flow velocity, the increase in transparency, sediment accumulation, as well as the subsequent higher nutrient supply, can promote an increased abundance of functionally distinct species, providing niche diversification for the establishment of diverse assemblages of macrophytes [23]. It was suggested that the functional response of the communities depends on the intensity of stress (both natural and anthropogenic), and that ecosystems that are under intensified stress will exhibit functionally homogeneous communities [61]. Our results indicate that the anthropogenic stressors are not intense enough to lead to the functional homogenization of macrophyte communities, while the intensity of natural stressors operating at higher altitudes (shading, bedrock in littoral areas, oligotrophic environment, lower temperatures, etc.) leads to trait convergence and functionally more homogeneous communities.
An additional possible explanation for the observed positive correlation between functional diversity and the intensity of human impact (i.e., hemeroby) might be (often anthropogenically induced) habitat heterogeneity, expressed here as the number of land cover classes along the banks of the waterbodies. The number of land cover classes was found to be significantly positively correlated to functional richness, the Rao-based diversity index, and functional redundancy. Larger number of land cover classes on banks provide habitat heterogeneity offering a more heterogeneous range of niches (open, shaded, different littoral slope, nutrient supply, etc.) and favoring plants with different resource utilization strategies, increasing productivity and stability, since the number of species with the same traits (i.e., functional redundancy) is also increasing [5,50].
Like the average hemeroby, water conductivity was also significantly and positively correlated to all functional diversity indices. Conductivity has frequently been reported as a key driver of richness and diversity of macrophyte communities [52,53,55,61,62,63,64,65], where high conductivity was indicative of waters disturbed by anthropogenic processes [52,53,55,63].
We found that the amount of niche space filled by species in the community (i.e., functional richness) increased in waterbodies with higher nitrogen concentrations. Previous studies reported nitrogen having a positive effect on species richness and diversity [55]. However, it was also documented that some species, particularly submerged macrophytes, may be lost when nitrogen concentration exceeds a certain threshold, and when the phosphorus concentration is high enough [66,67]. At high or very low nutrient levels, species and functional richness is expected to be lower, since low nutrient concentrations filter species with similar traits adapted to it, while competitive interactions usually increase when nutrient levels increase, and the highest diversity is expected at intermediate nutrient levels [68]. Therefore, we can assume that the nitrogen concentrations in the waterbodies with high functional richness are in the intermediate range.

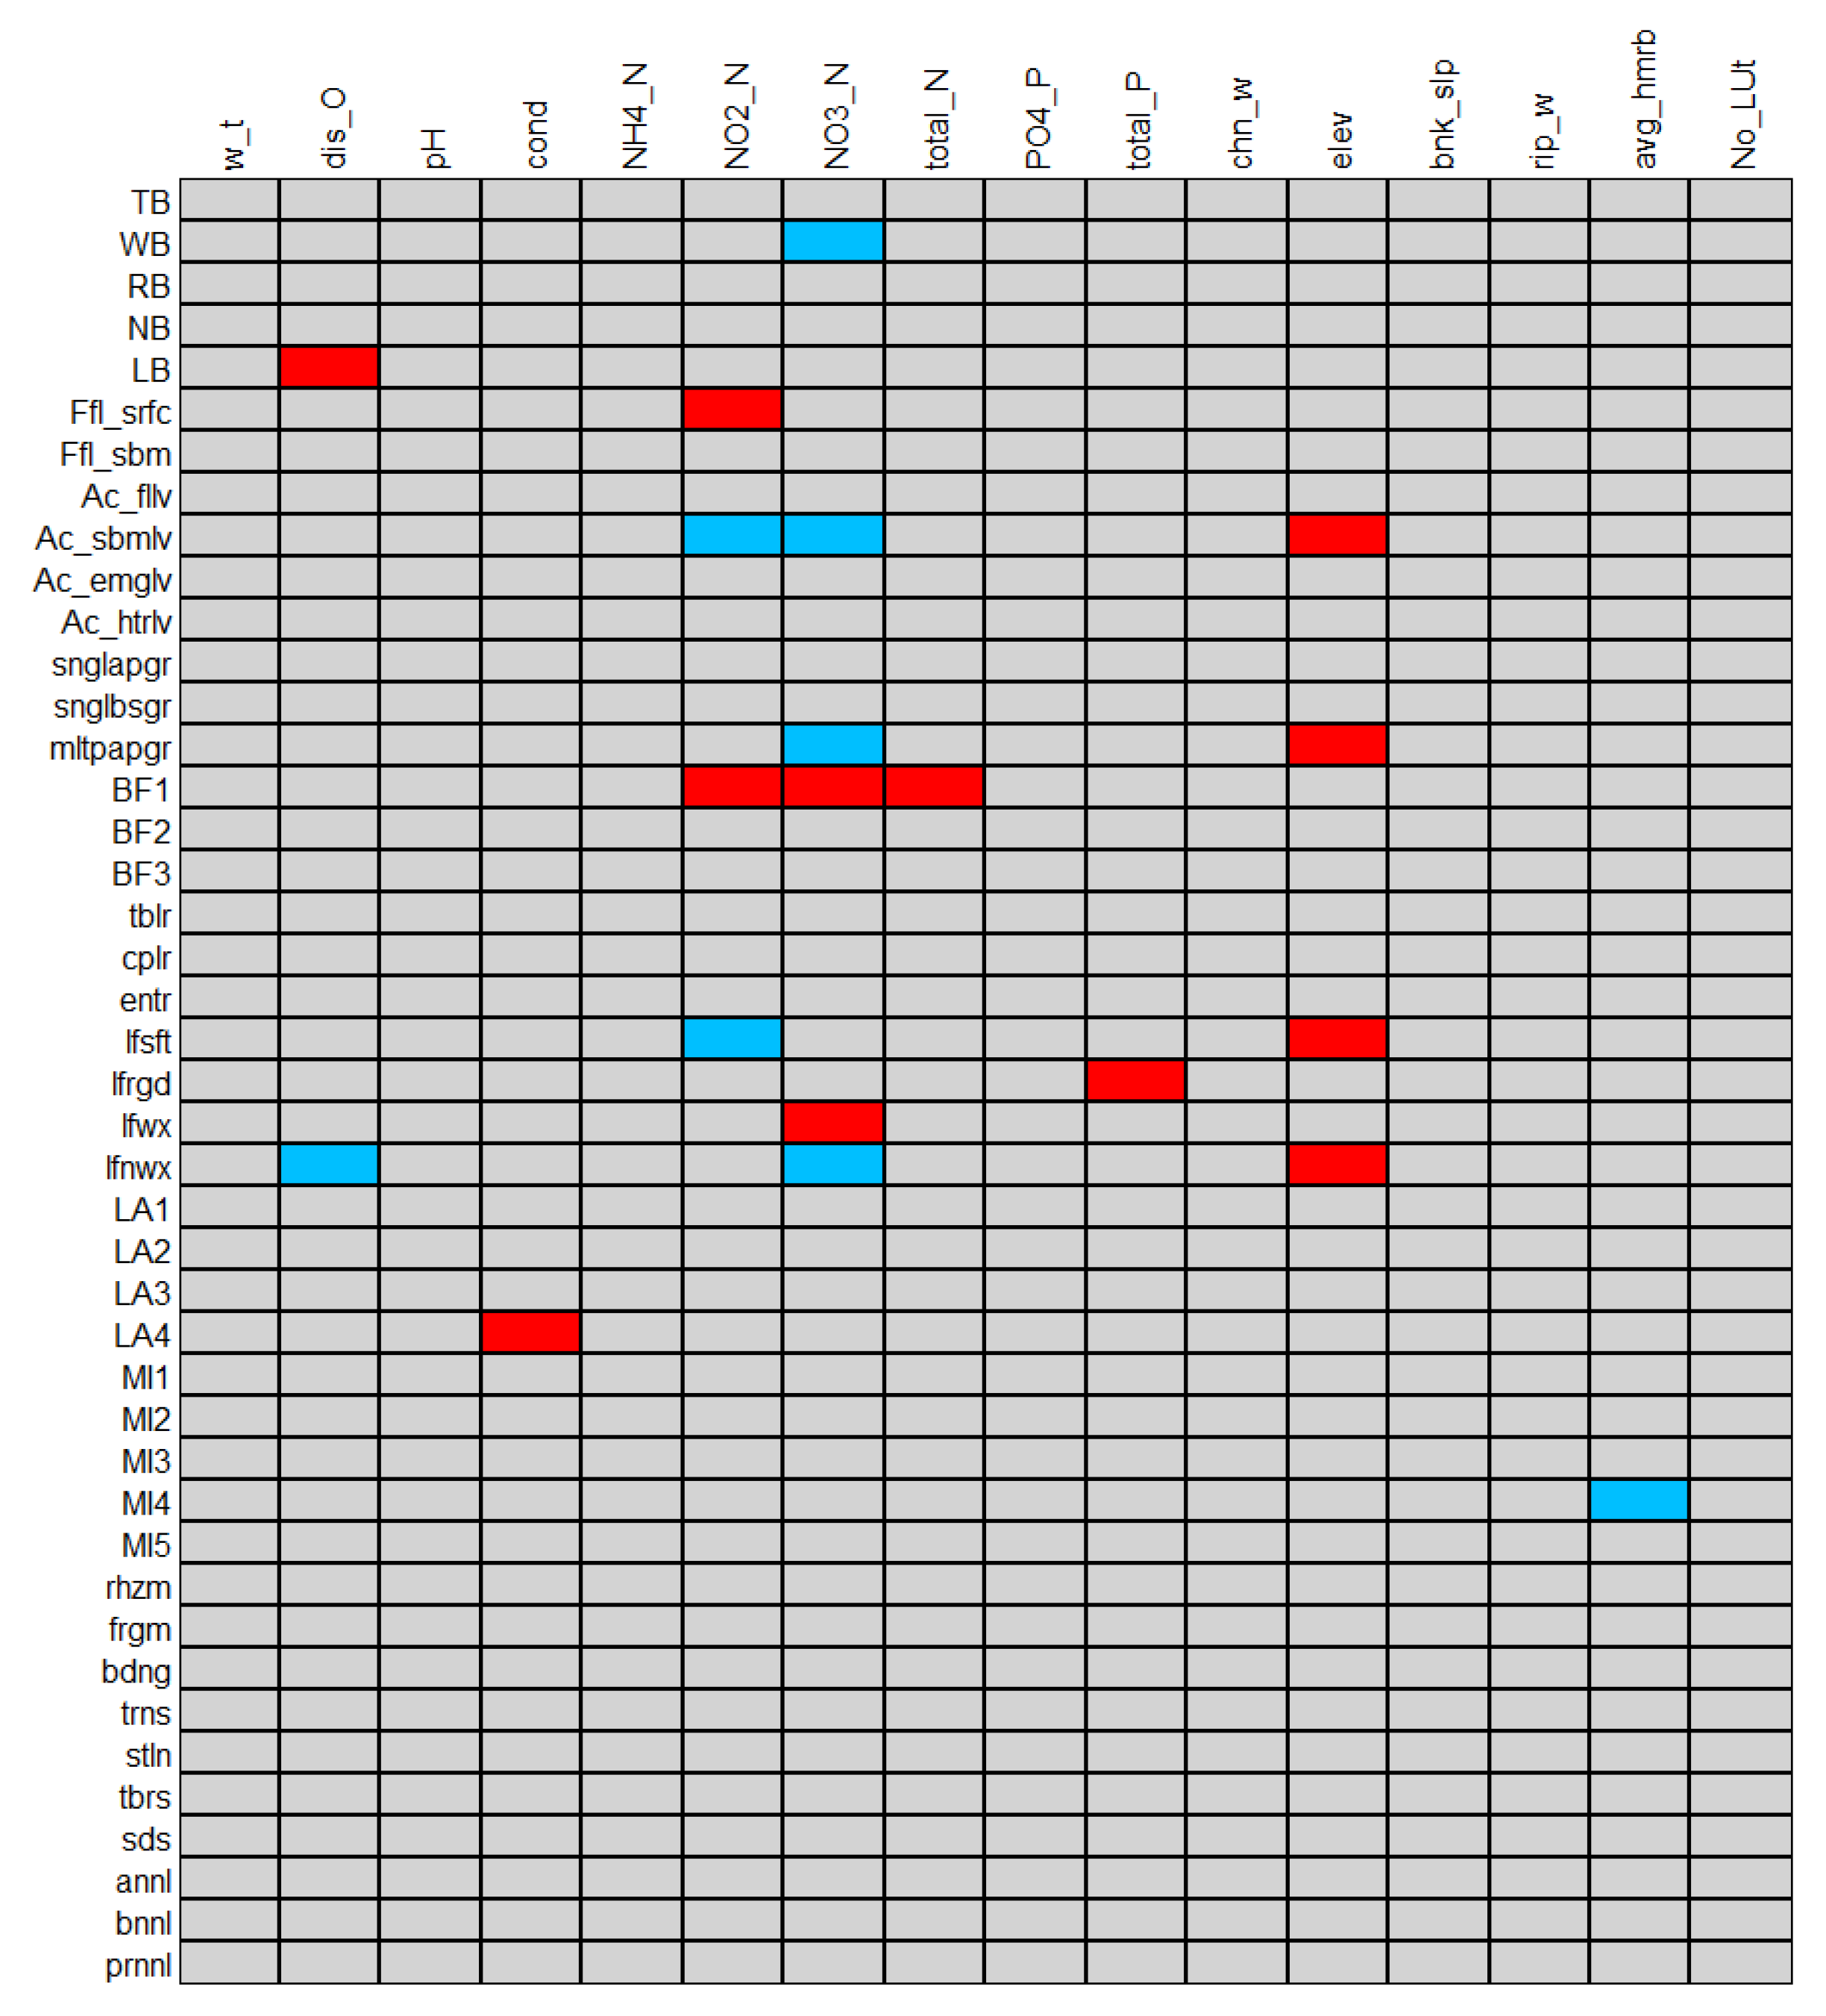
4.3. Effect of Water Chemistry and River Habitat Features on Macrophyte Functional Trait Structure

Our results confirmed the conclusions of previous studies [4,6] that floating and emergent plants represent strategies to increase the efficiency of light interception under high nutrient concentrations, while submerged plants dominate in nutrient-poorer waterbodies at higher altitudes. A similar shift from more productive and eutrophic waterbodies dominated by emergent and floating plants to nutrient-poorer waterbodies dominated by submerged macrophytes was found in a cascade series of reservoirs at the medium and low Tietê River in Brazil [69]. This shift between two dominating growth forms is the consequence of competition for resources, primarily nitrogen and light. It was reported that floating plants have primacy for light, while submerged plants can grow at lower nutrient concentrations in water and can reduce nutrient concentrations in water to lower levels [70,71].

5. Conclusions

The simultaneous use of functional diversity indices and trait–environment correlations applied here allow us to draw several conclusions regarding the community changes along the environmental gradients, and the traits that are related to those changes. The shift from low to high functional diversity along the gradient of anthropogenic stressors, and the opposite trend of functional diversity along the elevational gradient, might indicate the prevailing processes that structure macrophyte communities. Our results confirm the previous findings that biotic filters, competition, and niche differentiation play a role in aquatic ecosystems under high anthropogenically induced productivity [72,73]. In contrast, the functional diversity indices were found to decrease with elevation, indicating the shift to predominating abiotic environmental filtering and more stressful conditions for vascular macrophytes along the elevational gradient. Trait–environment analyses indicated the change in community structure, from emergent and floating macrophytes dominant in more productive and eutrophic lowland waterbodies to submerged macrophyte-dominated waterbodies at higher altitudes with lower nutrient load and conductivity.
Our results indicate that both functional diversity indices and functional traits might prove to be useful diagnostic tools to guide the choices of relevant management measures in altered waterbodies in Serbia. We found that the current intensity of anthropogenic stressors is low enough to prevent functional homogenization and the decline of macrophyte communities. However, the high productivity and dominance of emergent and floating plants in lowland waterbodies might indicate the eutrophication-related process [4] that will, in the future, impair the ecosystem services that these waterbodies were designed to provide. This is particularly important for waterbodies designed to store water for the water supply, where in many cases, intensive land use close to the shoreline was observed (pastures, farming, summer cottages, villages, agriculture and plantations, beaches, camping areas). Therefore, in these waterbodies, management efforts should be directed toward the reevaluation of land use decisions and the reduction of nutrient inputs. Although altered waterbodies are designed to provide different services for human wellbeing, they might be harboring biota of conservational value [74]. Future investigations of altered waterbodies must include more detailed biodiversity studies and the selection of sites of conservational importance, as well as the application of adequate measures for their protection. Moreover, it is important to focus further investigation on the role of functional diversity and the structure of macrophyte communities in the indication of possible tradeoffs and/or facilitation between the ecosystem services that those altered waterbodies provide in order to direct their adequate management.

Supplementary Materials

The following supporting information can be downloaded at: https://www.mdpi.com/article/10.3390/d15020231/s1, Table S1: Species list; Table S2: Linear correlation coefficients between functional diversity indices; Figure S1: Results of the RLQ analysis.

Author Contributions

Conceptualization and methodology, D.V.; data collection and preparation, D.V., M.I., M.Ć. and R.I., analyses and visualization, D.V., M.I. and M.Ć.; resources and supervision, R.I.; writing, reviewing, and editing, D.V., M.I., M.Ć. and R.I. All authors have read and agreed to the published version of the manuscript.

Funding

This research was funded by the Provincial Secretariat for Higher Education and Scientific Research, through the grant number 142-451-2213/2022-01/1, and the Ministry for Education, Science and Technological Development of the Republic of Serbia, through the Scientific Research Program, in 2022, grant number 451-03-68/2022-14/200125.

Institutional Review Board Statement

Not applicable.

Data Availability Statement

Data may be provided upon reasonable request.

Acknowledgments

The authors thank Vanja Vukov for the help during the field surveys. We would like to thank the reviewers for taking the necessary time and effort to review the manuscript. We sincerely appreciate all their valuable comments and suggestions, which helped us in improving the quality of the manuscript.

Conflicts of Interest

The authors declare no conflict of interest.

References

  1. McGill, B.J.; Enquist, B.; Weiher, E.; Westoby, M. Rebuilding community ecology from functional traits. Trends Ecol. Evol. 2006, 21, 178–185. [Google Scholar] [CrossRef] [PubMed]
  2. Violle, C.; Navas, M.-L.; Vile, D.; Kazakou, E.; Fortunel, C.; Hummel, I.; Garnier, E. Let the concept of trait be functional! Oikos 2007, 116, 882–892. [Google Scholar] [CrossRef]
  3. Villéger, S.; Miranda, J.R.; Hernández, D.F.; Mouillot, D. Contrasting changes in taxonomic vs. functional diversity of tropical fish communities after habitat degradation. Ecol. Appl. 2010, 20, 1512–1522. [Google Scholar] [CrossRef] [PubMed]
  4. Baattrup-Pedersen, A.; Göthe, E.; Larsen, S.E.; O’Hare, M.; Birk, S.; Riis, T.; Friberg, N. Plant trait characteristics vary with size and eutrophication in European lowland streams. J. Appl. Ecol. 2015, 52, 1617–1628. [Google Scholar] [CrossRef]
  5. Lukács, B.A.; E-Vojtkó, A.; Erős, T.; Molnár, V.A.; Szabó, S.; Götzenberger, L. Carbon forms, nutrients and water velocity filter hydrophyte and riverbank species differently: A trait-based study. J. Veg. Sci. 2019, 30, 471–484. [Google Scholar] [CrossRef]
  6. Paz, L.; Altieri, P.; Ferreira, A.; Ocon, C.; Capítulo, A.R.; Cortelezzi, A. Macrophyte functional traits in channelized streams. Aquat. Bot. 2021, 175, 103434. [Google Scholar] [CrossRef]
  7. MacArthur, R.; Levins, R. The Limiting Similarity, Convergence, and Divergence of Coexisting Species. Am. Nat. 1967, 101, 377–385. [Google Scholar] [CrossRef]
  8. Kraft, N.J.B.; Valencia, R.; Ackerly, D.D. Functional Traits and Niche-Based Tree Community Assembly in an Amazonian Forest. Science 2008, 322, 580–582. [Google Scholar] [CrossRef] [PubMed]
  9. Mason, N.W.H.; Lanoiselée, C.; Mouillot, D.; Irz, P.; Argillier, C. Functional characters combined with null models reveal inconsistency in mechanisms of species turnover in lacustrine fish communities. Oecologia 2007, 153, 441–452. [Google Scholar] [CrossRef]
  10. Cadotte, M.W.; Tucker, C.M. Should Environmental Filtering be Abandoned? Trends Ecol. Evol. 2017, 32, 429–437. [Google Scholar] [CrossRef]
  11. Weiher, E.; Keddy, P.A. Assembly Rules, Null Models, and Trait Dispersion: New Questions from Old Patterns. Oikos 1995, 74, 159–164. [Google Scholar] [CrossRef]
  12. Swenson, N.G.; Enquist, B.J. Ecological and evolutionary determinants of a key plant functional trait: Wood density and its community-wide variation across latitude and elevation. Am. J. Bot. 2007, 94, 451–459. [Google Scholar] [CrossRef]
  13. Bornette, G.; Puijalon, S. Macrophytes: Ecology of aquatic plants. In Encyclopedia of Life Sciences; John Wiley & Sons, Ltd.: Chichester, UK, 2009. [Google Scholar] [CrossRef]
  14. Manolaki, P.; Guo, K.; Vieira, C.; Papastergiadou, E.; Riis, T. Hydromorphology as a controlling factor of macrophytes assemblage structure and functional traits in the semi-arid European Mediterranean streams. Sci. Total. Environ. 2020, 703, 134658. [Google Scholar] [CrossRef]
  15. Papastergiadou, E.; Stefanidis, K.; Dörflinger, G.; Giannouris, E.; Kostara, K.; Manolaki, P. Exploring biodiversity in riparian corridors of a Mediterranean island: Plant communities and environmental parameters in Cyprus rivers. Plant Biosyst. Int. J. Deal. All Asp. Plant Biol. 2014, 150, 91–103. [Google Scholar] [CrossRef]
  16. Göthe, E.; Baattrup-Pedersen, A.; Wiberg-Larsen, P.; Graeber, D.; Kristensen, E.A.; Friberg, N. Environmental and spatial controls of taxonomic versus trait composition of stream biota. Freshw. Biol. 2016, 62, 397–413. [Google Scholar] [CrossRef]
  17. Baattrup-Pedersen, A.; Garssen, A.; Göthe, E.; Hoffmann, C.C.; Oddershede, A.; Riis, T.; van Bodegom, P.; Larsen, S.E.; Soons, M. Structural and functional responses of plant communities to climate change-mediated alterations in the hydrology of riparian areas in temperate Europe. Ecol. Evol. 2018, 8, 4120–4135. [Google Scholar] [CrossRef] [PubMed]
  18. Bejarano, M.D.; Jansson, R.; Nilsson, C. The effects of hydropeaking on riverine plants: A review. Biol. Rev. 2018, 93, 658–673. [Google Scholar] [CrossRef] [PubMed]
  19. Directive 2000/60/EC of October 23, 2000. Of the European Parliament and of the council establishing a framework for community action in the field of water policy. Off. J. Eur. Communities 2000, L327, 1–72. [Google Scholar]
  20. Baattrup-Pedersen, A.; Göthe, E.; Riis, T.; O’Hare, M.T. Functional trait composition of aquatic plants can serve to disentangle multiple interacting stressors in lowland streams. Sci. Total. Environ. 2016, 543, 230–238. [Google Scholar] [CrossRef]
  21. Stefanidis, K.; Oikonomou, A.; Papastergiadou, E. Responses of different facets of aquatic plant diversity along environmental gradients in Mediterranean streams: Results from rivers of Greece. J. Environ. Manag. 2021, 296, 113307. [Google Scholar] [CrossRef] [PubMed]
  22. Mouton, T.L.; Matheson, F.E.; Stephenson, F.; Champion, P.D.; Wadhwa, S.; Hamer, M.P.; Catlin, A.; Riis, T. Environmental filtering of native and non-native stream macrophyte assemblages by habitat disturbances in an agricultural landscape. Sci. Total. Environ. 2018, 659, 1370–1381. [Google Scholar] [CrossRef]
  23. Vukov, D.; Ilić, M.; Ćuk, M.; Radulović, S.; Igić, R.; Janauer, G.A. Combined effects of physical environmental conditions and anthropogenic alterations are associated with macrophyte habitat fragmentation in rivers—Study of the Danube in Serbia. Sci. Total. Environ. 2018, 634, 780–790. [Google Scholar] [CrossRef]
  24. Dray, S.; Choler, P.; Dolédec, S.; Peres-Neto, P.R.; Thuiller, W.; Pavoine, S.; ter Braak, C.J.F. Combining the fourth-corner and the RLQ methods for assessing trait responses to environmental variation. Ecology 2014, 95, 14–21. [Google Scholar] [CrossRef]
  25. Vukov, D.; Ilić, M.; Ćuk, M.; Igić, R. The Effect of Hydro-Morphology and Habitat Alterations on the Functional Diversity and Composition of Macrophyte Communities in the Large River. Front. Environ. Sci. 2022, 10, 863508. [Google Scholar] [CrossRef]
  26. Reich, P.B.; Wright, I.J.; Cavender-Bares, J.; Craine, J.M.; Oleksyn, J.; Westoby, M.; Walters, M.B. The Evolution of Plant Functional Variation: Traits, Spectra, and Strategies. Int. J. Plant Sci. 2003, 164, S143–S164. [Google Scholar] [CrossRef]
  27. European Standard EN 14184:2014; Water Quality—Guidance Standard for the Surveying of Macrophytes in Running Waters. Comité Européen de Normalisation: Bruxelles, Belgium, 2014.
  28. Walz, U.; Stein, C. Indicators of hemeroby for the monitoring of landscapes in Germany. J. Nat. Conserv. 2014, 22, 279–289. [Google Scholar] [CrossRef]
  29. Ellenberg, H. Vegetation Ecology of Central Europe, 4th ed.; Cambridge University Press: Cambridge, UK, 1988. [Google Scholar]
  30. Borhidi, A. Social Behaviour Types of the Hungarian flora, its Naturalness and Relative Ecological Indicator Values, 1st ed.; Janus Pannonius Tudományegyetem Kiadványa: Pécs, Hungary, 1993. [Google Scholar]
  31. Willby, N.J.; Abernethy, V.J.; Demars, B.O.L. Attribute-based classification of European hydrophytes and its relationship to habitat utilization. Freshw. Biol. 2000, 43, 43–74. [Google Scholar] [CrossRef] [PubMed]
  32. Botta-Dukát, Z. Rao’s Quadratic Entropy as a Measure of Functional Diversity Based on Multiple Traits. J. Veg. Sci. 2005, 16, 533–540. [Google Scholar] [CrossRef]
  33. Villéger, S.; Mason, N.W.H.; Mouillot, D. New multidimensional functional diversity indices for a multifaceted framework in functional ecology. Ecology 2008, 89, 2290–2301. [Google Scholar] [CrossRef]
  34. Laliberté, E.; Legendre, P. A distance-based framework for measuring functional diversity from multiple traits. Ecology 2010, 91, 299–305. [Google Scholar] [CrossRef]
  35. Borcard, D.; Gillet, F.; Legendre, P. Numerical Ecology with R, 2nd ed.; Springer: New York, NY, USA, 2018; pp. 369–412. [Google Scholar]
  36. De Bello, F.; Lavergne, S.; Meynard, C.N.; Lepš, J.; Thuiller, W. The partitioning of diversity: Showing Theseus a way out of the labyrinth. J. Veg. Sci. 2010, 21, 992–1000. [Google Scholar] [CrossRef]
  37. Laliberté, E.; Legendre, P.; Shipley, B. FD: Measuring Functional Diversity from Multiple Traits, and Other Tools for Functional Ecology. 2022, R package version 1.0-12.1. Available online: https://CRAN.R-project.org/package=FD (accessed on 5 October 2022).
  38. Ricotta, C.; De Bello, F.; Moretti, M.; Caccianiga, M.S.; Cerabolini, B.E.L.; Pavoine, S. Measuring the functional redundancy of biological communities: A quantitative guide. Methods Ecol. Evol. 2016, 7, 1386–1395. [Google Scholar] [CrossRef]
  39. Heino, J.; Girón, J.G.; Hämäläinen, H.; Hellsten, S.; Ilmonen, J.; Karjalainen, J.; Mäkinen, T.; Nyholm, K.; Ropponen, J.; Takolander, A.; et al. Assessing the conservation priority of freshwater lake sites based on taxonomic, functional and environmental uniqueness. Divers. Distrib. 2022, 28, 1966–1978. [Google Scholar] [CrossRef]
  40. ter Braak, C.J.F. Canonical correspondence analysis: A new eigenvector technique for multivariate direct gradient analysis. Ecology 1986, 64, 454–462. [Google Scholar] [CrossRef]
  41. Oksanen, J.; Simpson, G.; Blanchet, F.; Kindt, R.; Legendre, P.; Minchin, P.; O’Hara, R.; Solymos, P.; Stevens, M.; Szoecs, E.; et al. Vegan: Community Ecology Package. 2022, R Package Version 2.6-5. Available online: https://github.com/vegandevs/vegan (accessed on 10 October 2022).
  42. Dolédec, S.; Chessel, D.; ter Braak, C.J.F.; Champely, S. Matching species traits to environmental variables: A new three-table ordination method. Environ. Ecol. Stat. 1996, 3, 143–166. [Google Scholar] [CrossRef]
  43. Legendre, P.; Galzin, R.; Harmelin-Vivien, M.L. Relating Behavior to Habitat: Solutions to the Fourth-corner Problem. Ecology 1997, 78, 547–562. [Google Scholar] [CrossRef]
  44. Dray, S.; Legendre, P. Testing the species traits–environment relationships: The fourth-corner problem revisited. Ecology 2008, 89, 3400–3412. [Google Scholar] [CrossRef] [PubMed]
  45. Legendre, P.; Legendre, L. Numerical Ecology, 3rd ed.; Elsevier: Amsterdam, The Netherlands, 2012; pp. 613–622. [Google Scholar]
  46. ter Braak, C.J.F.; Cormont, A.; Dray, S. Improved testing of species traits–environment relationships in the fourth-corner problem. Ecology 2012, 93, 1525–1526. [Google Scholar] [CrossRef]
  47. Benjamini, Y.; Hochberg, Y. Controlling the False Discovery Rate: A Practical and Powerful Approach to Multiple Testing. J. R. Stat. Soc. Ser. B 1995, 57, 289–300. [Google Scholar] [CrossRef]
  48. Pebesma, E.J.; Dufour, A.; Thioulouse, J. The ade4 Package—I: One-Table Methods. R News 2004, 4, 5–10. Available online: https://cran.r-project.org/doc/Rnews/ (accessed on 14 October 2022).
  49. Pebesma, E.J.; Dufour, A.; Chessel, D. The ade4 Package—II: Two-Table and K-Table Methods. R News 2007, 7, 47–52. Available online: https://cran.r-project.org/doc/Rnews/ (accessed on 14 October 2022).
  50. Mason, N.W.H.; Mouillot, D.; Lee, W.G.; Wilson, J.B. Functional richness, functional evenness and functional divergence: The primary components of functional diversity. Oikos 2005, 111, 112–118. [Google Scholar] [CrossRef]
  51. Lacoul, P.; Freedman, B. Relationships between aquatic plants and environmental factors along a steep Himalayan altitudinal gradient. Aquat. Bot. 2006, 84, 3–16. [Google Scholar] [CrossRef]
  52. Chappuis, E.; Gacia, E.; Ballesteros, E. Environmental factors explaining the distribution and diversity of vascular aquatic macrophytes in a highly heterogeneous Mediterranean region. Aquat. Bot. 2014, 113, 72–82. [Google Scholar] [CrossRef]
  53. Fernández-Aláez, C.; Fernández-Aláez, M.; García-Criado, F.; García-Girón, J. Environmental drivers of aquatic macrophyte assemblages in ponds along an altitudinal gradient. Hydrobiologia 2016, 812, 79–98. [Google Scholar] [CrossRef]
  54. Kochjarová, J.; Novikmec, M.; Oťaheľová, H.; Hamerlík, L.; Svitok, M.; Hrivnák, M.; Senko, D.; Bubíková, K.; Matúšová, Z.; Paľove-Balang, P.; et al. Vegetation-Environmental Variable Relationships in Ponds of Various Origins along an Altitudinal Gradient. Pol. J. Environ. Stud. 2017, 26, 1575–1583. [Google Scholar] [CrossRef]
  55. Stefanidis, K.; Sarika, M.; Papastegiadou, E. Exploring environmental predictors of aquatic macrophytes in water-dependent Natura 2000 sites of high conservation value: Results from a long-term study of macrophytes in Greek lakes. Aquat. Conserv. Mar. Freshw. Ecosyst. 2018, 29, 1133–1148. [Google Scholar] [CrossRef]
  56. Alahuhta, J.; Kosten, S.; Akasaka, M.; Auderset, D.; Azzella, M.M.; Bolpagni, R.; Bove, C.P.; Chambers, P.A.; Chappuis, E.; Clayton, J.; et al. Global variation in the beta diversity of lake macrophytes is driven by environmental heterogeneity rather than latitude. J. Biogeogr. 2017, 44, 1758–1769. [Google Scholar] [CrossRef]
  57. Oikonomou, A.; Stefanidis, K. α- and β-Diversity Patterns of Macrophytes and Freshwater Fishes are Driven by Different Factors and Processes in Lakes of the Unexplored Southern Balkan Biodiversity Hotspot. Water 2020, 12, 1984. [Google Scholar] [CrossRef]
  58. Kowarik, I. Zum menschlichen Einfluss auf Flora und Vegetation: Theoretische Konzepte und ein Quantifizierungsansatz am Beispiel von Berlin (West). Landsch. Umweltforsch. 1988, 56, 1–280. [Google Scholar]
  59. Sukopp, H. Dynamik und Konstanz in der Flora der Bundesrepublik Deutschland. Schr. Veg. 1976, 10, 9–26. [Google Scholar]
  60. Janauer, G.; Exler, N.; Anačkov, G.; Barta, V.; Berczik, Á.; Boža, P.; Dinka, M.; Georgiev, V.; Germ, M.; Holcar, M.; et al. Distribution of the Macrophyte Communities in the Danube Reflects River Serial Discontinuity. Water 2021, 13, 918. [Google Scholar] [CrossRef]
  61. Gutiérrez-Cánovas, C.; Sánchez-Fernández, D.; Velasco, J.; Millán, A.; Bonada, N. Similarity in the difference: Changes in community functional features along natural and anthropogenic stress gradients. Ecology 2015, 96, 2458–2466. [Google Scholar] [CrossRef] [PubMed]
  62. Sleith, R.S.; Wehr, J.D.; Karol, K.G. Untangling climate and water chemistry to predict changes in freshwater macrophyte distributions. Ecol. Evol. 2018, 8, 2802–2811. [Google Scholar] [CrossRef]
  63. Lukács, B.A.; Tóthmérész, B.; Borics, G.; Várbíró, G.; Juhász, P.; Kiss, B.; Müller, Z.; G-Tóth, L.; Erős, T. Macrophyte diversity of lakes in the Pannon Ecoregion (Hungary). Limnologica 2015, 53, 74–83. [Google Scholar] [CrossRef]
  64. Bini, L.M.; Thomaz, S.M.; Murphy, K.J.; Camargo, A.F.M. Aquatic macrophyte distribution in relation to water and sediment conditions in the Itaipu Reservoir, Brazil. Hydrobiologia 1999, 415, 147–154. [Google Scholar] [CrossRef]
  65. Rolon, A.S.; Lacerda, T.; Maltchik, L.; Guadagnin, D.L. Influence of area, habitat and water chemistry on richness and composition of macrophyte assemblages in southern Brazilian wetlands. J. Veg. Sci. 2008, 19, 221–228. [Google Scholar] [CrossRef]
  66. Barker, T.; Hatton, K.O.; O’Connor, M.; Connor, L.; Moss, B. Effects of nitrate load on submerged plant biomass and species richness: Results of a mesocosm experiment. Fundam. Appl. Limnol. 2008, 173, 89–100. [Google Scholar] [CrossRef]
  67. Moss, B.; Jeppesen, E.; Søndergaard, M.; Lauridsen, T.L.; Liu, Z.W. Nitrogen, macrophytes, shallow lakes and nutrient limita-tion: Resolution of a current controversy? Hydrobiologia 2013, 710, 3–21. [Google Scholar] [CrossRef]
  68. Bornette, G.; Puijalon, S. Response of aquatic plants to abiotic factors: A review. Aquat. Sci. 2011, 73, 1–14. [Google Scholar] [CrossRef]
  69. Smith, W.S.; Espíndola, E.L.G.; Rocha, O. Environmental gradient in reservoirs of the medium and low Tietê River: Limnological differences through the habitat sequence. Acta Limnol. Bras. 2014, 26, 73–88. [Google Scholar] [CrossRef]
  70. Scheffer, M.; Szabó, S.; Gragnani, A.; van Nes, E.H.; Rinaldi, S.; Kautsky, N.; Norberg, J.; Roijackers, R.M.M.; Franken, R.J.M. Floating plant dominance as a stable state. Proc. Natl. Acad. Sci. USA 2003, 100, 4040–4045. [Google Scholar] [CrossRef] [PubMed]
  71. Szabó, S.; Koleszár, G.; Braun, M.; Nagy, Z.; Vicei, T.T.; Peeters, E.T.H.M. Submerged Rootless Macrophytes Sustain a Stable State Against Free-Floating Plants. Ecosystems 2021, 25, 17–29. [Google Scholar] [CrossRef]
  72. Engelhardt, K.A.M.; Ritchie, M.E. Effects of macrophyte species richness on wetland ecosystem functioning and services. Nature 2001, 411, 687–689. [Google Scholar] [CrossRef] [PubMed]
  73. Fu, H.; Zhong, J.; Yuan, G.; Ni, L.; Xie, P.; Cao, T. Functional traits composition predict macrophytes community productivity along a water depth gradient in a freshwater lake. Ecol. Evol. 2014, 4, 1516–1523. [Google Scholar] [CrossRef]
  74. Hill, M.J.; White, J.C.; Biggs, J.; Briers, R.A.; Gledhill, D.; Ledger, M.E.; Thornhill, I.; Wood, P.J.; Hassall, C. Local contributions to beta diversity in urban pond networks: Implications for biodiversity conservation and management. Divers. Distrib. 2021, 27, 887–900. [Google Scholar] [CrossRef]
Figure 1. Map of surveyed altered waterbodies in Serbia.
Diversity 15 00231 g001
Figure 2. RDA plot of the environmental predictors and functional diversity indices as response variables, with scaling 2 applied. The abbreviated names of the environmental variables are given in Table 1, and those of functional diversity indices in Table 3.
Diversity 15 00231 g002
Figure 3. (A) Statistically significant coefficients of linear correlation between functional diversity indices and environmental variables (p < 0.001—***; p < 0.01—**; p < 0.05—*). (B) Venn diagrams of variation partitioning. The abbreviated names of the environmental variables are given in Table 1, and those of the functional diversity indices in Table 3.
Diversity 15 00231 g003
Figure 4. Results of the fourth-corner tests, corrected for multiple testing using FDR procedure. At α = 0.05 level, significant positive associations are represented by red cells and negative ones by blue cells. The abbreviated names of environmental variables are given in Table 1, and those of functional traits in Table 2.
Diversity 15 00231 g004
Table 1. Environmental variables used in data analyses, with the grouping applied in the Variation Partitioning (VarPart) procedure: Wchem—water chemistry; habitat—river habitat parameters.
VarPartEnvironmental VariableUnitCodeMeanStd.DevMinMedianMax
Wchemdissolved oxygenmg/Ldis_O8.551.555.218.9311.29
pH-pH8.030.187.568.018.39
conductivityµS/cmcond4041641263951234
ammoniummg/LNH4_N0.150.180.030.111.14
nitritemg/LNO2_N0.020.010.010.010.09
nitratemg/LNO3_N0.700.340.230.661.53
total nitrogenmg/Ltotal_N1.480.720.641.454.57
orthophosphatemg/LPO4_P0.070.080.010.050.37
total phosphorusmg/Ltotal_P0.140.090.040.120.46
habitatwater temperature°Cw_t15.082.167.9515.3518.79
channel widthmchn_w35736492201622
elevationm a.s.l.elev1801853280832
bank slope degree0–3bnk_slp1.980.691.002.003.00
riparian widthmrip_w116253051140
average degree of hemeroby1–7avg_hmrb3.631.101.503.846.00
number of land cover classes-No_LUt2.801.441.003.007.00
Table 2. List of 14 plant species traits and their attributes included in the analyses.
TraitAttributeCode
Ellenberg Temperature1–9TB
Ellenberg Water1–12WB
Ellenberg Reaction1–9RB
Ellenberg Nitrogen1–9NB
Ellenberg Light1–9LB
Growth form:free-floating, surfaceFfl_srfc
free-floating, submergedFfl_sbm
floating leaves, anchoredAc_fllv
submerged leaves, anchoredAc_sbmlv
emergent leaves, anchoredAc_emglv
heterophylly, anchoredAc_htrlv
Vertical shoot architecture:single apical growth pointsnglapgr
single basal growth pointsnglbsgr
multiple apical growth pointmltpapgr
Leaf type:tubulartblr
capillarycplr
entireentr
Leaf area:small (<1 cm2)LA1
medium (1–20 cm2)LA2
large (20–100 cm2)LA3
extra-large (>100 cm2)LA4
Morphology index (score):<1MI1
1–10MI2
10–40MI3
40–100MI4
>100MI5
Mode of reproductionrhizomerhzm
fragmentationfrgm
buddingbdng
turionstrns
stolonstln
tuberstbrs
seedssds
Perennation:annualannl
biennialbnnl
perennialprnnl
Body flexibility:low (<45°)BF1
intermediate (45–300°)BF2
high (>300°)BF3
Leaf texture:softlfsft
rigidlfrgd
waxylfwx
non-waxylfnwx
Table 3. Functional diversity indices used in the analyses.
IndexAbbreviationMeanStd.DevMinMedianMax
Functional RichnessFRic0.380.2800.370.92
Functional EvennessFEve0.730.300.830.99
Functional DivergenceFDiv0.690.2800.790.88
Functional DispersionFDis5.631.1205.886.85
Rao Quadratic EntropyRaoQ33.89.68035.9147.76
Functional DiversityFD1.370.1211.381.56
Functional RedundancyFRed6.365.1404.8619.06
Disclaimer/Publisher’s Note: The statements, opinions and data contained in all publications are solely those of the individual author(s) and contributor(s) and not of MDPI and/or the editor(s). MDPI and/or the editor(s) disclaim responsibility for any injury to people or property resulting from any ideas, methods, instructions or products referred to in the content.

