Article

PFOS Induces Lipometabolism Change, Immune Defense, and Endocrine Disorders in Black-Spotted Frogs: Application of Transcriptome Profiling

1
School of Life and Environmental Sciences, Hangzhou Normal University, Hangzhou 311121, China
2
State Environmental Protection Key Laboratory of Environmental Health Impact Assessment of Emerging Contaminants, Shanghai Academy of Environment Sciences, Shanghai 200233, China
3
Zhejiang Provincial Key Laboratory of Urban Wetlands and Regional Change, Hangzhou 311121, China
*
Author to whom correspondence should be addressed.
Diversity 2023, 15(2), 196; https://doi.org/10.3390/d15020196
Submission received: 15 December 2022 / Revised: 23 January 2023 / Accepted: 29 January 2023 / Published: 1 February 2023
(This article belongs to the Section Freshwater Biodiversity)

Abstract

:
Amphibian population declines are closely linked to increasingly serious environmental pollution. Field investigations revealed that perfluorooctane sulfonic acid (PFOS) distribution was detected in 100% of amphibians. In the present study, global transcriptome sequencing was determined on black-spotted frogs to quantify transcript expression levels and the development of an adverse outcome pathway for PFOS. A total of 1441 differentially expressed genes were identified in the PFOS exposure for 21 d, with 645 being downregulated and 796 upregulated. The gene functions and pathways for lipid metabolism, endocrine system, and immune defense were enriched. An adverse outcome pathway has been proposed, including PPAR (peroxisome proliferator-activated receptors) as the molecular initiating events; followed by changes in lipid metabolism, endocrine system, and immune defense; with an end result of liver damage or even population decline. This research provides molecular insight into the toxicity of PFOS. More research about differentially expressed genes is warranted to further provide the underlying mechanism that is altered as a result of PFOS toxicity in organisms.

1. Introduction

Due to their special habitat habits, amphibians perform a vital role in both aquatic and terrestrial ecosystems. However, the widespread use of chemicals, overexploitation of natural resources, and global climate change have led to the destruction of amphibian habitats, a rapid decline in biodiversity, and a serious decline in population sizes [1,2]. According to the International Union for Conservation of Nature’s (IUCN) Red List of Threatened Species in 2020, about 41% of amphibian populations globally are threatened with extinction [3]. Amphibians in China are facing more severe problems. A total of 43.1% of the amphibian species is in danger of extinction, higher than the global average [4]. Amphibians are going extinct at the fastest rate since the dinosaurs. The US National Aquarium also proposed 30 March as World Frog Day in 2014. The decline of amphibian populations also leads to the decline of other wildlife populations, such as snakes, which in turn leads to the decline of ecosystem biodiversity [5]. In conclusion, amphibian population decline has become a global consensus and is one of the research frontiers of conservation biology [6].
Amphibian population declines are closely related to the increasing serious environmental pollution [7,8]. Per- and polyfluoroalkyl substances (PFASs), and synthetic chemicals have been widely used in firefighting foams, surfactant additives, coating agents, and water and oil repellents [9]. With their strong carbon-fluorine bond, mangy per- and polyfluoroalkyl substances are difficult to degrade. One of the most widely used PFASs is perfluorooctane sulfonic acid (PFOS). With resistance to degradation, PFOS has been frequently detected in air, soils, groundwater, drinking water, and even organisms [10,11]. PFOS is mainly enriched in the liver, which is an important organ for metabolic activity. Notably, exposure to PFOS induces disturbances in lipid metabolism and hepatic lipid accumulation in mice and rats [12]. Human epidemiological studies have shown that serum concentrations of PFOS are associated with the risk of clinically relevant hepatocellular dysfunction. In 2009, due to the potential negative effects of PFOS on organisms and even human health, PFOS has been listed in Annex B of the Stockholm Convention by the United Nations Environment Program. Field investigations revealed that PFOS distribution was detected in 100% of amphibians, such as the black-spotted frogs [13,14]. Laboratory study further confirmed that PFOS are highly susceptible to ingestion by amphibian and may trigger antioxidant system activation via the MAPK (mitogen-activated protein kinase) pathway, subsequently induce liver damage [15], while the molecular initiating events that precede these phenotypic and physiological effects are not well understood, especially under environmentally relevant concentrations, which ranged from tens of ng/L to several µg/L in the aquatic environment [16].
So far, PFOS has been shown to harm aquatic organisms, e.g., fish, amphibians, and crustacean, and terrestrial and mammals through drinking water or food chain, e.g., potentially increasing the risks of cancer in humans. PFOS is primarily accumulated in the liver of organisms. Thus, the hepatotoxicity of PFSO was primarily performed and can occur via a variety of mechanistic pathways, including cellular, physiological, and immune. While the molecular initiating events that precede these phenotypic and physiological effects are not well understood, especially under environmentally relevant concentrations.
The application of omics technologies can be extremely beneficial in determining how contaminants adversely affect organisms [17]. They are also of valuable for identifying relevant biomarkers. As one of the omics, RNA-Seq (transcriptome sequencing) has been performed in the toxicology research of heavy metals, emerging pollution, and other contaminants [18,19]. The preceding research have demonstrated that RNA-Seq may be considered as one of effective methods for evaluating toxicity [19,20]. In addition, omics could help in the development of an adverse outcome pathway [21], which provides a framework for describing toxic mechanisms in organisms. An adverse outcome pathway starts with a molecular initiating event, which can be triggered by environmental contaminants or stress. This molecular initiating event is associated with a series of key events (KEs) that occur at increasing levels of biological organization and can lead to adverse outcomes of regulatory concern. Therefore, adverse outcome pathway is regarded as a relevant and vital approach in toxicology, which improves the organization of toxicological data relevant to the risk assessment of contaminants and environmental hazards. Although some studies have incorporated transcriptomic to study the effects of PFAS in organisms [22,23], to our best knowledge, little studies have been published on the transcriptomic responses in wild frogs, especially black spotted frog Rana nigromaculata, exposed to PFOS. Therefore, further studies are needed that apply transcriptomic analyses to determine the molecular mechanisms elicited by PFOS.
The black spotted frog (Rana nigromaculata) performs an vital role in the aquatic and terrestrial ecosystem, and has been listed as an endangered species by the International Union for Conservation of Nature (IUCN) [24]. Its highly permeable skin, making it highly susceptible to environmental chemicals, such as PFOS. Our field study showed that PFOS levels in Rana nigromaculata reached 164.66 ng/g, suggested that this frog could accumulative PFAS [13]. Meanwhile, with high reproduction rate, sensitivity to stressors and other special biological properties, Rana nigromaculata has been considered and widely used as one of suitable model organism for toxicology research of environmental contaminants, such as microcystins, Tetrabromobisphenol A (TBBPA), and trtrachlorobisphenol A (TCBPA). However, knowledge on the toxicology of PFOS in frogs and their detailed molecular and cellular mechanisms is still limited.
To further understand the mechanisms of PFOS toxicity under environmental relevant concentration, transcriptome sequencing was conducted on frog Rana nigromaculata to quantify transcript expression levels after 21 d of PFOS exposure. To identified novel molecular responses, mechanistic developmental toxicities caused by PFOS exposure were compared with control. The purpose of this research was to identify potential pathways and genes which are altered in frog exposed to waterborne PFOS. In addition, an adverse outcome pathway for developmental abnormality induced by PFOS at environmentally relevant levels was proposed. Above findings may help us better understand the potential risk of PFOS on animals, especially amphibians.

2. Materials and Methods

2.1. Chemicals

Wellington Laboratories Inc. (Guelph, ON, Canada) and Yeasen Biotechnology Co., Ltd. (Shanghai, China) provided standard PFOS (CAS 2795-39-3, purity ≥ 98%) and DMSO (>99.9%), respectively. The other chemicals used in the present research were all analytical or chromatographic quality.

2.2. Animals

Healthy adult frogs (R. nigromaculata) were purchased from ChangXing Agriculture Development Co., LTD (Huzhou, China). Frogs were maintained in laboratory conditions at 20 ± 1 °C in distilled water (dissolved oxygen content, 7 ± 1 mg/L; pH, 6.5 ± 0.5) for 14 d for acclimatization. The water was completely exchanged every 24 h to ensure that the content of dissolved oxygen remained above 7 mg/L.

2.3. Exposure Strategy

As male R. nigromaculata accumulate more PFAS (approximately 1.6–2.3 times) than females black spotted frog [14], male frogs were used for the present study. Approximately 30 g health male frogs were randomly divided into control group and ten μg/L PFOS treatment group. The concentration of PFOS was selected based on the environmental relevant concentrations ranging from tens of ng/L to several µg/L in the aquatic environment [16]. The actual exposure concentrations of PFOS was measured using UPLC–MS/MS (Xevo TQ-S, Waters Corporation, Milford, CT, USA) and was 11.14 ± 1.43 µg/L. Each group contained 20 frogs in a tank with 2 L distilled water (dissolved oxygen content, 7 ± 1 mg/L; pH, 6.5 ± 0.5). The test solutions were completely exchanged every 24 h to ensure the concentration of PFOS [13]. Frogs were maintained at 20 ± 1 °C. Five replicates per group were performed. To minimize individual variation, three livers from the frogs were pooled together as one sample. Frogs were euthanized by pithing after exposure for 21 d and, subsequent, the liver was immediately frozen in liquid nitrogen and stored at −80 °C for further experiment.

2.4. RNA Extraction, cDNA Library Construction, and Sequencing

TRIzol Reagent (TransGen, Beijing, China) was used to extract total RNA from Rana nigromaculata. Agilent 2100 Bioanalyzer (Agilent Technologies, Santa Clara, CA, USA) and NanoDrop 2000 (Thermo Scientific, Wilmington, DE, USA) were used to evaluate RNA integrity and quality. The following analysis was conducted on samples with an RNA Integrity Number ≥ 7 and an absorbance at 260 nm to that at 280 nm ratio of 1.8 and 2.2. An mRNASeq sample preparation kit (Illumina, San Diego, CA, USA) was used to create the libraries. These libraries were sequenced on the Illumina NovaseqTM 6000 at Hangzhou Lianchuan Biotech (Hangzhou, China) yielding 300 bp paired end reads.

2.5. Transcriptomic Assembly and Gene Annotation

After removing the adapter sequence and poor-quality readings, clean data was extracted the from the raw data using cutadapt and in-house Perl scripts [25]. The quality of the sequenced RNA for the clean data was assessed using FastQC (http://www.bioinformatics.babraham.ac.uk/projects/fastqc/, accessed on 1 October 2022) and the Q30 (percentage of phred quality score > 30). High-quality, clear data served as the foundation for the downstream analysis. Trinity 2.4.0 was used to assemble transcript sequences for the clean data [26]. To annotate the functions, the unigenes were mapped to the following databases: (i) eggNOG (evolutionary genealogy of genes: non-supervised orthologous groups) (ii) Swiss-Prot, and (iii) NCBI non-redundant (NR),via Diamond (E-value of 10−5) [27]. Functional annotations were assigned to the protein with the highest hits to the unigenes. In order to identify potential metabolic pathways, the unigenes were also linked to the KEGG database (Kyoto Encyclopedia of Genes and Genomes) and gene ontology (GO) [28,29].

2.6. Analysis of Differentially Expressed Genes (DEGs)

Salmon was performed to calculate transcripts per million for each unigene after annotation [30]. The differentially expressed genes of the PFOS exposed and control group (n = 5) were calculated with DESeq package (1.18.0) in R software (R project) [31]. To identify the differentially expressed genes, a fold change ≥ 2 or ≤−2 with a p-value < 0.05 was used as the criteria. To visualize the overall distribution of the differentially expressed genes, R software was used to produce volcano plots. The R pheatmap package was used to perform a cluster analysis on the sample correlation data [32].
Gene ontology (GO) and KEGG (Kyoto Encyclopedia of Genes and Genomes) pathway enrichment of differentially expressed genes were analyzed in R. The hypergeometric test was conducted on three different categories, including molecular functions, cellular components, and biological processes. Furthermore, a KEGG pathway was analyzed with p value of <0.05 as the cutoff [33].

3. Results

3.1. Transcriptome Sequencing and Assembly

In each group, more than 36,800,000 raw reads were obtained (Table 1). Low-quality reads, and those containing undetermined bases and adapter reads were removed to obtain valid reads. In the present research, each group yielded more than 33,000,000 valid reads. For de novo assembly, the clean reads were subsequently loaded into Trinity. Q30 were all exceeded 92.51% (Table 1). Above results suggested a high-quality assembly.

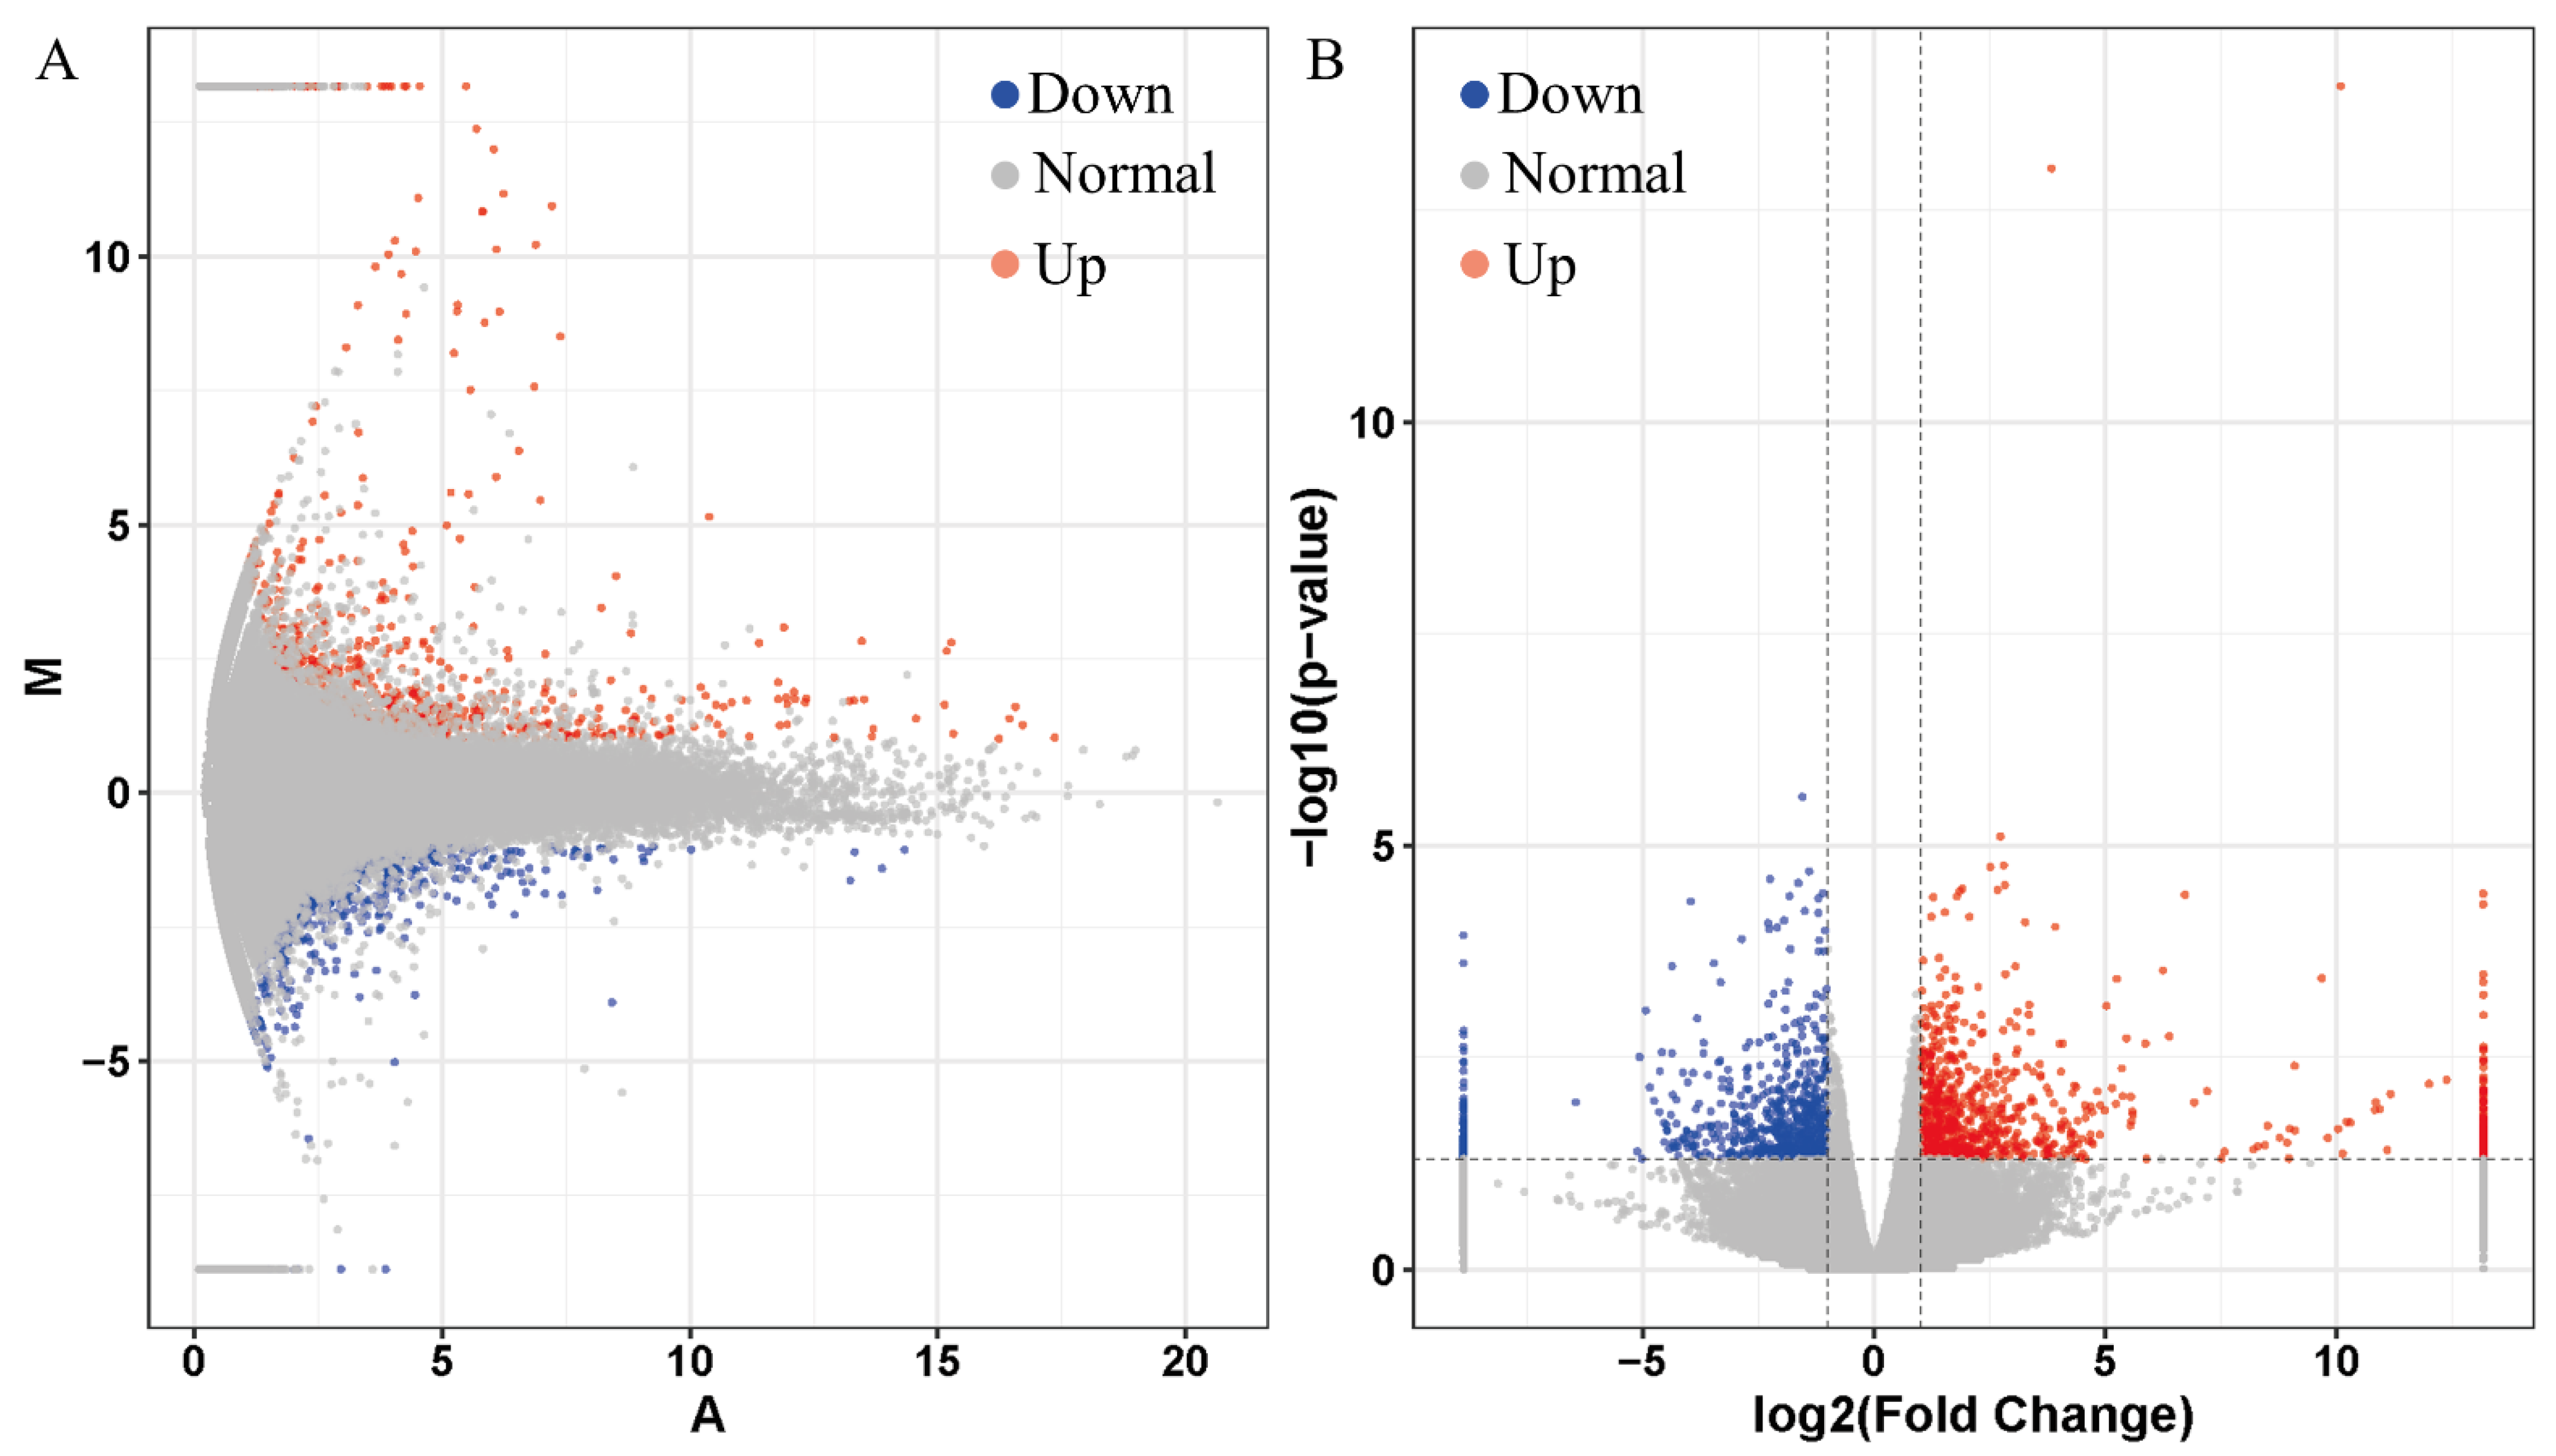
3.2. Identified of Differentially Expressed Genes (DEGs)
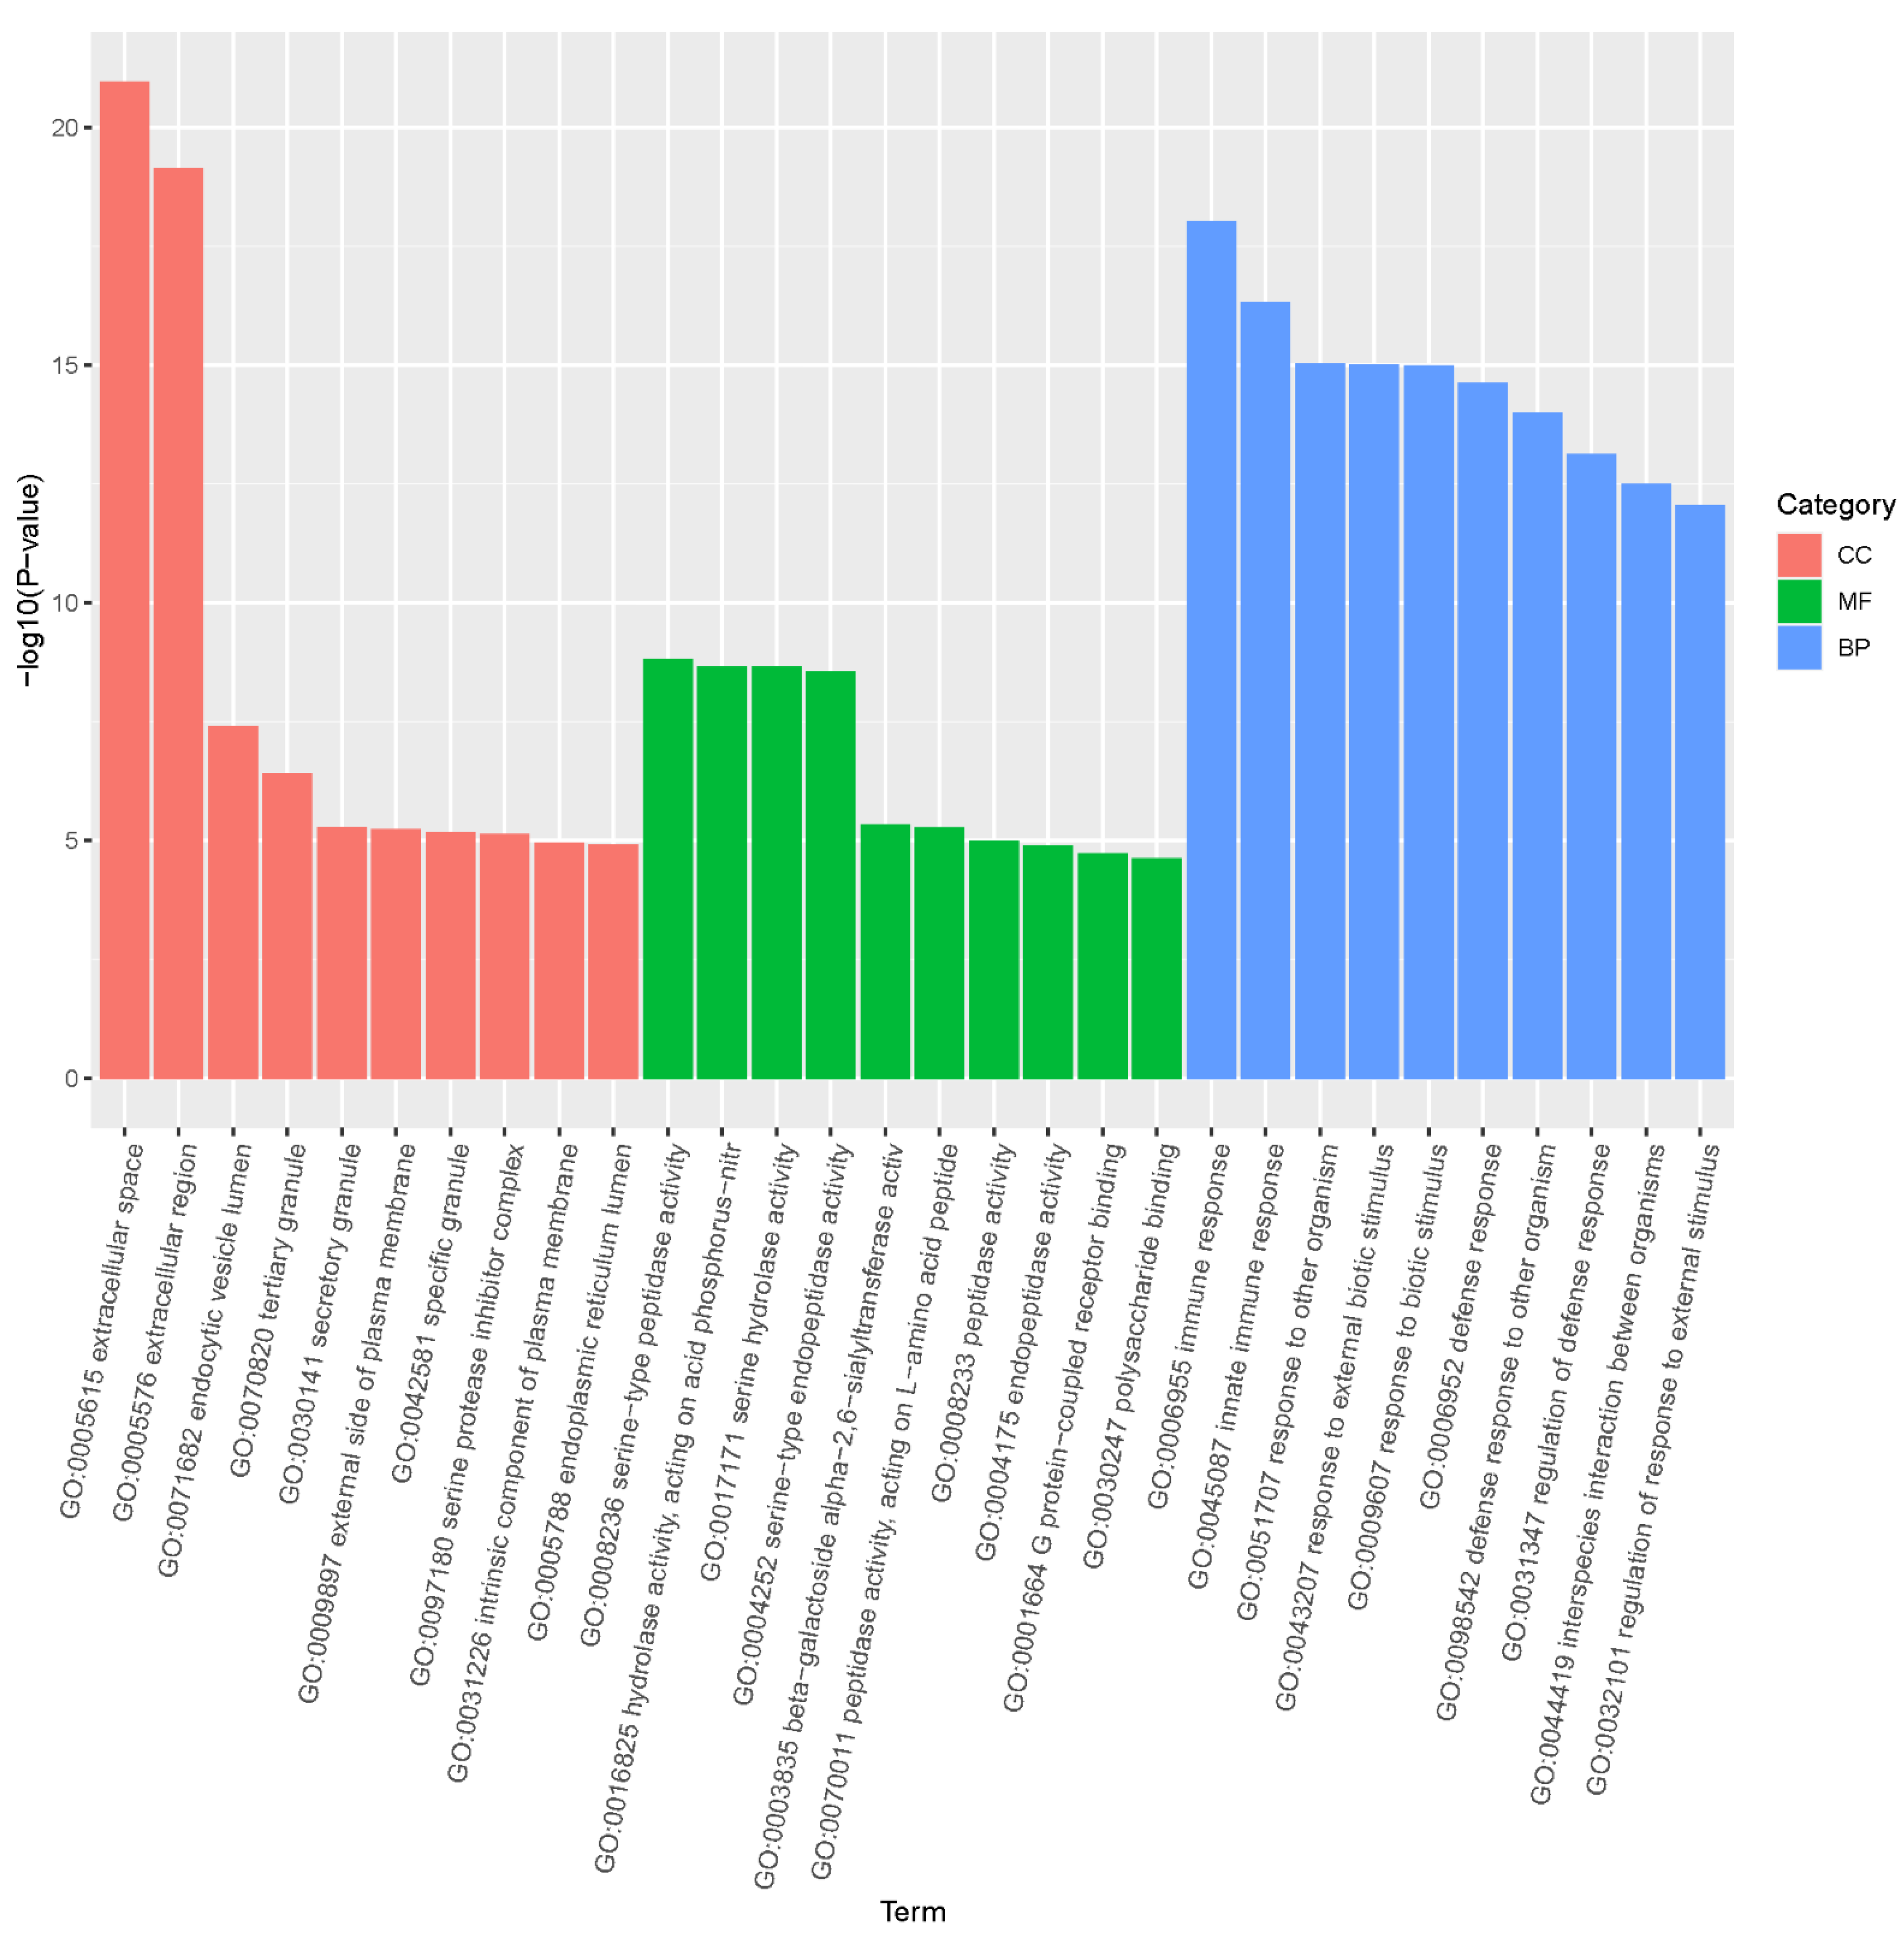
The differentially expressed genes of the PFOS exposed and control group (n = 5) were calculated with DESeq package (1.18.0) in R software. To identify the differentially expressed genes, a fold change ≥ 2 or ≤−2 with a p-value < 0.05 was used as the criteria. In total, 1441 differentially expressed genes were identified in black spotted frog exposed to PFOS, with 796 being up-regulated and 645 down-regulated genes (Figure 1A,B) (p < 0.05). Five biological samples from each of the control and PFOS exposure groups were clustered together (Figure 2).

3.3. GO Analysis

To further understand the functions were affected after exposure to PFOS, gene ontology (GO) enrichment of differentially expressed genes were analyzed in R. To determine which GO pathways affected by PFOS, the 1441 differentially expressed genes were mapped to three categories including molecular functions (831 subclasses), cellular components (451 subclasses), and biological processes (5268 subclasses) (Figure 3). A total of 315 biological processes were significantly affected by PFOS. The top ten biological processes impacted involved immune response (GO: 0006955), innate immune response (GO: 0045087), response to other organism (GO: 0051707), response to external biotic stimulus (GO: 0043207), response to biotic stimulus (GO: 0009607), defense response (GO: 0006952), defense response to other organism (GO: 0098542), regulation of defense response (GO: 0031347), interspecies interaction between organisms (GO: 0044419), regulation of response to external stimulus (GO: 0032101) (p < 0.05).
In addition, the GO directed acyclic graph (DAG) structure was constructed based on biological processes (Figure 4). The top ten significantly enriched subcategories were identified and included innate immune response, defense response to other organism, regulation of defense response, defense response, regulation of response to external stimulus, response to other organism, response to external biotic stimulus, interspecies interaction between organisms, response to biotic stimulus, and immune response.

3.4. KEGG Enrichment

To further understand the functions were affected after exposure to PFOS, a KEGG (Kyoto Encyclopedia of Genes and Genomes) pathway enrichment analysis was performed. A total of 237 pathways were enriched from 1442 differentially expressed genes. Among these, 17 pathways were significantly affected (p < 0.05): pancreatic secretion (ko04972), protein digestion and absorption (ko04974), retinol metabolism (ko00830), steroid biosynthesis (ko00100), complement and coagulation cascades (ko04610), neuroactive ligand-receptor interaction (ko04080), linoleic acid metabolism (ko00591), steroid hormone biosynthesis (ko00140), staphylococcus aureus infection (ko05150), chemical carcinogenesis (ko05204), arachidonic acid metabolism (ko00590), ferroptosis (ko04216), tyrosine metabolism (ko00350), thyroid hormone synthesis (ko04918), mineral absorption (ko04978), basal cell carcinoma (ko05217), and taste transduction (ko04742) (Figure 5).

4. Discussion

Our previous studies have shown that PFOS has negative effect on black spotted frog [13,15], while the underlying mechanisms causing these negative effects remain largely unknown. Thus, a transcriptomic studies of Rana nigromaculata response to PFOS was performed to further understand the toxicity mechanisms. In the present study, we discovered changes in expression of gene involved four major physiological functions: PPAR (peroxisome proliferator-activated receptors) signaling pathway, lipid metabolism, immune defense, and endocrine system. These pathways could be constructed an adverse outcome pathway (AOP) of PFOS toxicity: PPAR as the molecular initiating event (MIE), followed by changes in lipid metabolism, immune defense, and endocrine system, with an end result of liver damage in black-spotted frog.

4.1. PPAR Signaling Pathway

When enter into the organism, environmental contaminants could be bind to receptors, such as PPAR (peroxisome proliferator-activated receptors) [34]. Our previous results of molecular docking, gene expression, and protein expression shown that PFOS could bind to PPAR, then affect its expression in the black spotted frog R. nigromaculata [13]. In addition, this result also confirmed by the co-exposure to PFOS and PPAR antagonists in R. nigromaculata [13]. This potent interaction of PFOS with PPAR could be characterized as a molecular initiating event, which is critical for understanding the molecular mechanism of toxicity effects caused by environmental contaminants. The similarity between the RNA-Seq and our previous study confirms the application of the transcriptome for toxicology studies and the reliability of the transcriptome results in the present study. As a useful and vital tool, transcriptome has been widely used in biological study and should be widely used in toxicology research.

4.2. Lipid Metabolism

PPAR signaling pathway is crucial to lipid metabolism [35], suggesting that the lipid metabolism in the black spotted frog R. nigromaculata may be negatively affected by PFOS. In the present study, the black spotted frog exposed to PFOS significantly altered GO pathways related to lipid metabolism, such as glycolipid binding [36]. This speculation is consistent with previous researches indicated that PFASs (per- and polyfluoralkyl substances) can bind to PPARα (peroxisome proliferator-activated receptors α), subsequently downregulate lipolysis-related gene and up-regulate downstream expression of gene involved lipogenesis using in situ, in vivo, and in sillico with oil red o staining, biochemical measurements, quantitative real time polymerase chain reaction, Western blot, and molecular docking [13]. Environmental contaminants, such as heavy metals [37], microplastics [38], and nanoplastics [39], have been shown to be regulate lipid metabolism in aquatic organisms. Given that lipid is considered as one of the vital cellular components for maintaining homeostasis under environmental contaminants, these results shown that lipid metabolism, which is crucial for the propagation and survival, may be considered as one of the useful biomarkers for environmental contamination [40]. Further exploration and confirmation of specific biomarker is required.

4.3. Immune Defense

In the present study, at least 49 pathways involved in immune defense were significantly affected (p < 0.05), such as immune response, innate immune response, immune effector process, regulation of immune response, immune system process, humoral immune response, positive regulation of immune response, regulation of innate immune response, regulation of immune system process, regulation of immune effector process, positive regulation of immune system process, positive regulation of immune effector process, activation of immune response, adaptive immune response based on somatic recombination of immune receptors built from immunoglobulin superfamily domains, leukocyte activation involved in immune response, myeloid cell activation involved in immune response, positive regulation of innate immune response, cell activation involved in immune response, neutrophil activation involved in immune response, humoral immune response mediated by circulating immunoglobulin, positive regulation of immunoglobulin mediated immune response, positive regulation of humoral immune response, adaptive immune response, regulation of adaptive immune response based on somatic recombination of immune receptors built from immunoglobulin superfamily domains, positive regulation of adaptive immune response based on somatic recombination of immune receptors built from immunoglobulin superfamily domains, immune response-activating signal transduction, positive regulation of humoral immune response mediated by circulating immunoglobulin, regulation of humoral immune response, immune response-regulating signaling pathway, regulation of adaptive immune response, immunoglobulin mediated immune response, regulation of immunoglobulin mediated immune response, positive regulation of adaptive immune response, negative regulation of immune effector process, regulation of production of molecular mediator of immune response, regulation of humoral immune response mediated by circulating immunoglobulin, immune response-activating cell surface receptor signaling pathway, negative regulation of immune system process, immune response-regulating cell surface receptor signaling pathway, positive regulation of production of molecular mediator of immune response, natural killer cell mediated immune response to tumor cell, regulation of natural killer cell mediated immune response to tumor cell, production of molecular mediator of immune response, innate immune response-activating signal transduction, negative regulation of innate immune response, activation of innate immune response, negative regulation of immune response, immune system development, and innate immune response activating cell surface receptor signaling pathway. These findings suggest that PFOS may have an effect on frog immune defense. Although our findings are consistent with the previous research [41,42], the immunological effects of PFOS are still limited. Our previous study has been shown that PFOS could be induced immunotoxicity through the activation of the NF-κB pathway in R. nigromaculata using biochemical measurements, molecular docking, and quantitative real time polymerase chain reaction (qRT-PCR) [43]. The similarity between the transcriptomic sequencing and our previous study about PFOS immunotoxicity in the black spotted frogs [43] confirms the application of the transcriptome for toxicology studies and the reliability of the transcriptome results in the present study. Thus, omics, including transcriptomics, could be wide applied to further toxicology research. Above results shown that PFOS may have an effect on frog immune defense, which may lead to susceptibility to pathogens, and eventually affect the survival of individuals and even the amphibian population decline.

4.4. Endocrine System

In the present study, at least two GO pathways involved in endocrine system, such as steroid metabolic process and steroid hydroxylase activity, were significantly affected (p < 0.05). In addition, at least three pathways involved in endocrine system were significantly affected, e.g., steroid biosynthesis, steroid hormone biosynthesis, and thyroid hormone synthesis (p < 0.05). These results shown that PFOS may have endocrine disrupting properties and can interfere with testicular steroid hormones synthesis and secretion [44]. As the environmental concentration of PFOS activates steroid hormone biosynthesis through repressing histone methylation in rats [44], further research should be performed to confirm this vital finding in other organisms, especially the black spotted frogs.
Combined with the results of our previous study on the toxic effects of PFOS on the black spotted frogs R. nigromaculata [13,15,43], an adverse outcome pathway (AOP) could be constructed in the present study. This adverse outcome pathway was included PPAR as the molecular initiating event (MIE), followed by changes in lipid metabolism, immune defense, and endocrine system, with an end result of liver damage in black-spotted frog. Lipid metabolism, immune defense, and the endocrine system was considered as key events (KEs) in this adverse outcome pathway. An adverse outcome pathway could connect among environmental contaminants or stress, molecular initiating events, key events, and adverse outcome. Therefore, adverse outcome pathway is regarded as a relevant and vital approach in toxicology, which improves the organization of toxicological data relevant to the risk assessment of contaminants and environmental hazards. This research confirmed that omics, especially transcriptomics is considered as one of the useful methods for developing adverse outcome pathway for environmental contaminants or emerging pollutions.

5. Conclusions

Transcriptome is a powerful tool for studying the molecular changes that environmental pollutants cause in organisms. We constructed a transcriptome database for Rana nigromaculata in response to PFOS exposure and identified over 1441 differentially expressed genes with 796 being upregulated and 645 downregulated. Above findings indicate that PFOS exposure induced changes in lipid metabolism, immune defense, and endocrine system in R. nigromaculata. These pathways were assembled into an adverse outcome pathway, which will be used to develop a mechanistic understanding on PFOS toxicity in frogs and possibly other environmental contaminants or organisms. These altered mechanistic pathways shed light on the underlying mechanisms that are altered as a result of PFOS toxicity in frog. More research is warranted to confirm these results.

Author Contributions

Conceptualization, C.S. and Y.Y.; methodology, C.S. and H.Y.; software, C.S. and M.X.; validation, C.S., H.Y. and M.X.; formal analysis, M.H.; investigation, C.S., H.Y., T.H., Y.Y., X.H. and M.X.; resources, Z.L. and H.Z.; data curation, C.S., H.Y. and M.X.; writing—original draft preparation, C.S., H.Y. and M.X.; writing—review and editing, Z.L. and H.Z.; visualization, C.S., H.Y. and M.X.; supervision, Z.L.; project administration, C.S., H.Y. and M.X.; funding acquisition, Z.L. and H.Z. All authors have read and agreed to the published version of the manuscript.

Funding

This study was funded by the Natural Science Foundation of Zhejiang Province of China (LQ21B070005), “Pioneer” and “Leading Goose” R and D Program of Zhejiang (2023C03130), the special fund of State Environmental Protection Key Laboratory of Environmental Health Impact Assessment of Emerging Contaminants (SEPKL-EHIAEC-202201), Ecological Civilization Demonstration Zone Project of Huzhou Science and Technology Bureau (2020ZD2030), and the Talent Support Program of Hangzhou Normal University (4105C5021920445).

Institutional Review Board Statement

Not applicable.

Data Availability Statement

The data are not shared due to restrictions, e.g., privacy and regulation.

Conflicts of Interest

The authors declare no conflict of interest.

References

  1. Blaustein, A.R.; Romansic, J.M.; Kiesecker, J.M.; Hatch, A.C. Ultraviolet radiation, toxic chemicals and amphibian population declines. Divers. Distrib. 2003, 9, 123–140. [Google Scholar] [CrossRef]
  2. Mann, R.M.; Hyne, R.V.; Choung, C.B.; Wilson, S.P. Amphibians and agricultural chemicals: Review of the risks in a complex environment. Environ. Pollut. 2009, 157, 2903–2927. [Google Scholar] [CrossRef] [PubMed]
  3. IUCN. The IUCN Red List of Threatened Species. Version 2020-1. In IUCN Red List of Threatened Species (2020); IUCN: Gland, Switzerland, 2020; Available online: https://www.iucnredlist.org/ (accessed on 1 October 2020).
  4. Jiang, Z.; Jiang, J.; Wang, Y.; Zhang, E.; Zhang, Y.; Li, L.; Xie, F.; Cai, B.; Cao, L.; Zheng, G.; et al. Red list of china’s vertebrates. Biodivers. Sci. 2016, 24, 500–551. [Google Scholar]
  5. Zipkin, E.; DiRenzo, G.; Ray, J.; Rossman, S.; Lips, K. Tropical snake diversity collapses after widespread amphibian loss. Science 2020, 367, 814–816. [Google Scholar] [CrossRef] [PubMed]
  6. Fisher, M.C.; Garner, T.W. Chytrid fungi and global amphibian declines. Nat. Rev. Microbiol. 2020, 18, 332–343. [Google Scholar] [CrossRef]
  7. McCrink-Goode, M. Pollution: A global threat. Environ. Int. 2014, 68, 162–170. [Google Scholar] [CrossRef] [PubMed]
  8. Orton, F.; Tyler, C. Do hormone-modulating chemicals impact on reproduction and development of wild amphibians? Biol. Rev. 2015, 90, 1100–1117. [Google Scholar] [CrossRef]
  9. Schellenberger, S.; Liagkouridis, I.; Awad, R.; Khan, S.; Plassmann, M.; Peters, G.; Benskin, J.P.; Cousins, I.T. An outdoor aging study to investigate the release of per- and polyfluoroalkyl substances (pfas) from functional textiles. Environ. Sci. Technol. 2022, 56, 3471–3479. [Google Scholar] [CrossRef]
  10. Hamid, H.; Li, L.Y.; Grace, J.R. Review of the fate and transformation of per- and polyfluoroalkyl substances (pfass) in landfills. Environ. Pollut. 2018, 235, 74–84. [Google Scholar] [CrossRef]
  11. Kaltenberg, E.M.; Dasu, K.; Lefkovitz, L.F.; Thorn, J.; Schumitz, D. Sampling of freely dissolved per- and polyfluoroalkyl substances (pfas) in surface water and groundwater using a newly developed passive sampler. Environ. Pollut. 2023, 318, 120940. [Google Scholar] [CrossRef]
  12. Wang, Z.; Yao, J.; Guo, H.; Sheng, N.; Guo, Y.; Dai, J. Comparative hepatotoxicity of a novel perfluoroalkyl ether sulfonic acid, nafion byproduct 2 (h-pfmo2osa), and legacy perfluorooctane sulfonate (pfos) in adult male mice. Environ. Sci. Technol. 2022, 56, 10183–10192. [Google Scholar] [CrossRef] [PubMed]
  13. Lin, H.; Liu, Z.; Yang, H.; Lu, L.; Chen, R.; Zhang, X.; Zhong, Y.; Zhang, H. Per- and polyfluoroalkyl substances (pfass) impair lipid metabolism in Rana nigromaculata: A field investigation and laboratory study. Environ. Sci. Technol. 2022, 56, 13222–13232. [Google Scholar] [CrossRef]
  14. Cui, Q.; Pan, Y.; Zhang, H.; Sheng, N.; Wang, J.; Guo, Y.; Dai, J. Occurrence and tissue distribution of novel perfluoroether carboxylic and sulfonic acids and legacy per/polyfluoroalkyl substances in black-spotted frog (Pelophylax nigromaculatus). Environ. Sci. Technol. 2018, 52, 982–990. [Google Scholar] [CrossRef] [PubMed]
  15. Lin, H.; Wu, H.; Liu, F.; Yang, H.; Shen, L.; Chen, J.; Zhang, X.; Zhong, Y.; Zhang, H.; Liu, Z. Assessing the hepatotoxicity of pfoa, pfos, and 6:2 cl-pfesa in black-spotted frogs (Rana nigromaculata) and elucidating potential association with gut microbiota. Environ. Pollut. 2022, 312, 120029. [Google Scholar] [CrossRef]
  16. Zhou, Z.; Liang, Y.; Shi, Y.; Xu, L.; Cai, Y. Occurrence and transport of perfluoroalkyl acids (pfaas), including short-chain pfaas in tangxun lake, china. Environ. Sci. Technol. 2013, 47, 9249–9257. [Google Scholar] [CrossRef] [PubMed]
  17. Liu, Z.; Malinowski, C.R.; Sepúlveda, M.S. Emerging trends in nanoparticle toxicity and the significance of using daphnia as a model organism. Chemosphere 2021, 291, 132941. [Google Scholar] [CrossRef]
  18. Lin, H.; Feng, Y.; Zheng, Y.; Han, Y.; Yuan, X.; Gao, P.; Zhang, H.; Zhong, Y.; Liu, Z. Transcriptomic analysis reveals the hepatotoxicity of perfluorooctanoic acid in black-spotted frogs (Rana nigromaculata). Diversity 2022, 14, 971. [Google Scholar] [CrossRef]
  19. Zhang, W.; Liu, Z.; Tang, S.; Li, D.; Jiang, Q.; Zhang, T. Transcriptional response provides insights into the effect of chronic polystyrene nanoplastic exposure on daphnia pulex. Chemosphere 2020, 238, 124563. [Google Scholar] [CrossRef]
  20. Liu, Z.; Li, Y.; Pérez, E.; Jiang, Q.; Chen, Q.; Jiao, Y.; Huang, Y.; Yang, Y.; Zhao, Y. Polystyrene nanoplastic induces oxidative stress, immune defense, and glycometabolism change in daphnia pulex: Application of transcriptome profiling in risk assessment of nanoplastics. J. Hazard. Mater. 2021, 402, 123778. [Google Scholar] [CrossRef]
  21. Liu, Z.; Li, Y.; Sepúlveda, M.S.; Jiang, Q.; Jiao, Y.; Chen, Q.; Huang, Y.; Tian, J.; Zhao, Y. Development of an adverse outcome pathway for nanoplastic toxicity in daphnia pulex using proteomics. Sci. Total Environ. 2021, 766, 144249. [Google Scholar] [CrossRef]
  22. Davidsen, N.; Ramhøj, L.; Lykkebo, C.A.; Kugathas, I.; Poulsen, R.; Rosenmai, A.K.; Evrard, B.; Darde, T.A.; Axelstad, M.; Bahl, M.I.; et al. Pfos-induced thyroid hormone system disrupted rats display organ-specific changes in their transcriptomes. Environ. Pollut. 2022, 305, 119340. [Google Scholar] [CrossRef] [PubMed]
  23. Rodríguez-Jorquera, I.A.; Colli-Dula, R.C.; Kroll, K.; Jayasinghe, B.S.; Parachu Marco, M.V.; Silva-Sanchez, C.; Toor, G.S.; Denslow, N.D. Blood transcriptomics analysis of fish exposed to perfluoro alkyls substances: Assessment of a non-lethal sampling technique for advancing aquatic toxicology research. Environ. Sci. Technol. 2018, 53, 1441–1452. [Google Scholar] [CrossRef] [PubMed]
  24. Minhós, T.; Ferreira da Silva, M.; Bersacola, E.; Galat, G.; Galat-Luong, A.; Mayhew, M.; Starin, E. International Union for Conservation of Nature (IUCN) Red List Assessment, Temminck’s Red Colobus (Piliocolobus badius temminckii); e.T18247A92648587; IUCN: Gland, Switzerland, 2020. [Google Scholar]
  25. Martin, M. Cutadapt removes adapter sequences from high-throughput sequencing reads. EMBnet J. 2011, 17, 10–12. [Google Scholar] [CrossRef]
  26. Grabherr, M.G.; Haas, B.J.; Yassour, M.; Levin, J.Z.; Thompson, D.A.; Amit, I.; Adiconis, X.; Fan, L.; Raychowdhury, R.; Zeng, Q. Trinity: Reconstructing a full-length transcriptome without a genome from rna-seq data. Nat. Biotechnol. 2011, 29, 644. [Google Scholar] [CrossRef] [PubMed]
  27. Buchfink, B.; Xie, C.; Huson, D.H. Fast and sensitive protein alignment using diamond. Nat. Methods 2015, 12, 59–60. [Google Scholar] [CrossRef] [PubMed]
  28. Kanehisa, M.; Goto, S. Kegg: Kyoto encyclopedia of genes and genomes. Nucleic Acids Res. 2000, 28, 27–30. [Google Scholar] [CrossRef]
  29. Mistry, J.; Finn, R.D.; Eddy, S.R.; Bateman, A.; Punta, M. Challenges in homology search: Hmmer3 and convergent evolution of coiled-coil regions. Nucleic Acids Res. 2013, 41, e121. [Google Scholar] [CrossRef]
  30. Patro, R.; Duggal, G.; Love, M.I.; Irizarry, R.A.; Kingsford, C. Salmon provides fast and bias-aware quantification of transcript expression. Nat. Methods 2017, 14, 417–419. [Google Scholar] [CrossRef]
  31. Robinson, M.D.; McCarthy, D.J.; Smyth, G.K. Edger: A bioconductor package for differential expression analysis of digital gene expression data. Bioinformatics 2010, 26, 139–140. [Google Scholar] [CrossRef]
  32. Kolde, R.; Kolde, M.R. Package ‘pheatmap’. R Package. 2018. Available online: http://www2.uaem.mx/r-mirror/web/packages/pheatmap/pheatmap.pdf (accessed on 1 October 2022).
  33. Kanehisa, M.; Araki, M.; Goto, S.; Hattori, M.; Hirakawa, M.; Itoh, M.; Katayama, T.; Kawashima, S.; Okuda, S.; Tokimatsu, T. Kegg for linking genomes to life and the environment. Nucleic Acids Res. 2007, 36, D480–D484. [Google Scholar] [CrossRef]
  34. Mandal, P.K. Dioxin: A review of its environmental effects and its aryl hydrocarbon receptor biology. J. Comp. Physiol. B 2005, 175, 221–230. [Google Scholar] [CrossRef] [PubMed]
  35. Chawla, A.; Barak, Y.; Nagy, L.; Liao, D.; Tontonoz, P.; Evans, R.M. Ppar-γ dependent and independent effects on macrophage-gene expression in lipid metabolism and inflammation. Nat. Med. 2001, 7, 48–52. [Google Scholar] [CrossRef] [PubMed]
  36. Walther, T.C.; Farese, R.V., Jr. Lipid droplets and cellular lipid metabolism. Annu. Rev. Biochem. 2012, 81, 687. [Google Scholar] [CrossRef] [PubMed]
  37. Liu, Z.Q.; Lv, W.W.; Huang, Y.H.; Fan, B.; Li, Y.M.; Zhao, Y.L. Effects of cadmium on lipid metabolism in female estuarine crab, chiromantes dehaani. Comp. Biochem. Physiol. C-Toxicol. Pharmacol. 2016, 188, 9–16. [Google Scholar] [CrossRef] [PubMed]
  38. Chen, Q.; Lv, W.; Jiao, Y.; Liu, Z.; Li, Y.; Cai, M.; Wu, D.; Zhou, W.; Zhao, Y. Effects of exposure to waterborne polystyrene microspheres on lipid metabolism in the hepatopancreas of juvenile redclaw crayfish, cherax quadricarinatus. Aquat. Toxicol. 2020, 224, 105497. [Google Scholar] [CrossRef] [PubMed]
  39. González-Fernández, C.; Le Grand, F.; Bideau, A.; Huvet, A.; Paul-Pont, I.; Soudant, P. Nanoplastics exposure modulate lipid and pigment compositions in diatoms. Environ. Pollut. 2020, 262, 114274. [Google Scholar] [CrossRef]
  40. Lee, M.-C.; Park, J.C.; Lee, J.-S. Effects of environmental stressors on lipid metabolism in aquatic invertebrates. Aquat. Toxicol. 2018, 200, 83–92. [Google Scholar] [CrossRef]
  41. Zeng, Z.; Song, B.; Xiao, R.; Zeng, G.; Gong, J.; Chen, M.; Xu, P.; Zhang, P.; Shen, M.; Yi, H. Assessing the human health risks of perfluorooctane sulfonate by in vivo and in vitro studies. Environ. Int. 2019, 126, 598–610. [Google Scholar] [CrossRef]
  42. Liang, L.; Pan, Y.; Bin, L.; Liu, Y.; Huang, W.; Li, R.; Lai, K.P. Immunotoxicity mechanisms of perfluorinated compounds pfoa and pfos. Chemosphere 2022, 291, 132892. [Google Scholar] [CrossRef]
  43. Liu, Z.; Lin, H.; Zheng, Y.; Feng, Y.; Shi, C.; Zhu, R.; Shen, X.; Han, Y.; Zhang, H.; Zhong, Y. Perfluorooctanoic acid and perfluorooctanesulfonic acid induce immunotoxicity through the nf-κb pathway in black-spotted frog (Rana nigromaculata). Chemosphere 2023, 313, 137622. [Google Scholar] [CrossRef]
  44. Han, X.; Alam, M.N.; Cao, M.; Wang, X.; Cen, M.; Tian, M.; Lu, Y.; Huang, Q. Low levels of perfluorooctanoic acid exposure activates steroid hormone biosynthesis through repressing histone methylation in rats. Environ. Sci. Technol. 2022, 56, 5664–5672. [Google Scholar] [CrossRef] [PubMed]
Figure 1. Differentially expressed genes (DEGs) identified in Rana nigromaculata exposed to PFOS in comparison to the control. Differentially expressed genes between the control and the nanoplastic-treated group were visualized as an MA (M-versus-A) plot (A) and volcano plot map (B). Blue and red dots indicate down-regulation and up-regulation of differentially expressed genes in the PFOS treated group in comparison to the control, respectively. (For interpretation of the references to color in this figure legend, the reader is referred to the web version of this article).
Diversity 15 00196 g001
Figure 2. Hierarchical clustering for the differentially expressed genes between the PFOS (perfluorooctane sulfonic acid) and control. Red represents up-regulation and blue represents down-regulation. (For interpretation of the references to color in this figure legend, the reader is referred to the web version of this article).
Diversity 15 00196 g002
Figure 3. Gene ontology (GO) analysis of differentially expressed genes. The top 30 GO terms identified (p < 0.05 and the unigene number of GO terms were >2) for biological processes, cellular components, and molecular functions are presented. (For interpretation of the references to color in this figure legend, the reader is referred to the web version of this article).
Diversity 15 00196 g003
Figure 4. An abridged directed acyclic graph representation of gene ontology (GO) assignments of differentially expressed genes based on biological processes. The top ten most significant GO terms were set as square, and the remaining GO terms were set as circular. The darker the color, the more significant the GO term, the color from light to dark: colorless–light yellow–dark yellow–red. (For interpretation of the references to color in this figure legend, the reader is referred to the web version of this article).
Diversity 15 00196 g004
Figure 5. KEGG (Kyoto Encyclopedia of Genes and Genomes) pathway analysis of differentially expressed genes. The X-axis represents rich factor and the Y-axis represents pathways. The color and size of each bubble represent the enrichment significance and the number of genes enriched in the pathway, respectively. (For interpretation of the references to color in this figure legend, the reader is referred to the web version of this article).
Diversity 15 00196 g005
Table 1. Statistics for the sequenced transcriptome data.
SampleReads No.Bases (bp)Q30 (bp)N (%)Q20 (%)Q30 (%)Clean
Reads No.
Clean
Data (bp)
Clean
Reads %
Clean
Data %
C148,625,9567,293,893,4006,792,623,1940.00964597.4393.1244,947,8586,742,178,70092.4392.43
C236,803,5705,520,535,5005,107,266,1730.0096397.1592.5133,650,2065,047,530,90091.4391.43
C345,578,5146,836,777,1006,372,523,6690.00951597.4393.240,731,0486,109,657,20089.3689.36
C448,676,0367,301,405,4006,780,579,5740.00963897.2792.8644,445,6166,666,842,40091.391.3
C538,909,9345,836,490,1005,422,004,2850.00961297.2992.8935,623,1605,343,474,00091.5591.55
P139,576,2245,936,433,6005,495,635,5420.00963797.1492.5736,199,4825,429,922,30091.4691.46
P244,026,0026,603,900,3006,133,830,3900.00943897.2992.8840,301,2006,045,180,00091.5391.53
P344,797,2366,719,585,4006,231,277,1400.00943697.2192.7340,892,6726,133,900,80091.2891.28
P437,467,7585,620,163,7005,198,500,6710.00962397.1192.4934,366,4565,154,968,40091.7291.72
P538,538,9785,780,846,7005,355,863,3880.00967297.1492.6435,310,9265,296,638,90091.6291.62
Sample: the name of the sample, C: Control; P: PFOS: perfluorooctane sulfonic acid. Reads No.: total number of Reads. Bases (bp): total number of bases. Q30 (bp): total number of bases with base recognition accuracy of 99.9% or higher. N (%): percentage of ambiguous bases. Q20 (%): percentage of phred quality score > 20. Q30 (%): percentage of phred quality score > 30. Clean Reads No: number of high-quality sequence reads. Clean Data (bp): number of bases of high-quality sequences. Clean Reads %: percentage of high-quality sequence reads to sequencing reads. Clean Data %: percentage of high-quality sequence bases to sequencing bases.
Disclaimer/Publisher’s Note: The statements, opinions and data contained in all publications are solely those of the individual author(s) and contributor(s) and not of MDPI and/or the editor(s). MDPI and/or the editor(s) disclaim responsibility for any injury to people or property resulting from any ideas, methods, instructions or products referred to in the content.

