Article

Day-Time Roost Patterns of New and Previously Translocated North Island Brown Kiwi (Apteryx mantelli)

School of Environmental and Animal Sciences, Te Pūkenga trading as Unitec, Private Bag 92025, Victoria Street West, Auckland 1142, New Zealand
*
Author to whom correspondence should be addressed.
Diversity 2023, 15(2), 190; https://doi.org/10.3390/d15020190
Submission received: 25 November 2022 / Revised: 19 December 2022 / Accepted: 11 January 2023 / Published: 30 January 2023
(This article belongs to the Section Biodiversity Conservation)

Abstract

:
Information on the day-time roost areas of North Island brown kiwi (NIBK) (Apteryx mantelli), particularly post-translocation, is limited. This study aimed to determine the day-time roost areas of newly translocated NIBK and compare these with birds that had established from a translocation in the previous year. Radio telemetry was used to monitor sub-adult NIBK in the first three weeks post-translocation simultaneously with birds released in the previous year. The data from 15 birds (nine translocated in 2014 and six translocated in 2013) were used to calculate the area over which roost sites were distributed. Areas were estimated using Minimum Convex Polygon (MCP, Ha) and 50 percentile kernel density estimation (KDE, Ha). No significant difference in MCP was determined between newly translocated 2014 birds (21.3 Ha, SE 7.92) and those translocated in 2013 (22.85 Ha, SE 10.84) or between KDE50 for 2013 birds (16.30 Ha, SE 7.44) compared with 2014 birds (20.66 Ha, SE 8.29). Within the first three weeks post-translocation, most of the 2014 birds remained within the vicinity of their release site, which may be due to a combination of suitable habitat/roost sites and the ‘anchoring’ effect of previously established 2013 birds. This study provides new information on roost areas of newly translocated NIBK and highlights the importance of post-translocation monitoring.

1. Introduction

North Island brown kiwi (NIBK) (Apteryx mantelli) (Order: Apterygiformes, Family: Apterygidae) are nocturnal flightless ratites, which are endemic to New Zealand and are classified as ‘vulnerable’ as per the IUCN Red List [1]. Once widespread in North Island, New Zealand, the decline of this ground-dwelling species has been primarily due to introduced predators, such as dogs, cats, rats and stoats, but also the loss and fragmentation of habitat [2]. Kiwi are predominantly found in New Zealand native forest habitats and forage during the night consuming primarily invertebrates, earthworms, beetle larvae and small amounts of fruit and leaves [3,4]. During day-light hours they retreat to burrows, preferably in either living or dead trees, or holes in the ground in native forest habitats [5].
Translocations, the human-mediated movement of a species from one place to another, is an integral component in the management of kiwi populations for the genetic strengthening of existing populations and the establishing of new ones [6]. As a result of increasing knowledge and success [7], translocations of New Zealand species have progressed from initial introductions to the relatively low risk habitats of isolated pest-free islands, to predator-proof fenced mainland sanctuaries, and finally to managed mainland sites where predator numbers are kept to a minimum [8,9].
The post-release monitoring of translocated species is recognized as a critical requirement for the overall assessment of both short- and long-term success of the translocation event as well as the improvement of future translocation protocols [6,8,10]. Despite the potentially high costs involved, monitoring can provide data on post-translocation dispersal, the establishment of home ranges, and information for management practices to maintain released birds in managed areas, as well as feeding back to the species management plans [6,10,11].
According to previous studies, home ranges can vary considerably and are likely to be influenced by habitat area or confinement and kiwi density. Zhang et al [12] found that dispersal by southern brown kiwi (Apteryx australis) related to the habitat availability and location in the landscape, particularly the presence of large forest habitat patches. Ziesemann [13] showed that nocturnal roost areas were small for NIBK on the small but high density Ponui Island (18 km2), whereas McLennan et al. [14] found that day/night home ranges of birds in the much larger and less dense Kahurangi National Park translocation were considerably greater. A further example, Toy and Toy [10], in which the spatial use and home ranges of roroa (great spotted kiwi, A. maxima) translocated to the Flora Stream area in the Kahurangi National Park, New Zealand, was monitored for a period of 2–8 years. Translocated birds established stable home ranges in as little as 9 days but extending to almost 2.5 years, and these covered areas of 33–1745 ha are estimated using the Minimum Convex Polygon approach. Additional pest control was implemented during the dispersal phase outside of the original area to protect these far-dispersing birds (maximum 9.8 km), while four others were retrieved and returned to the original area where they set up home ranges. This indicates that available space or containment may limit the range size for translocated kiwi.
One important criteria for success is the likelihood of dispersal, and whether such dispersal remains confined to areas of suitable habitat, which in New Zealand also includes the management of introduced terrestrial predators of endangered birds [15]. Measures to mitigate extended dispersal and improve translocation success include holding individuals in captive facilities in situ before release, supplementary feeding after release, acoustic anchoring and the release of high numbers of individuals [11,16]. However, these methods have shown variable success and do not account for the issue of the long-term effects of dispersal.
Translocations of volant terrestrial birds showed these birds tended to move over larger areas than resident birds, with their movements being elevated immediately following release [17,18]. The dispersal of translocated and released flightless kiwi is also an important issue influencing population establishment, especially at unfenced mainland sites [15]. The extent of movement is also likely to be related to habitat quality. The territory size of NIBS (Apteryx australis mantelli, now classified as Apteryx mantelli) decreases with the proportion of preferred habitat [19] and it is likely that the extent of dispersal of the translocated birds is similarly impacted.
Our study objective was to investigate the spatial day-time roost range of 12 sub-adult male North Island brown kiwi (Apteryx mantelli) released in 2014, compared with those of previously established birds (translocated in 2013). The study was conducted on a privately owned mainland property under intensive pest-control. We documented the locations of kiwi during the day (roost location) for 3 weeks immediately after their release and then used these day-time locations as a proxy for the birds' movement and space use in the habitat. We then determined and compared the space utilization of these newly released kiwi to the existing birds that still had transmitters from the 2013 translocation. No specific measures to limit dispersal and maintain birds in the protected area were implemented in our study, although previously established birds may have acted as acoustic anchors for newly released birds [16,20].

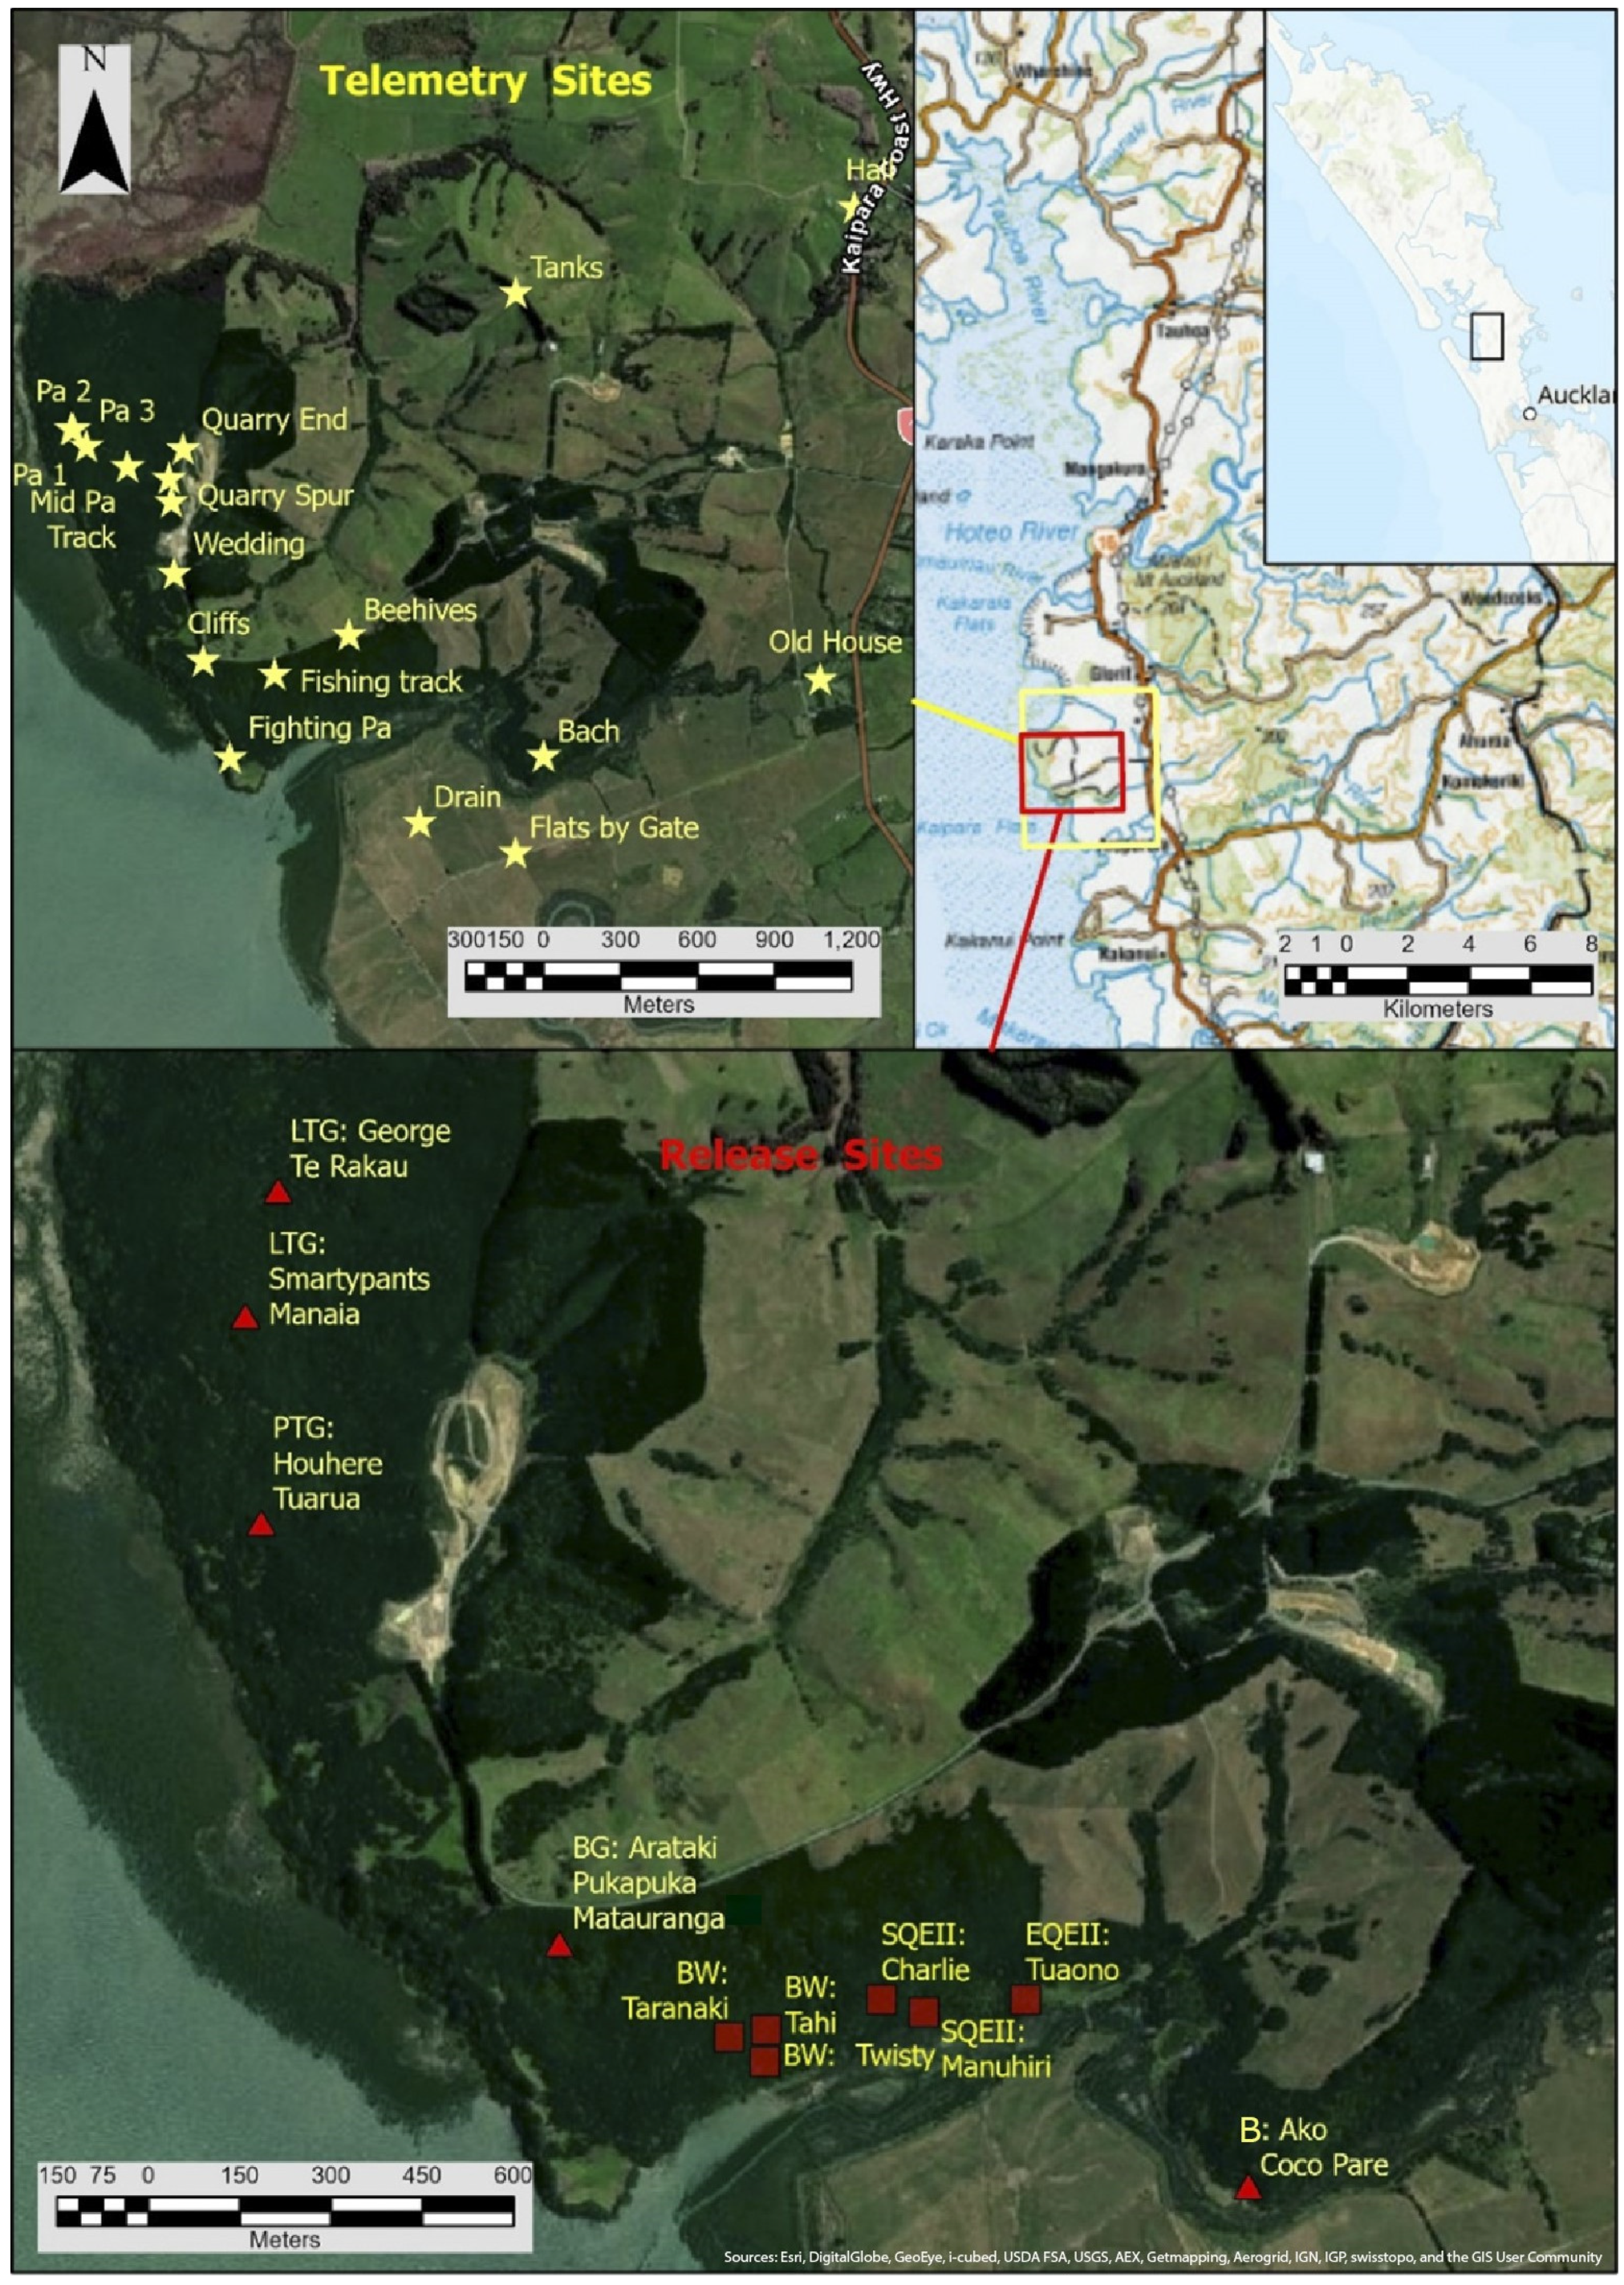
2. Materials and Methods

The study was conducted at Mataia Restoration Project, (hereafter referred to as Mataia), Glorit, Kaipara Harbour, New Zealand. The property comprises a 400 Ha New Zealand native mixed coastal broadleaf/podocarp forest and salt marshland restoration area within a 1300 Ha private commercial pastoral sheep and beef farm (Figure 1). The property is bounded on three sides by a 7-wire fence plus a temporary shade cloth to restrict dispersal of the kiwi, which was a condition of the Department of Conservation (DOC) National Permit Number 36451-FAU, while the fourth is bounded by the Kaipara Harbour.
Translocations were conducted under the Department of Conservation (DOC) National Permit Number 36451-FAU with animals being sourced from a kiwi crèche on Motuora Island, Hauraki Gulf Marine Park, Auckland, New Zealand. The permit allowed for 40 birds to be captured and translocated to Mataia Restoration Project over a period of 3 years starting in 2013, with permission to translocate up to 15 birds in the first year and up to 25 birds in the two subsequent years. All newly released birds were to be fitted with leg transmitters and monitored for at least 6 weeks post-translocation followed by the monitoring of a minimum of 4 birds once a month until otherwise advised by DOC and the National Kiwi Recovery Group.
The first birds to be translocated (13 individuals) were fitted with leg transmitters and underwent a hard-release in May 2013 with no supplementary food provision. As advised by DOC staff, birds were released at sites located in preferred kiwi habitat; mature native forest [3,4], in the south east QEII block on the property (Figure 1). Seven of these birds (one female and six males) had retained their leg transmitters in the sampling period in 2014. As per the transfer detail of the DOC permit conditions, a further translocation was undertaken in April 2014 using the same protocol. This involved the translocation of 12 mixed-age NIBK (eight males and four females), all weighing 1.5 kg or above, from the Motuora Island kiwi creche to Mataia Restoration Project. Each of these translocated kiwis were named by members of the local community. Birds were released at one of five designated sites deemed to be of high habitat quality and suitability for kiwi in groups as per advice of DOC staff (Figure 1). All birds were fitted with a 20-25g adult leg-mounted Sirtrack® or Kiwi Track® transmitter (Lotek NZ Limited and Kiwi Track Limited, Havelock North, New Zealand) before release.
Locations of birds released in 2013 and 2014 birds were determined 3-5 times a week between 13 April and 5 May 2014, as described by Colbourne et al. [9] to meet the requirements of Schedule 3 of the Special Conditions for Translocation Monitoring of the DOC Permit. This resulted in 12 days of tracking, which started two days after release of the 2014 translocated birds.
Sixteen elevated and accessible sites around the Mataia conservation area and farm were selected to determine bearings to birds equipped with transmitters (Figure 1). Bearings were measured using a Silva Field 7® hand-held compass (Silva Limited, Bathgate, UK). Bearings were selected on the basis of the direction of the strongest signal strength indicated by the receiver. A Sirtrack VHF Ultra Receiver® (Lotek NZ Limited, Havelock North, New Zealand), with the option of analogue or digital signal strength indicators combined with a 3-element folding Yagi antenna® (Lotek NZ Limited, Havelock North, New Zealand) were used to receive signals from the transmitters. We obtained an average of three bearings per kiwi per day, (range: two-six bearings per day). Bearings were recorded during daylight hours when kiwi are roosting.
The coordinates of each kiwi roost location for each day were determined from the bearings of the telemetry sites using the distance and direction routine installed in ArcMap 10.7 [21]. The individual bird daytime (roosting) landscape utilization was estimated using the Minimum Convex Polygon (MCP) tool, which is normally used for the calculation of home range [22,23]. The utilization distribution method (KDE) [24,25] particularly its 50 percentile (KDE50) core roost range size was also used to visualize the overlapping of the bird’s roost areas [26,27]. The KDE50 is often used to describe a core home range where an animal spends 50 % or more of its time compared to other areas [26,28], while 100% MCP and 95% KDE has frequently been used to determine the home range of a number of different species [29,30]. The large difference in the estimates of the area that encompasses roost sites used by kiwi generated by MCP and KDE50 analysis methods are not unexpected due to the algorithms used in each analysis. This study does not compare these analytical methods but focuses on the differences between roost area for birds released in 2013 and 2014. Use of these methods (100% MCP and 95% KDE) was seen as a means to provide a broader understanding of the spatial distribution and also to address inherent disadvantages in each [23]. The size of the area utilized by kiwi released in 2013 was compared with those released in 2014 using the non-parametric Mann-Whitney U test.

3. Results

3.1. Bird Data used in the Analysis

Of the total 19 birds released at Mataia in this study, 15 of these (six from 2013 and nine from 2014 translocations) had position fixes of acceptable quality for use in the range and distribution tools in the ArcMap (100 % MCP Area, Ha; KDE50 percentile area, Ha) (Table 1). Not all the bearings from tracking sites to birds with transmitters birds intersected, and their locations could not be determined. One bird (Bird 21 Coco) dispersed approximately 2.5 km from the release site (B, Batch) in one night to a day-time roost that was located outside of the protection zone of Mataia. This bird was retrieved and re-released 2 km to the northwest within a bush patch (LTG, Lemon Tree Gully), in which most of the 2014 cohort birds were released. This bird then remained close to the new release site for the duration of the observation period.

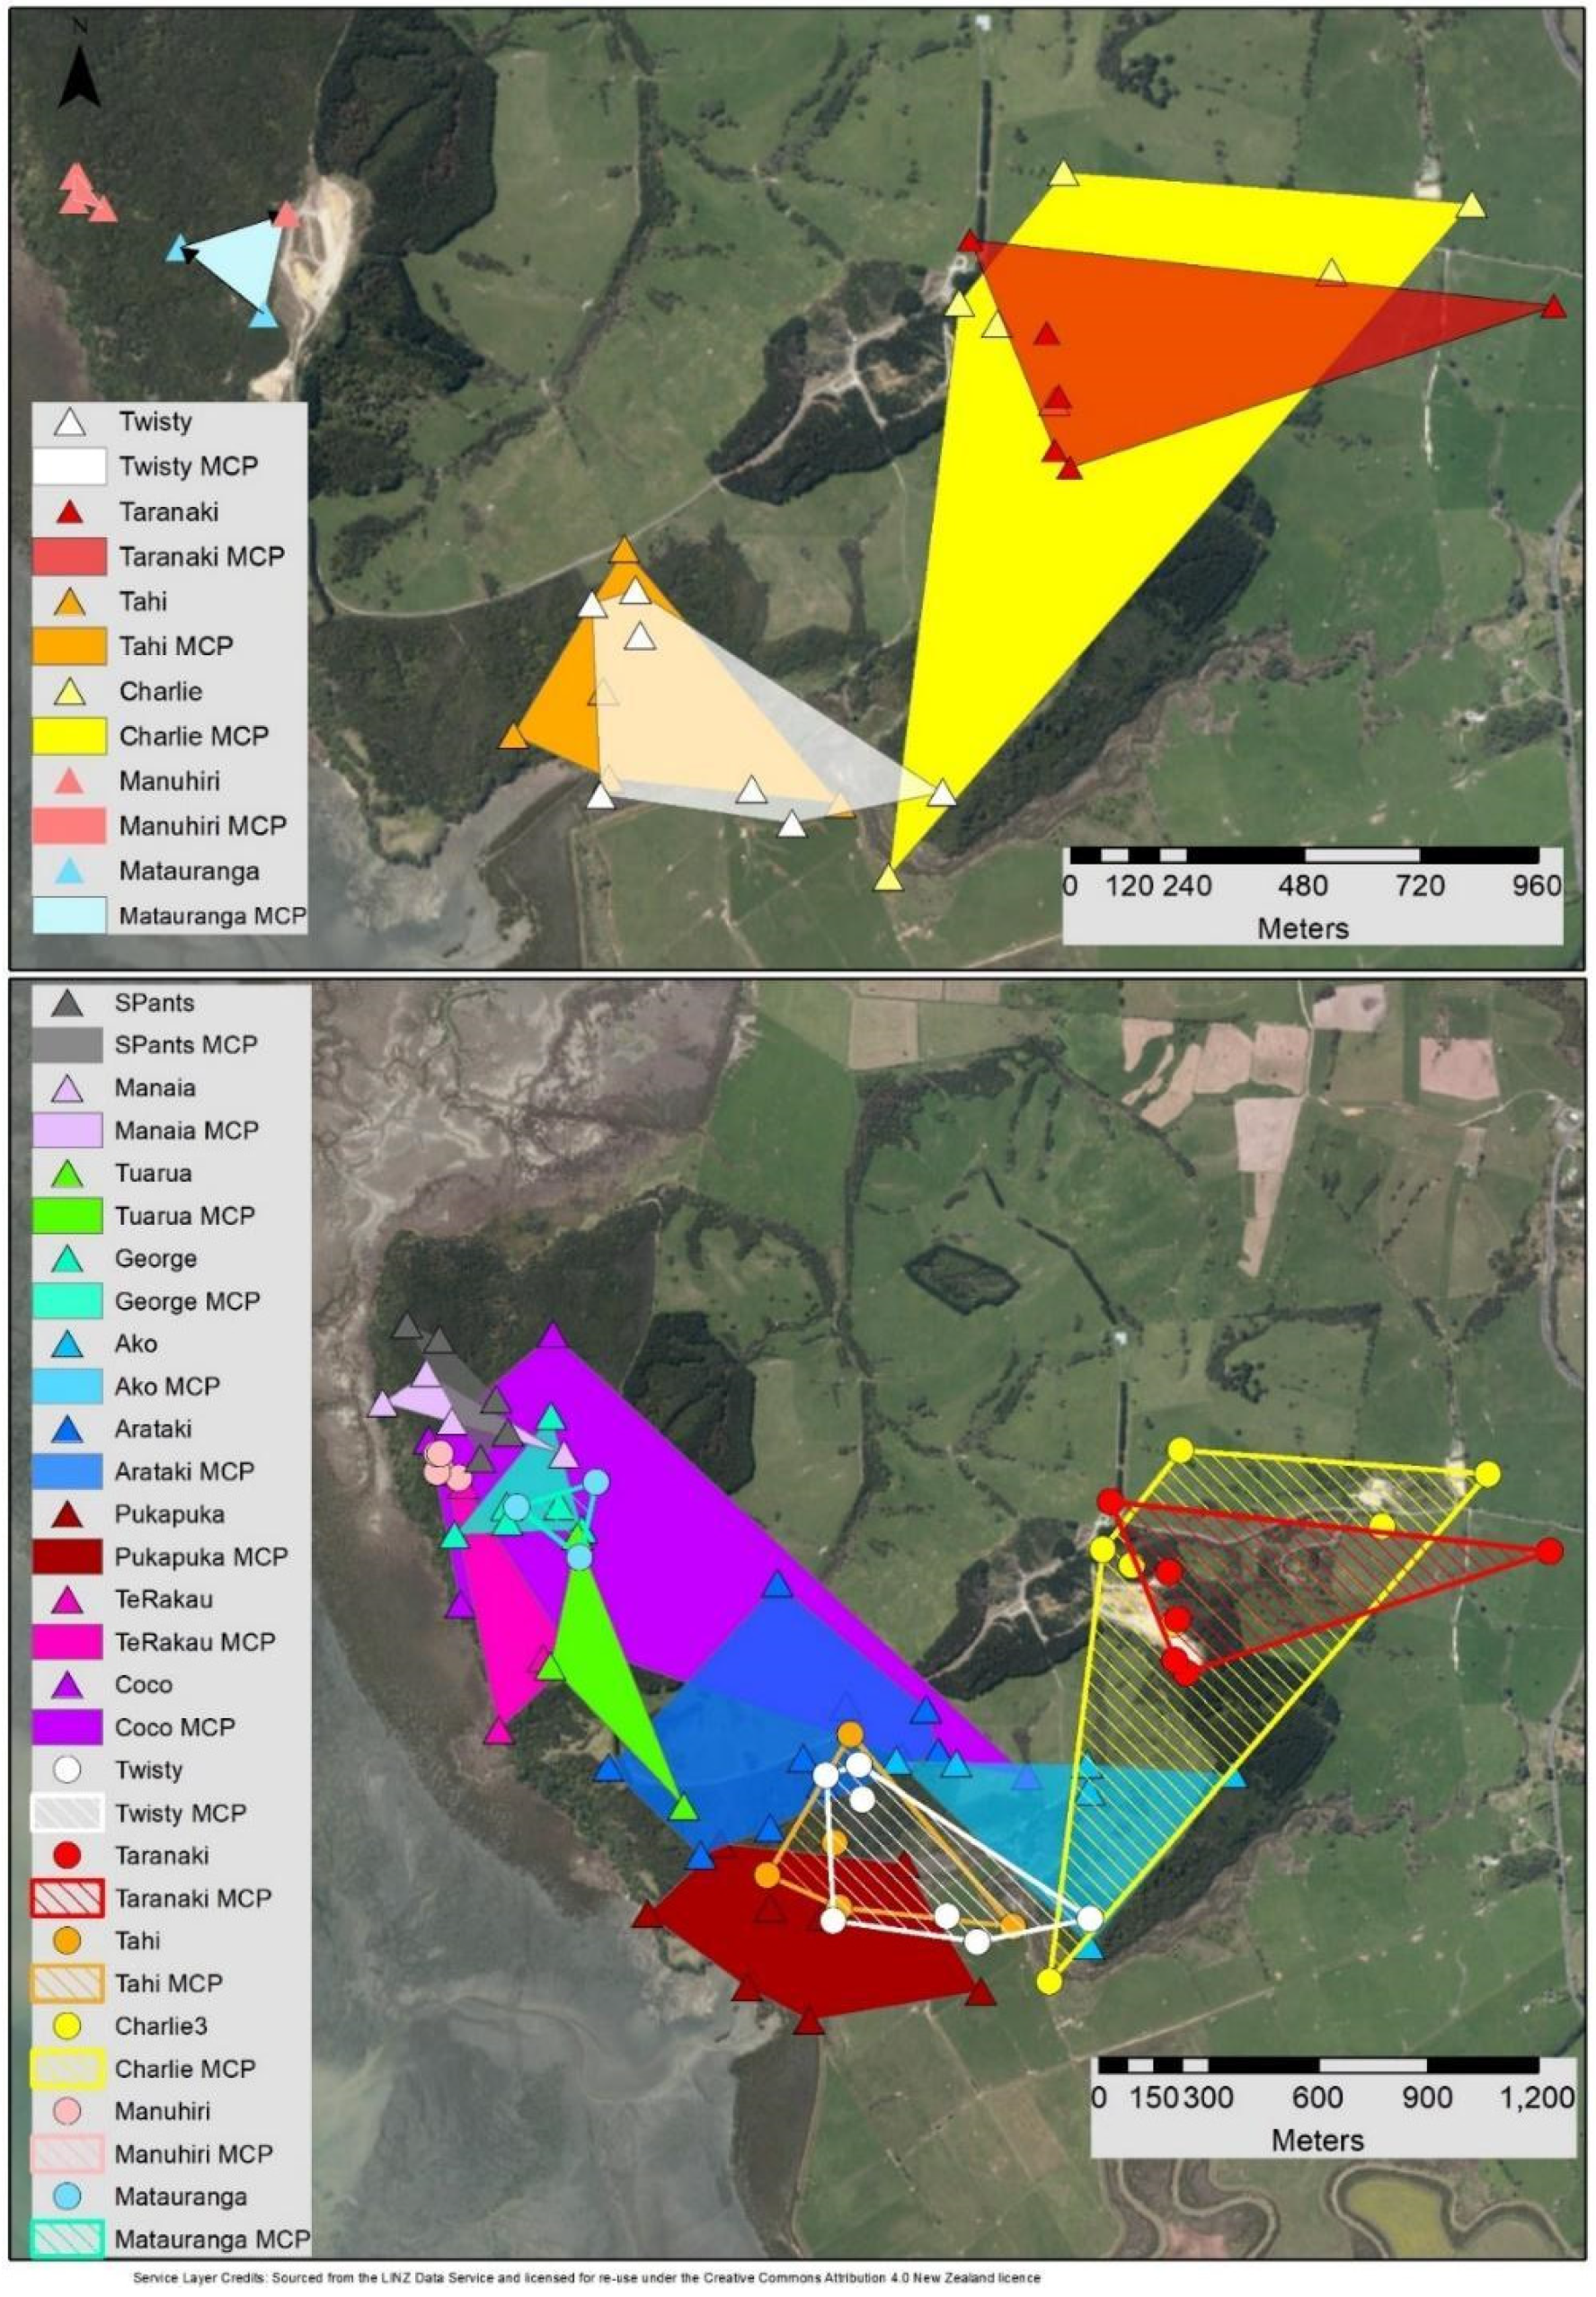
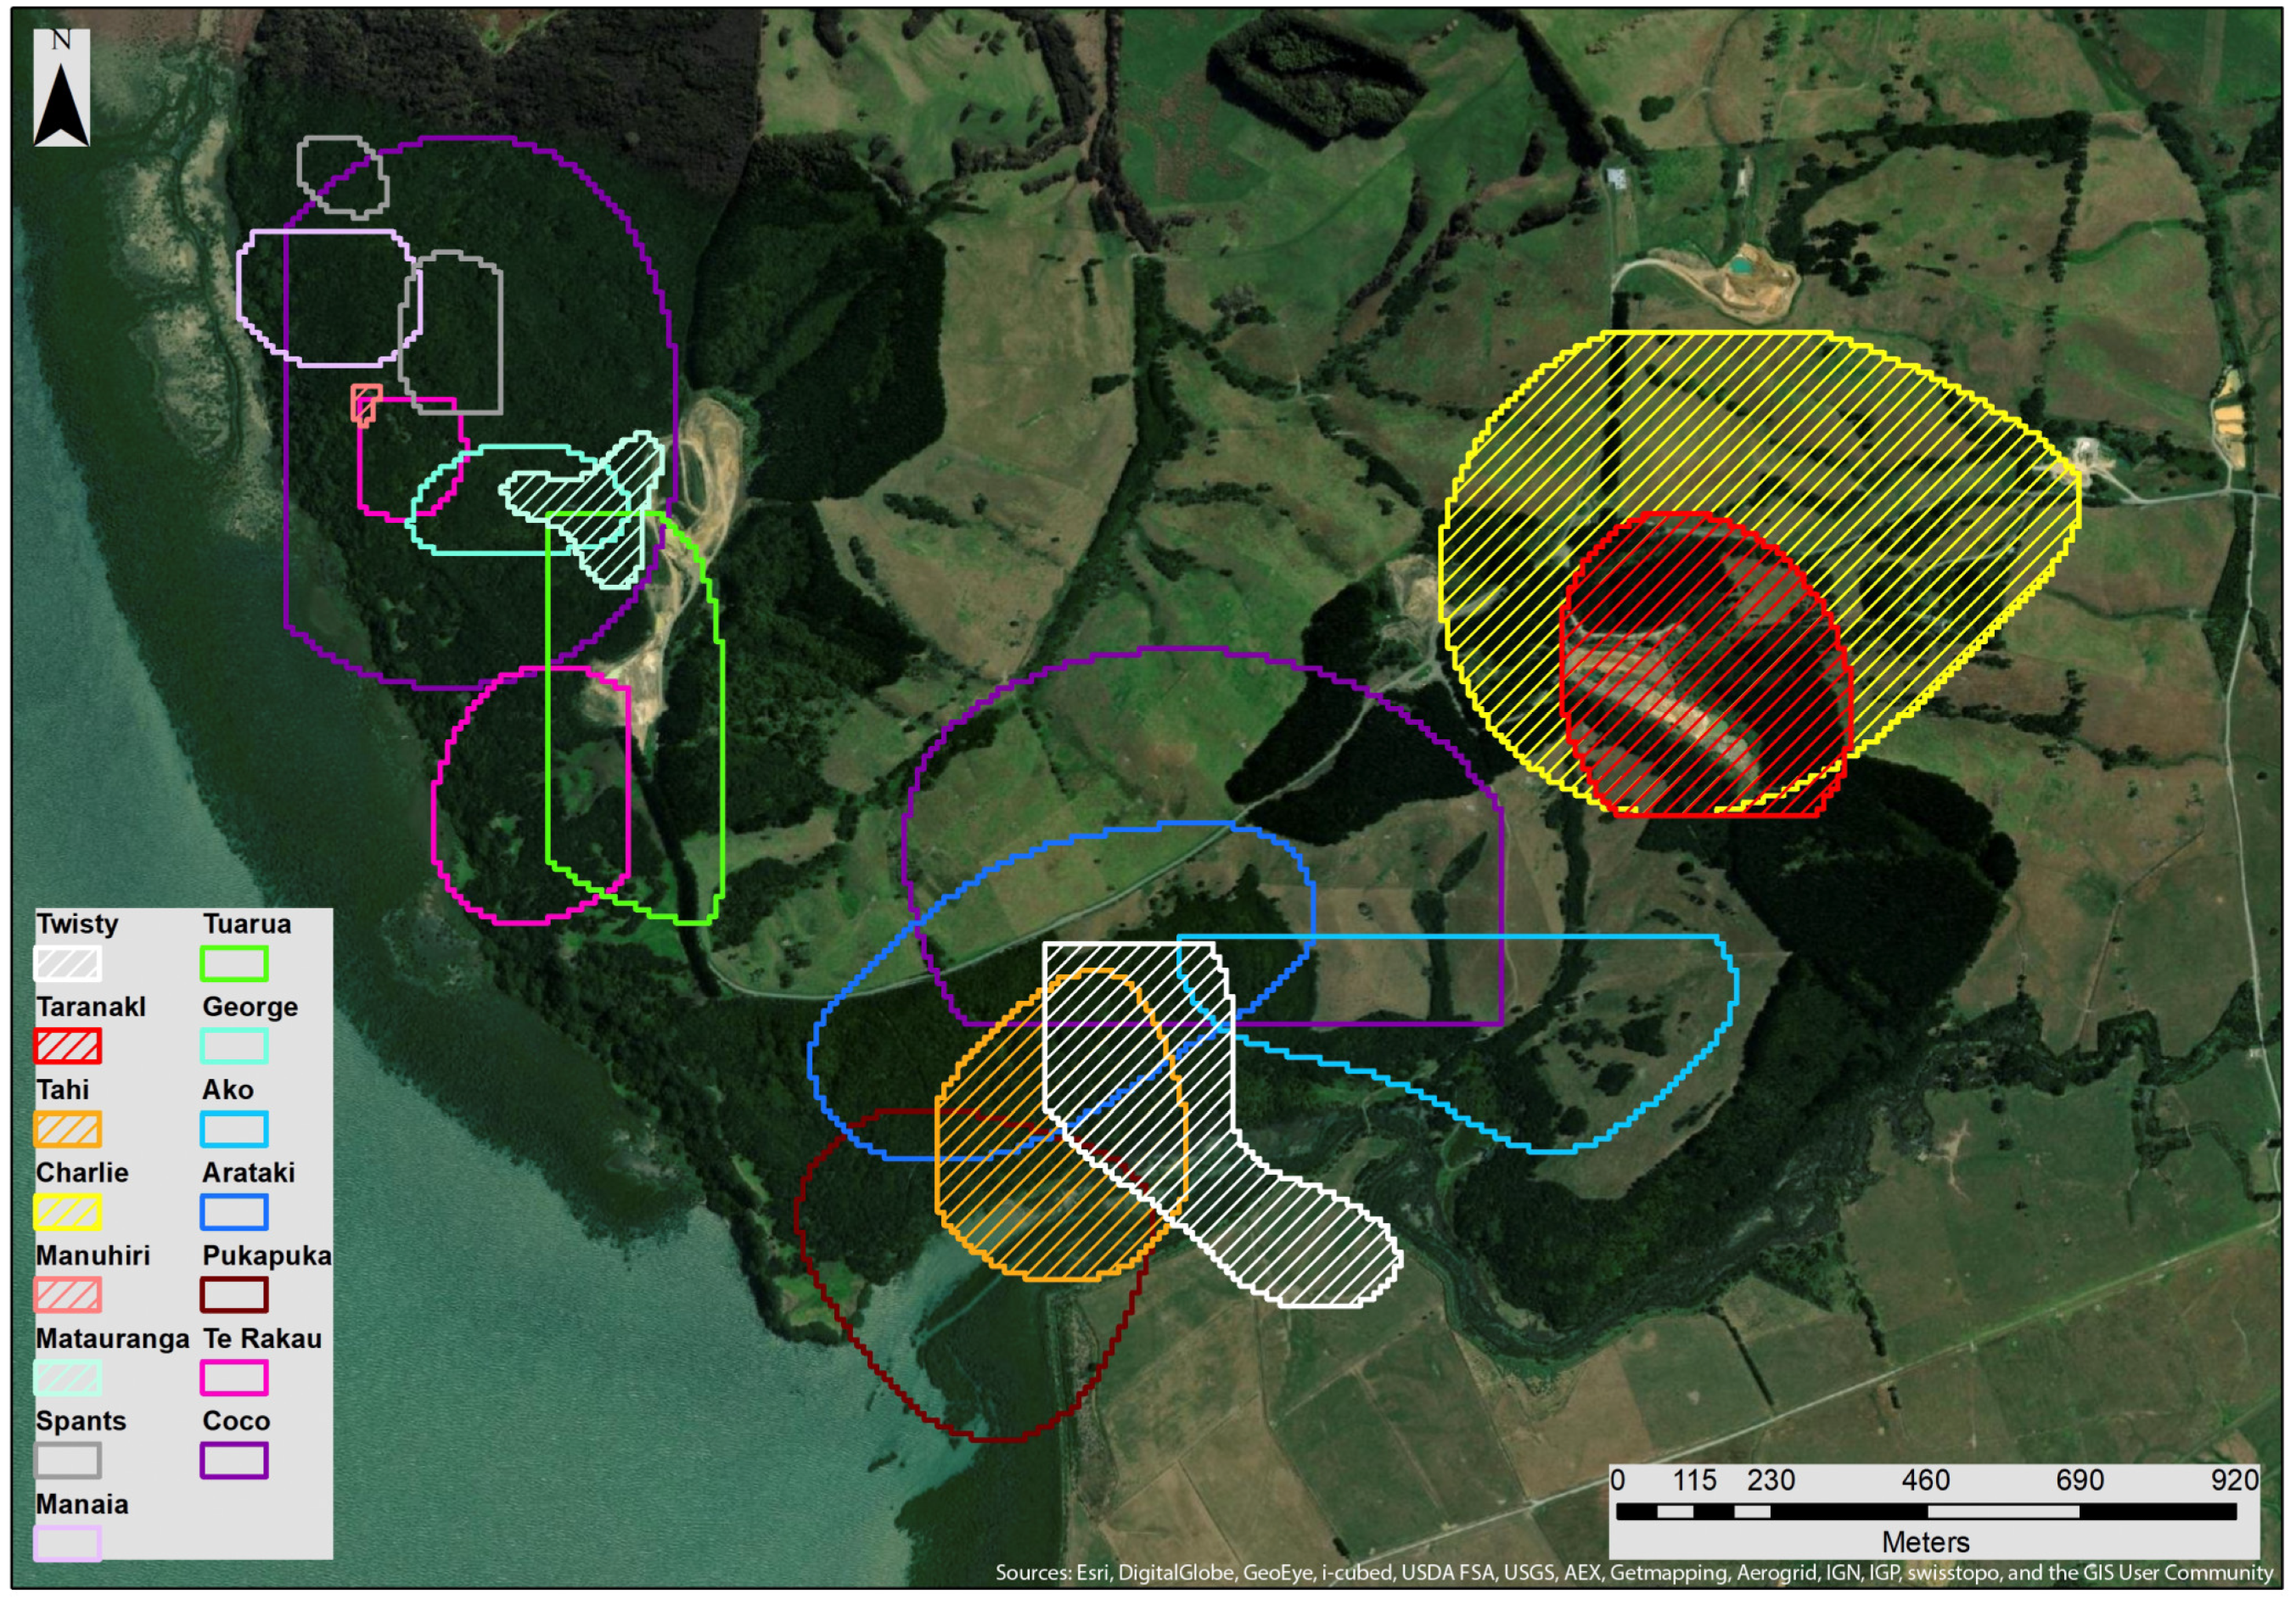
3.2. MCP & Core KDE50 Roost Area

The MCP roost area for individual kiwi in this study ranged from 0.2–76.4 Ha (Table 1, Figure 2). There was no significant difference (p = 0.39) between the mean roost MCPs of birds released in 2014 (mean = 21.3, SE = 7.92, n = 9) and 2013 (mean = 22.9, SE = 10.84, n = 6) (Table 1, Figure 2) or between the KDE50 percentile areas for the 2014 birds (mean = 20.7 ha SE = 8.29) and 2013 birds (mean = 16.3 ha, SE = 7.44) (p = 0.26) (Table 1, Figure 3). Three birds from the 2014 cohort showed a split distribution each with two higher location density core roost areas (Figure 3).
In 2013, birds were released in a tight group, all within 550 m of each other in the southern most regenerating bush patch on the property. Determinations of roost areas utilization in 2013 indicated that two birds remained centered on their release site, two birds moved to the northeast and two birds to the northwest (Figure 2 and Figure 3). The two birds that moved to the northwest had small roost site utilization areas with little movement of roost sites over the duration of monitoring. The small size of one (0.2 Ha) (Table 1) is within location error and may represent the use of a single roost site. Birds dispersed up to 2 km from their release site. A number of birds showed overlapping in the areas within which individuals selected roost sites (Figure 2 and Figure 3).
Birds released in 2014 were similarly released into regenerating bush areas over a total distance of 2.1 km. Maximum dispersal distances by individual birds were similar to that determined for the 2013 release cohort with MCPs and KDE50s being associated with the large bush patch into which they were released (Figure 2 and Figure 3). Overlap in roost utilization areas occurred with individuals both within and across the two release cohorts (2013 and 2014). Most roosting sites were in regenerating bush areas, but some occurred in adjacent paddocks sites.

4. Discussion

4.1. Roost Area

There is a paucity of information in the literature regarding day-time roost areas of NIBK, particularly with translocated birds. This study shows that the area over which roost sites were distributed, measured by MCP and KDE50, was highly variable in kiwi translocated in both 2013 and 2014, with no significant difference between the mean roost area size for newly translocated 2014 birds determined on the basis of MCP (2014: 21.3 ha, SE = 7.92 vs. 2013: 22.85 ha, SE = 10.83) or KDE50 (2014: 20.7 ha, SE = 8.29 vs. 2013: 16.3 ha, SE = 7.44) (Table 1, Figure 1). Notwithstanding the recapture and release of one kiwi back into the managed area of the property in 2014, our data indicate recently released birds were no more mobile than birds that had been released in the previous year. The similarity in roost area may be indicative of acoustic anchoring from the presence of the previously established 2013 birds [16,20]. This outcome is encouraging as the success of many translocations is compromised by the distant dispersal of animals to areas where animals may have a high mortality due to predation or movement in unsuitable habitat. Most birds from both years utilize different roost sites each night, although the very small range of one bird in 2013 suggests the use of the same roost site across the tracking period. The limited movement in roost sites shown by some birds drives the high variability in this metric.
Comparison of our data with other studies is problematic as our estimates are based on a small number of location fixes of non-breeding, roosting birds. Monitoring over longer periods would likely give larger home ranges. Post-translocation movement and range coverage of roroa (great spotted kiwi, Apteryx maxima) took some six months to stabilize [31] with small incremental increases in range occurring for up to two years after translocations. Notwithstanding, our estimates are of the same order as McLennan et al. [14], who estimated the average home range of NIBK in two sites in Hawke’s Bay, monitored for 12–27 weeks using the MCP method to be 39.5 ha (range 14.1 ha–134.4 ha). This included both daytime and night-time sampling. In contrast, Ziesemann [13] reported small nocturnal home range areas for non-breeding season kiwi on Ponui Island of 3.03 ha (SD 1.41) for males and 3.14 ha (SD 0.17) for females using the MCP method. These small ranges likely reflect a high population density of the birds (1 bird/ha). Densities of kiwi in our study and that of McLennan et al. [14] were substantially lower at 0.1 and 0.02 birds/ha, respectively.
The literature [13,14] suggests that day-time roost or day/night-time ranges may be influenced by habitat area and bird density. Restricted range may potentially have been an issue in this study in relation to the proximity of the Kaipara Harbour water boundary (Figure 2 and Figure 3), however, Jamieson et al [5] reported that free-roaming birds used swamp areas to a limited extent. It is suggested that the property perimeter fence had little if any impact on roost range, as there was substantial distance between the edge of the ranges and the property boundary. In relation to bird densities, the roost range areas in this study are greater than that found on the confined high density Ponui Island [13], but less than the low density, day/night range of the Hawke’s Bay study [14]. This intermediate day-time roost area was expected, due to the lower density of birds at the Mataia property and the large ranges of the birds in the Hawke’s Bay study, due to the measurement of both day and night ranges.

4.2. Overlap, Roost Locations and Characteristics

There was substantial overlap in areas of the roost site distribution, determined by MCP or KDE50, particularly within release year cohorts (Figure 2 and Figure 3). Considerable overlap of home range and sharing of burrows by kiwi has been reported for related birds at the densely populated Ponui Island [14]. As the population density at the Mataia site was low, less overlap in roost ranges within years was expected. However, an overlap of roost ranges has been demonstrated by Jamieson et al. [5] and may reflect the proximity of suitable habitat at the Matai site. The overlapping roost areas for Taranaki (female) and Charlie (male) was expected as these birds had pair bonded.
It is likely that low population density, the availability of suitable habitat and the influence of acoustic anchoring may also explain overlap between years. Of the 15 birds released in both 2013 and 2014, 75% remained around the location of their release site. Notable exceptions were two birds (Taranaki, Female No. 2 and Charlie, Male No. 10) from the 2013 translocation (Figure 1) that had overlapping roosting areas to the north east of their release location (Figure 2, lower image) and were known to be a breeding pair, and the kiwi (Coco, Male No. 21) that was retrieved after dispersing out of the predator managed area from its initial release location and re-released.
The impact of the presence of the 2013 cohort birds on the 2014 released birds and vice versa is not known. Mander [32] found that newly translocated great spotted kiwi (Apteryx maxima ) appeared to have little if any effect on established captive reared birds who maintained their territories. However, sub-adult male kiwis may disperse toward another territorial kiwi after translocation [33]. Established 2013 birds may also act as an anchor for the new sub-adult birds, even within translocation events. Anecdotal evidence suggests that this might be the case at Mataia where birds released in 2013 ranged more widely than the others before settling closer to other birds also released in 2013 [34].
Toy and Toy [10] highlighted the importance of the post-translocation monitoring of translocated great spotted kiwi (Apteryx maxima) to the Flora Stream area in the Kahurangi National Park, New Zealand. As with our 2014 translocation, this monitoring allowed them to retrieve individuals that had dispersed outside the pest-control protected areas. These distant dispersals increase the risk of mortality or, in the case of our study, injury due to the proximity of a major highway.
Roost locations of the 2014 cohort birds were largely within forest habitats (Figure 2, lower image), while the 2013 cohort birds selected roosts in both forest and pasture (Figure 2, upper image). Home range in adult brown kiwi has been linked to habitat suitability for food supply [14] with birds showing a preference for podocarp/broad-leafed forest [4,5]. Dixon [4] determined that Coleoptera were the most common invertebrate species found in faecal samples of brown kiwi (Apteryx mantelli) on Ponui Island and were selected in excess of availability. The author also determined that the Coleoptera species were more common in forest and swamp habitats compared with scrub and pasture habitat. This, together with the selection of preferred roost locations in dead/live or ground burrows, supports the use of native forest as preferred habitat for brown kiwi. Dixon [4] also stated that the use of pasture habitats in summer months was related to the availability of black field crickets (Formicidae), which may explain the extensive use of pasture habitat by some kiwi in the current study. Shorter billed juvenile birds may utilize other habitats such as seral vegetation [35] or scrub and pasture [4,5] reflecting differences in food availability associated with different bill lengths [35,36].
Habitat selection has also been linked with availability of preferred burrow sites, which, according to Jamieson et al [5], are typically those associated with the base of living or dead trees or ground burrows in forest habitats. These authors reported that the preference was for long burrows with smaller entrance holes, which was likely to provide protection from the elements and the creation of a warm microclimate at the end of the burrows.
Although not significant, there was a substantial difference in the MCP roost area for 2013 and 2014 when birds released in the vicinity of LTG and PTG (mean 4.43 ha, SE = 1.23) (north western part of the study area), compared with those released in the vicinity of BG and B (mean 37.19 ha, SE = 8.43) (southern sector of the study area). Powell and Mitchell [37] suggested that kiwi cognitively retain a spatial plan of current resources in their home range, and this may reflect increased suitability of the southern part of the study area.
In summary, our study shows that, despite considerable variation, the size of the roost area of newly translocated North Island brown kiwi in 2014 did not differ from that of established birds translocated in 2013 in the Mataia Restoration. The majority of the newly released birds remained in the vicinity of their release site within the first three weeks post-translocation. This may have been related to the suitability of the habitat and the anchoring effect of established kiwi in the vicinity of the release sites. This awaits testing.

Author Contributions

Conceptualization, D.L.F., J.M.A. and N.J.A.; data curation, G.D.A.; formal analysis, J.M.A. and G.D.A.; investigation, D.L.F. and J.M.A.; methodology, D.L.F., J.M.A. and N.J.A.; project administration, D.L.F. and J.M.A.; supervision, D.L.F., N.J.A. and G.D.A.; visualization, J.M.A. and G.D.A.; writing—original draft, D.L.F.; writing—review and editing, J.M.A., N.J.A. and G.D.A. All authors have read and agreed to the published version of the manuscript.

Funding

This research received no external funding.

Institutional Review Board Statement

Translocations and post release monitoring were conducted under the Department of Conservation (DOC) National Permit Number 36451-FAU. This was monitored under DOC permit.

Informed Consent Statement

Not applicable.

Data Availability Statement

The raw data is available on request.

Acknowledgments

Grateful thanks to Gill and Kevin Adshead for the use of their property for the study and their enthusiasm, support and contribution to kiwi conservation in New Zealand.

Conflicts of Interest

The authors declare no conflict of interest.

References

  1. IUCN The IUCN Red List of Threatened Species. Version 2022-2. 2022. Available online: https://www.iucnredlist.org/search?query=north%20island%20brown%20kiwi&searchType=species (accessed on 12 December 2022).
  2. Miller, P.J.; Pierce, R.J. Distribution and decline of the North Island brown kiwi (Apteryx australis mantelli) in Northland. Notornis 1995, 42, 203–211. [Google Scholar]
  3. New Zealand Birds Online. North Island Brown Kiwi, Kiwi-Nui. 2013. Available online: https://www.nzbirdsonline.org.nz/species/north-island-brown-kiwi (accessed on 12 December 2022).
  4. Dixon, T. What They Do in the Shadows: Habitat Utilisation and Diet of Brown Kiwi (Apteryx mantelli) Adults within High-Density Island Populations. Master’s Thesis, Massey University, Palmerston North, New Zealand, 2015. [Google Scholar]
  5. Jamieson, S.E.; Castro, I.; Jensen, T.; Morrison, K.W.; Durrant, B. Roosting Preferences of North Island Brown Kiwis (Apteryx mantelli). Wilson J. Ornithol. 2016, 128, 857–866. [Google Scholar] [CrossRef]
  6. Germano, J.; Barlow, S.; Castro, I.; Colbourne, R.; Cox, M.; Gillies, C.; Hackwell, K.; Harawira, J.; Impey, M.; Reuben, A.; et al. Kiwi Recovery Plan 2018–2028; Threatened Species Recovery Plan 64; Terrestrial Ecosystems Unit, Department of Conservation: Wellington, New Zealand, 2018. Available online: https://www.doc.govt.nz/globalassets/documents/science-and-technical/tsrp64entire.pdf (accessed on 24 August 2021).
  7. Miskelly, C.; Powelesland, R. Conservation translocations of New Zealand birds, 1863–2012. Notornis 2013, 60, 3–28. [Google Scholar]
  8. Parker, K.A.; Ewen, J.G.; Seddon, P.J.; Armstrong, D.P. Post-release monitoring of bird translocations: Why is it important and how do we do it? Notornis 2013, 60, 85–92. [Google Scholar]
  9. Innes, J.; Fitzgerald, N.; Binny, R.; Byrom, A.; Pech, R.; Watts, C.; Gillies, C.; Maitland, M.; Campbell-Hunt, C.; Burns, B. New Zealand ecosanctuaries: Types, attributes and outcomes. J. R. Soc. N. Z. 2019, 49, 370–393. [Google Scholar] [CrossRef]
  10. Toy, R.; Toy, S. Post-translocation dispersal and home range establishment of roroa (great spotted kiwi, Apteryx haastii): Need for long-term monitoring and a flexible management strategy. Notornis 2020, 67, 511–525. [Google Scholar]
  11. Richardson, K.M.; Doerr, V.; Ebrahimi, M.; Lovegrove, T.G.; Parker, K.A. Considering dispersal in reintroduction and restoration planning. In Advances in Reintroduction Biology of Australian and New Zealand Fauna; Armstrong, D.P., Hayward, M.W., Moro, D., Seddon, P.J., Eds.; CSIRO Publications Clayton South: Melbourne, Australia, 2015; pp. 59–72. [Google Scholar]
  12. Zang, J.; Pannell, J.L.; Case, B.S.; Hinchliffe, G.; Stanley, M.C.; Buckley, H.L. Interactions between landscape structure and bird morbidity traits affect the connectivity of agroecosystems networks. Ecol. Indic. 2021, 129, 107962. [Google Scholar] [CrossRef]
  13. Ziesemann, B. The Social Organisation and Mating System of Brown Kiwi (Aptyrex mantelli). Ph.D. Thesis, Massey University, Auckland, New Zealand, 2011. [Google Scholar]
  14. McLennan, J.A.; Rudge, M.R.; Potter, M.A. Range size and denning behaviour of brown kiwi, Apteryx australis mantelli, in Hawke’s Bay, New Zealand. N. Z. J. Ecol. 1987, 10, 97–107. [Google Scholar]
  15. Jahn, P.; Cagua, E.F.; Molles, L.E.; Ross, J.G.; German, J.M. Kiwi translocation review: Are we releasing enough birds and to the right places? N. Z. J. Ecol. 2022, 46, 3454. [Google Scholar] [CrossRef]
  16. Bradley, D.W.; Ninnes, C.E.; Valderrama, S.V.; Waas, J.R. And Does ‘acoustic anchoring’ reduce post-translocation dispersal of North Island robins? Wildl. Res. 2011, 38, 69–76. [Google Scholar] [CrossRef]
  17. Clarke, M.F.; Schedvin, N. An experimental study of the translocation of noisy miners Manorina melanocephala and difficulties associated with dispersal. Biol. Conserv. 1997, 80, 161–167. [Google Scholar] [CrossRef]
  18. Kemink, K.M.; Kesler, D.C. Using movement ecology to inform translocation efforts: A case study with an endangered lekking bird species. Anim. Conserv. 2013, 16, 449–457. [Google Scholar] [CrossRef]
  19. Taborsky, B.; Taborsky, M. Habitat use and selectivity by the brown kiwi (Apteryx australis mantelli) in a patchy environment. The Auk 1995, 112, 680–689. [Google Scholar]
  20. Molles, L.E.; Calcott, A.; Peters, D.; Delmamare, G.; Hudson, J.; Innes, J.; Flux, I.; Waas, J. “Acoustic anchoring” and the successful translocation of North Island kokako (Callaeas cinerea wilsoni) to a New Zealand mainland management site within continuous forest. Notornis 2008, 55, 57–68. [Google Scholar]
  21. ESRI. Distance and Direction | ArcGIS Solutions. 2020. Available online: https://solutions.arcgis.com/defense/help/distance-direction/ (accessed on 29 May 2020).
  22. Hayne, D.W. Calculation of Size of Home Range. J. Mammal. 1949, 30, 1–18. [Google Scholar] [CrossRef]
  23. Adam, A.M.A.; Kropil, R.; Pichler, V. Differences in Evaluation of Three Different Approaches in Home Range Sizes of Red Deer Cervus Elaphus in Western Carpathians / Rozdiely vo Vyhodnotení Veľkosti Domovských Okrskov Jeleňa Lesného Cervus Elaphus v Západných Karpatoch Tromi Rôznymi Prístupmi. For. J. 2015, 61, 12–18. [Google Scholar] [CrossRef]
  24. Worton, B.J. Kernel methods for estimating the utilisation distribution in home-range studies. Ecology 1989, 70, 164–168. [Google Scholar] [CrossRef]
  25. Fleming, C.H.; Calabrese, J.M. A new kernel density estimator for accurate home-range and species-range area estimation. Methods Ecol. Evol. 2016, 8, 571–579. [Google Scholar] [CrossRef]
  26. Samuel, M.D.; Pierce, D.J.; Garton, E.O. Identifying Areas of Concentrated Use within the Home Range. J. Anim. Ecol. 1985, 54, 711. [Google Scholar] [CrossRef]
  27. Horikoshi, C.; Battley, P.F.; Seaton, R.; Minot, E.O. Winter Habitat Use of New Zealand Falcons (Falco Novaeseelandiae Ferox) in an Intensively Managed Pine Plantation, Central North Island, New Zealand. N. Z. J. Ecol. 2017, 41, 193–206. [Google Scholar]
  28. Kitts-Morgan, S.E.; Caires, K.C.; Bohannon, L.A.; Parsons, E.I.; Hilburn, K.A. Free-ranging farm cats: Home range size and predation on a livestock unit in Northwest Georgia. PLoS ONE 2015, 10, e0120513. [Google Scholar] [CrossRef] [PubMed]
  29. Knüsel, M.A.; Lee, D.; König, B.; Bond, M.L. Correlates of home range sizes of giraffes, Giraffa camelopardalis. Anim. Behav. 2019, 149, 143–151. [Google Scholar] [CrossRef] [Green Version]
  30. Reading, R.P.; Bradley, J.; Hancock, P.; Garbett, R.; Selebatso, M.; Maude, G. Home-range size and movement patterns of Hooded Vultures Necrosyrtes monachus in southern Africa. Ostrich 2018, 90, 73–77. [Google Scholar] [CrossRef]
  31. Jahn, P.; Ross, J.G.; Mander, V.; Molles, L.E. Post-translocation movements and ranging behaviour of roroa (great spotted kiwi, Apteryx maxima). Notornis 2022, 69, 135–146. [Google Scholar]
  32. Mander, V. How translocation affects the activity, home range and pair-bonds of great spotted kiwi (Apteryx haastii). MSc Thesis, Lincoln University, Lincoln, New Zealand, 2016. [Google Scholar]
  33. Scrimgeour, J. Establishing a Kiwi Population at Otanewainuku. Available online: https://kiwitrust.org/wp-content/uploads/2019/03/OKT_DOC-Report.pdf (accessed on 20 July 2021).
  34. Adshead, G.; (Mataia Restoration Project, Kaipara, New Zealand); Adshead, K.; (Mataia Restoration Project, Kaipara, New Zealand). Personal communication, 2020.
  35. Gibbs, S.J.; Clout, M.N. Behavioural Vulnerability of Juvenile Brown Kiwi: Habitat Use with Predators; Department of Conservation Science Internal Series 102; Department of Conservation: Wellington, New Zealand, 2003. Available online: https://www.doc.govt.nz/globalassets/documents/science-and-technical/dsis102.pdf (accessed on 20 July 2021).
  36. Cunningham, S.J.; Castro, I. The secret life of wild brown kiwi: Studying behaviour of a cryptic species by direct observation. N. Z. J. Ecol. 2011, 35, 209–219. [Google Scholar]
  37. Powell, R.A.; Mitchell, M.S. What is a home range? J. Mammal. 2012, 93, 948–958. [Google Scholar] [CrossRef]
Figure 1. Location of Mataia Restoration Project in relation to the Kaipara Harbour, North Island, New Zealand (inset map), sites where birds were released in 2013 (red squares) and 2014 (red triangles) (B Bach, BG Big Gully, BW Boardwalk, EQEII Eastern QEII Block, LTG Lemon Tree Gully, PTG Peach Tree Gully, SQEII Southern QEII block with individual birds at each site (lower bottom) and 16 telemetry sites used in 2014 (upper left, stars)(‘Hall’ site was not used).
Diversity 15 00190 g001
Figure 2. Roost areas for each bird determined using the Minimal Convex Polygon in hectares (MCP ha) for kiwi translocated in 2013 (upper figure) and 2014 (lower figure with 2013 birds in hatched polygons).
Diversity 15 00190 g002
Figure 3. KDE 50-percentile contour of birds released in 2013 (hatched) and 2014 (open).
Diversity 15 00190 g003
Table 1. Identification, sex, release site, number of locations used for estimating 100% MCP and KDE50 and roost area utilized (ha) by kiwi released in 2013 (n = 6) and 2014 (n = 9) as measured by Minimum Convex Polygons (MCP)(ha) and KDE50 (ha) using GIS ArcMET 10.2.2 v3 software for the 12 monitoring days between 13 April and 5 May 2014.
Release
Date
Bird NoNameSexRelease Site 1No of LocationsMCP Area (Ha)KDE50
Percentile
Area (Ha)
20131TwistyMaleBW718.814.3
2TaranakiFemaleBW627.116.3
4TahiMaleBW516.113.3
9ManuhiriMaleSQEII40.20.2
10CharlieMaleSQEII772.851.0
12MātaurangaMaleBG32.12.7
201414SmartypantsFemaleLTG53.34.5
15ManaiaMaleLTG42.94.8
17TuaruaMalePTG37.914.4
19GeorgeMaleLTG65.54.3
20AkoMaleB622.818.4
21CocoMaleB676.484.2
22AratakiMaleBG835.224.6
23PukapukaMaleBG828.219.2
25Te rākauMaleLTG69.311.8
1 Release locations of all birds; B Bach, BG Big Gully, BW Boardwalk, EQEII Eastern QEII Block, LTG Lemon Tree Gully, PTG Peach Tree Gully, SQEII Southern QEII block.
Disclaimer/Publisher’s Note: The statements, opinions and data contained in all publications are solely those of the individual author(s) and contributor(s) and not of MDPI and/or the editor(s). MDPI and/or the editor(s) disclaim responsibility for any injury to people or property resulting from any ideas, methods, instructions or products referred to in the content.

