Article

Effects of Land Use and Physicochemical Factors on Phytoplankton Community Structure: The Case of Two Fluvial Lakes in the Lower Reach of the Yangtze River, China

1
School of Resources and Environmental Engineering, Anhui University, Hefei 230601, China
2
Anhui Province Key Laboratory of Wetland Ecosystem Protection and Restoration, Anhui University, Hefei 230601, China
*
Author to whom correspondence should be addressed.
Diversity 2023, 15(2), 180; https://doi.org/10.3390/d15020180
Submission received: 12 December 2022 / Revised: 23 January 2023 / Accepted: 24 January 2023 / Published: 27 January 2023

Abstract

:
Potential changes in phytoplankton community structure in shallow lakes due to land use could pose a serious threat to ecosystem sustainability and functioning. Nevertheless, this effect has not been analyzed in detail. In this study, we chose two adjacent lakes, the main land use types around them are farmland and forest, respectively. We investigated the spatial differences in the phytoplankton community structure, water quality physicochemical parameters, and land use patterns in the two lakes. The results indicated that the annual average cell density and biomass of phytoplankton in the former were 1.84 times and 2.38 times that of the latter, respectively. The results of Pearson correlation and Redundancy analysis showed that total nitrogen (TN), total phosphorus (TP), water depth (WD), and water temperature (WT) were the main environmental factors influencing the structural changes of phytoplankton communities in the two lakes. The results indicated that different land use patterns, such as farmland and towns around the lake, increase the nitrogen (N) and phosphorus (P) content of the lake, while the forests distributed around the lake can reduce the N and P entering the lake, which is probably the main reason for the spatial difference in the characteristics of phytoplankton communities in the two lakes. Our results highlight that land use significantly affects the community structure of phytoplankton by influencing physicochemical factors in water bodies. Our study can provide guidance for pollution control and water quality management of shallow lakes.

1. Introduction

As one of the most important primary producers in the aquatic ecosystems, phytoplankton is essential in the material and energy flow in the ecosystems [1]. Besides, due to its sensitivity and dynamic response to the surrounding environment, phytoplankton acts as a vital biome indicating changes in water quality [2]. However, the overgrowth of phytoplankton can lead to the degradation of biodiversity and lake ecosystems [3]. Furthermore, changes in phytoplankton community structure probably subsequently influence the community structure of zooplankton and fish through upward effects, which in turn affects the aquatic ecosystem functioning and stability [4]. Therefore, understanding the impact of environmental factors on phytoplankton communities plays a vital role in measuring the influence of anthropogenic activities on aquatic ecosystems [5].
Previous studies have shown that the abundance of phytoplankton is influenced by a variety of factors, such as, land use in catchment areas [6], physicochemical factors of water bodies [7], the availability of resources [8], hydrological characteristics [9] and grazing pressure [10]. Phytoplankton communities can reflect the trophic conditions of water bodies [11]. Phosphorus is considered to be the essential influencing factor in the growth process of phytoplankton, and this study indicated that phytoplankton biomass and phosphorus content show a positive correlation [12]. Jiang et al. found that the main reason for the large-scale cyanobacteria outbreak in Chaohu Lake and surrounding rivers was that the biological sewage discharged contained a large amount of phosphorus [13]. In dozens of temperate lakes, high TP concentrations enhanced the competitive advantage of cyanophyta and Chlorophyta and inhibited the growth of Cryptophyta and Chrysophyta [14].
It has been demonstrated that, the characteristics of the watershed of a lake, and activities occurring there play important role in determining water quality, and thereby organism productivity [15]. Usually, catchments with large proportions of land covered by vegetation play an important role in maintaining high water quality, by intercepting various environmental pollutants. This buffer effect is achieved through mechanisms such as plant nutrient uptake, reduced surface runoff, and reduced soil erosion, et al. [16,17]. However, due to the population explosion and rapid economic growth since Industrial Revolution, a large amount of land has been reclaimed globally, mainly for agriculture and urbanization. This intensified human land use has been bringing various pollutants to water bodies, especially elements nitrogen and phosphorus, via surface runoff, erosion, and/or leaching [16], and eventually, lead to severe degradation of freshwater ecosystems globally. Therefore, it is essential to consider different land use patterns when studying freshwater ecosystems’ eutrophication and degradation [18]. However, to our knowledge, most studies to date focused on the direct relationships between water eutrophication and plankton community, while the influence of different catchment characteristics has rarely been studied. Therefore, in the present research, we mainly focus on the influence of different land-use regimes on the plankton community, via influencing lake eutrophication.
In order to explore the effects of land use and water physicochemical factors on phytoplankton community structure, we selected two lakes in the lower reaches of the Yangtze River. We hypothesized that land use significantly affects the community structure of phytoplankton by influencing physicochemical factors in water bodies. The aims of this study were: (1) to study the differences in the phytoplankton community structure characteristics in Lake Chenyao and Lake Fengsha; (2) to assess the direct and indirect effects of land use patterns and environmental factors such as water physicochemical factors on the phytoplankton community structure of the two lakes. This analysis and evaluation provide both data support for understanding the influence of land use patterns on phytoplankton community structure and for the scientific management of river-connected Lakes.

2. Materials and Methods
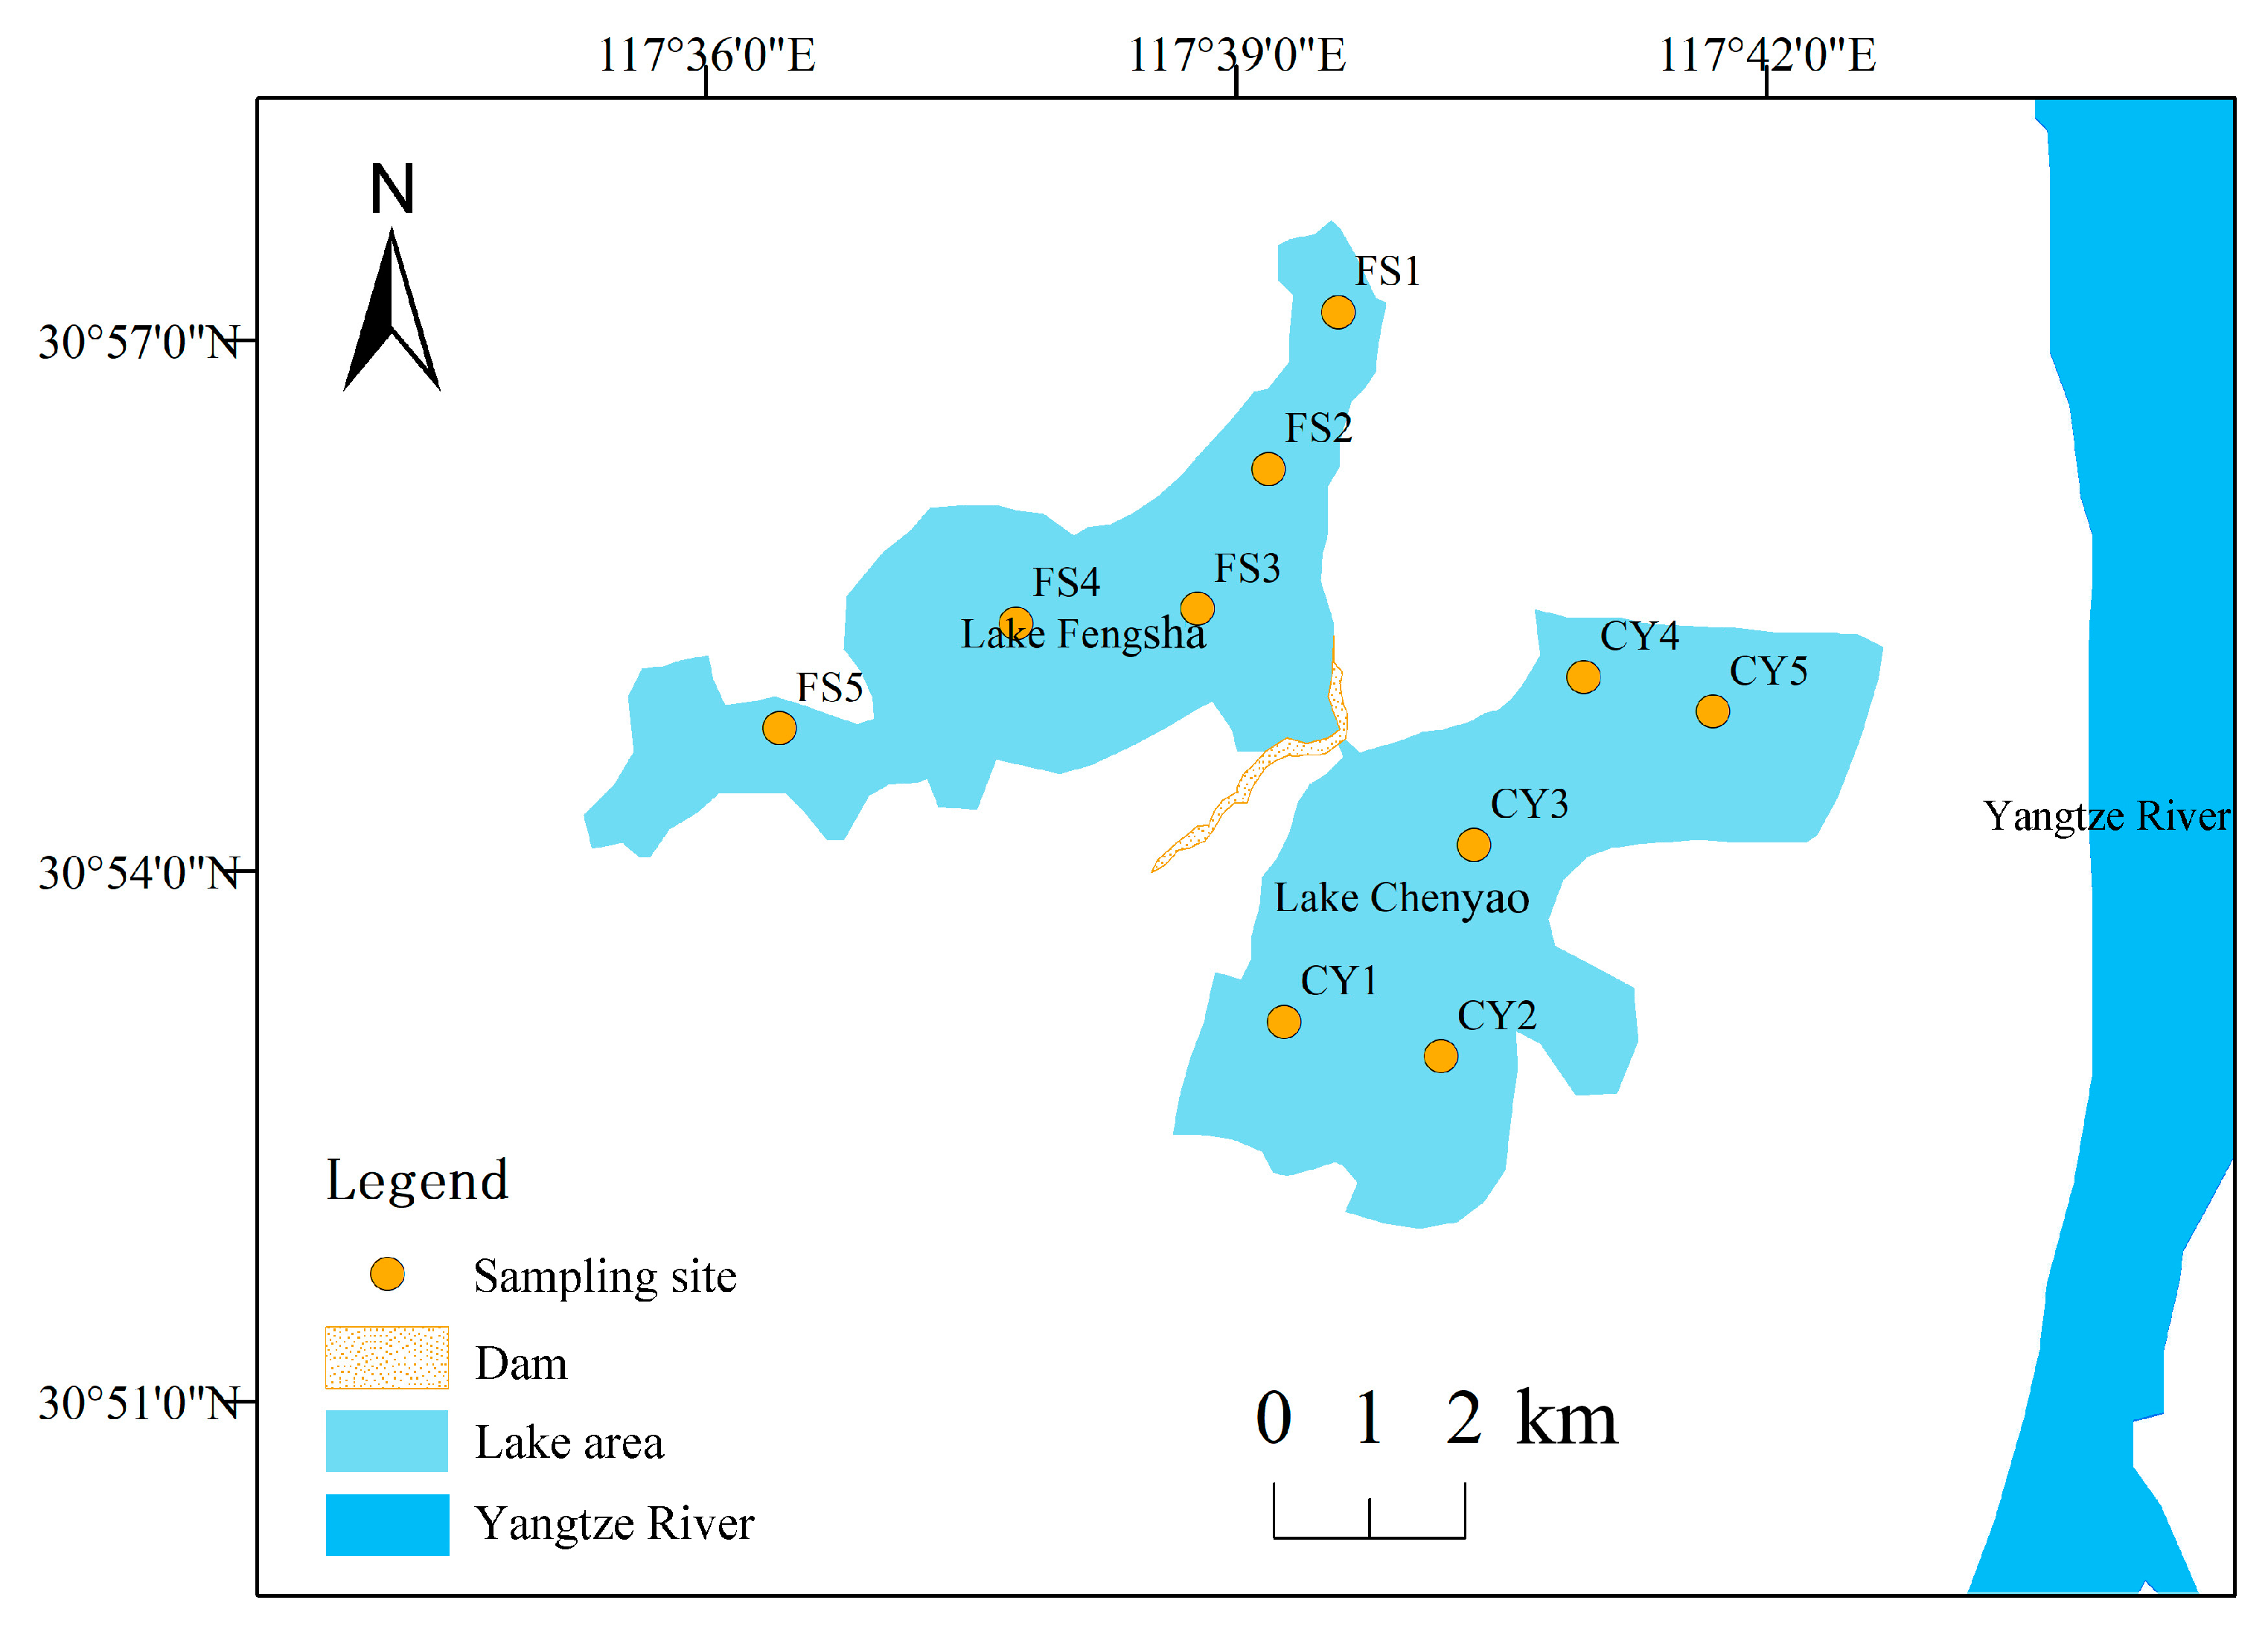
2.1. Study Area

Lake Chenyao and Lake Fengsha are located in the suburbs of Tongling City in southwest Anhui Province. The two lakes are typical shallow lakes in the lower reaches of the Yangtze River [19], and were once a complete lake connected by a waterway. The area of the lake has been drastically reduced due to extensive reclamation around the lake in the last century. As well, the two lakes have been separated by a dam, thus forming two separate lakes, from which there has been a spatial difference between the two lakes. In recent years, due to the increase of farmland and construction, the water quality of Lake Chenyao has gradually deteriorated. Before 2019, the aquatic vegetation in the waters of Lake Chenyao with the dominant species of Euryale ferox and Nelumbo nucifera grew too densely and the coverage was as high as 95% [20]. After the flood in 2020, the macrophytes basically disappeared, and the decaying aquatic vegetation provided Lake Chenyao with rich organic matter and nutrient salts. The forest vegetation around Lake Fengsha is rich, mainly using the water from the mountain as a water source. While the lake has not grown a large area of aquatic vegetation in the past 10 years, compared with Lake Chenyao, its organic matter and nutrient salt are less.

2.2. Sample Collection and Processing

According to the topographic and geomorphological features of Lake Chenyao and Lake Fengsha and combined with local hydrological characteristics, five sampling points were set up in each of the two lakes to collect water samples (Figure 1), We collected water samples from 0.5 m below the surface of the water. The sampling time was in March, April, June, August, November, and December 2021, and six samples were taken, all at the end of each month.
We used the Hach HQ40d portable multimeter to measure the water quality at each sampling point, including water temperature (WT), dissolved oxygen (DO), electrical conductivity (EC), and pH. The Hach 2100Q portable turbidimeter was used to measure turbidity (Turb), and the Secchi disk was used to measure water transparency (SD) and water depth (WD). For the analysis of other parameters, we collected 2 L water samples. The concentration of nutrients and Chl a was determined in the laboratory. TN, TP, ammonia nitrogen (NH4+-N), nitrate nitrogen (NO3-N) and Chl a were analyzed according to the description of SEPB (2002) [21].
We collected 1 L of water sample for phytoplankton quantitative analysis and added 10 mL of 1% lugol iodine solution to fix. After the samples precipitated for 48 h, we used a siphon to remove the supernatant until it was concentrated to 30 mL for phytoplankton identification [22]. After mixing, 0.1 mL of samples was examined in a counting chamber under a light microscope (Olympus, BX53) at ×400 magnification. We randomly selected 100 visual fields to identify phytoplankton species and count phytoplankton cells [23,24]. The biomass of phytoplankton was calculated by multiplying the number of cells and the weight of cells. We used cells/L and mg/L to express phytoplankton abundance and biomass.

2.3. Data Analysis

We used the species dominance (Y), Shannon-Wiener index (H′) [25], Pielou index (J′) [26], and Margalef index (d) [27] to characterize phytoplankton community structure. The calculation formula is as follows:
H = i = 1 s ( n i / N ) × log 2 ( n i / N )
J = H / ln S
d = ( S 1 ) / ln N
The formula for calculating the dominance of phytoplankton is:
Y = n i / N × f i
where ni is the number of individuals of species i, N is the total number of individuals of all species, S is the total number of phytoplankton species, ni/N represents the relative proportion of species i, and fi is the frequency of occurrence of individuals of the i species; Y ≥ 0.02 is the dominant species.
We employed ENVI software (Version 5.3) to crop the remote-sensing images of the study area, we selected a buffer zone of 1000 m around the two lakes for supervised classification of land use types. The ArcGIS software (Version 10.2, ESRI) was used to rasterize the cropped and super-vised classified images, and the proportion of the classified area was calculated, and the distribution of land use types around the two lakes was obtained. We applied one-way ANOVA to test the significant differences between the environment and the phytoplankton communities at different sampling times. We used the data of phytoplankton density and biomass in 2021 for the two lakes in the sampling period. Further, we evaluated the effect of water quality physicochemical parameters on the phytoplankton density and biomass with the Pearson correlation analysis, using IBM SPSS Statistics (Version 23.0). We converted the phytoplankton data to lg (x + 1) format prior to data analysis to meet the normality required for ANOVA. We processed the base map of the study area employing kriging and mapped the spatial distribution of the phytoplankton density and biomass with ArcGIS software (Version 10.2, ESRI). We utilized redundancy analysis through CANOCO (version 5.0) to interpret the relationship between dominant phytoplankton communities and water quality physicochemical parameters. The Monte Carlo permutation test was used to test the water quality parameters and the phytoplankton community.

3. Results

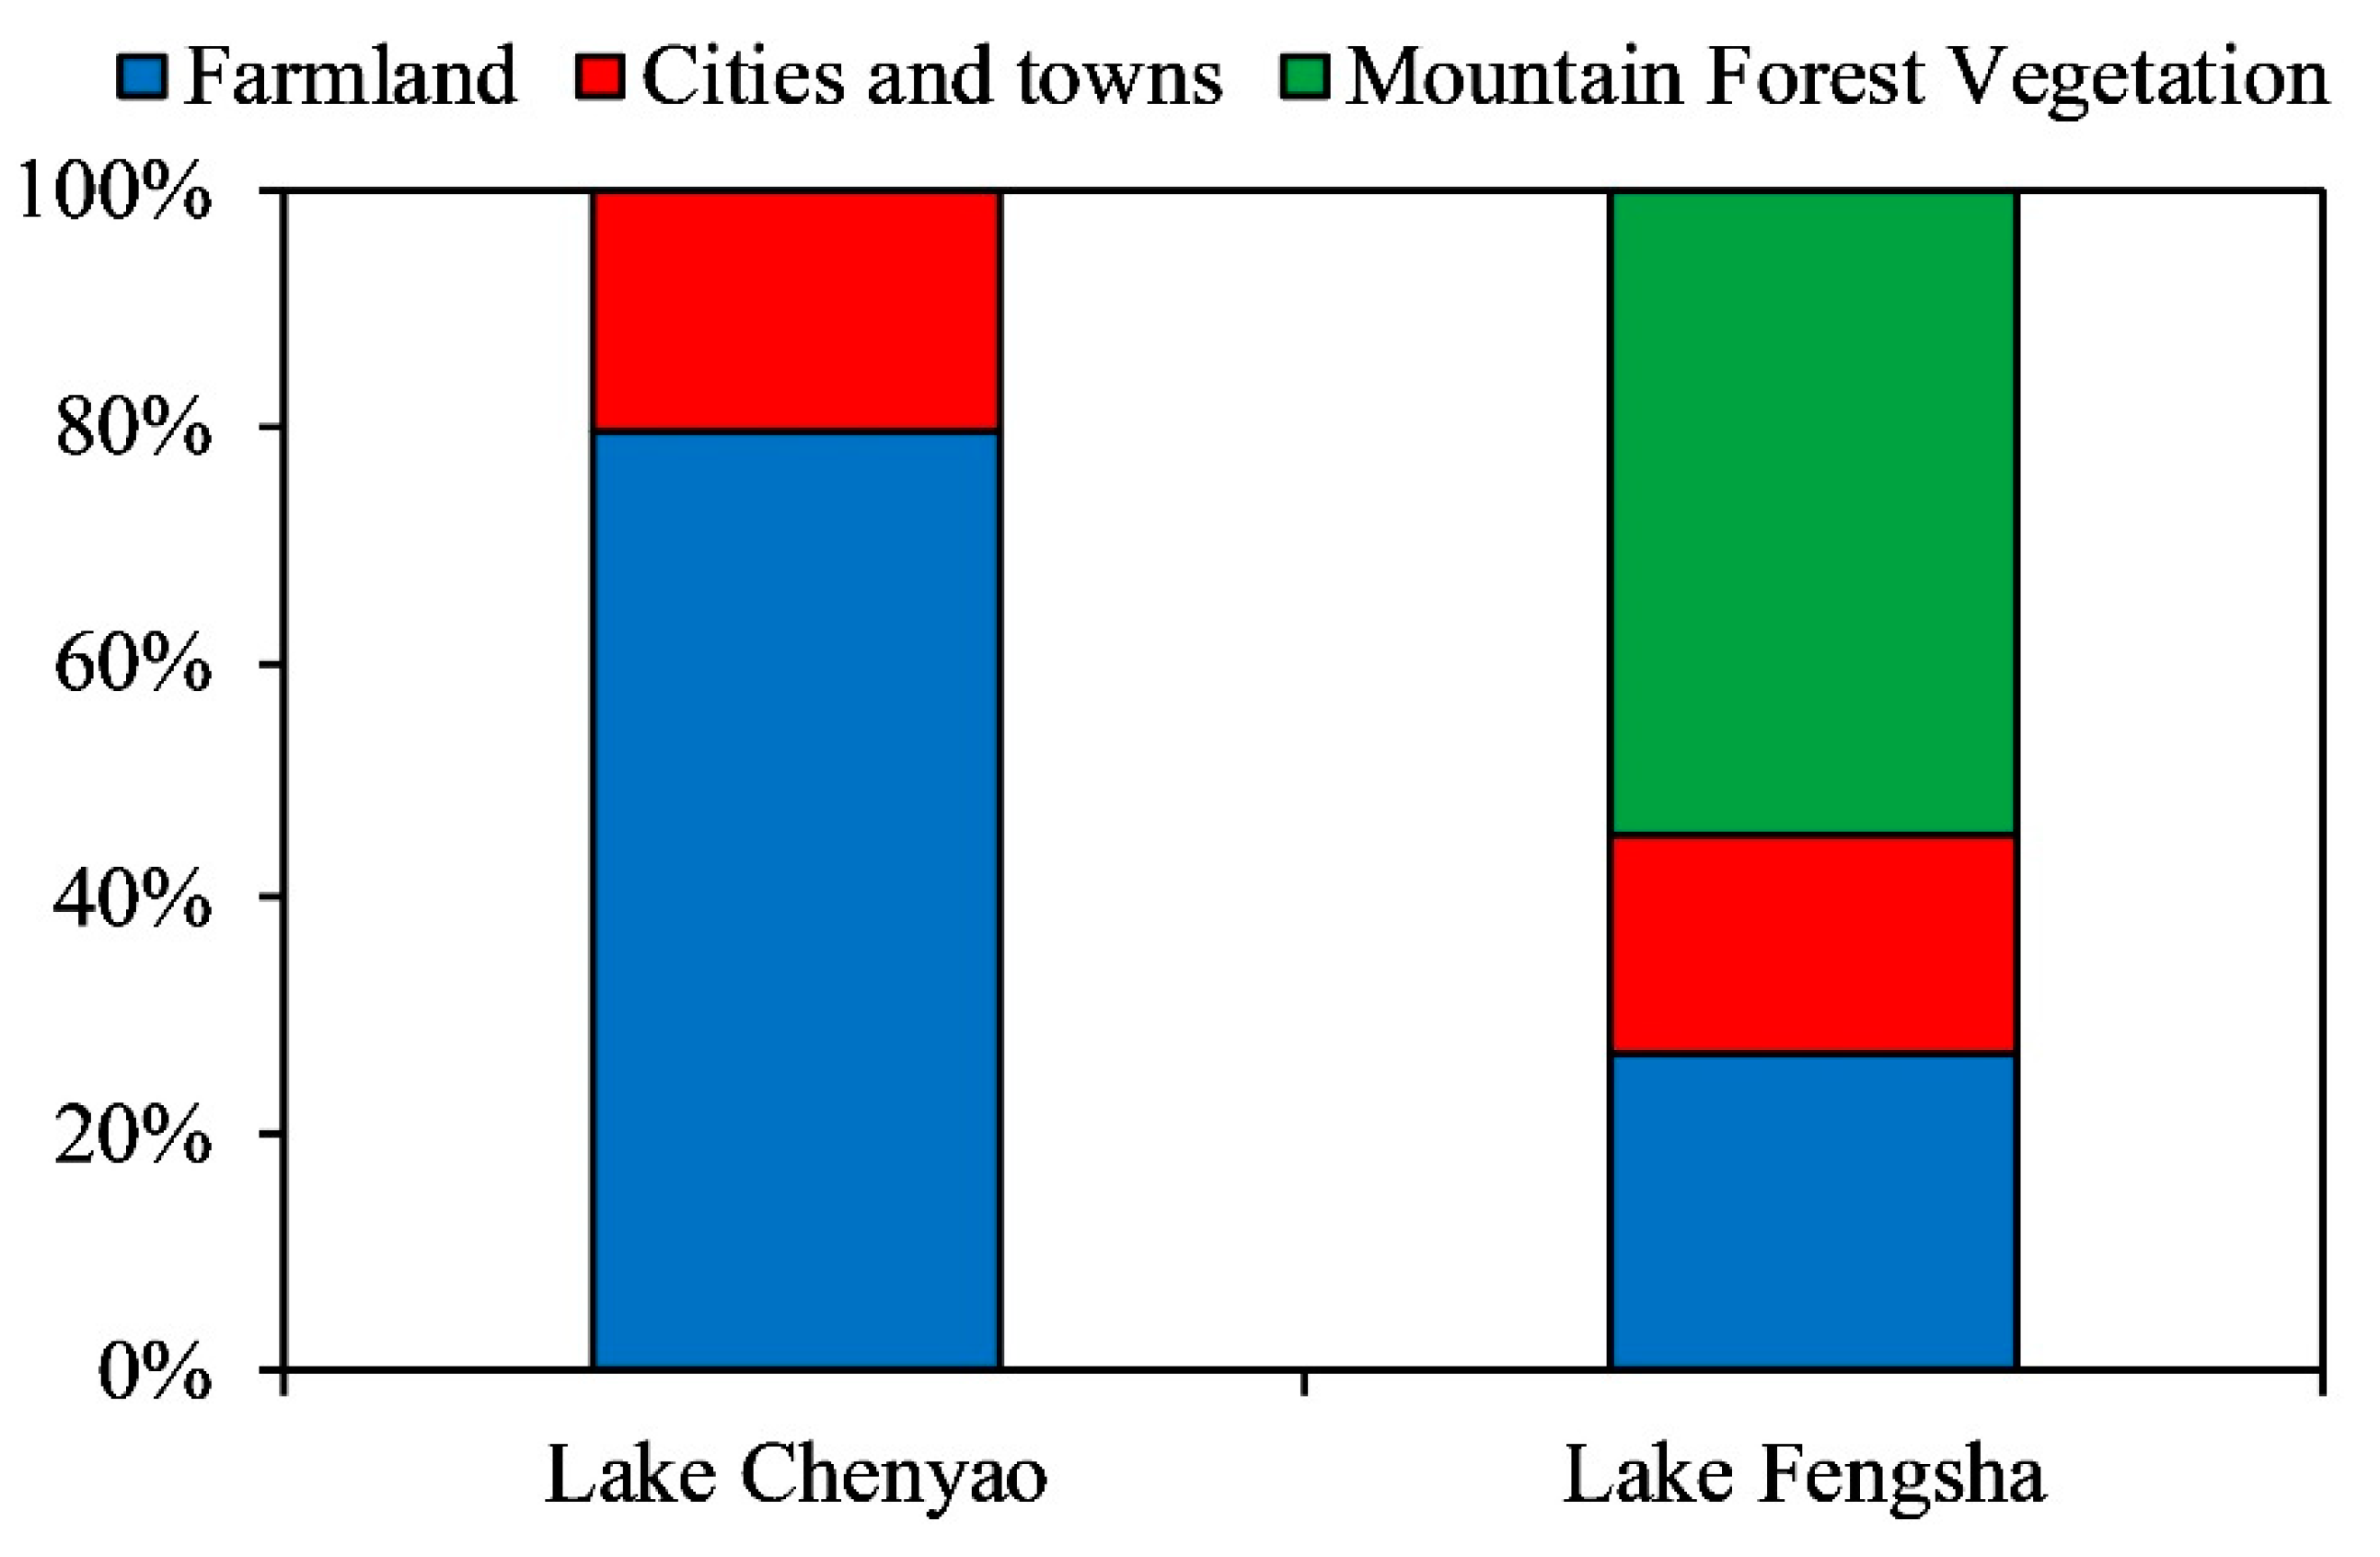
3.1. Distribution of Land Use Types

Lake Chenyao had the highest areal proportion of farmland, followed by towns, accounting for 79.59%, 20.41%, respectively. In comparison, the west of Lake Fengsha is surrounded by mountains. Its main land use type is mountain forest vegetation, and farmland was the second highest proportion of land use. The mountain vegetation, farmland, and towns accounted for 54.53%, 26.93%, and 18.53%, respectively (Figure 2).

3.2. Water Quality Parameters

The following table shows the main environmental factors of Lake Chenyao and Lake Fengsha in 2021 (Table 1). The results uncovered that WT had obvious seasonal changes, and the peaks were concentrated in summer, namely 27.84 ± 0.94 °C and 27.99 ± 0.24 °C, and the lowest values were concentrated in winter, 7.28 ± 0.56 °C and 7.3 ± 0.43 °C, respectively. The Paired Samples t-test revealed that, during the investigation, the water physicochemical factors of Lake Chenyao and Lake Fengsha had significant differences in space (Table 1). The pH, DO, TN concentration, TP concentration, NH4+-N concentration, and Chl a content of Lake Chenyao were respectively 6.57 ± 1.35, 8.22 ± 1.85 mg/L, 1.26 ± 0.48 mg/L, 0.31 ± 0.22 mg/L, 0.78 ± 0.58 mg/L and 8.89 ± 7.24 μg/L. Lake Fengsha were 7.10 ± 1.14, 10.32 ± 1.03 mg/L, 1.04 ± 0.36 mg/L, 0.18 ± 0.14 mg/L, 0.57 ± 0.21 mg/L and 7.88 ± 7.09 μg/L. The data showed that the pH, TN, TP, and Chl a of the two lakes of Lake Chenyao and Lake Fengsha exhibited significant correlation (p < 0.05), and the DO and NH4+-N showed a highly significant correlation (p < 0.01). The results showed that the physicochemical parameters of water quality such as TN concentration, TP concentration, NH4+-N concentration, and NO3-N concentration, and Chl a content in Lake Fengsha are lower than those of Lake Chenyao (Table 1).

3.3. Phytoplankton Species Composition and Dominant Species

A total of 138 species of phytoplankton in 7 phylum and 31 genera were identified in Lake Chenyao. The dominant species were Phormidium tenue, Oscillatoria tenuis, Anabaena azotica, Dolichospermum circinale, Microcystis aeruginsa, Merismopedia minima, Aulacoseira granulate, Aulacoseira granulata var. angustissima, Desmodemus communis, Comasiella arcuata, and Tetradesmus lagerheimii (Table 2). A total of 135 species of phytoplankton in 7 phylum and 67 genera were identified in Lake Fengsha. The dominant species were Phormidium tenue, Oscillatoria tenuis, Anabaena azotica, Dolichospermum circinale, Microcystis aeruginsa, Merismopedia minima, Aphanocapsa thermalis, Merismopedia sinica, Aulacoseira granulata, Ulnaria acus, Desmodemus communis, and Lepocinclis oxyuris (Table 2).

3.4. Temporal and Spatial Dynamics of Phytoplankton Cell Density and Biomass

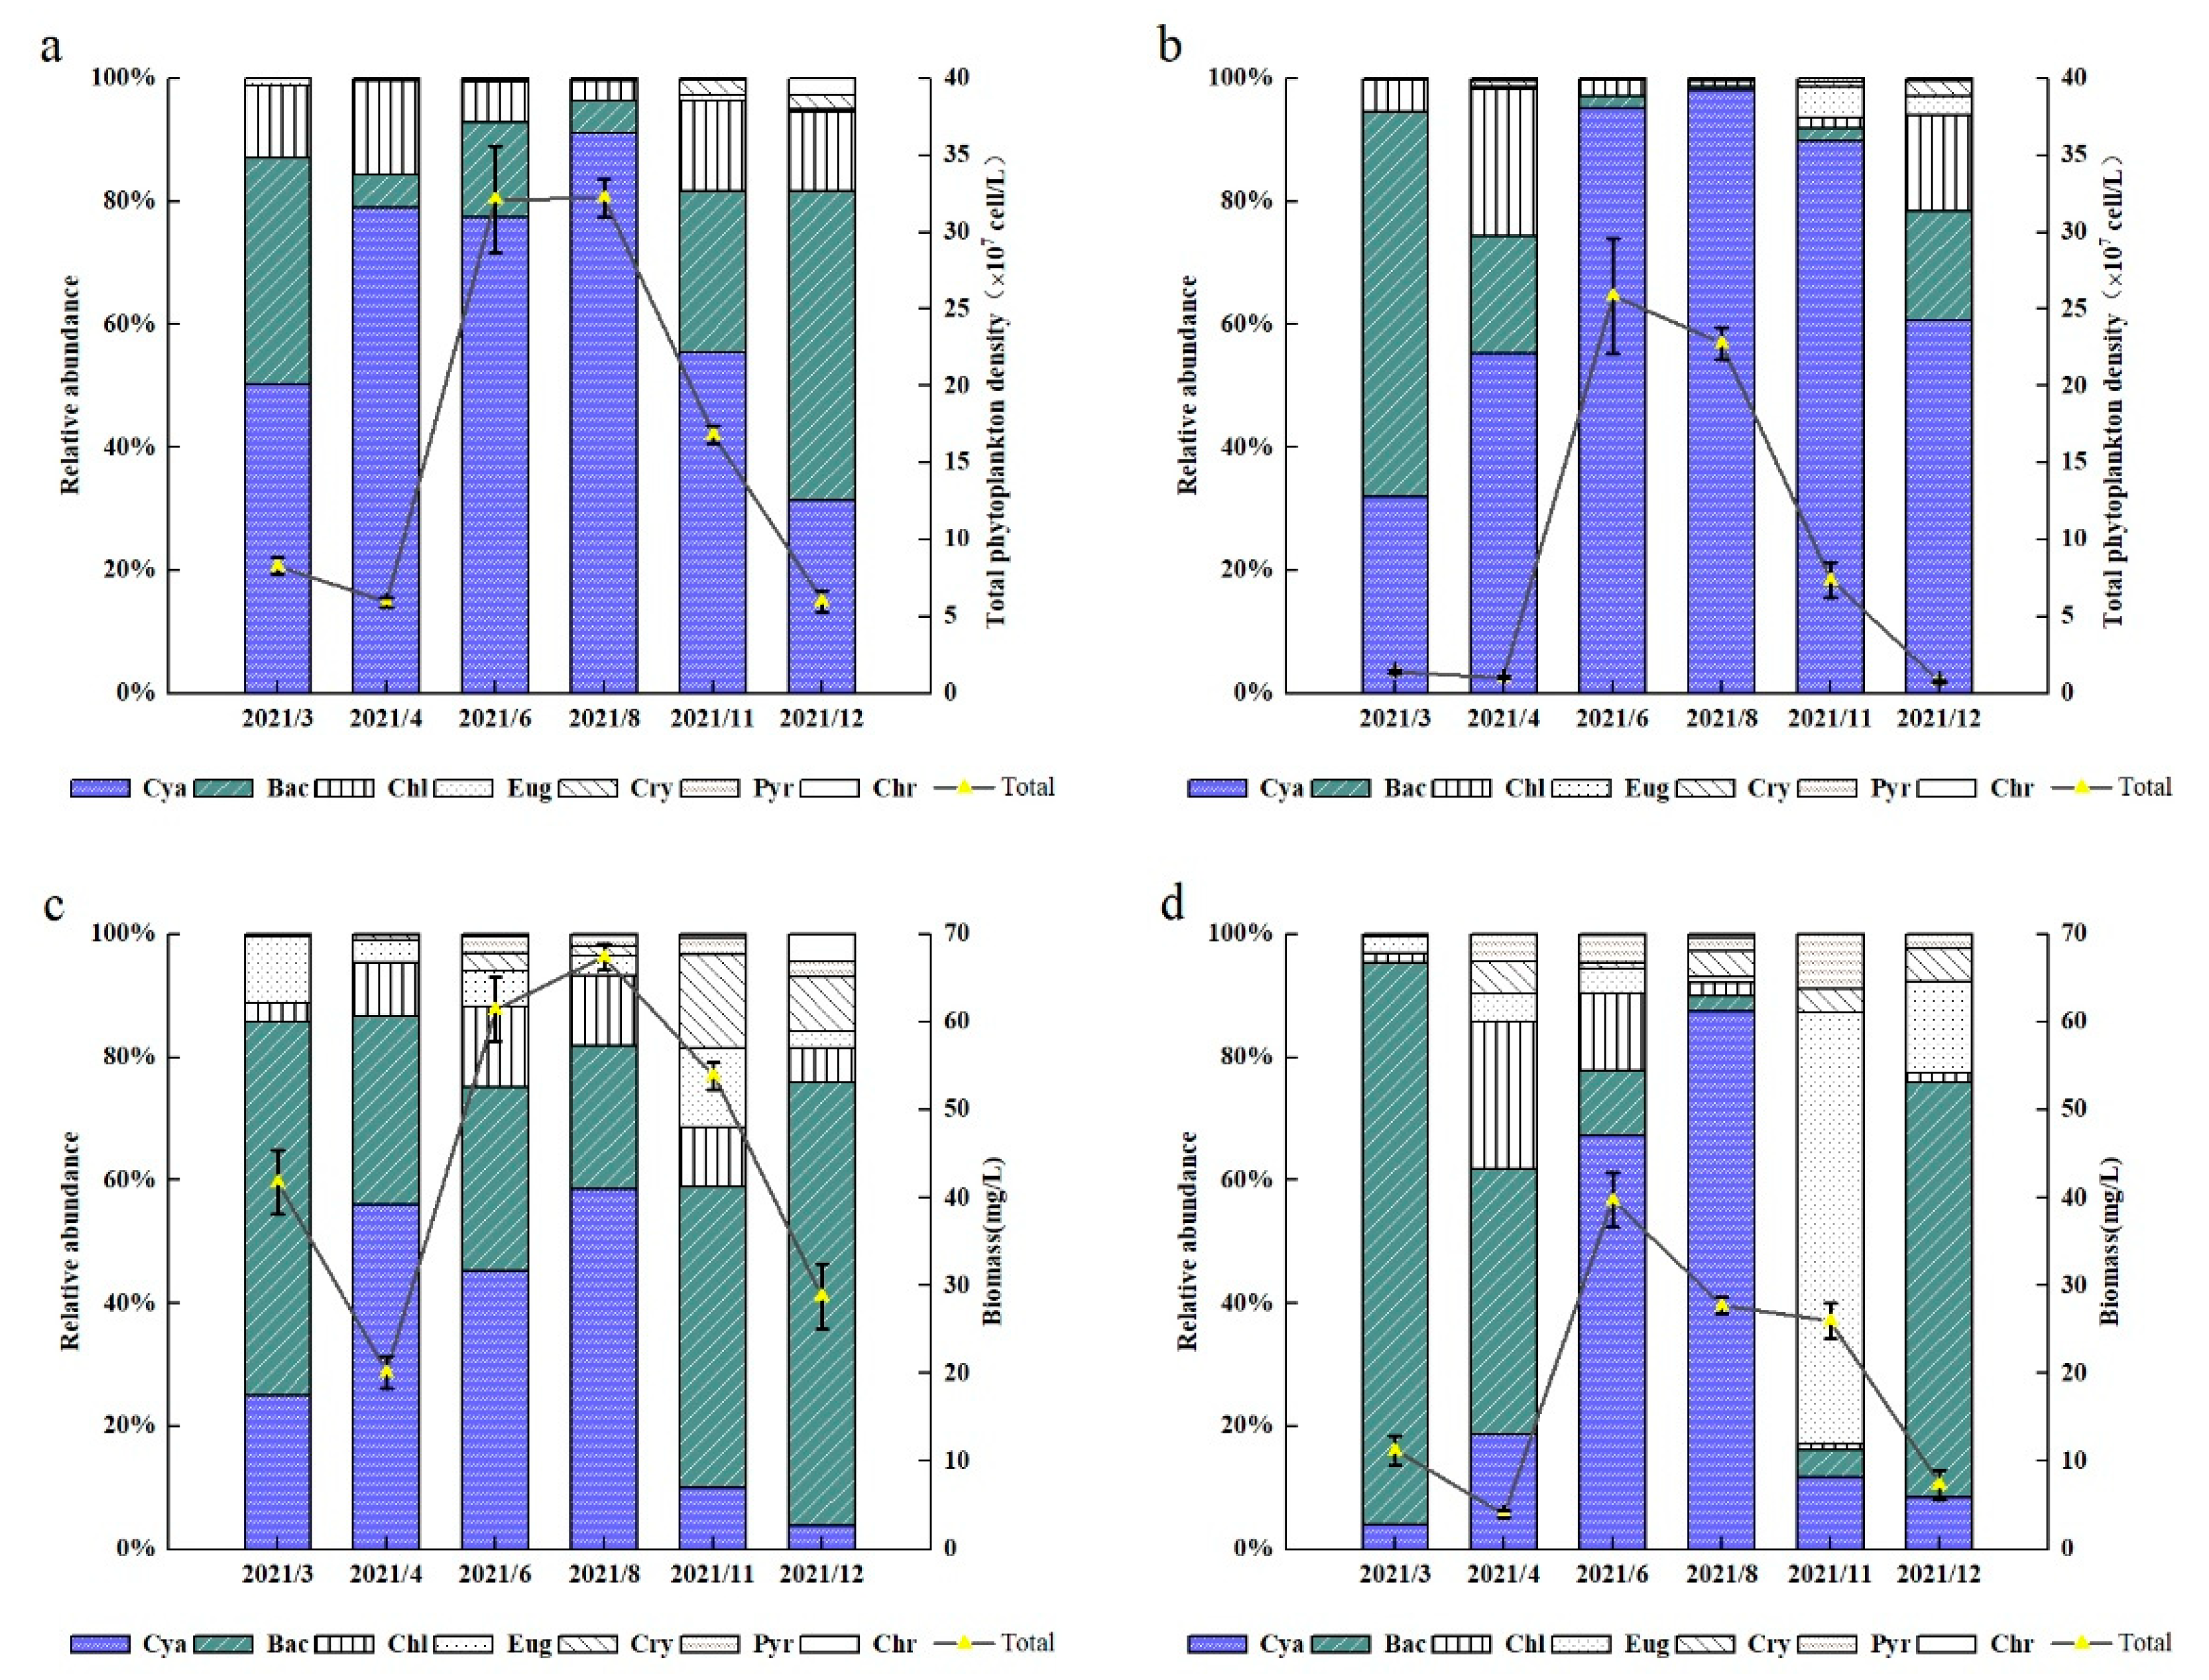
3.4.1. Temporal Variation of Phytoplankton Cell Density and Biomass

There were significant differences in the phytoplankton cell density and biomass between Lake Chenyao and Lake Fengsha. The average annual cell density and biomass of phytoplankton in Lake Chenyao and Lake Fengsha were 15.52 × 10⁷ cells/L and 44.51 mg/L, 8.42 × 10⁷ cells/L, and 18.67 mg/L, respectively. As well, the cell density (Figure 3a,b) and biomass (Figure 3c,d) of phytoplankton in Lake Chenyao each month were greater than those of the corresponding month of Lake Fengsha.
In Lake Chenyao and Lake Fengsha, the phytoplankton cell density and biomass varied greatly with the seasons. In summer, the cell density and biomass of phytoplankton in Lake Chenyao and Lake Fengsha reached the highest values, with the average values being 32.18 × 10⁷ cells/L and 64.45 mg/L, 24.31 × 10⁷ cells/L and 33.73 mg/L. As well, the cell density and biomass of phytoplankton were dominated by the Cyanophyta. In winter, the cell density and biomass of phytoplankton in Lake Chenyao and Lake Fengsha reached the lowest values, with the average values being 5.98 × 10⁷ cells/L and 28.76 mg/L, 0.77 × 10⁷ cells/L and 7.35 mg/L. As well, the biomass of phytoplankton was dominated by the Bacillariophyta.

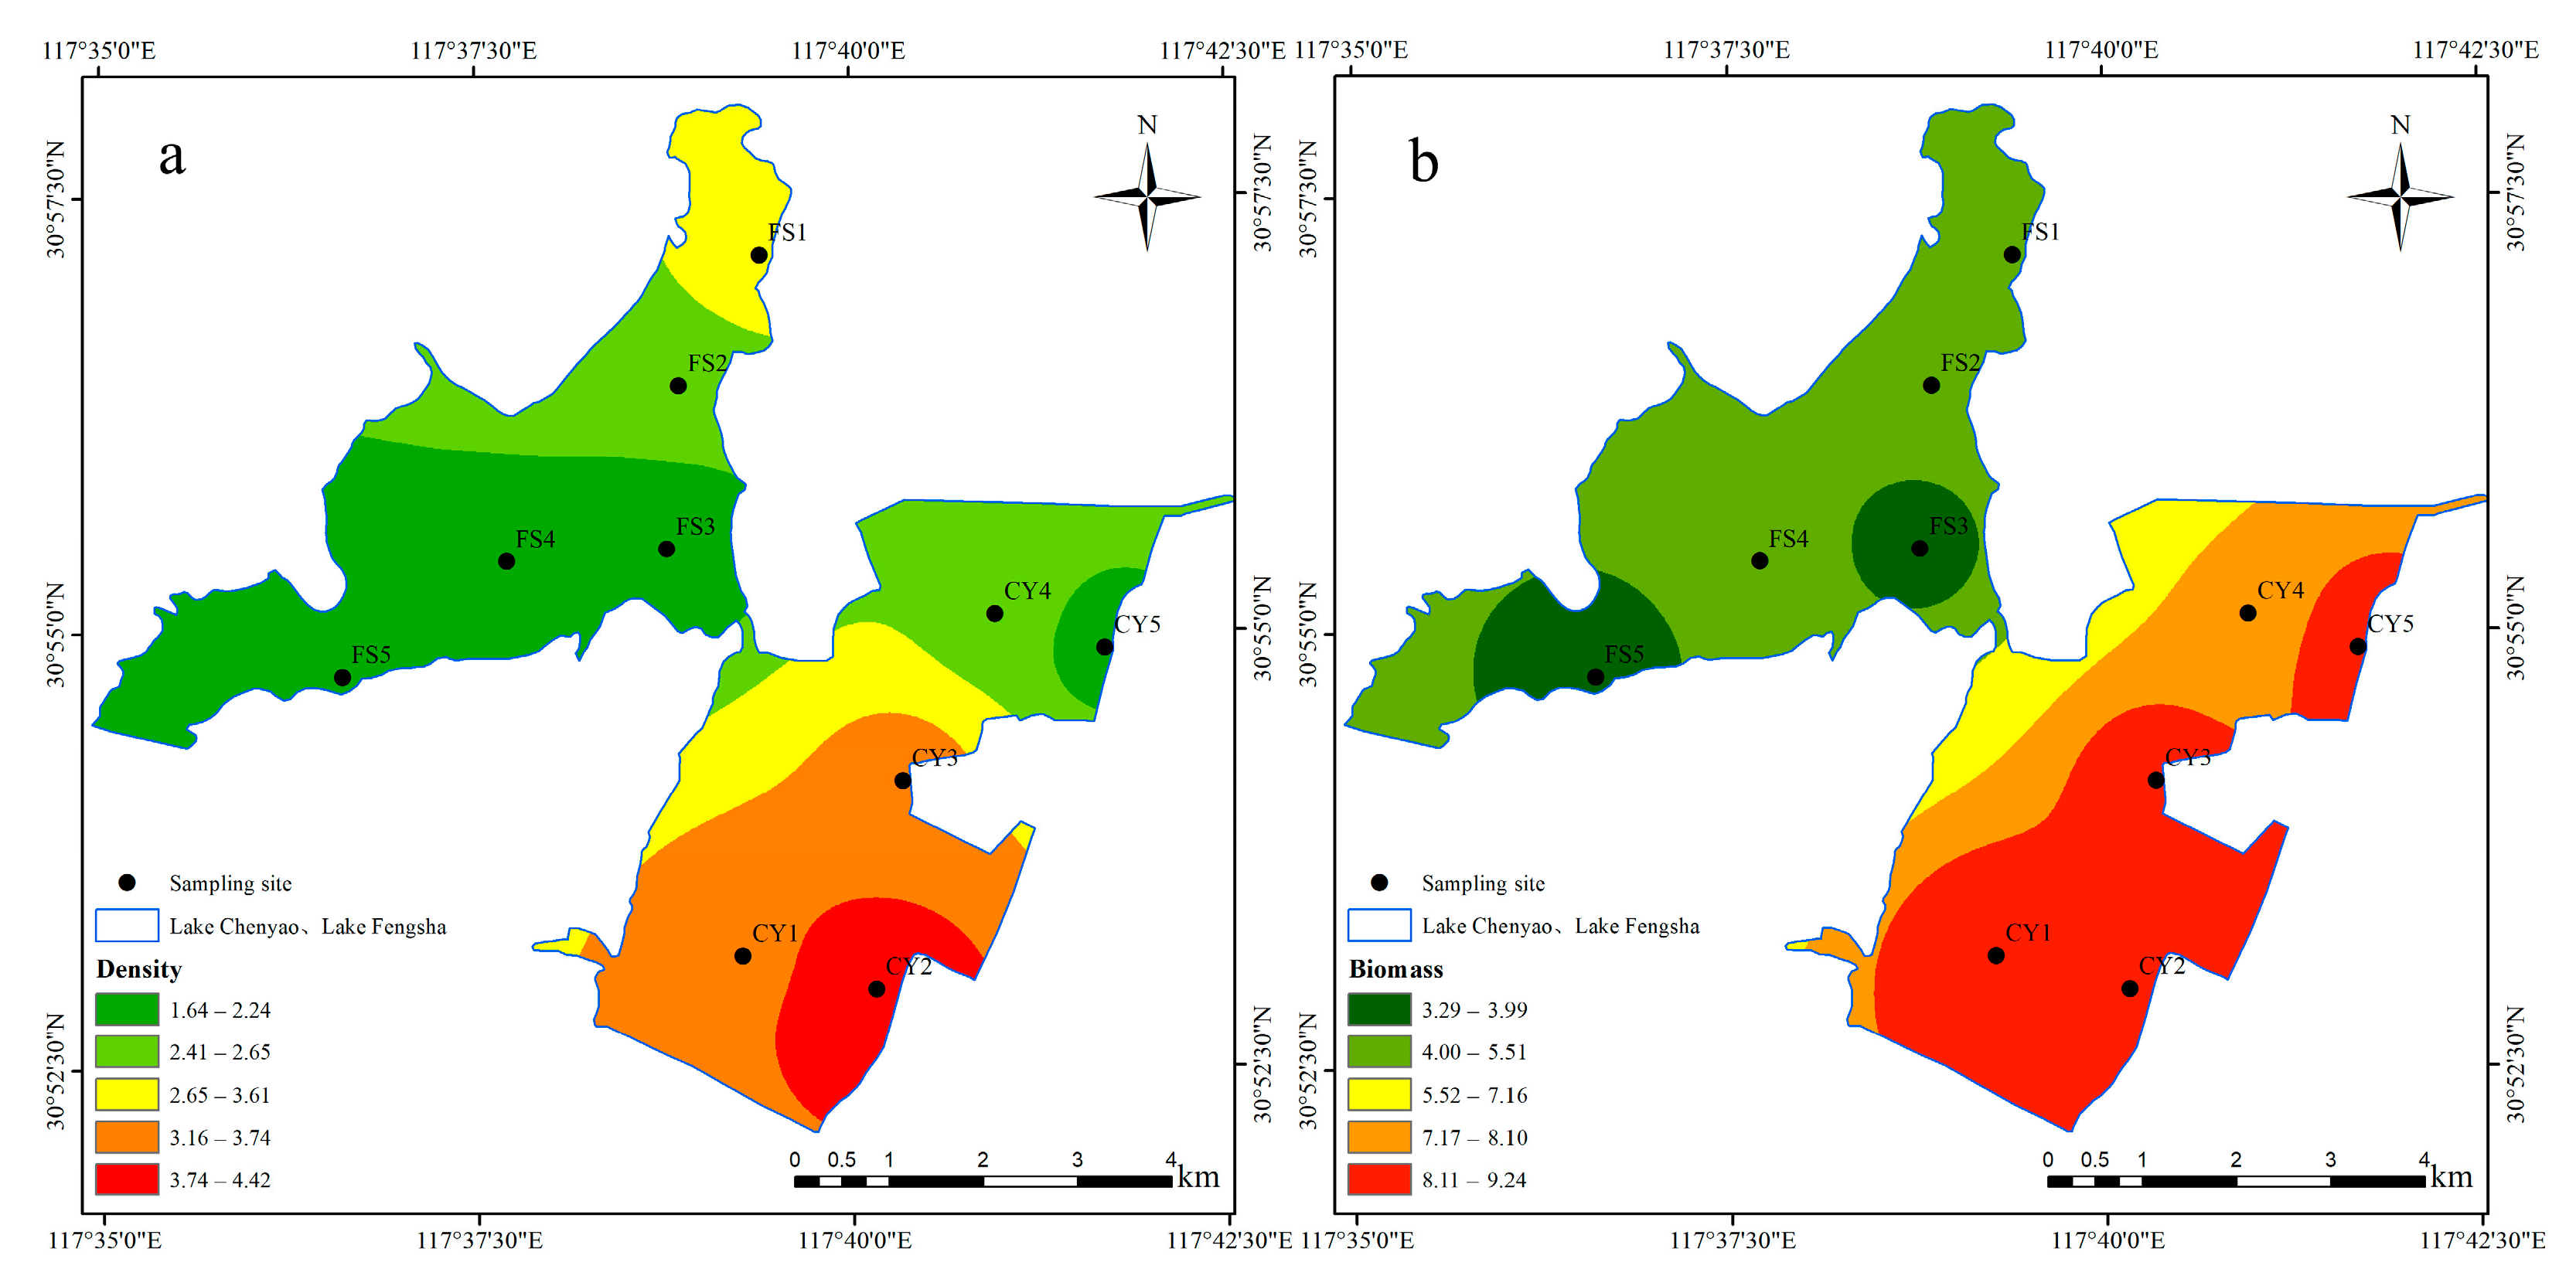
3.4.2. Spatial Variation of Phytoplankton Cell Density and Biomass

From a spatial point of view (Figure 4a,b), There were significant differences in the spatial distribution of the phytoplankton cell density and biomass in both lakes (p < 0.05). The phytoplankton cell density in Lake Chenyao was generally higher than that in Lake Fengsha with the highest value of 4.43 × 10⁷ cells/L, which appeared at the CY2 sample point, and the lowest value of 1.64 × 10⁷ cells/L, which appeared at the FS3 sample point (Figure 4a). The highest biomass value of Lake Chenyao is 9.24 mg/L, which appeared at the CY1 sample point, the lowest value was 7.26 mg/L at the CY4 sample point, the highest value of Lake Fengsha biomass was 4.41 mg/L, which manifested at the FS1 sample point, and the lowest value was 3.29 mg/L, which appeared at the FS5 sample point (Figure 4b).

3.5. Phytoplankton Diversity

The Shannon-Wiener index (H′) of phytoplankton in Lake Chenyao ranged from 1.07 to 2.88 with a mean value of 2.05, and the Margalef index (d) was between 1.26 and 3.99 with a mean value of 2.55. The Pielou index (J′) fluctuated from 0.35 to 0.72 with a mean of 0.55. The Shannon-Wiener index (H′) of phytoplankton in Lake Fengsha varied from 1.30 to 2.82 with a mean value of 1.98, the Margalef index (d) was between 0.92 and 3.67 with a mean value of 1.85, and the Pielou index (J′) was between 0.37 and 0.84 with a mean value of 0.60.

3.6. Relationship between Phytoplankton and Environmental Factors

3.6.1. Pearson Correlation Analysis

The results of Pearson Correlation Analysis revealed that the cell density of Lake Chenyao exhibited a significant positive correlation with WD, WT, TN, and TP (p < 0.05). The biomass exhibited a significant positive correlation with TN. The phytoplankton cell density in Lake Fengsha was significantly positively correlated with WD (r = 0.94, p < 0.01) and significantly positively correlated with WT (r = 0.819, p < 0.05) (Table 3).

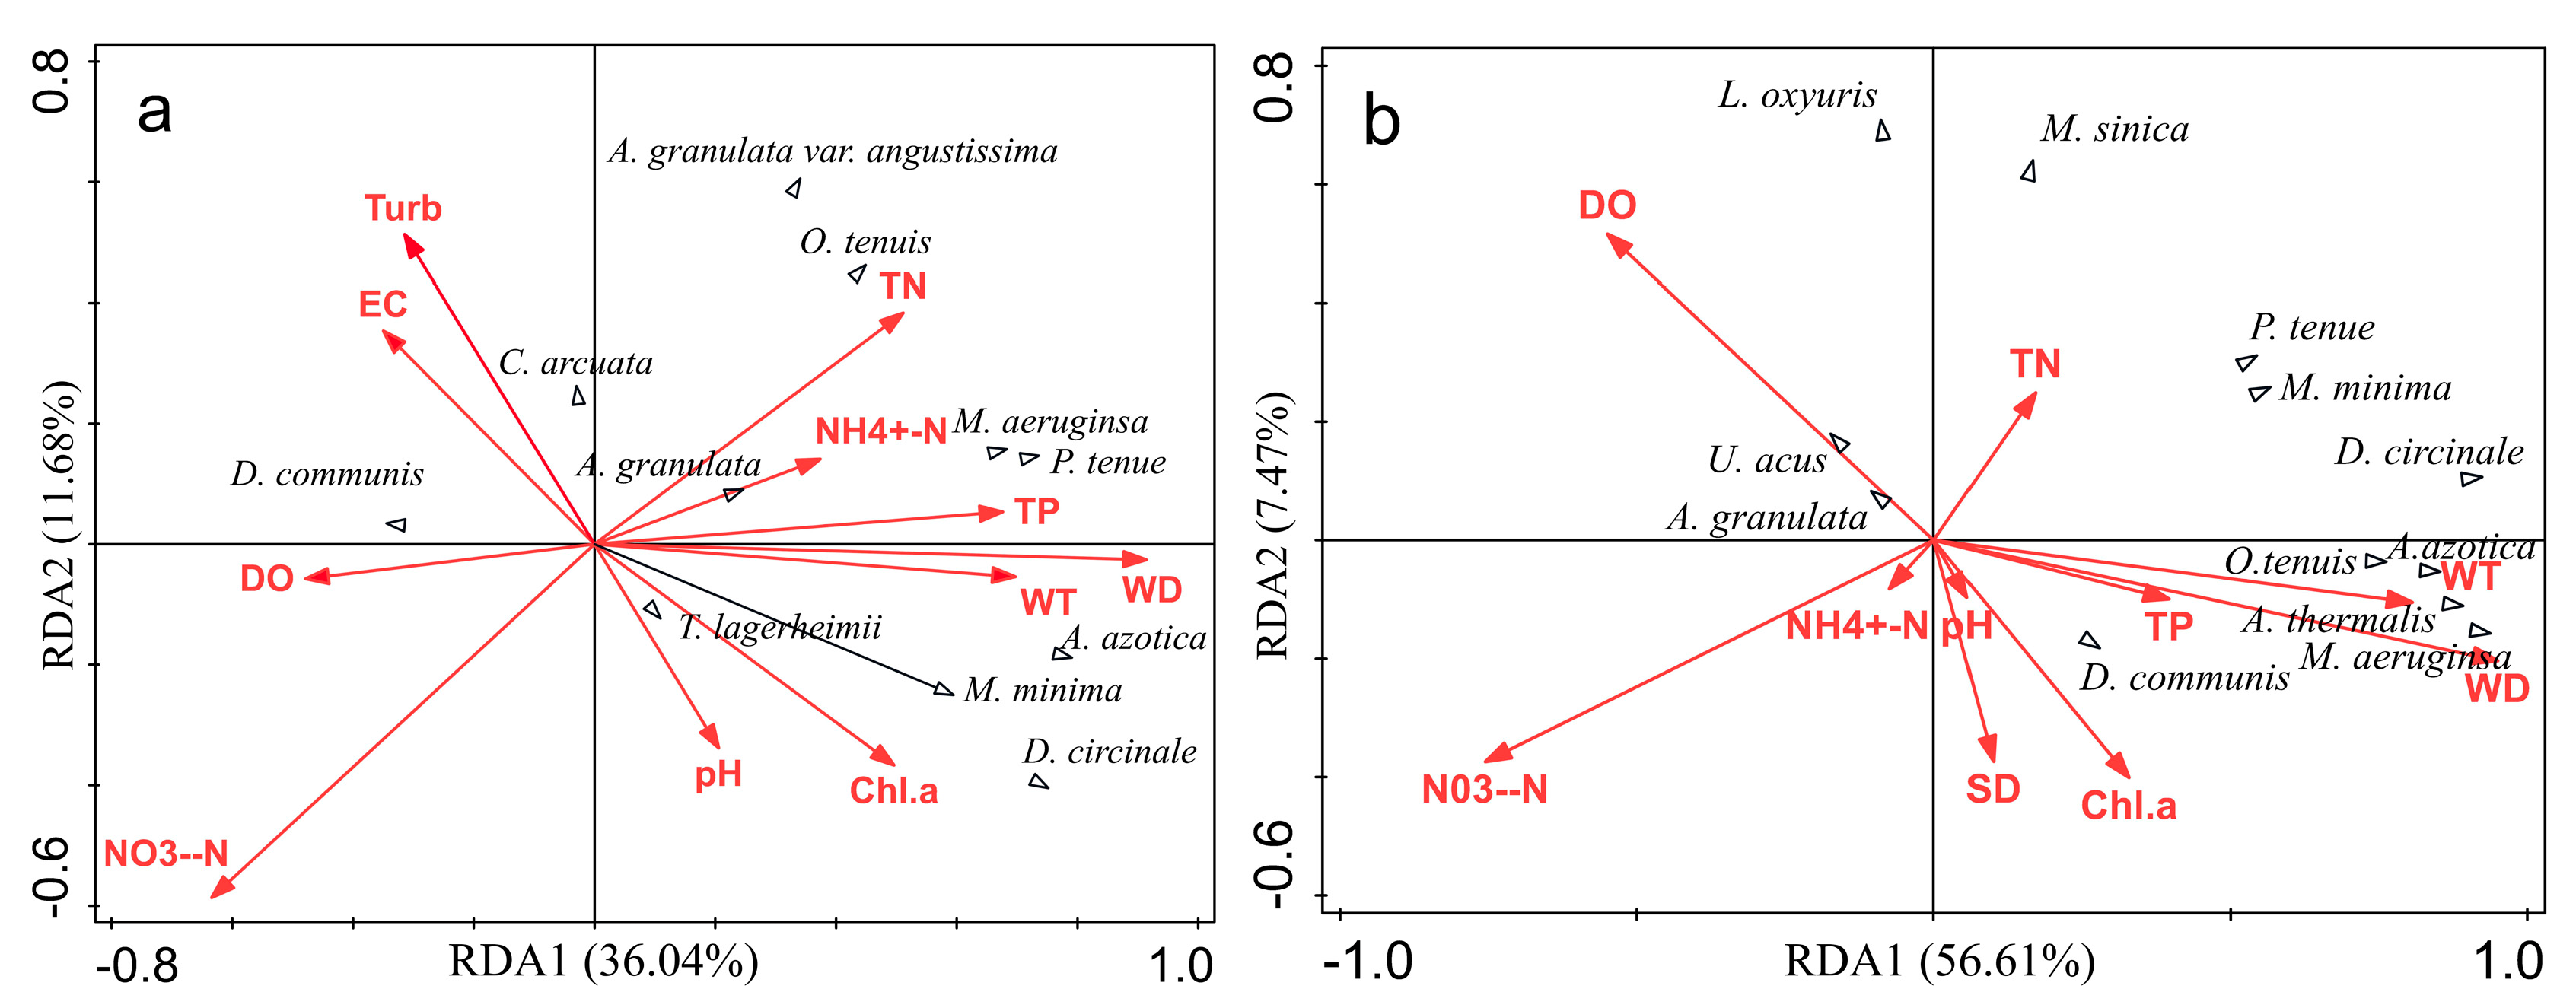
3.6.2. Redundancy Analysis

We performed a redundancy analysis (RDA) to summarize the relationship between the dominant phytoplankton species and environmental variables (Figure 5).
The RDA results showed that the main water quality physicochemical parameters affecting the dominant phytoplankton species in Lake Chenyao were WD, TN, NH4+-N, pH, and Turb. The analysis results found that the P. tenue, O. tenuis and M. aeruginsa were positively correlated with TN and TP and negatively correlated with NO3-N (Figure 5a). A. azotica, D. circinale, and M. minima were positively correlated with, WT, WD, and TP. D. communis was positively associated with Turb. The main water quality physicochemical parameters affecting the dominant phytoplankton species in Lake Fengsha were WD, SD and DO (Figure 5b). The analysis results showed that O. tenuis, A. azotica, D. circinale, M. aeruginsa, and A. thermalis were positively and significantly correlated with WT and WD. A. granulata and U. acus were positively correlated with DO.

4. Discussion

4.1. Water Quality and Land Use Impacts

Our results demonstrated that the contents of TN, TP, NH4+-N, NO3-N, and Chl a in Lake Chenyao were significantly higher than those in Lake Fengsha (Table 1), which was significantly related to the different distribution of land use types between Lake Chenyao and Lake Fengsha. The terrain of Lake Chenyao is low-lying, due to the rise of agricultural development and aquaculture, and the land use types around Lake Chenyao are dominated by farmland, followed by towns. In order to increase production, pesticides and fertilizers were used frequently and abundantly in agricultural fields, and excess pesticides and fertilizers flowed into lakes through surface runoff, increasing TN and TP levels in water bodies. Previous studies have shown agricultural runoff and built-up contribute to the increased nutrient loads in the lake [28,29]. At the same time, according to the 2019 summer survey, it was found that the Euryale ferox of Lake Chenyao grew too densely and 95% of the area of the lake surface was covered by aquatic plants, of which 90% of the coverage was predominated by Euryale ferox and Nelumbo nucifera [20]). After the flood outbreak in 2020, aquatic vegetation overgrew and reproduced, then decayed and deposited to the bottom of the lake. It slowly decomposed and released nutrients at the bottom of the lake, thus exacerbating the eutrophication of the water body of Lake Chenyao in 2021.
There are many mountains around Lake Fengsha, and rich vegetation grows in this region. In land use patterns, forests are effective factors in reducing the entry of pollutants into lakes [17]. The water of the lake comes mainly from the mountains, there is no hydrophyte growing in Lake Fengsha all year round. As a result, the N and P content of Lake Fengsha is lower than that of Lake Chenyao.

4.2. Effects of Physicochemical Factors on Phytoplankton Community Structure

As an important component of lake ecosystems, the community structure of phytoplankton is mainly affected by physicochemical factors in water bodies. In the present study, the density and biomass of phytoplankton and water quality physicochemical factors in the two lakes were analyzed, and the results revealed that the WD, WT, TN, and TP were essential environmental factors affecting the phytoplankton community abundance. The results indicated that the annual average cell density and biomass of phytoplankton in Lake Chenyao were higher than those in Lake Fengsha, and the annual average cell density of phytoplankton in Lake Chenyao was 2.24 times that of Lake Fengsha. In addition, in the summer, the density and biomass of Cyanophyta in both lakes were significantly higher than in other seasons. This was probably determined by WT and the difference between the two lakes in nutrients such as N and P.
In our study, the phytoplankton community of the two lakes was generally dominated by Cyanophyta and Bacillariophyta and Chlorophyta in each season. These phyla communities were greatly increased in shallow lakes in the Yangtze River basin [30]. According to the concept of flood pulses, flood pulses allow for the exchange of nutrients and energy between aquatic and continental facies [31,32]. Summer is the rainy season in Anhui, during which heavy rainfall occurs, and a large amount of nutrients enter the surface runoff and then flow into the lake. This results in an increase in the concentration of nutrients such as TN and TP in Lake Chenyao, thereby promoting the growth of phytoplankton. In winter, the advantages of Cyanophyta are significantly reduced, the contribution of Bacillariophyta and Chlorophyta to the abundance of the phytoplankton community is greatly increased, and N and P are no longer important factors affecting the abundance of the phytoplankton communities.
WT is considered a critical environmental factor affecting the structure of phytoplankton communities. Different types of phytoplankton react differently to temperature, and previous studies have shown that high temperatures are more conducive to the growth of cyanobacteria, making them more advantageous in competition [33]. With heavy rainfall in summer and the highest water levels in Lake Chenyao and Lake Fengsha, our research showed that a positive correlation between WD and WT (p < 0.05). The summer water harvest period leads to high water levels, and WT above 27 °C is conducive to the growth of Cyanophyta, increasing their competitive advantage. Autumn and winter water level decline lead to stagnation of water flow, resulting in turbidity of the water body, affecting the efficiency of photosynthesis, the advantages of cyanobacteria were remarkably reduced, and the biomass and density of phytoplankton were dominated by Bacillariophyta.

4.3. Effects of Land Use on Phytoplankton Structure

Land use acts a vital driving role in the community composition of phytoplankton [34,35]. Land use types can influence phytoplankton community structure by increasing N and P in lakes. The type of land use around Lake Chenyao is mainly farmland, followed by towns. The runoff from agriculture and construction often contains high concentrations of nutrients [36]. Cultivated and built-up land can indirectly promote the growth of phytoplankton by increasing the TP and TN of water bodies. Our results indicated that the TN concentration, and TP concentration in Lake Chenyao were higher than those of Lake Fengsha. The high TN and TP concentrations in the water body led to the density and biomass of phytoplankton in Lake Chenyao being higher than that of Lake Fengsha. Doubek et al. found that artificial land increases the dominance of cyanobacteria by increasing nutrient concentrations in lakes [37]. Built-up land may increase the temperature of runoff and thus increase the advantage of cyanobacteria. These findings are consistent with our results.
Lake Fengsha is surrounded by mountains on all sides, and the land use type is mainly forest vegetation, accounting for 54.53%. Forests can help reduce phytoplankton biomass by decreasing the entry of N and P into lakes and improving water transparency [38]. The runoff coefficient of forests is relatively low compared to farmland and construction areas [39]. In addition, forests as nutrient accumulation areas can control and reduce N and P entering the surface runoff [40].
This study selected representative two lakes in the lower reaches of the Yangtze River as the research object, and analyzed the temporal and spatial effects of water quality physicochemical parameters and land use on phytoplankton community structure. Our study focused on temporal and spatial changes in phytoplankton biomass and cell density in a year, future research should consider larger time scales. Climatic factors, soil type, and other anthropogenic activities also have an impact on water quality [41], thereby indirectly affecting phytoplankton growth, and it is necessary to clarify the impact of these factors on phytoplankton.

5. Conclusions

In summary, our results indicated that the phytoplankton density and biomass of Lake Chenyao were higher than those of Lake Fengsha in all seasons, which was mainly determined by the difference in water quality between Lake Chenyao and Lake Fengsha. We showed that the main land use types around Lake Chenyao are farmland and towns, while Lake Fengsha is forest vegetation. The agriculture and construction industry can increase the TN and TP in lakes, in contrast, the forests can reduce the amounts of N and P entering water body. These findings imply that land use types probably significantly affect the phytoplankton community of shallow lakes, mainly via their influence on the water quality. We proposed that more attention should be focused on land use types around the lakes when exploring the impact of human activities on the phytoplankton community. Moreover, we suggest that lake managers should reduce lake pollution by increasing the areas of forest.

Author Contributions

Conceptualization: Z.Z. and S.W.; Data curation: W.L. and S.Z. Investigation: W.L., S.Z. and Y.W.; Methodology: Z.Z.; Writing—original draft: W.L.; Writing—review and editing: W.L., Z.Z. and S.W.; Funding acquisition: Z.Z. All authors have read and agreed to the published version of the manuscript.

Funding

This research was supported by the Aquatic Biological Resources Monitoring in Key Watershed of Anhui Province (No. ZF2021-18-0786). This research was sponsored by Zhongze Zhou.

Institutional Review Board Statement

Not applicable.

Informed Consent Statement

Not applicable.

Data Availability Statement

The data presented in this study are available on request from the corresponding author Shuqiong Wang. E-mail: shuqiong632458@hotmail.com.

Acknowledgments

We thank Wenqian Zhao for the assistance with data collection. We appreciate Marci Baun from University of California, Los Angeles, for checking the English of a near-final draft of the manuscript.

Conflicts of Interest

The authors declare no conflict of interest.

References

  1. Yin, D.C.; Zheng, L.L.; Song, L.R. Spatio-temporal distribution of phytoplankton in the Danjiangkou reservoir, a water source area for the south-to-north water diversion project (middle route), China. Chin. J. Oceanol. Limnol. 2011, 29, 531–540. [Google Scholar] [CrossRef]
  2. Padisák, J.; Borics, G.; Grigorszky, I.; Soróczki-Pintér, E. Use of phytoplankton assemblages for monitoring ecological status of lakes within the Water Framework Directive: The assemblage index. Hydrobiologia 2006, 553, 1–14. [Google Scholar] [CrossRef]
  3. Znachor, P.; Nedoma, J.; Hejzlar, J.; Seďa, J.; Komárková, J.; Kolář, V.; Tomáš, M.; Boukal, D.S. Changing environmental conditions underpin long-term patterns of phytoplankton in a freshwater reservoir. Sci. Total Environ. 2020, 710, 135626. [Google Scholar] [CrossRef] [PubMed]
  4. Mayer, T. Interactions of fish, algae, and abiotic factors in a shallow, tropical pond. Hydrobiologia 2020, 847, 4145–4160. [Google Scholar] [CrossRef]
  5. Fu, H.; Chen, L.D.; Ge, Y.L.; Wu, A.P.; Liu, H.Y.; Li, W.; Yuan, G.X.; Jeppesen, E. Linking human activities and global climatic oscillation to phytoplankton dynamics in a subtropical lake. Water Res. 2022, 208, 117866. [Google Scholar] [CrossRef]
  6. Crosbie, B.; Chow-Fraser, P. Percentage land use in the watershed determines the water and sediment quality of 22 marshes in the Great Lakes basin. Can. J. Fish. Aquat. Sci. 1999, 56, 1781–1791. [Google Scholar] [CrossRef]
  7. Rahul, K.; Rama, K.; Chandi, P.; Vijayta, T.; Neetu, S.; Swati, M.; Ramchander, M.; Stanzin, N.; Akash, D. Phytoplankton diversity in relation to physicochemical attributes and water quality of Mandakini River, Garhwal Himalaya. Environ. Monit. Assess. 2020, 192, 799. [Google Scholar] [CrossRef]
  8. Reynolds, C.S. The Ecology of Phytoplankton; Cambridge University Press: Cambridge, UK, 2006. [Google Scholar]
  9. Schindler, D.W. Recent advances in the understanding and management of eutrophication. Limnol. Oceanogr. 2006, 51, 356–363. [Google Scholar] [CrossRef] [Green Version]
  10. Mazumder, A. Patterns of algal biomass in dominant odd-vs. even-link lake ecosystems. Ecology 1994, 75, 1141–1149. [Google Scholar] [CrossRef]
  11. Rojo, C.; Ortega-Mayagoitia, E.; Alvarez-Cobelas, M. Lack of pattern among phytoplankton assemblages. Or, what does the exception to the rule mean? Hydrobiologia 2000, 424, 133–139. [Google Scholar] [CrossRef]
  12. Pan, B.; Wang, H.; Wang, H. A floodplain-scale lake classification based on characteristics of macroinvertebrate assemblages and corresponding environmental properties. Limnologica 2014, 49, 10–17. [Google Scholar] [CrossRef]
  13. Jiang, Y.J.; He, W.; Liu, W.X.; Qin, N.; Ouyang, H.L.; Wang, Q.M.; Kong, X.Z.; He, Q.S.; Yang, C.; Yang, B.; et al. The seasonal and spatial variations of phytoplankton community and their correlation with environmental factors in a large eutrophic Chinese lake (Lake Chaohu). Ecol. Indic. 2014, 40, 58–67. [Google Scholar] [CrossRef]
  14. Watson, S.B.; McCauley, E.; Downing, J.A. Patterns in phytoplankton taxonomic composition across temperate lakes of differing nutrient status. Limnol. Oceanogr. 1997, 42, 487–495. [Google Scholar] [CrossRef] [Green Version]
  15. Perry, J.; Vanderklein, E.L. Water Quality: Management of a Natural Resource; Blackwell Science: Hoboken, NJ, USA, 1996. [Google Scholar]
  16. Foley, J.A.; Defries, R.; Asner, G.P.; Barford, C.; Bonan, G.; Carpenter, S.R.; Stuart Chapin, F.; Coe, M.T.; Daily, G.C.; Gibbs, H.K.; et al. Global consequences of land use. Science 2005, 309, 570–574. [Google Scholar] [CrossRef] [PubMed] [Green Version]
  17. Mello, K.D.; Valente, R.A.; Randhir, T.O.; Alves Dos Santos, A.C.; Vettorazzi, C.A. Effects of land use and land cover on water quality of low-order streams in Southeastern Brazil: Watershed versus riparian zone. Catena 2018, 167, 130–138. [Google Scholar] [CrossRef]
  18. Wei, W.; Gao, Y.N.; Huang, J.C.; Gao, J.F. Exploring the effect of basin land degradation on lake and reservoir water quality in China. J. Clean. Prod. 2020, 268, 122249. [Google Scholar] [CrossRef]
  19. Tang, H.B. Estimation of return period of flood in Chenyao Lake Basin of Anhui Province in 2016. Harnessing Huaihe River 2016, 12, 57. (In Chinese) [Google Scholar]
  20. Liu, Z.Z.; Zhao, W.Q.; Guo, W.L.; Zhou, Z.Z. Effects of moving experiment in different channel areas on metazooplankton community structure in Chenyao Lake. Acta Ecol. Sin. 2022, 42, 400–409. (In Chinese) [Google Scholar] [CrossRef]
  21. State Environmental Protection Bureau (SEPB). Methods of Monitoring and Analysis for Water and Wastewater, 4th ed.; China Environmental Science Press: Beijing, China, 2002. (In Chinese)
  22. Sitoki, L.; Kurmayer, R.; Rott, E. Spatial variation of phytoplankton composition, biovolume, and resulting microcystin concentrations in the Nyanza Gulf (Lake Victoria, Kenya). Hydrobiologia 2012, 691, 109–122. [Google Scholar] [CrossRef] [Green Version]
  23. Hu, H.J.; Wei, Y.X. The Freshwater Algae of China; SciPress: Bäch, Switzerland, 2006. (In Chinese) [Google Scholar]
  24. Li, J.Y.; Qi, Y.Z. Chinese Freshwater Algae; SciPress: Bäch, Switzerland, 2010. (In Chinese) [Google Scholar]
  25. Shannon, C.E.; Wiener, W. The Mathematical Theory of Communication; University of Illinois Press: Champaign, IL, USA, 1949. [Google Scholar]
  26. Pielou, E.C. An Introduction to Mathematical Ecology; Wiley-Inter-Science: Hoboken, NJ, USA, 1969. [Google Scholar]
  27. Margalef, R. Information theory in ecology. Gen. Syst. 1958, 3, 36–71. [Google Scholar]
  28. Johnson, L.; Richards, C.; Host, G.; Arthur, J. Landscape influences on water chemistry in Midwestern stream ecosystems. Freshw. Biol. 1997, 37, 193–208. [Google Scholar] [CrossRef]
  29. Moss, B. Cogs in the endless machine: Lakes, climate change and nutrient cycles: A review. Sci. Total Environ. 2012, 434, 130–142. [Google Scholar] [CrossRef] [PubMed]
  30. Xiao, Z.; Li, H.; Li, X.C.; Li, R.H.; Huo, S.L.; Yu, G.L. Geographic pattern of phytoplankton community and their drivers in lakes of middle and lower reaches of Yangtze River floodplain, China. Environ. Sci. Pollut. Res. 2022, 29, 83993–84005. [Google Scholar] [CrossRef] [PubMed]
  31. Junk, W.J.; Bayley, P.B.; Sparks, R.E. The flood pulse concept in river-floodplain systems. Can. Spec. Publ. Fish. Aquat. Sci. 1989, 106, 110–127. [Google Scholar]
  32. Tockner, K.; Malard, F.; Ward, J.V. An extension of the flood pulse concept. Hydrol. Process. 2000, 14, 2861–2883. [Google Scholar] [CrossRef]
  33. Wagner, C.; Adrian, R. Cyanobacteria dominance: Quantifying the effects of climate change. Limnol. Oceanogr. 2009, 54, 2460–2468. [Google Scholar] [CrossRef]
  34. Qu, Y.M.; Wu, N.C.; Guse, B.; Fohrer, N. Distinct indicators of land use and hydrology characterize different aspects of riverine phytoplankton communities. Sci. Total Environ. 2022, 851, 158209. [Google Scholar] [CrossRef]
  35. Paul, W.J.; Hamilton, D.P.; Ostrovsky, I.; Miller, S.D.; Zhang, A.; Muraoka, K. Catchment land use and trophic state impacts on phytoplankton composition: A case study from the Rotorua lakes’ district, New Zealand. Hydrobiologia 2012, 698, 133–146. [Google Scholar] [CrossRef]
  36. Kim, J.H.; Lee, D.H.; Kang, J.H. Associating the spatial properties of a watershed with downstream Chl-a concentration using spatial analysis and generalized additive models. Water Res. 2019, 154, 387–401. [Google Scholar] [CrossRef]
  37. Doubek, J.P.; Carey, C.C.; Cardinale, B.J. Anthropogenic land use is associated with N-fixing cyanobacterial dominance in lakes across the continental United States. Aquat Sci. 2015, 77, 681–694. [Google Scholar] [CrossRef]
  38. Peng, X.; Zhang, L.; Li, Y.; Lin, Q.W.; He, C.; Huang, S.Z.; Li, H.; Zhang, X.Y.; Liu, B.Y.; Ge, F.J.; et al. The changing characteristics of phytoplankton community and biomass in subtropical shallow lakes: Coupling effects of land use patterns and lake morphology. Water Res. 2021, 200, 117235. [Google Scholar] [CrossRef] [PubMed]
  39. Shi, P.; Zhang, Y.; Li, Z.B.; Li, P.; Xu, G.C. Influence of land use and land cover patterns on seasonal water quality at multi-spatial scales. Catena 2016, 151, 182–190. [Google Scholar] [CrossRef]
  40. Deng, X.J. Influence of water body area on water quality in the southern Jiangsu Plain, eastern China. J. Clean. Prod. 2020, 254, 120136. [Google Scholar] [CrossRef]
  41. Popa, C.L.; Bretcan, P.; Radulescu, C.; Carstea, E.M.; Tanislav, D.; Dontu, S.I.; Dulama, I.D. Spatial distribution of groundwater quality in connection with the surrounding land use and anthropogenic activity in rural areas. Acta Montan. Slovaca 2019, 24, 73–87. [Google Scholar]
Figure 1. Distribution of sampling sites in Lake Chenyao and Lake Fengsha study area.
Diversity 15 00180 g001
Figure 2. Distribution and proportion of land use types around Lake Chenyao and Lake Fengsha.
Diversity 15 00180 g002
Figure 3. Variation in the relative density of different phytoplankton taxa and total phytoplankton density and biomass in different months. (a): Total cell density of phytoplankton in Lake Chenyao, (b): Total cell density of phytoplankton in Lake Fengsha, (c): biomass of phytoplankton in Lake Chenyao, (d): biomass of phytoplankton in Lake Fengsha. Abbreviations were used in the diagram: Bac: Bacillariophyta, Pyr: Pyrrophyta, Chr: Chrysophyta, Cya: Cyanophyta, Eug: Euglenophyta, Cry: Cryptophyta, Xan: Xanthophyta, Chl: Chlorophyta.
Diversity 15 00180 g003
Figure 4. Spatial distribution of annual average density and biomass of phytoplankton in Lake Chenyao and Lake Fengsha (×107). (a): Annual average density distribution of phytoplankton in Lake Chenyao and Lake Fengsha, (b): Annual average biomass distribution of phytoplankton in Lake Chenyao and Lake Fengsha.
Diversity 15 00180 g004
Figure 5. RDA analysis ranking the density of dominant phytoplankton species (hollow arrows) and environmental factors (red lines with arrowhead) in the surrounding area of Lake Chenyao (a) and Lake Fengsha (b). Abbreviations was used in the diagram: P. tenue: Phormidium tenue, O. tenuis: Oscillatoria tenuis, A. azotica: Anabaena azotica, D. circinale: Dolichospermum circinale, M. aeruginsa: Microcystis aeruginsa, M. minima: Merismopedia minima, A. thermalis: Aphanocapsa thermalis, M. sinica: Merismopedia sinica; A. granulata: Aulacoseira granulata; A. granulata var. angustissima: Aulacoseira granulata var. angustissima, U. acus: Ulnaria acus, D. communis: Desmodemus communis, C. arcuata: Comasiella arcuata, T. lagerheimii: Tetradesmus lagerheimii, L. oxyuris: Lepocinclis oxyuris.
Diversity 15 00180 g005
Table 1. Physicochemical factors of Lake Chenyao and Lake Fengsha (mean ± standard deviation).
Water Quality ParametersLake ChenyaoLake Fengshap
WT (°C)18.14 ± 7.85 (6.50~29.10)18.99 ± 7.92 (6.80~28.50)-
pH6.57 ± 1.35 (4.07~8.09)7.10 ± 1.14 (5.17~8.41)*
DO (mg/L)8.22 ± 1.85 (3.78~11.32)10.32 ± 1.03 (7.96~11.53)**
EC (μs/cm)196.27 ± 60.27 (130.50~332.00)207.05 ± 94.32 (99.50~362.0)-
SD (m)0.25 ± 0.09 (0.05~0.40)0.32 ± 0.13 (0.10~0.54)-
WD (m)1.31 ± 0.68 (0.30~2.60)1.86 ± 1.00 (0.45~3.40)-
Turb (NTU)27.37 ± 32.80 (7.93~191.00)35.21 ± 42.0 (4.52~179.00)-
TN (mg/L)1.26 ± 0.19 (0.95~1.60)1.04 ± 0.14 (0.70~1.21)*
TP (mg/L)0.31 ± 0.22 (0.02~0.68)0.18 ± 0.14 (0.03~0.66)*
NH4+-N (mg/L)0.78 ± 0.29 (0.32~1.87)0.57 ± 0.21 (0.16~1.34)**
N03-N (mg/L)0.41 ± 0.43 (0.01~1.65)0.36 ± 0.32 (0.01~0.94)-
Chl a (μg/L)8.89 ± 7.24 (4.39~23.93)7.88 ± 7.09 (1.84~29.81)*
* p < 0.05 represents a significant difference at the 0.05 level (both sides); ** p < 0.01 represents a significant difference at the 0.01 level (both sides). The values before and after ~ represent the minimum and maximum values of the physicochemical parameters of water quality, respectively.
Table 2. Dominant species and dominance of phytoplankton in Lake Chenyao and Lake Fengsha in different months.
SpeciesSpecies Dominance of Lake Chenyao (Y)Species Dominance of Lake Fengsha (Y)
MarAprJunAugNovDecMarAprJunAugNovDec
Phormidium tenue0.0540.1040.4370.3050.068 0.1380.2030.329 0.3730.195
Oscillatoria tenuis0.4040.5990.030.3380.072 0.0680.1670.0620.1890.0480.033
Anabaena azotica 0.0440.1150.064 0.2290.2580.0220.084
Dolichospermum circinale 0.0220.0470.060.041 0.0900.027
Microcystis aeruginsa 0.0340.0540.0240.071 0.0610.367
Merismopedia minima 0.1330.0380.2050.163 0.050.049
Aphanocapsa thermalis 0.036
Merismopedia sinica 0.166
Aulacoseira granulata0.1970.0330.060.0290.1490.1960.5180.117 0.125
Aulacoseira granulata var.
angustissima
0.114 0.045 0.0410.042
Ulnaria acus 0.0210.021
Desmodemus communis0.0560.07 0.044 0.0240.078
Comasiella arcuata0.030.021
Tetradesmus lagerheimii 0.023
Lepocinclis oxyuris 0.041
Table 3. Relationship between the cell density and biomass of the phytoplankton and environmental factors in Lake Chenyao and Lake Fengsha.
ParameterLake ChenyaoLake Fengsha
Cell DensityBiomassCell DensityBiomass
rprprprp
WT0.814 *0.0490.5650.2430.819 *0.0460.6440.168
pH0.1320.8030.3140.544−0.060.910.1040.844
DO−0.810.051−0.5590.249−0.3720.467−0.2780.593
Turb−0.2610.617−0.3750.464−0.1140.83−0.2440.641
EC0.5630.2450.3560.4890.1510.775−0.1200.820
WD0.887 *0.0180.7370.0950.94 **0.0050.7920.060
Cond−0.0950.8570.1210.8200.1670.752−0.0800.880
TN0.844 *0.0340.895 *0.0160.1190.8220.4380.384
TP0.823 *0.0440.6310.1790.4930.3210.4790.337
AN0.3940.439−0.4460.375−0.6370.174−0.3650.476
Chl. a0.560.2470.4850.3290.2610.6180.2330.657
* p < 0.05 represents a significant difference at the 0.05 level (both sides); ** p < 0.01 represents a significant difference at the 0.01 level (both sides).
Disclaimer/Publisher’s Note: The statements, opinions and data contained in all publications are solely those of the individual author(s) and contributor(s) and not of MDPI and/or the editor(s). MDPI and/or the editor(s) disclaim responsibility for any injury to people or property resulting from any ideas, methods, instructions or products referred to in the content.

