
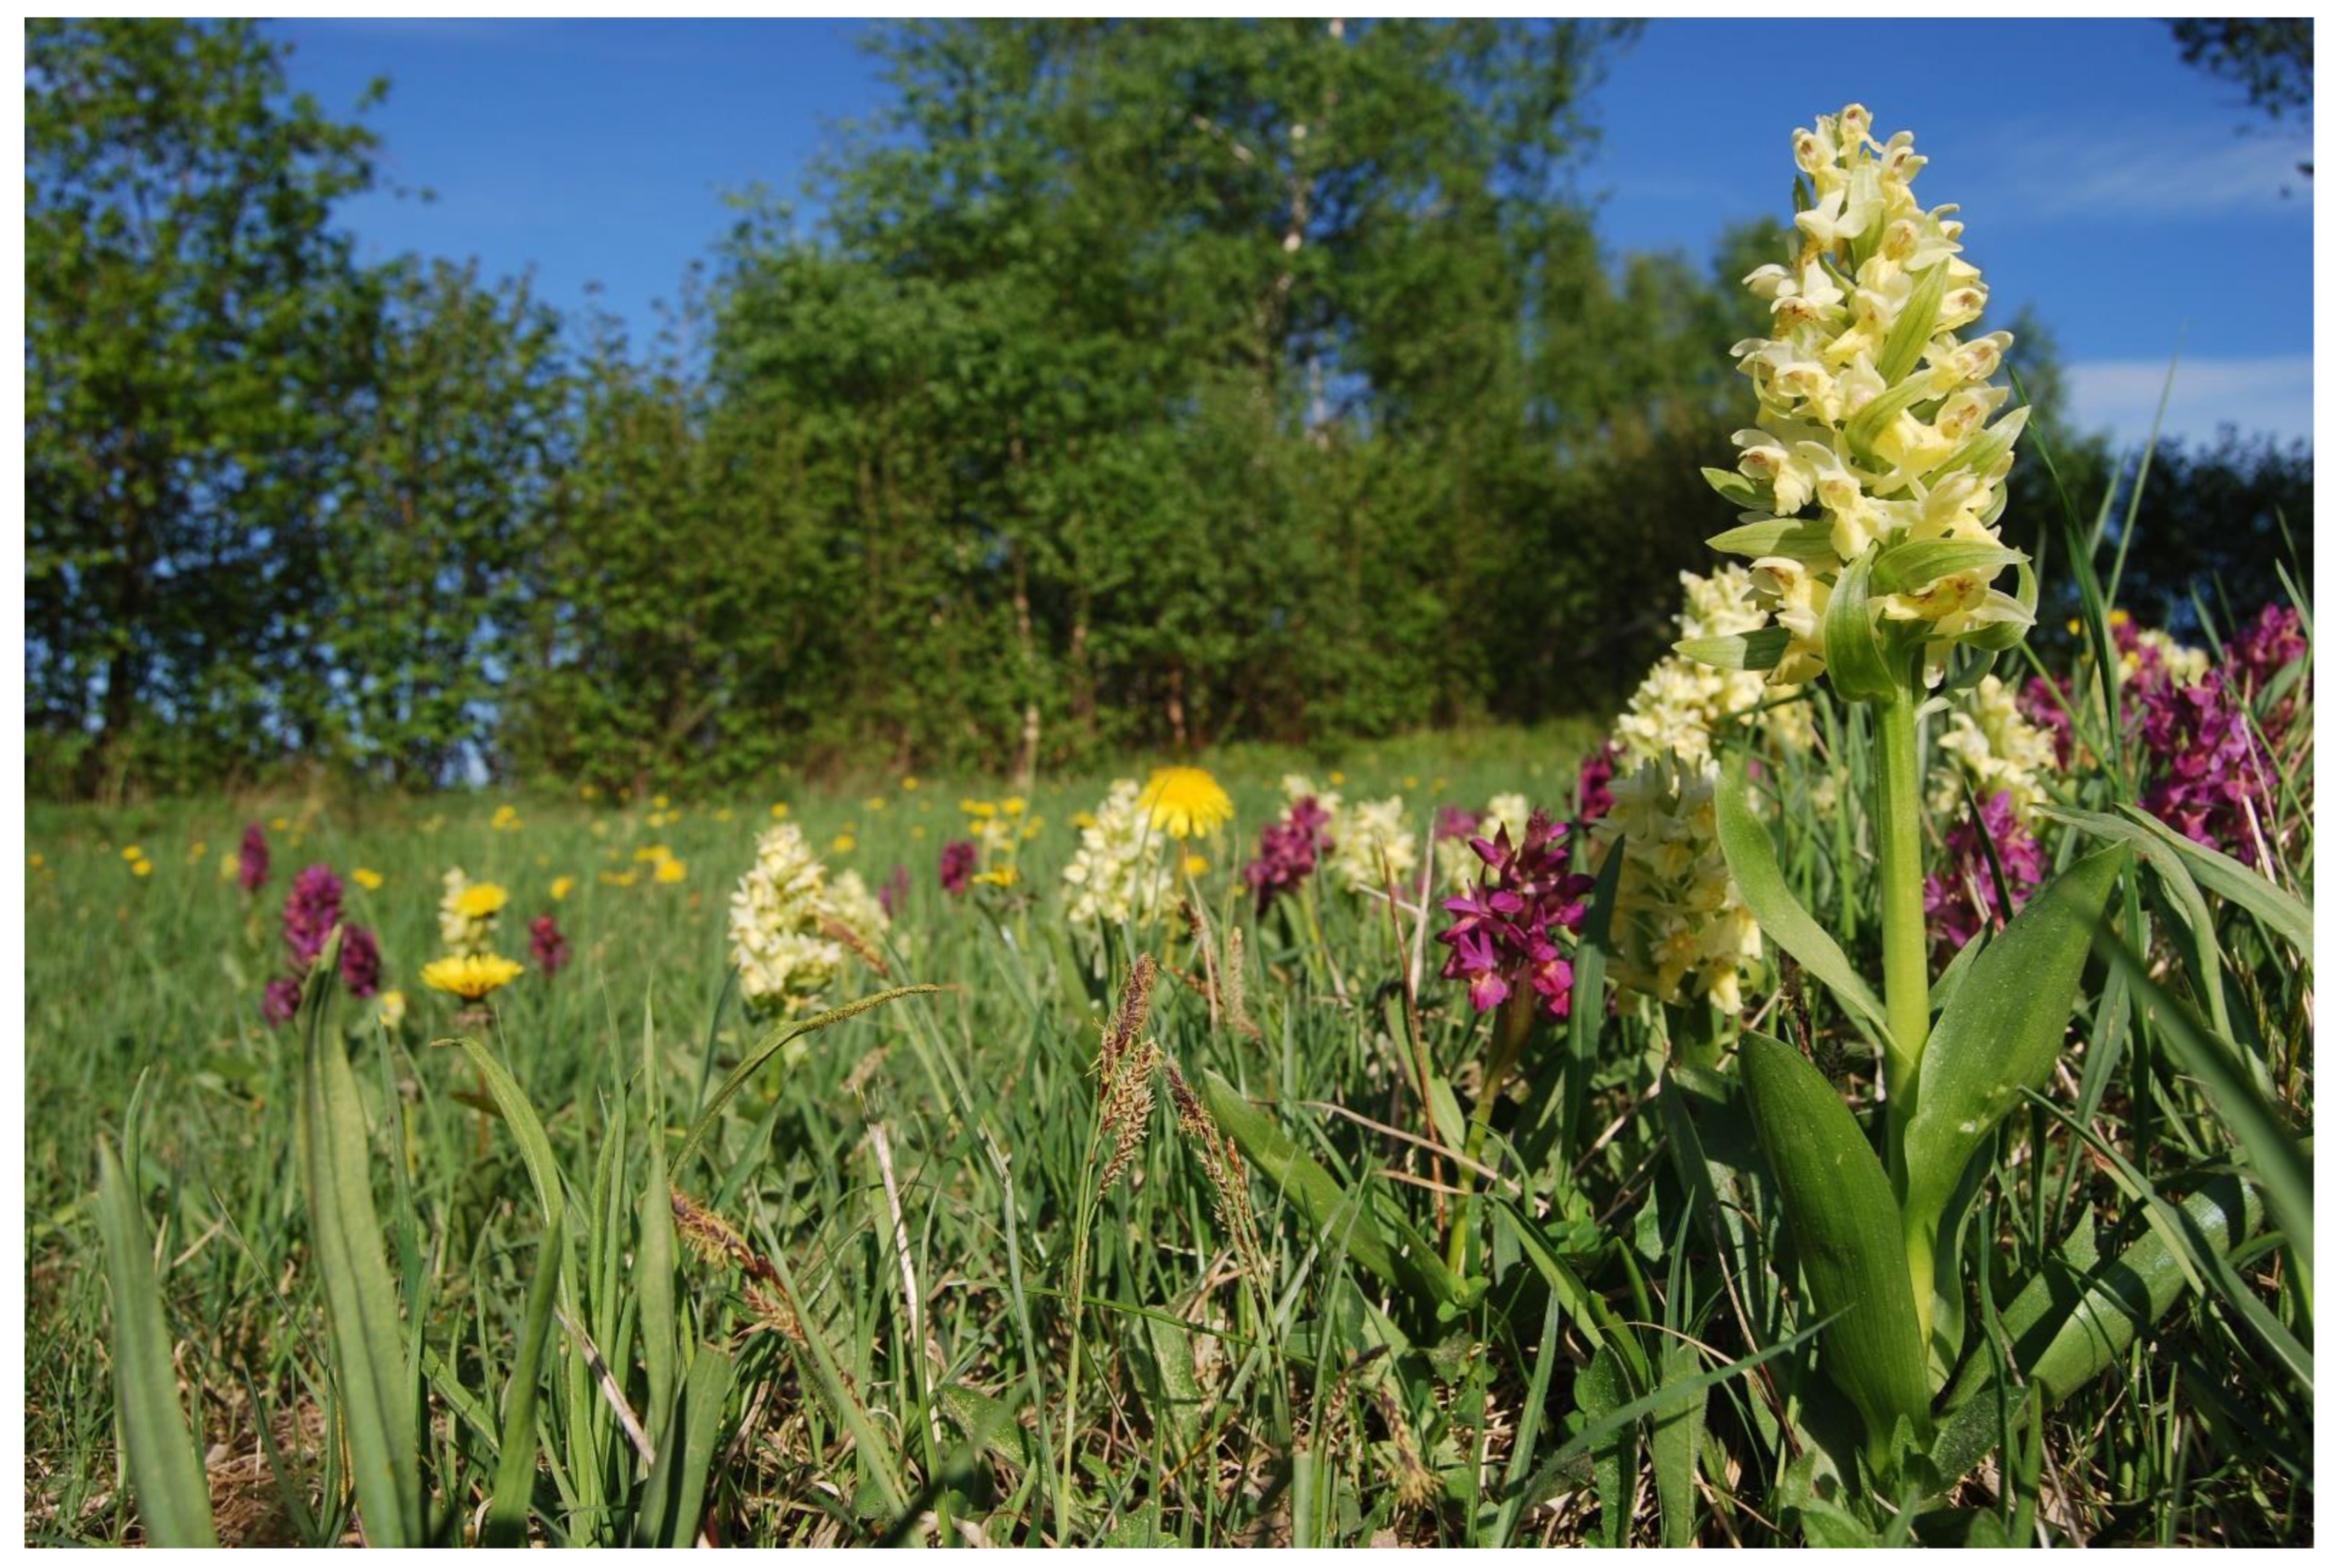
Monitoring of Dactylorhiza sambucina (L.) Soó (Orchidaceae)—Variation in Flowering, Flower Colour Morph Frequencies, and Erratic Population Census Trends

Abstract
:1. Introduction
- (1)
- To what extent do the population census data in D. sambucina vary over time and how is this variation affecting flower colour morph frequencies?
- (2)
- Are there differences in the dominance of yellow or red morphs at local scale, which might not be explained by large-scale environmental parameters, such as altitude and/or climatic conditions?
- (3)
- Are shifts of the morph dominance observable in natural populations, and how might such shifts be explained?
- (4)
- As it has been proposed that NFDS could only be detected when the rare morph becomes extremely rare (<10% frequency), and otherwise being as rare would lead to an extremely high risk of extinction of this morph, we ask whether such low frequencies do exist in the wild?
2. Material and Methods
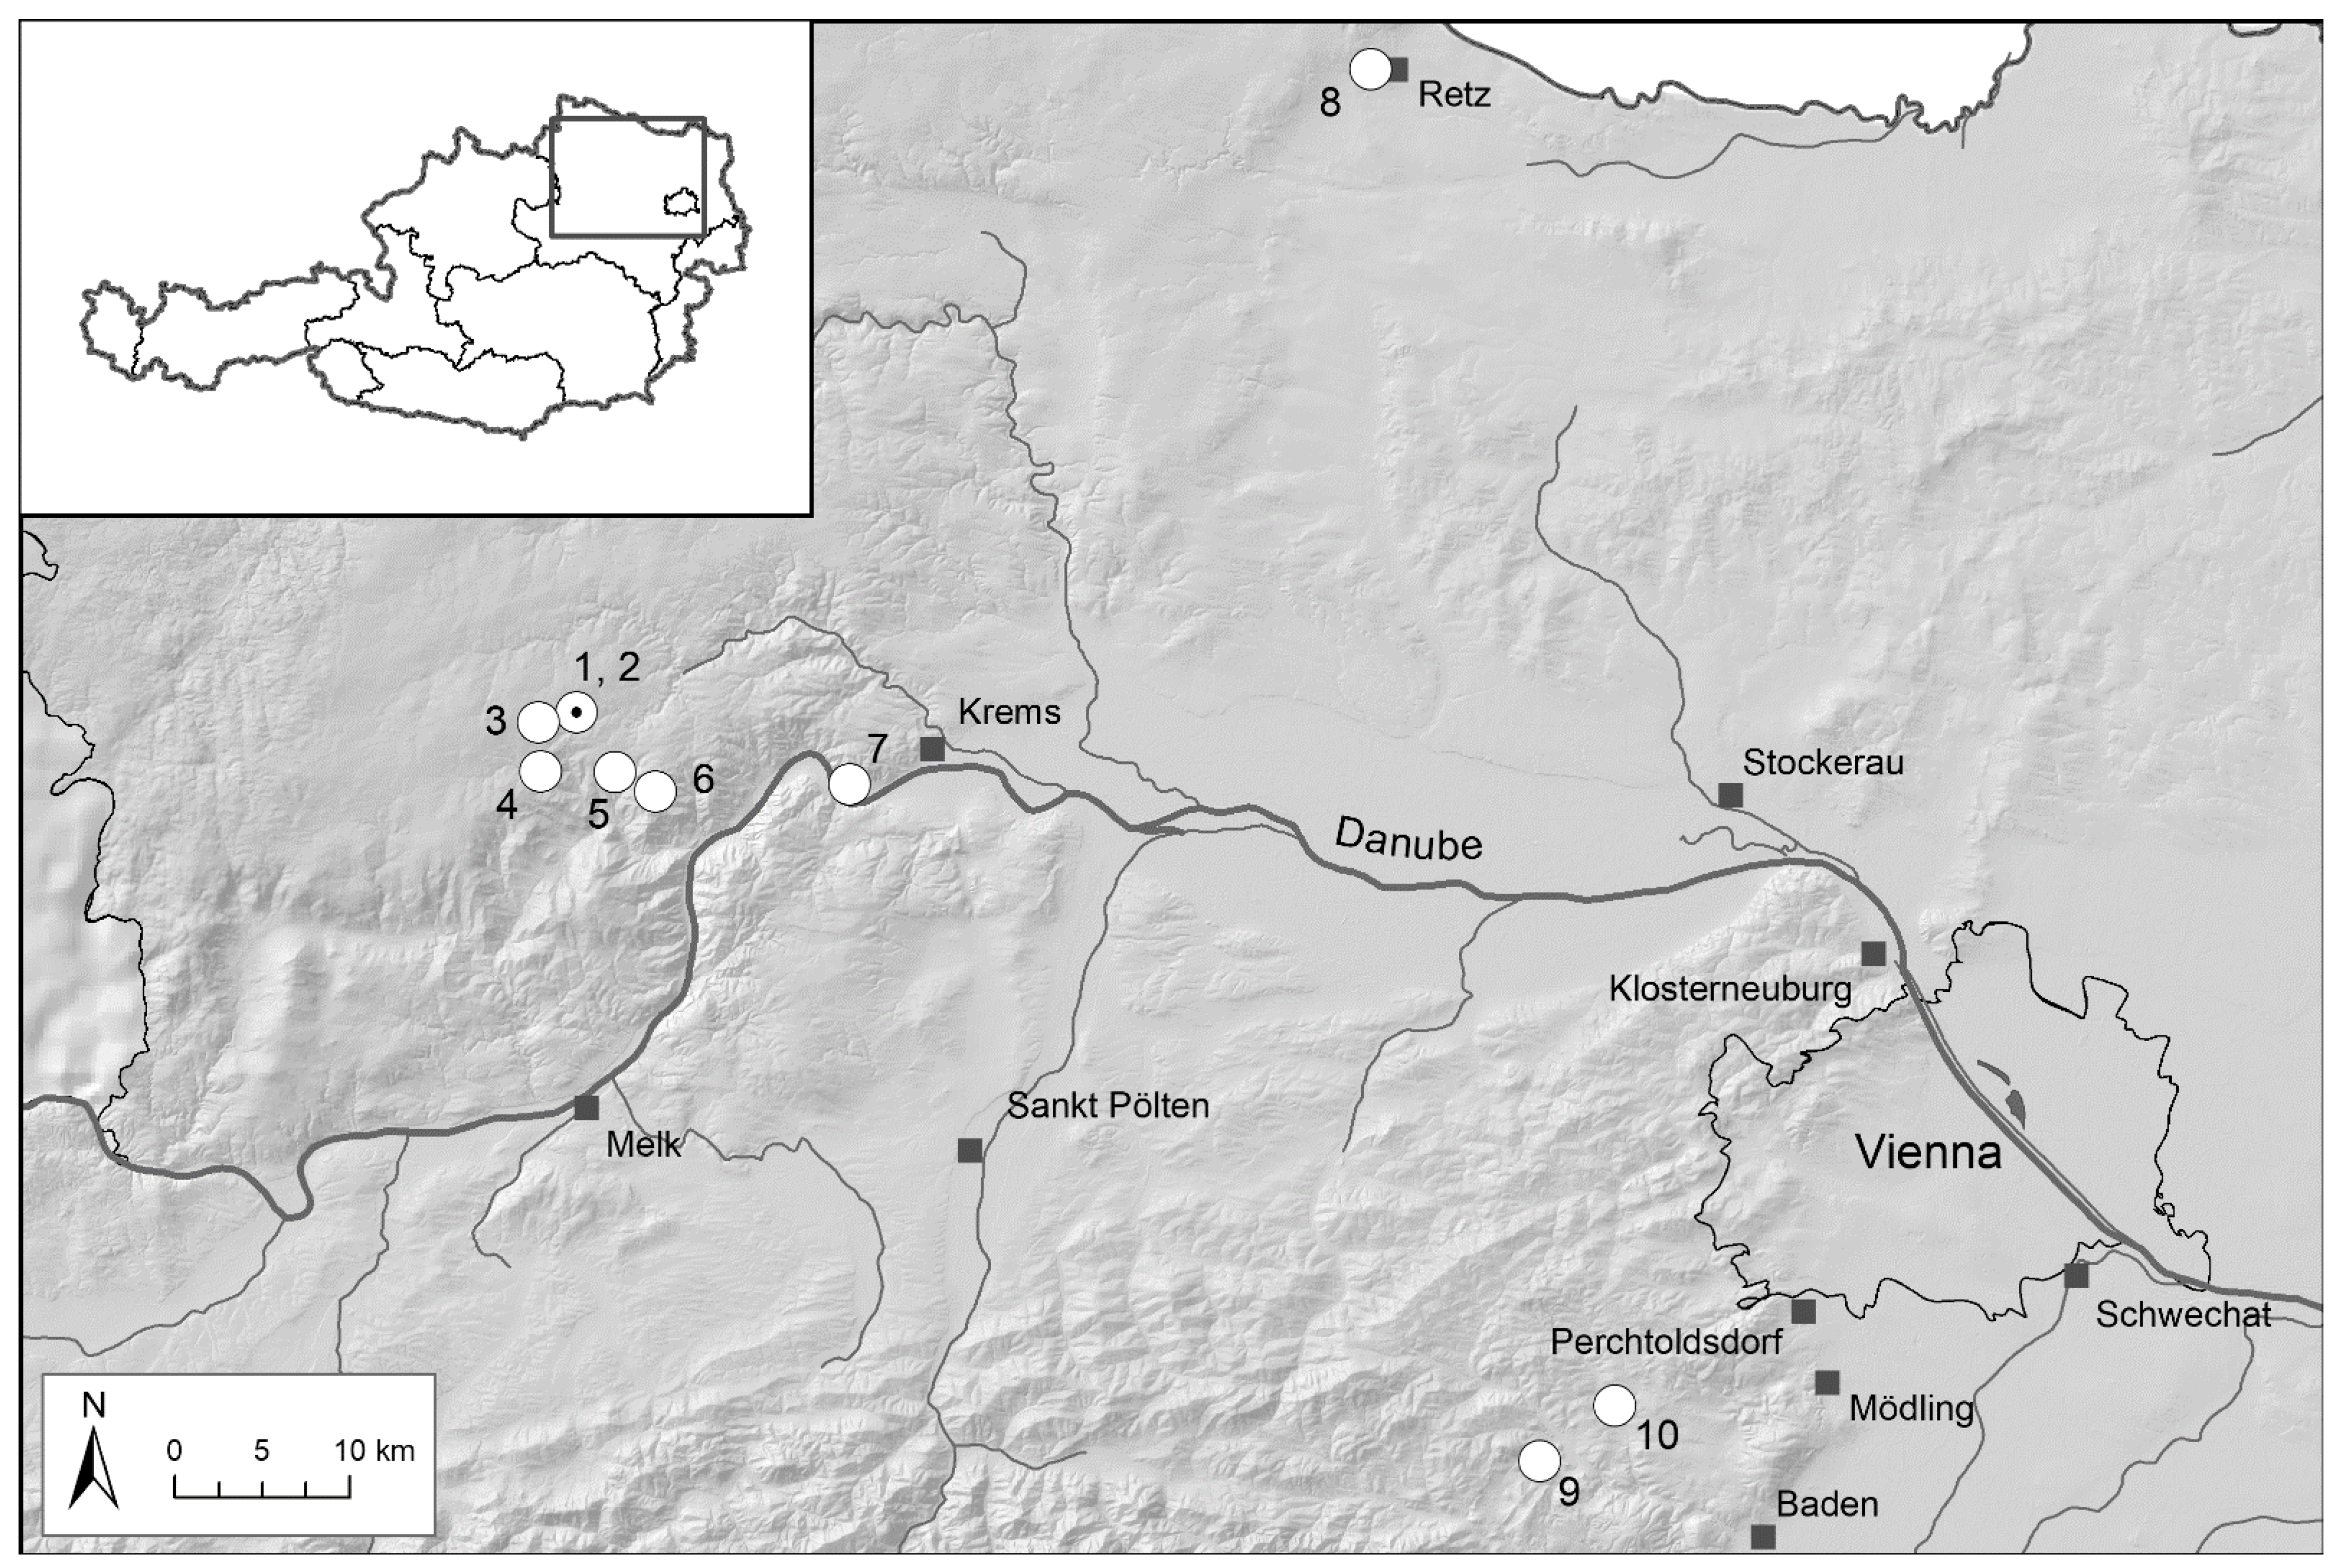
Study Regions
3. Results
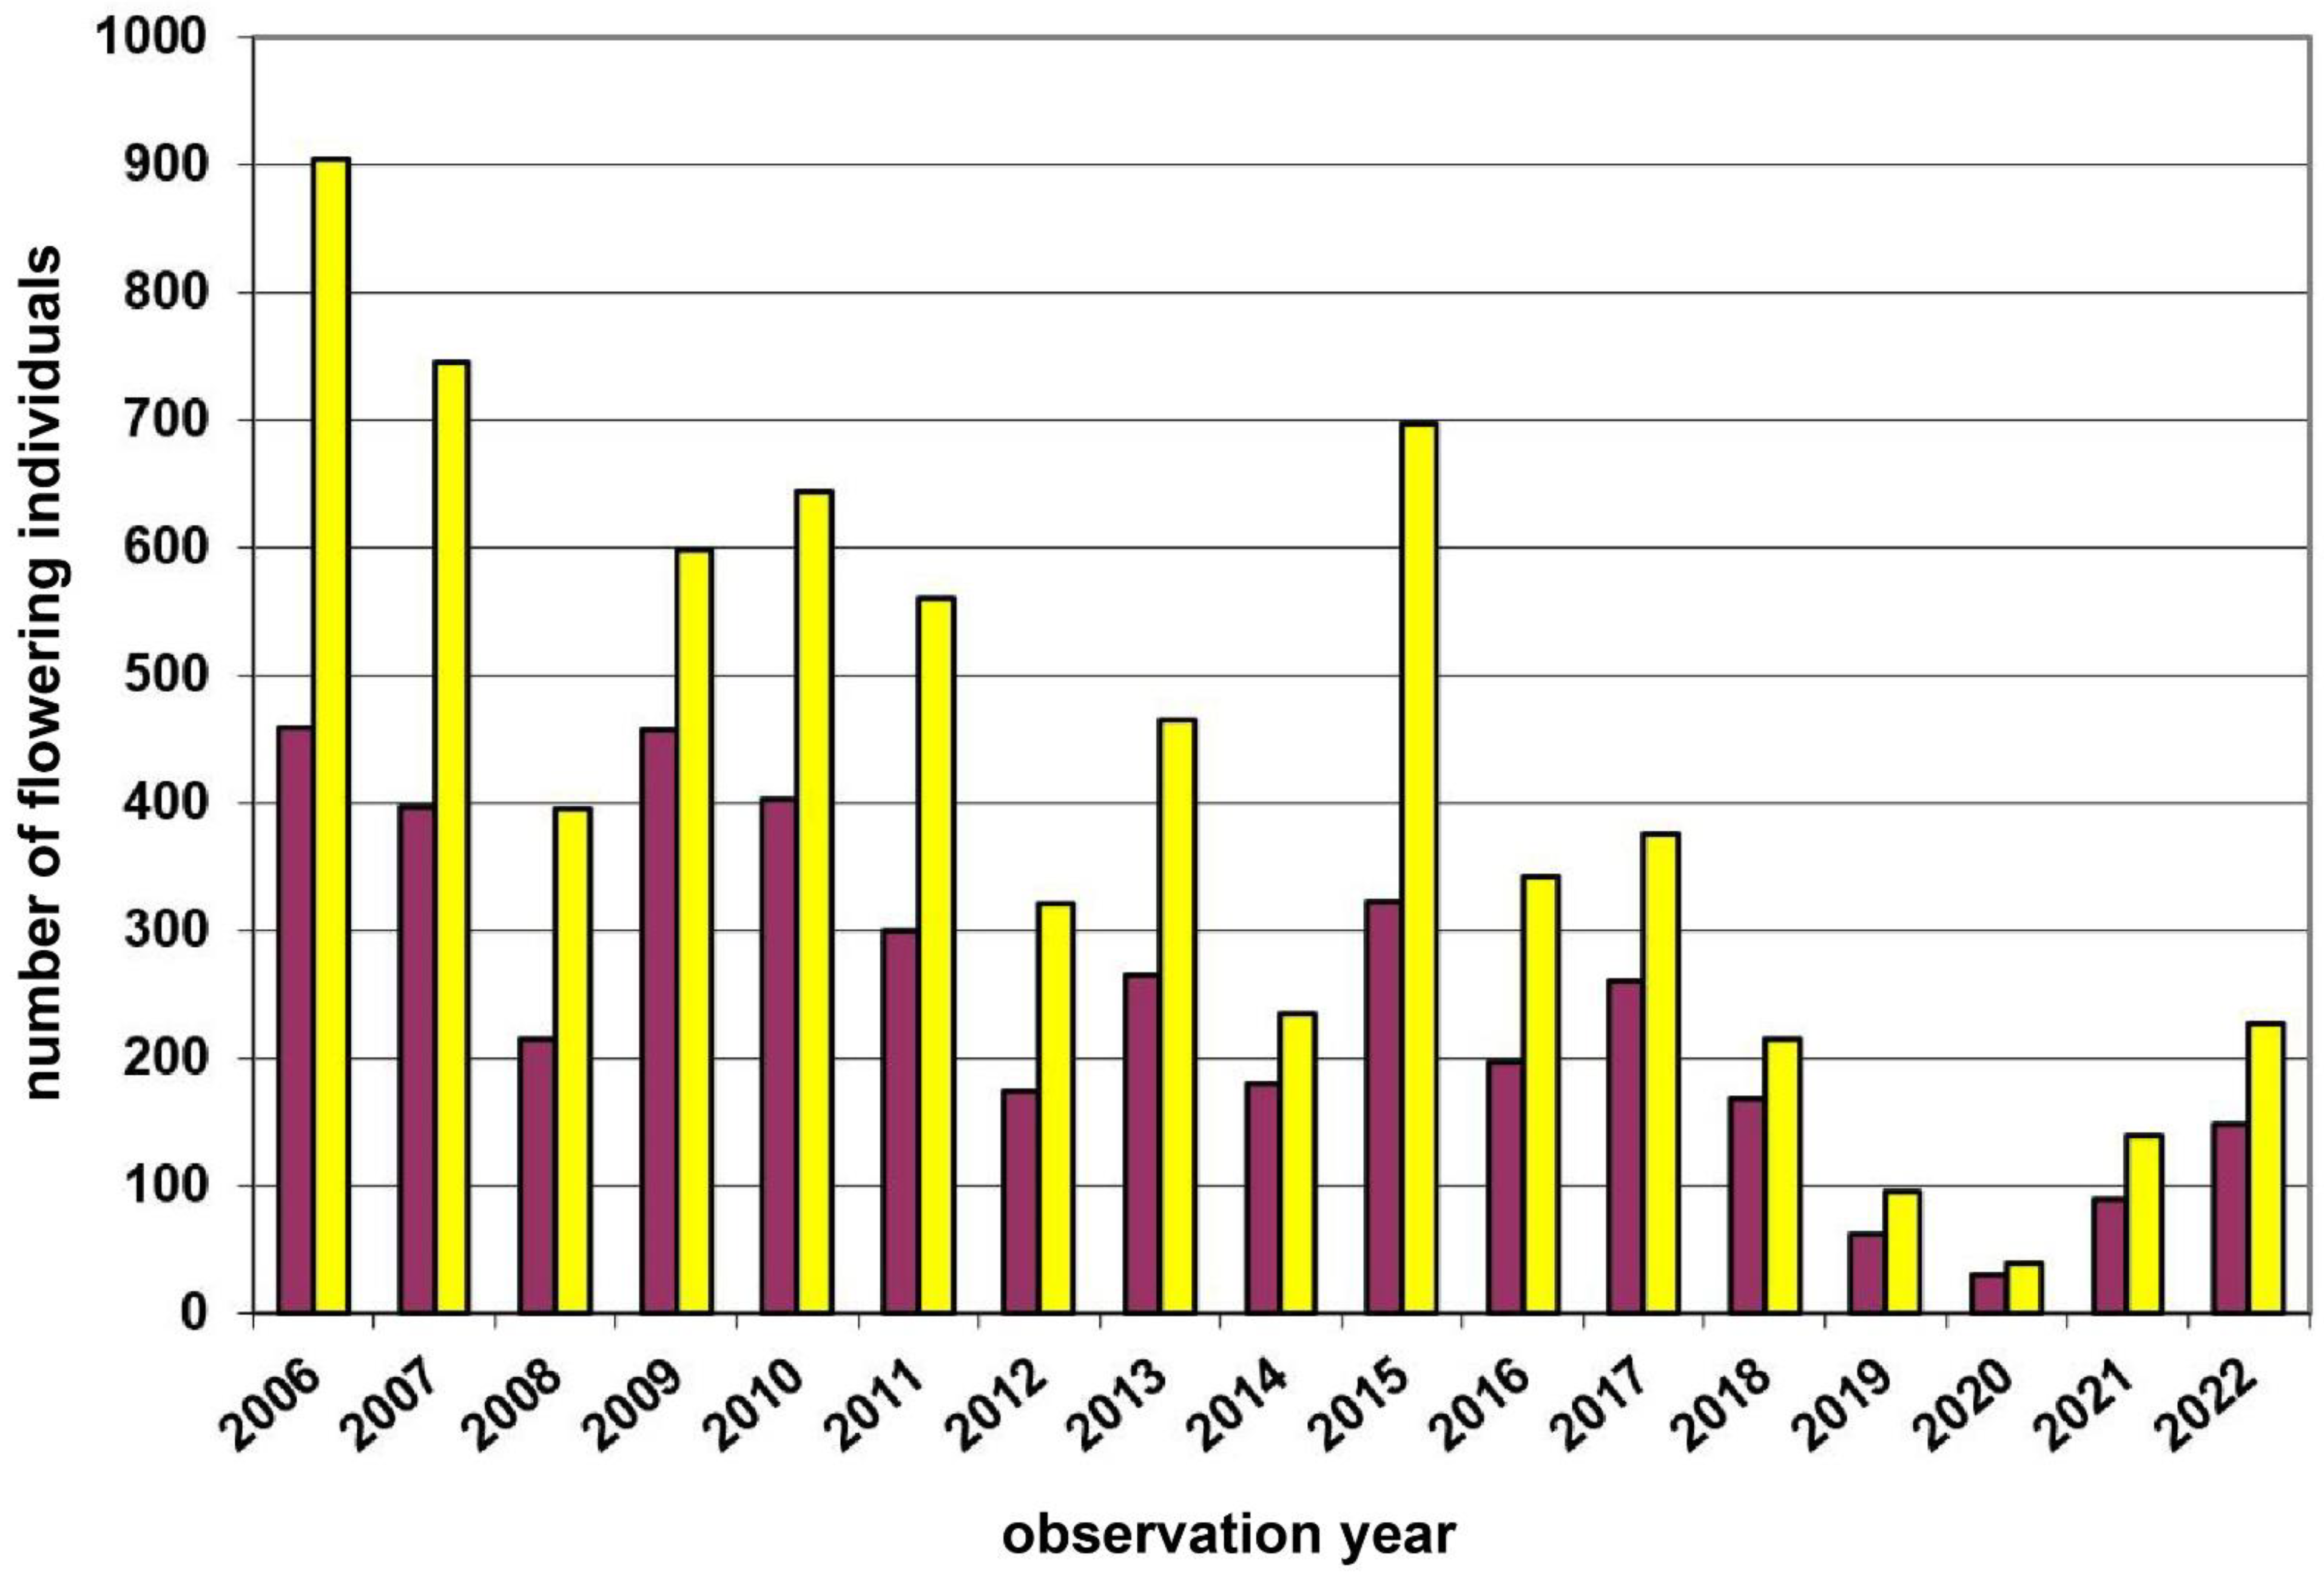
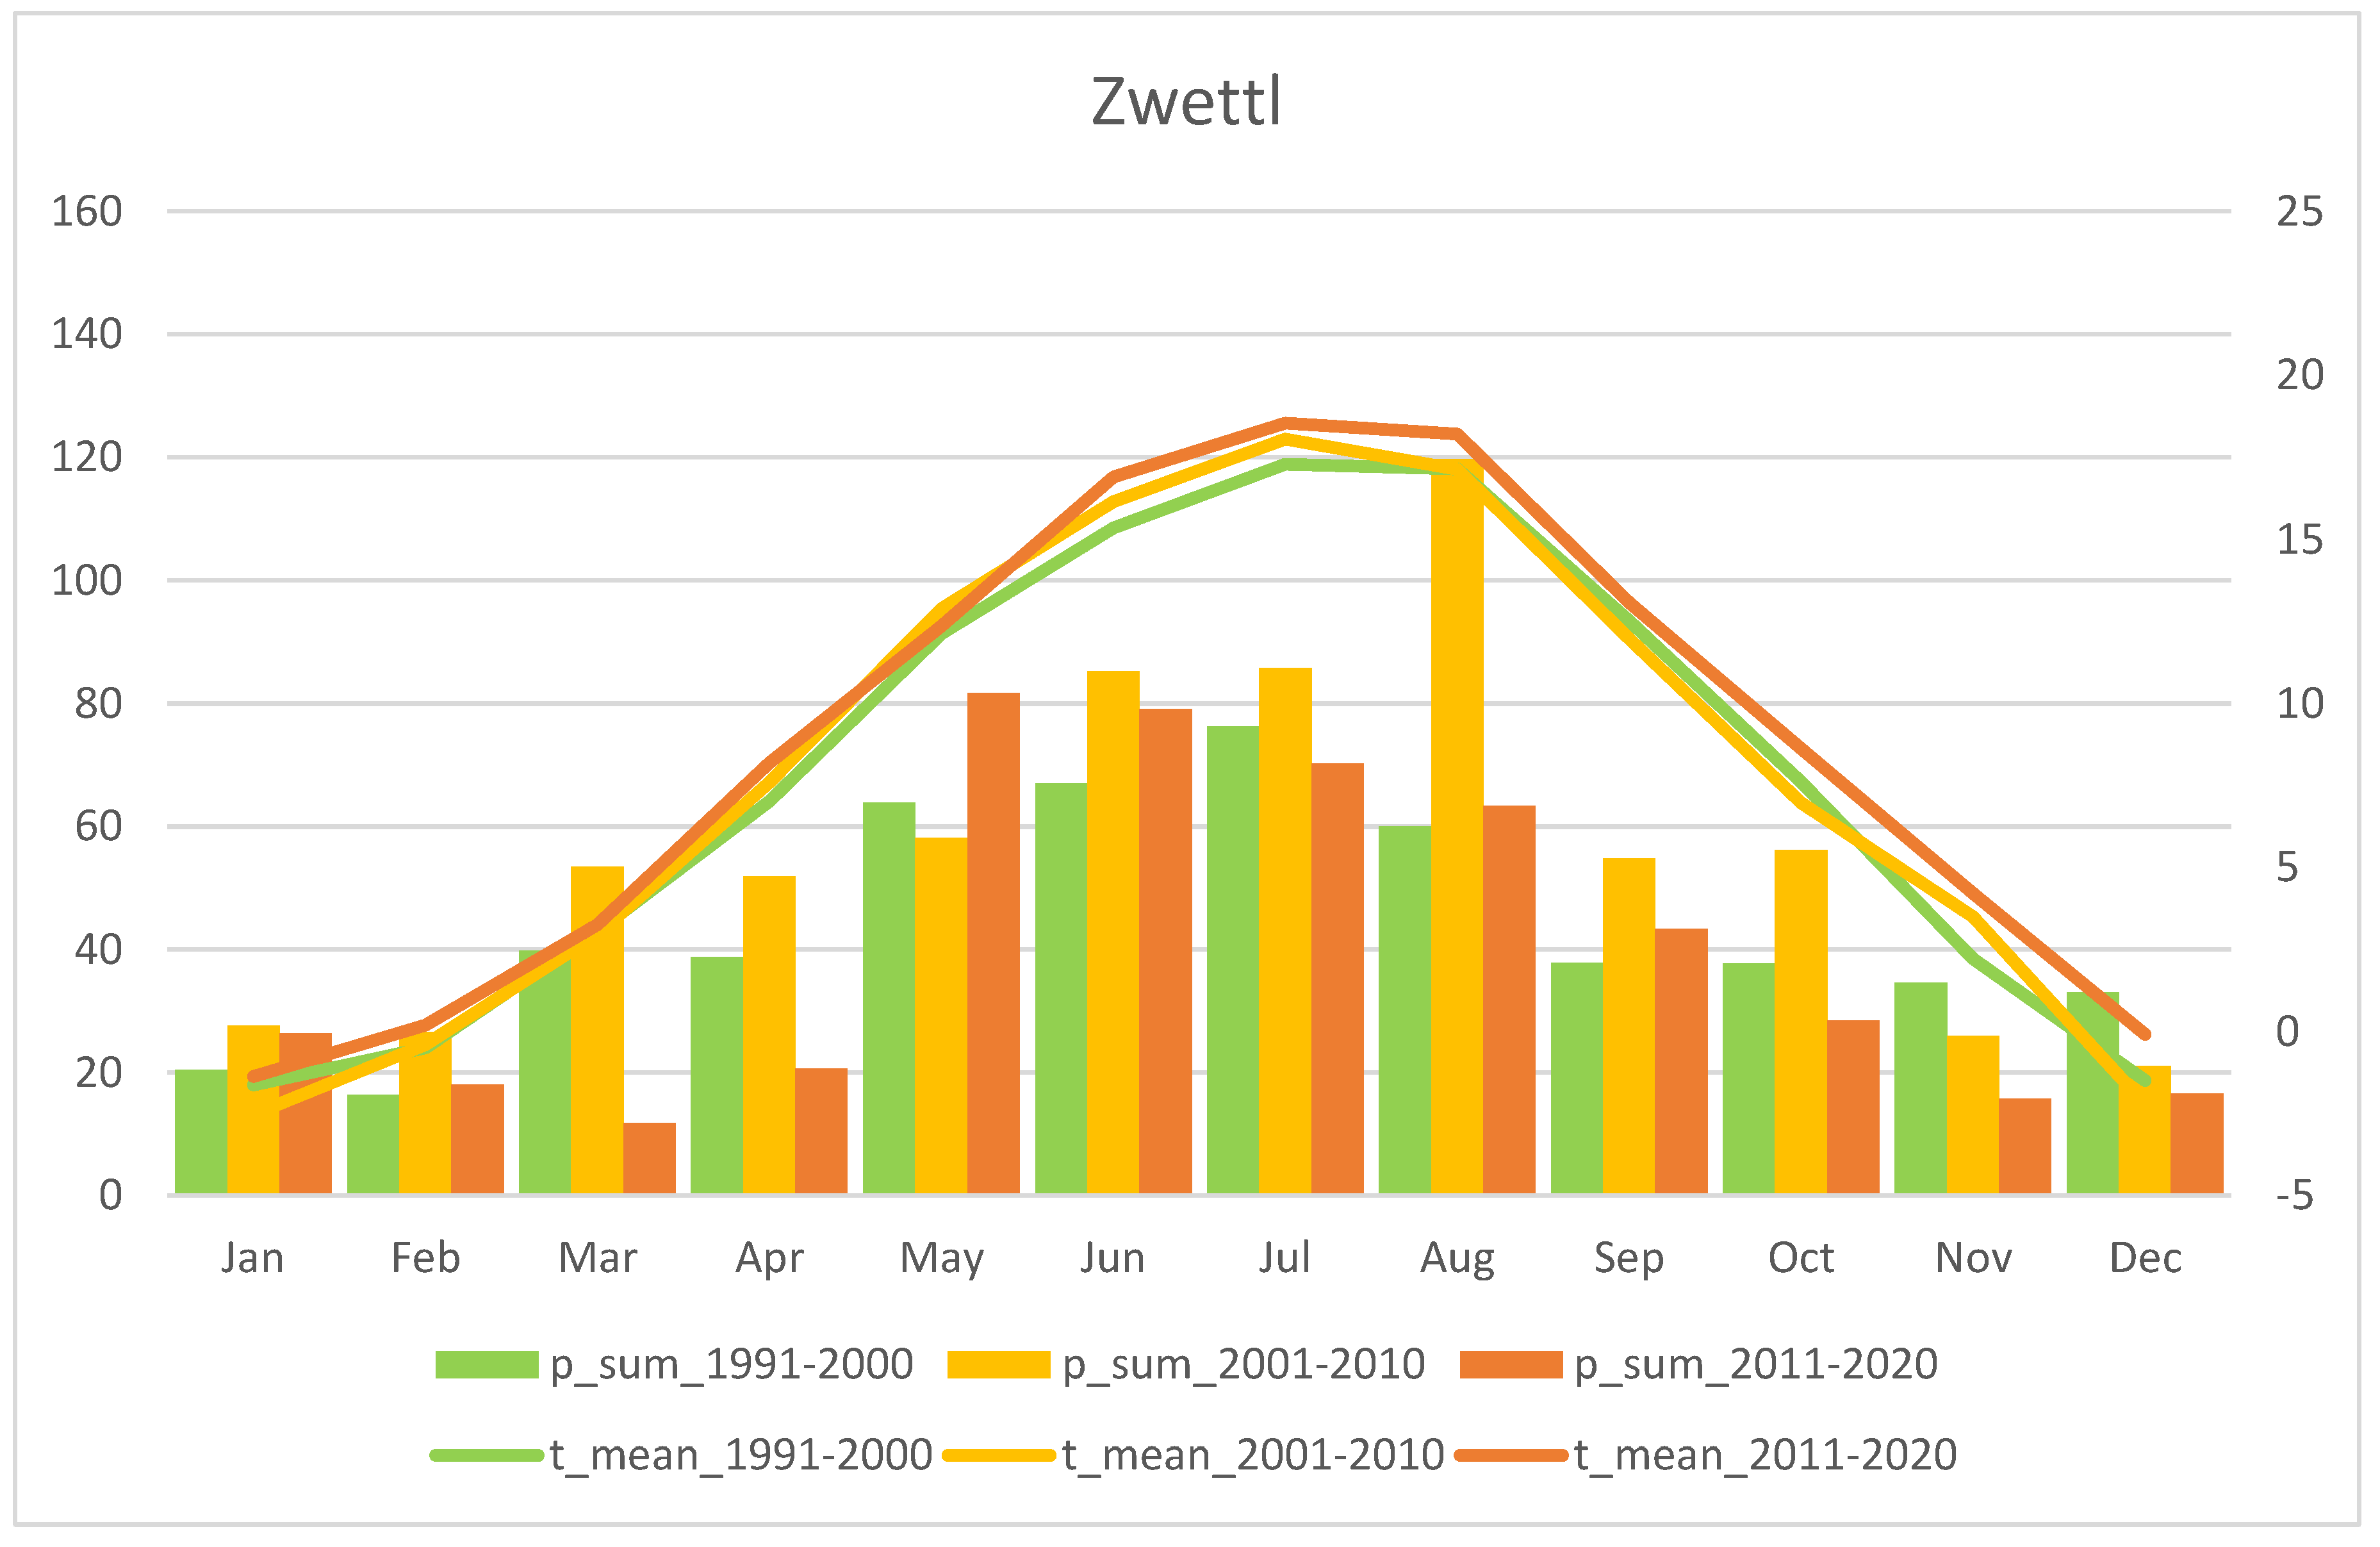
3.1. Study Region: Waldviertel
3.2. Study Region: Wachau
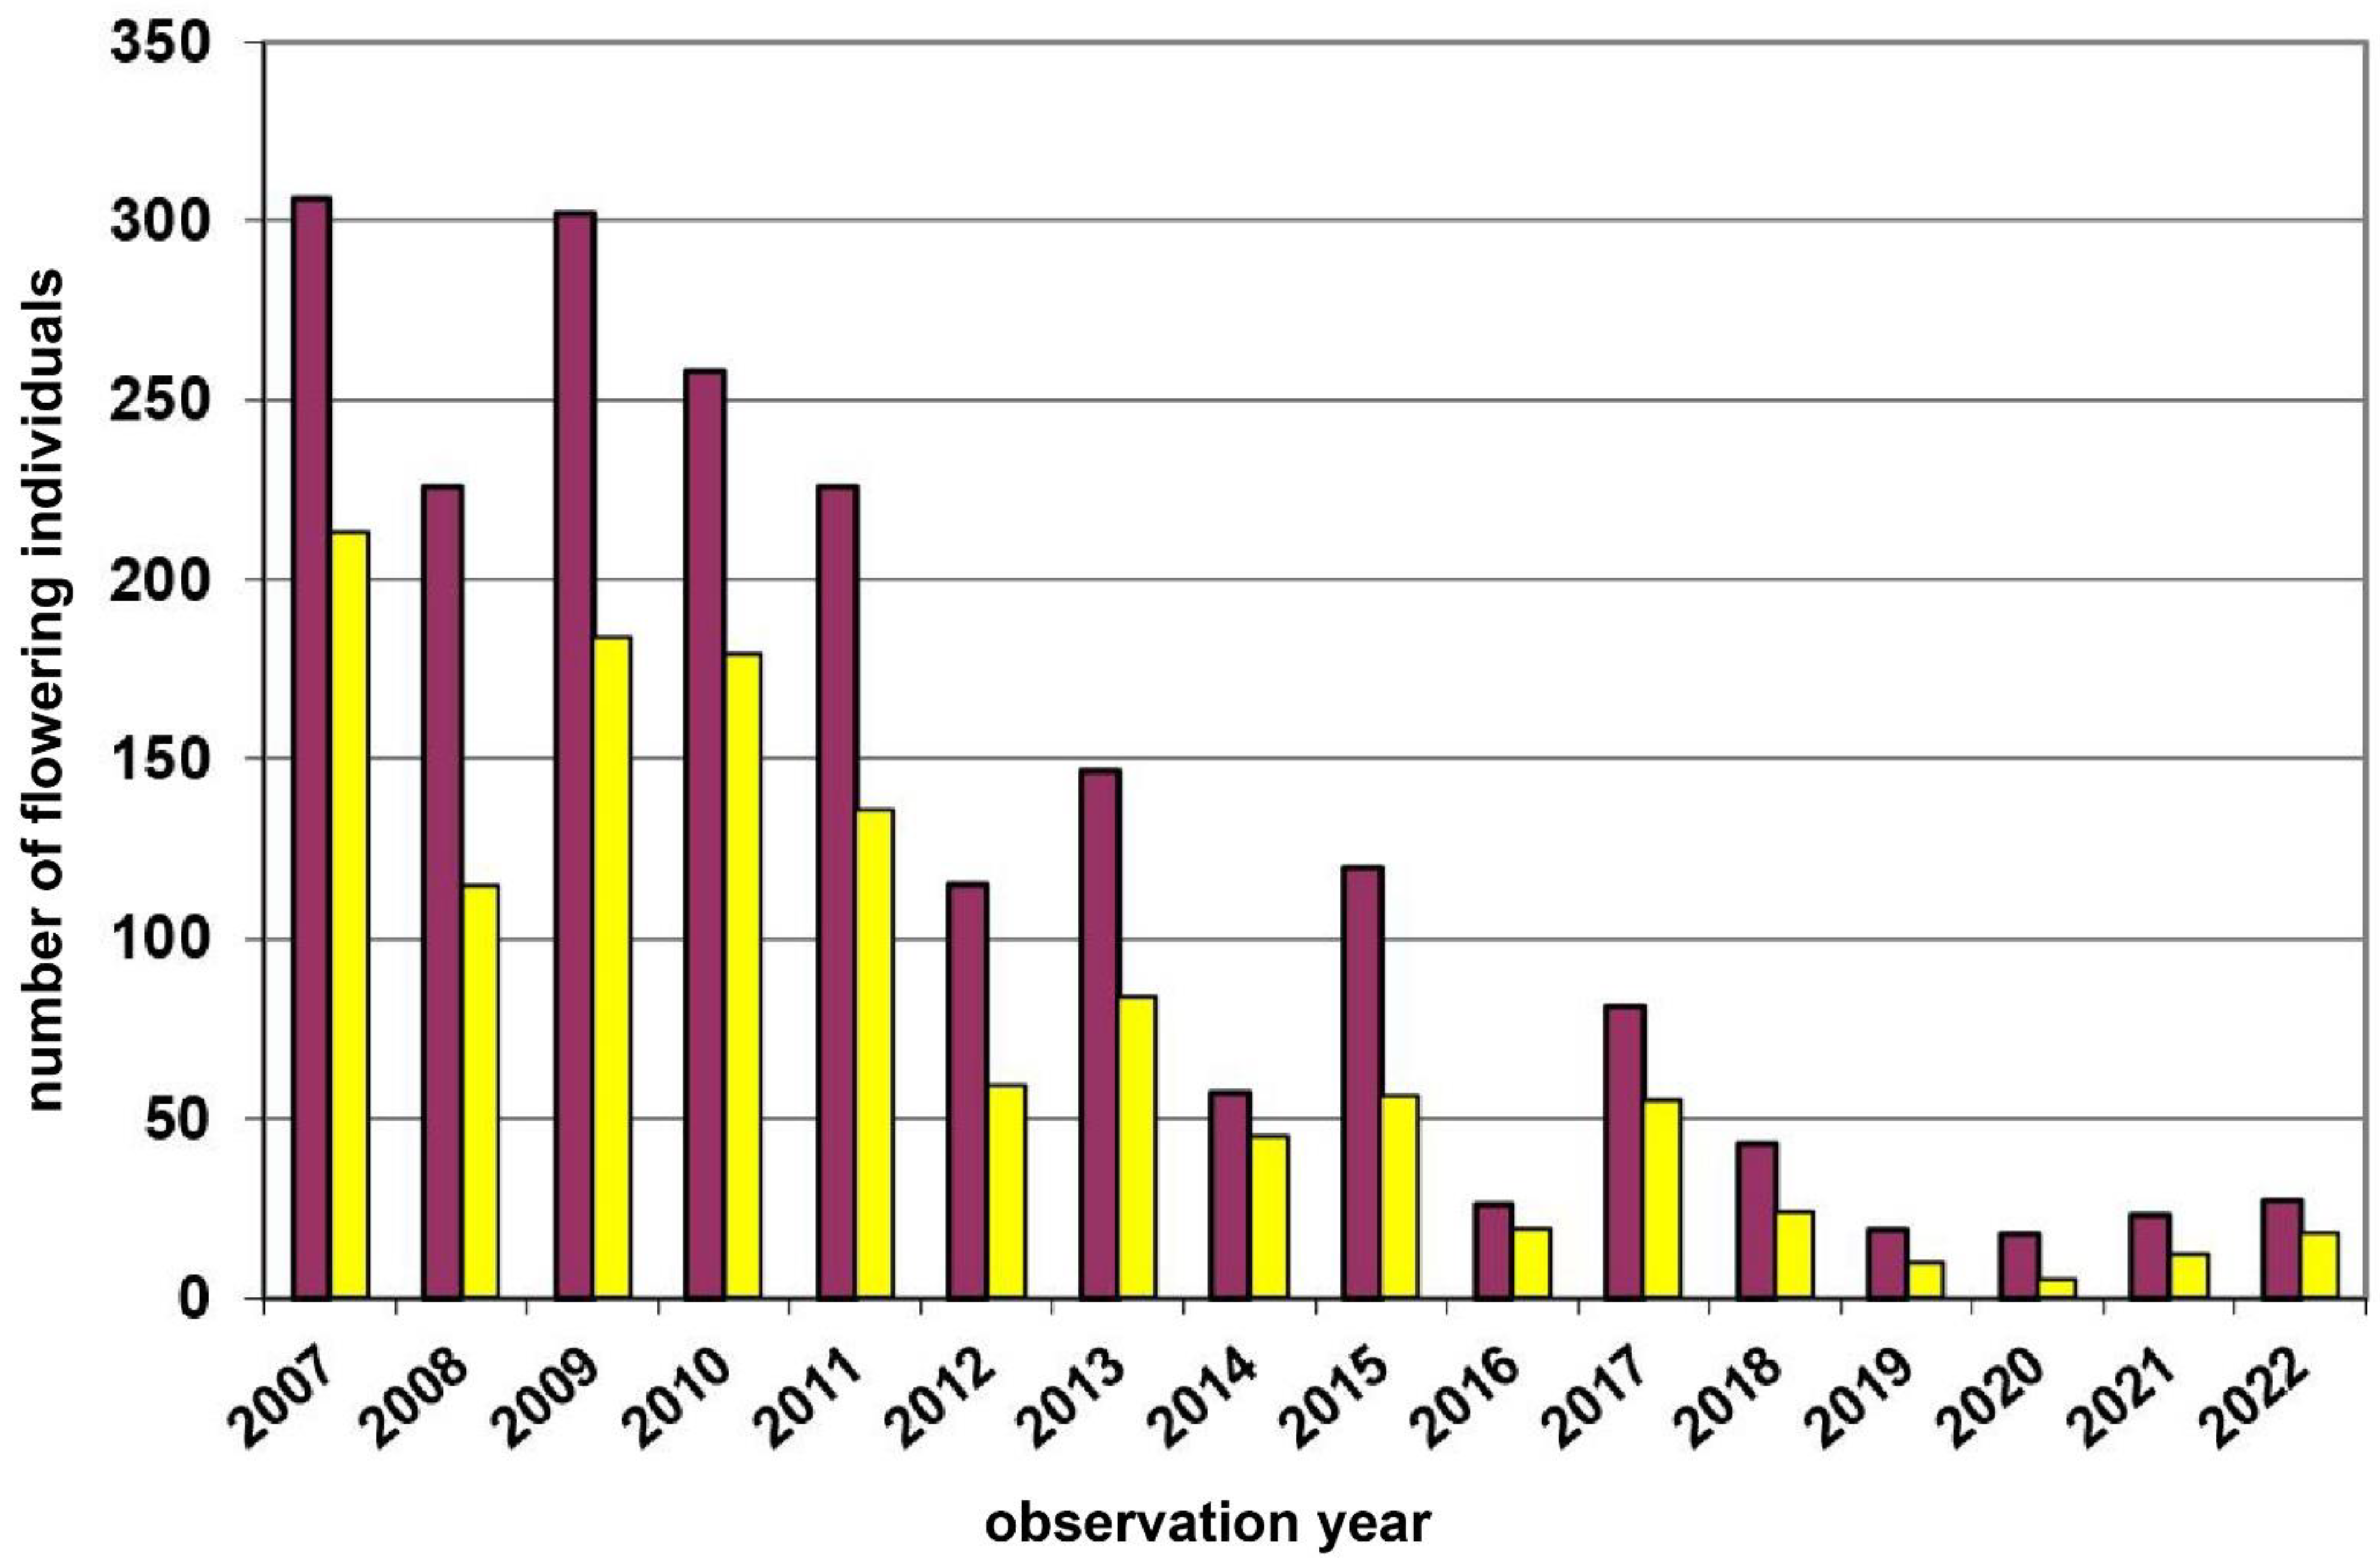
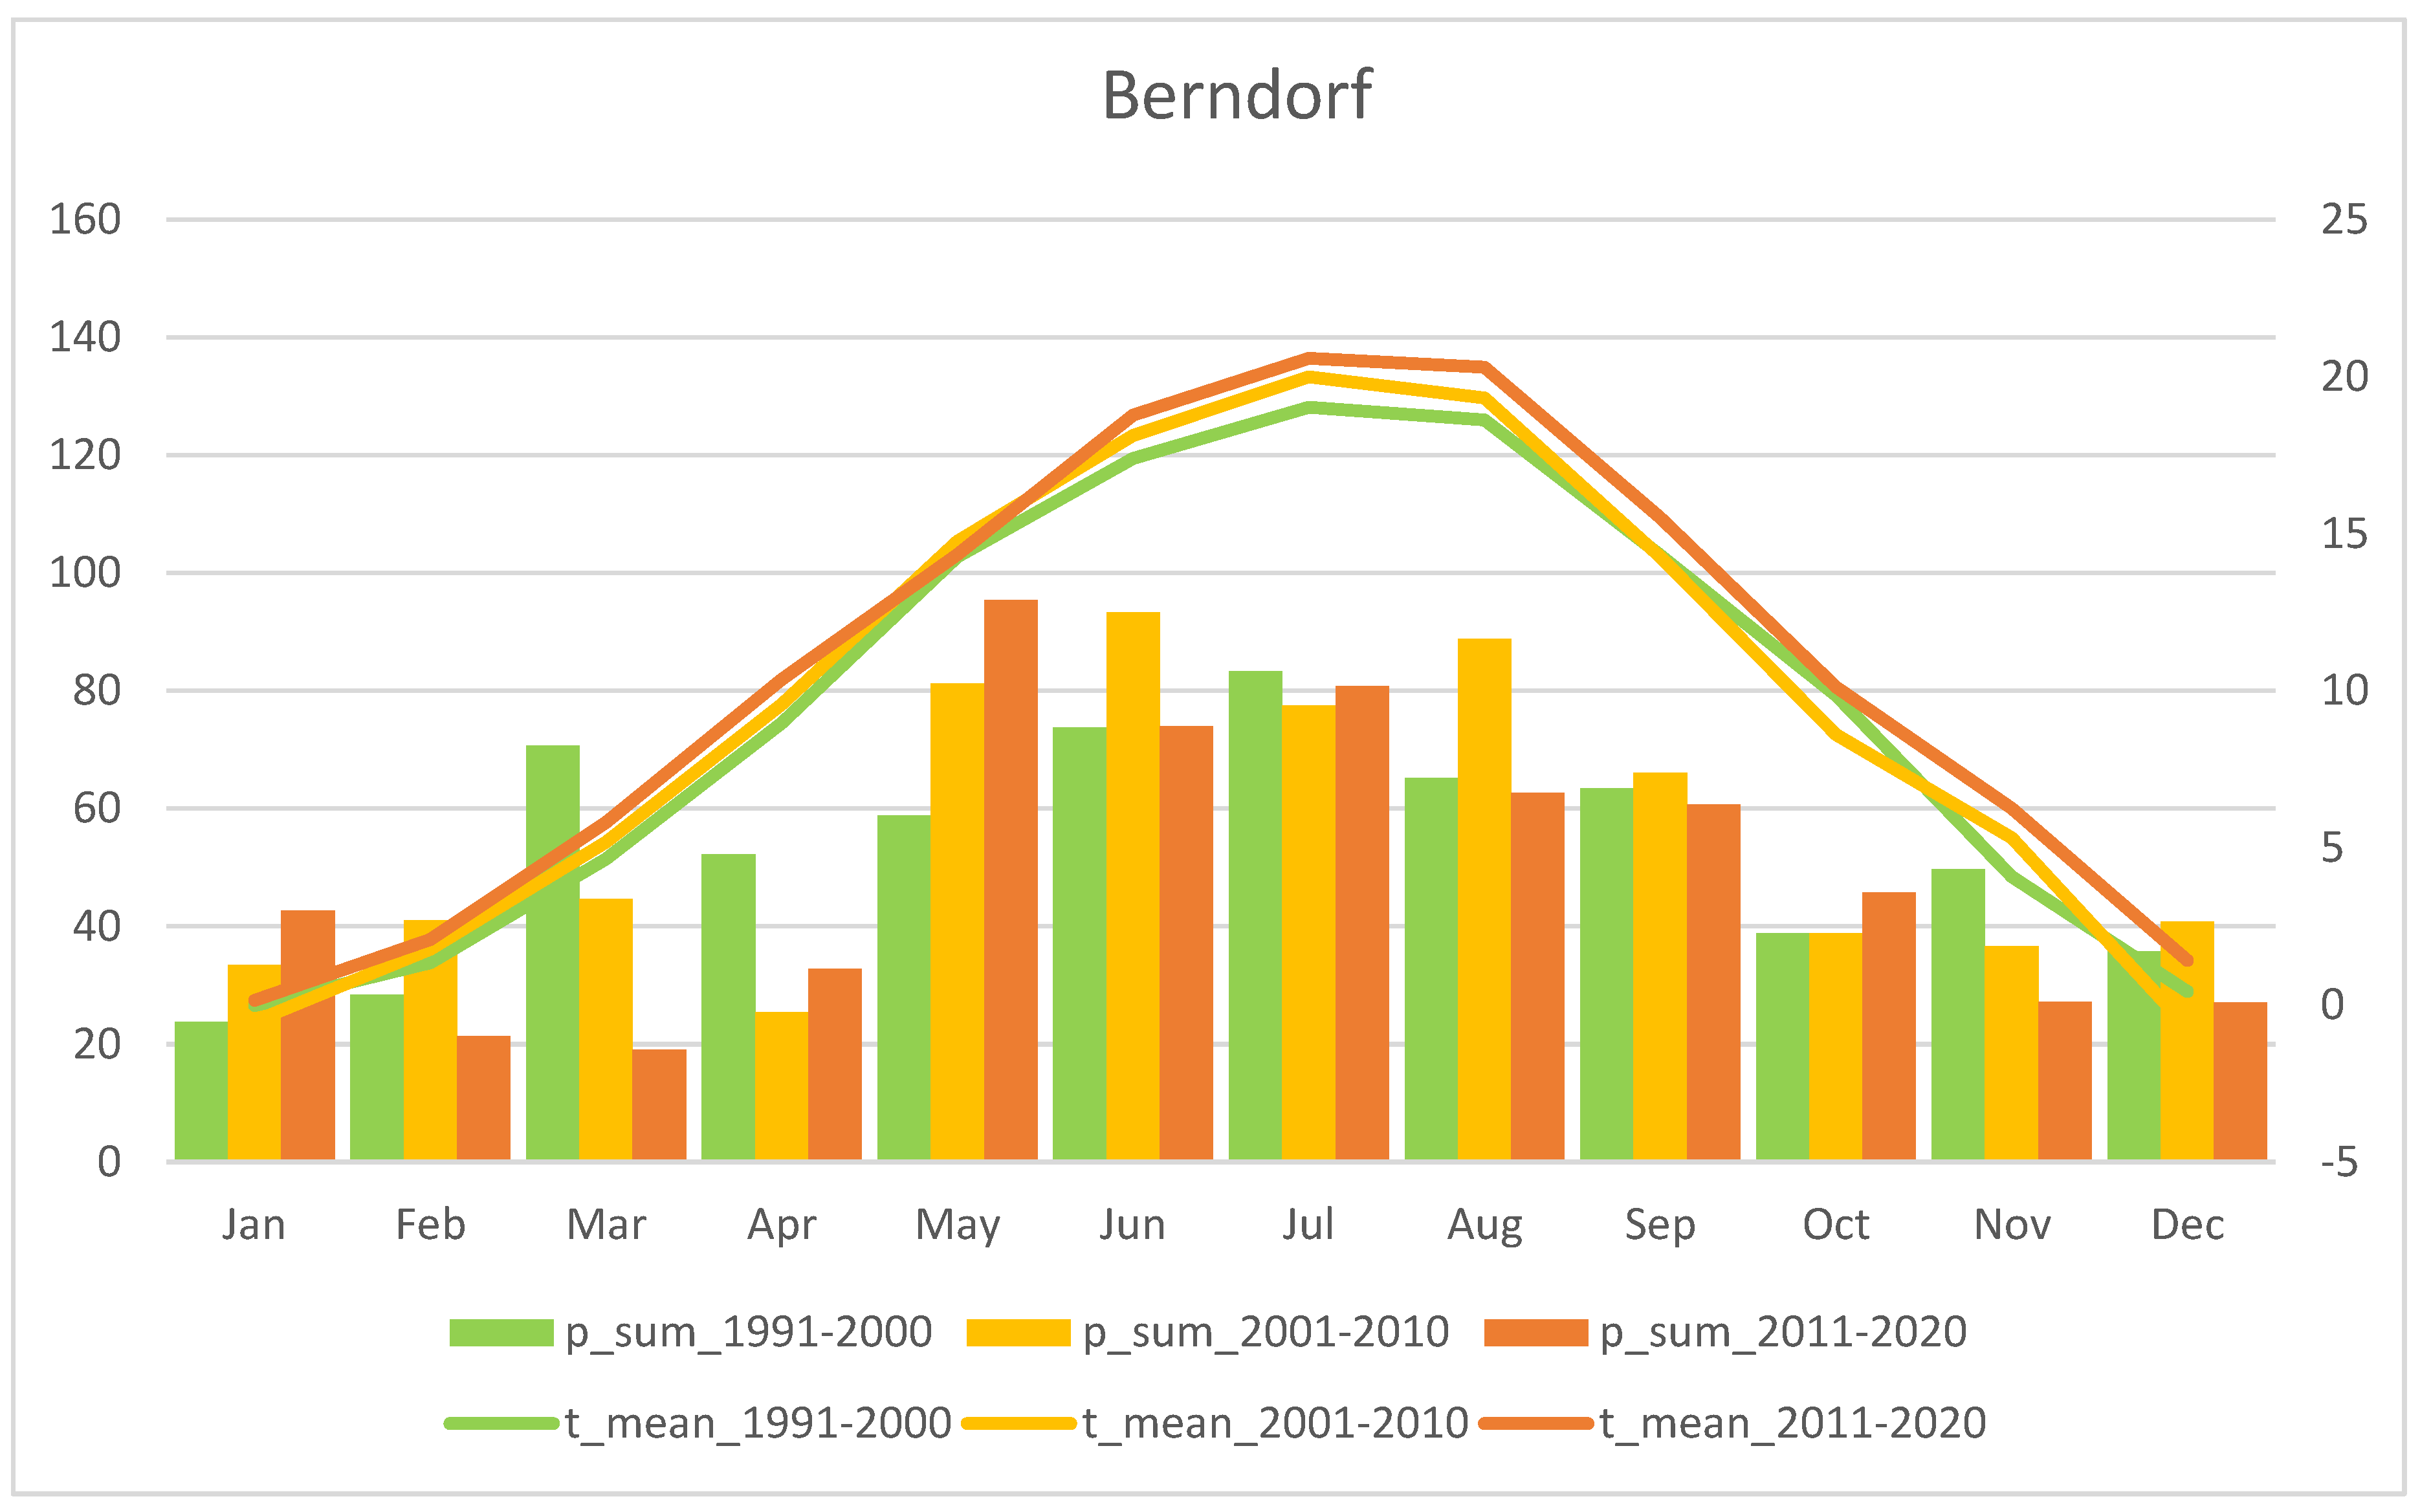
3.3. Study Region: Wienerwald
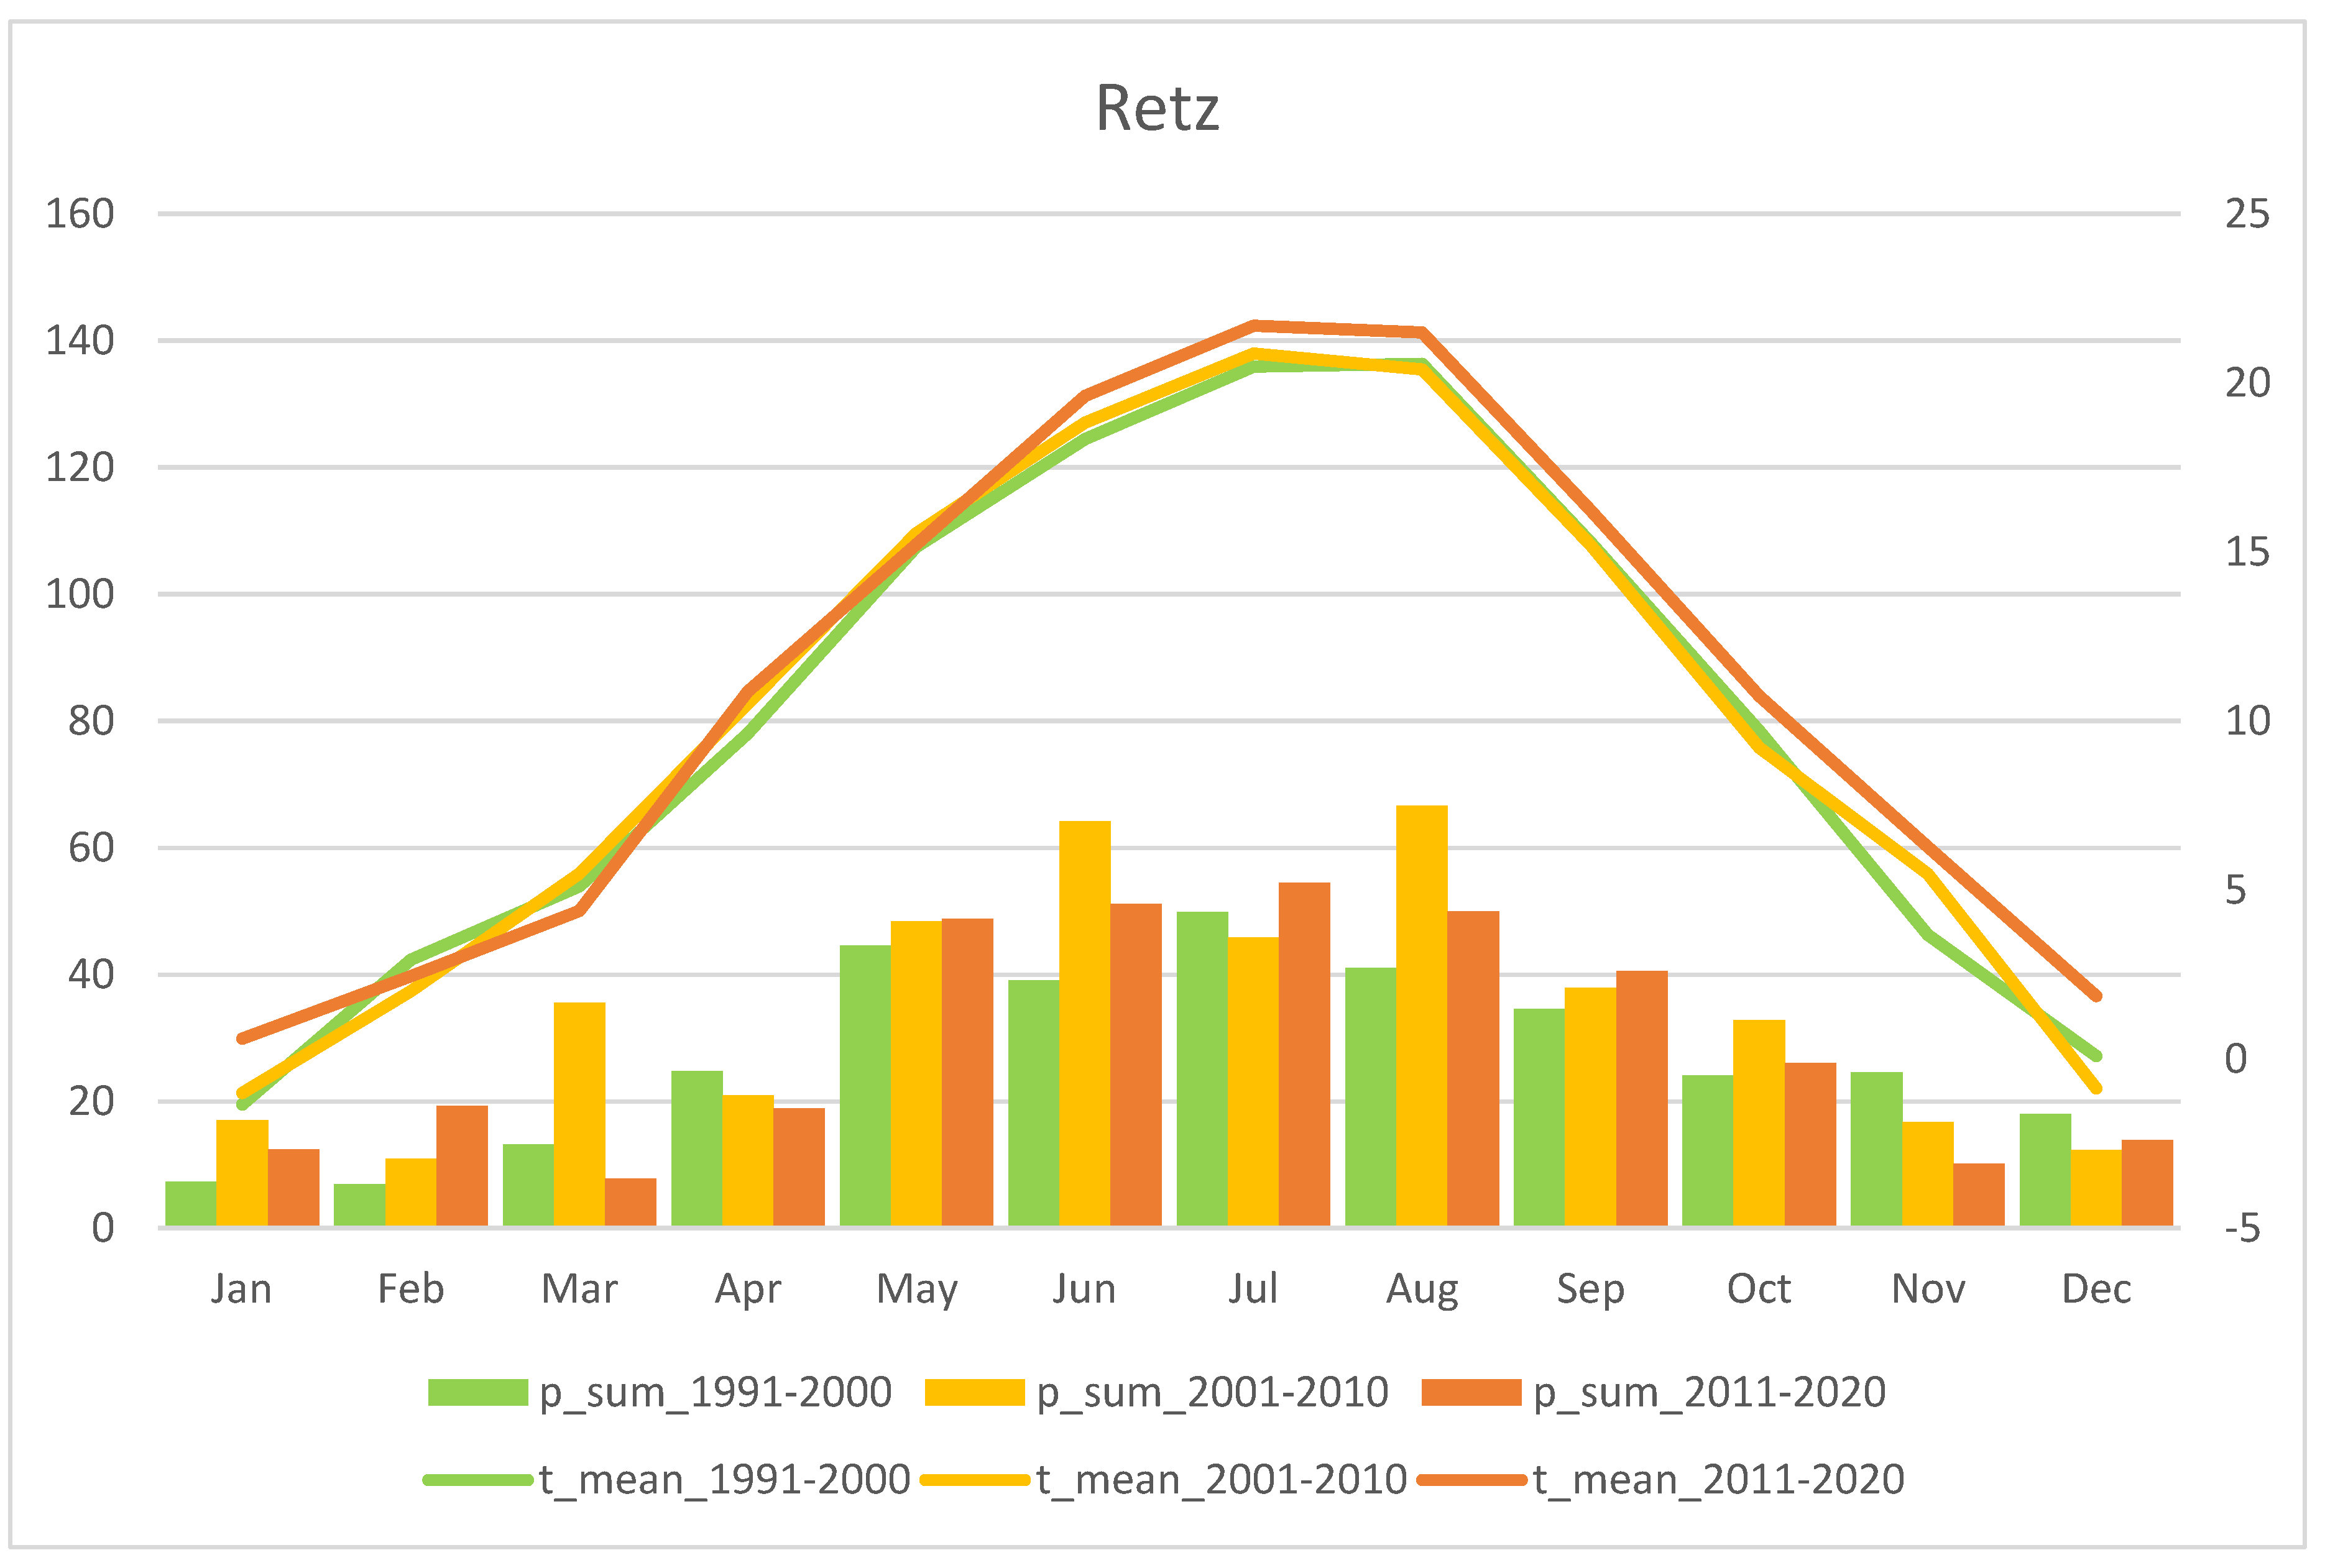
3.4. Study Region: Weinviertel
4. Discussion
4.1. Temporal Population Census Size Variation in D. sambucina
4.2. Flowering Dynamics in D. sambucina over Years
4.3. Variation and Shifts in Flower Colour Morph Frequencies in D. sambucina
5. Conclusions
Author Contributions
Funding
Institutional Review Board Statement
Data Availability Statement
Acknowledgments
Conflicts of Interest
Appendix A


References
- Dressler, R.L. Phylogeny and Classification of the Orchid Family; Dioscorides Press: Portland, OR, USA, 1993. [Google Scholar]
- Pijl, L.v.d.; Dodson, C.H. Orchid Flowers. Their Pollination and Evolution; Pub. Univ. Miami Press: Coral Gables, FL, USA, 1966. [Google Scholar]
- Ackerman, J.D. Mechanisms and evolution of food-deceptive pollination systems in orchids. Lindleyana 1986, 1, 108–113. [Google Scholar]
- Nilsson, L.A. Orchid pollination biology. Trends Ecol. Evol. 1992, 7, 255–259. [Google Scholar] [CrossRef] [PubMed]
- Paulus, H.F. Zur Bestäubungsbiologie der Orchideen. In Die Orchideen Deutschlands; Arbeitskreise Heimische Orchideen: Uhlstädt-Kirchhasel, Germany; pp. 98–140.
- Schiestl, F.P.; Ayasse, M.; Paulus, H.F.; Lofstedt, C.; Hansson, B.S.; Ibarra, F.; Francke, W. Orchid pollination by sexual swindle. Nature 1999, 399, 421–422. [Google Scholar] [CrossRef]
- Ziegenspeck, H. Orchidaceae. In Lebensgeschichte der Blütenpflanzen Mitteleuropas; Kirchner, O.v., Loew, E., Schröter, C., Eds.; Eugen Ulmer: Stuttgart, Germany, 1936; Band I, Abteilung 4; pp. 1–840. [Google Scholar]
- Nilsson, L.A.. The pollination ecology of Dactylorhiza sambucina (Orchidaceae). Bot. Not. 1980, 133, 367–385. [Google Scholar]
- Vogel, S. Betrug bei Pflanzen: Die Täuschblumen. In Abhandlungen der Akademie der Wissenschaften und der Literatur, Mathematisch-Naturwissenschaftliche Klasse; Franz Steiner Verlag: Mainz, Germany, 1993; No.1; p. 48. [Google Scholar]
- van der Cingel, N.A. An Atlas of Orchid Pollination—European Orchids; Balkema, A.A., Ed.; Balkema: Rotterdam, The Netherlands, 1995; p. 175. [Google Scholar]
- Kropf, M. Vergleichende Untersuchungen zur Bestäubungsbiologie, zum Pollenfluß und zum Reproduktionserfolg von zwei Orchideenarten. Diploma Thesis, Mainz University, Mainz, Germany, 1996. [Google Scholar]
- Sprengel, C.K. Das entdeckte Geheimniss der Natur im Bau und in der Befruchtung der Blumen; Friedrich Viehweg dem Aelteren: Berlin, Germany, 1793; 444 Columns. [Google Scholar]
- Jersáková, J.; Johnson, S.D.; Kindlmann, P. Mechanisms and evolution of deceptive pollination in orchids. Biol. Rev. Camb. Phil. Soc. 2006, 81, 219–235. [Google Scholar] [CrossRef]
- Johnson, S.D.; Schiestl, F.P. Generalized food deception. In Floral Mimicry; Johnson, S.D., Schiestl, F.P., Eds.; Oxford University Press: Oxford, UK; pp. 33–52. 2016. [Google Scholar]
- Gigord, L.D.B.; Macnair, M.R.; Stritesky, M.; Smithson, A. The potential for floral mimicry in rewardless orchids: An experimental study. Proc. R Soc. Lond. B 2002, 269, 1389–1395. [Google Scholar] [CrossRef]
- Pellegrino, G.; Bellusci, F.; Musacchio, A. Double floral mimicry and the magnet species effect in dimorphic co-flowering species, the deceptive orchid Dactylorhiza sambucina and rewarding Viola aethnensis. Preslia 2008, 80, 411–422. [Google Scholar]
- Johnson, S.D.; Peter, C.I.; Nilsson, L.A.; Ågren, J. Pollination success in a deceptive orchid is enhanced by co-occurring rewarding magnet plants. Ecology 2003, 84, 2919–2927. [Google Scholar] [CrossRef] [Green Version]
- Peter, C.I.; Johnson, S.D. Mimics and magnets: The importance of color and ecological facilitation in floral deception. Ecology 2008, 89, 1583–1595. [Google Scholar] [CrossRef] [Green Version]
- Jersáková, J.; Traxmandlová, I.; Ipser, Z.; Kropf, M.; Pellegrino, G.; Schatz, B.; Djordjević, V.; Kindlmann, P.; Renner, S.S. Biological flora of Central Europe: Dactylorhiza sambucina (L.) Soó. Perspec. Plant Ecol. 2015, 17, 318–329. [Google Scholar] [CrossRef]
- Skottsberg, C. Blommor och insekten pa Skabbholmen i Roslagen sommaren 1901. Svensk. Bot. Tidskr. 1907, 1, 61–96. [Google Scholar]
- Pettersson, G.; Nilsson, L.A. Pollinationsekologin hos Adam och Eva pa Stora Karlsö. Svensk. Bot. Tidskr. 1983, 77, 123–132. [Google Scholar]
- Vöth, W. Lebensgeschichte und Bestäuber der Orchideen am Beispiel von Niederösterreich. Stapfia 1999, 65, 1–257. [Google Scholar]
- Kropf, M.; Kriechbaum, M. Variation des Blühverhaltens und der Blütenfarben-Häufigkeiten als Voraussetzung für negativ dichte-abhängige Selektion durch Bestäuber bei der dimorphen Dactylorhiza sambucina. Sauteria 2009, 18, 209–222. [Google Scholar]
- Künkele, S.; Baumann, H. Orchidaceae. In Die Farn-und Blütenpflanzen Baden-Württembergs, Band 8: Spezieller Teil, Juncaceae bis Orchidaceae; Sebald, O., Seybold, S., Philippi, G., Wörz, A., Eds.; Ulmer Verlag: Stuttgart, Germany, 1998; pp. 286–462. [Google Scholar]
- Balzer, S. Populationsökologische Untersuchungen an Dactylorhiza sambucina (L.) SOÓ) im Frankenwald, Nordost-Bayern. Bayreuth. Forum Okol. 2000, 81, 196. [Google Scholar]
- AHO. Die Orchideen Deutschlands; AHO: Uhlstädt-Kirchhasel, Germany, 2005; p. 800. [Google Scholar]
- Gigord, L.D.B.; Macnair, M.R.; Smithson, A. Negative frequency-dependent selection maintains a dramatic flower color polymorphism in the rewardless orchid Dactylorhiza sambucina (L.) Soó. Proc. Nat. Acad. Sci. USA 2001, 98, 6253–6255. [Google Scholar] [CrossRef] [Green Version]
- Internicola, A.I.; Juillet, N.; Smithson, A.; Gigord, L.D.B. Experimental investigation of the effect of spatial aggregation on reproductive success in a rewardless orchid. Oecologia 2006, 150, 435–441. [Google Scholar] [CrossRef] [PubMed]
- Pellegrino, G.; Caimi, D.; Noce, M.E..; Musacchio, A. Effects of local density and flower colour polymorphism on pollination and reproduction in the rewardless orchid Dactylorhiza sambucina (L.) Soò. Plant Syst. Evol. 2005, 251, 119–129. [Google Scholar] [CrossRef]
- Pellegrino, G.; Bellusci, F.; Musacchio, A. Evidence of post-pollination barriers among three colour morphs of the deceptive orchid Dactylorhiza sambucina (L.) Soó. Sex Plant Reprod. 2005, 18, 179–185. [Google Scholar] [CrossRef]
- Jersáková, J.; Kindlmann, P. Reproductive success and sex variation in nectarless and rewarding orchids. Int. J. Plant. Sci. 2004, 165, 779–785. [Google Scholar] [CrossRef] [Green Version]
- Jersáková, J.; Kindlmann, P.; Renner, S.S. Is the colour dimorphism in Dactylorhiza sambucina maintained by differential seed viability instead of frequency-dependent selection? Folia. Geobot. 2006, 41, 61–76. [Google Scholar] [CrossRef]
- Jersáková, J.; Johnson, S.D.; Kindlmann, P.; Pupin, A.-C. Effect of nectar supplementation on male and female components of pollination success in the deceptive orchid Dactylorhiza sambucina. Acta Oecol. 2008, 33, 300–306. [Google Scholar] [CrossRef]
- Juillet, N.; Dunand-Martin, S.; Gigord, L.D.B. Evidence for inbreeding depression in the food-deceptive colour-dimorphic orchid Dactylorhiza sambucina (L.) Soó. Plant Biol. 2007, 9, 147–151. [Google Scholar] [CrossRef] [PubMed] [Green Version]
- Smithson, A.; Juillet, N.; Macnair, M.R.; Gigord, L.D.B. Do rewardless orchids show a positive relationship between phenotypic diversity and reproductive success? Evolution 2007, 88, 434–442. [Google Scholar] [CrossRef] [Green Version]
- Kropf, M.; Renner, S.S. Pollination success in monochromic yellow populations of the rewardless orchid Dactylorhiza sambucina. Plant Syst. Evol. 2005, 254, 185–197. [Google Scholar] [CrossRef] [Green Version]
- Groiß, A.; Braun, A.; Greimler, J.; Kropf, M. Pollen tracking in the food-deceptive orchid Dactylorhiza sambucina showed no predominant switching behaviour of pollinators between flower colour morphs. Flora 2017, 232, 194–199. [Google Scholar] [CrossRef]
- Kropf, M. Das Holunder-Knabenkraut (Dactylorhiza sambucina [L.] Soò) in Rheinland-Pfalz—Landesweite Bestandsaufnahme einer stark gefährdeten Orchideenart. J. Eur. Orch. 2008, 40, 423–440. [Google Scholar]
- Kropf, M.; Renner, S.S. Pollinator-mediated selfing in two deceptive orchids and a review of pollinium tracking studies addressing geitonogamy. Oecologia 2008, 155, 497–508. [Google Scholar] [CrossRef] [PubMed]
- Vanhecke, L. Serial observations on the size of orchid populations in Europe: A characterization of the literature. Scripta. Bot. Belgica. 1992, 3, 1–20. [Google Scholar]
- Trends and Fluctuations and Underlying Mechanisms in Terrestrial Orchid Populations; Kindlmann, P.; Willems, J.H.; Whigham, D.F. (Eds.) Backhuys Publ.: Leiden, The Netherlands, 2002; p. 254. [Google Scholar]
- Kull, T. Population dynamics of north temperate orchids. In Orchid Biology: Reviews and Perspectives, VIII.; Kull, T., Arditti, J., Eds.; Kluwer Academic Publ.: Dordrecht, Boston, London, 2002; pp. 139–165. [Google Scholar]
- Heinrich, W. Populationsökologie, Populationsdynamik heimischer Orchideen – Probleme, Aufgaben, Literaturhinweise. Ber. Arbeitskrs Heim. Orchid 2005, 21, 100–126. [Google Scholar]
- Böhmer, K. Vegetation und Nutzungsgeschichte der Gemeinde Kottes-Purk. Ein Beitrag zur bäuerlichen Kulturgeschichte des südlichen Waldviertels. Diploma Thesis, Universität für Bodenkultur Wien, Vienna, Austria, 1990. [Google Scholar]
- Bassler, G.; Lichtenecker, A.; Karrer, G. Klassifikation des Extensivgrünlandes (Feuchtwiesen, Moore, Bürstlingrasen und Halbtrockenrasen) im Zentralraum des Waldviertels. Wiss Mitt Niederösterr Landesm 2003, 15, 7–48. [Google Scholar]
- Griebl, N. Die Orchideen Österreichs mit 72 Orchideenwanderungen; Freya: Linz, Austria, 2013; 479p. [Google Scholar]
- Kropf, M.; Lefnaer, S. Bestätigung eines bemerkenswerten Vorkommens des Holunder-Knabenkrauts Dactylorhiza sambucina (Orchidaceae) im zentralen Teil des westlichen Weinviertels. Neilreichia 2021, 12, 39–47. [Google Scholar]
- Schratt-Ehrendorfer, L.; Niklfeld, H.; Schröck, C.; Stöhr, O.; Gilli, C.; Sonnleitner, M.; Adler, W.; Barta, T.; Beiser, A.; Berg, C.; et al. Rote Liste der Farn- und Blütenpflanzen Österreichs; Schratt-Ehrendorfer, L., Niklfeld, H., Schröck, C., Stöhr, O., Eds.; Stapfia 114, Land Oberösterreich: Linz, Austria, 2022; p. 357. [Google Scholar]
- Pennerstorfer, J.; Kriechbaum, M.; Kropf, M. Das österreichische Orchideen-Monitoring: Datenerfassung,-verwaltung und-auswertung. In Proceedings of the Natural Heritage: Heimische Orchideen in Österreich und Deutschland. 1. Fachtagung in Österreich über heimische Orchideen, 23–24 November 2007; pp. 7–10. [Google Scholar]
- Zimmermann, W. Beobachtungen an Orchis sambucinus L. Allg. Bot. Zeitschr. 1917, 22, 129–130. [Google Scholar]
- Braun, A. Der Blütenfarbenpolymorphismus von Dactylorhiza sambucina (Orchidaceae)—Studien an Populationen im Wienerwald. Diploma Thesis, Universität für Bodenkultur Wien, Vienna, Austria, 2009. [Google Scholar]
- Groiß, A. Der Blütenfarbenpolymorphismus von Dactylorhiza sambucina (L.) Soó (Orchidaceae). Diploma Thesis, University of Vienna, Vienna, Austria, 2015. [Google Scholar]
- Böhmer, K.; Hochegger, K.; Holzner, W. Die Wiesen machen den Wienerwald zu einer naturnahen Kulturlandschaft. In Kulturlandschaft—Natur in Menschenhand. Naturnahe Kulturlandschaften: Bedeutung, Schutz und Erhaltung bedrohter Lebensräume; Hochegger, K., Holzner, W., Eds.; Grüne Reihe des Bundesministeriums für Umwelt, Jugend und Familie; Bundesministerium für Land- und Forstwirtschaft, Umwelt und Wasserwirtschaft: Vienna, Austria, 1999; Volume 11, pp. 284–294. [Google Scholar]
- Sonne, M.N.; Hauser, T.P. Population fluctuations, losses to grazing, and reproductive success of Dactylorhiza sambucina on Bornholm, Denmark. Ann. Bot. Fennici. 2014, 51, 375–386. [Google Scholar] [CrossRef]
- Kirillova, I.A.; Kirillov, D.V. Impact of weather conditions on seasonal development, population structure and reproductive success on Dactylorhiza traunsteineri (Orchidaceae) in the Komi Republic (Russia). Nat. Cons. Res. 2020, 5, 77–89. [Google Scholar] [CrossRef] [Green Version]
- Kirillova, I.A.; Kirillov, D.V. Population Dynamics, Reproductive Success, and Seasonal Development of Cypripedium calceolus under Different Growing Conditions as a Response to Weather Factors. Contemp. Probl. Ecol. 2021, 14, 472–482. [Google Scholar] [CrossRef]
- Pfeifer, M.; Wiegand, K.; Heinrich, W.; Jetschke, G. long-term demographic fluctuations in an orchid species driven by weather: Implications for conservation planning. J. Appl. Ecol. 2006, 43, 313–324. [Google Scholar] [CrossRef]
- Primack, R.; Stacy, E. Cost of reproduction in the pink lady’s slipper orchid (Cypripedium acaule Orchidaceae): An eleven-year experimental study of three populations. Am. J. Bot. 1998, 85, 1672–1679. [Google Scholar] [CrossRef]
- Shefferson, R.P. The evolutionary ecology of vegetative dormancy in mature herbaceous perennial plants. J. Ecol. 2009, 97, 1000–1009. [Google Scholar] [CrossRef]
- Inghe, O.; Tamm, C.O. Survival and flowering of perennial herbs. V. Patterns of flowering. Oikos 1988, 51, 203–219. [Google Scholar] [CrossRef]
- Smithson, A. Pollinator preference, frequency dependence, and floral evolution. In Cognitive Ecology of Pollination: Animal Behaviour and Evolution; Chittka, L., Thomson, J.D., Eds.; Cambridge Univ. Press: Cambridge, UK, 2001; pp. 237–257. [Google Scholar]
- Saccheri, I.; Kuussaari, M.; Kankare, M.; Vikman, P.; Fortelius, W.; Hanski, I. Inbreeding and extinction in a butterfly metapopulation. Nature 1998, 392, 491–494. [Google Scholar] [CrossRef]
- Landweber, L.F.; Dobson, A.P. (Eds.) Genetics and the Extinction of Species; Princeton University Press: Princeton, NJ, USA, 1999; p. 189. [Google Scholar]
- Frankham, R.; Ballou, J.D.; Briscoe, D.A. A Primer of Conservation Genetics; Cambridge University Press: Cambridge, UK, 2004; p. 220. [Google Scholar]
- Tamm, C.O. Observations on reproduction and survival of some perennial herbs. Bot. Not. 1948, 3, 303–321. [Google Scholar]
- Tamm, C.O. Survival and flowering of some perennial herbs. II. The behavior of some orchids on permanent plots. Oikos 1972, 23, 23–28. [Google Scholar] [CrossRef]
- Tamm, C.O. Behaviour of some orchid populations in a changing environment. Observations on permanent plots, 1943–1990. In Population Ecology of Terrestrial Orchids; Wells, T.C.E., Willems, J.H., Eds.; SPB Academic Publ.: The Hague, The Netherlands, 1991; pp. 1–13. [Google Scholar]
- Schemske, D.W.; Bierzychudek, P. Spatial differentiation for flower color in the desert annual Linanthus parryae: Was Wright right? Evolution 2007, 61, 2528–2543. [Google Scholar] [CrossRef] [PubMed]


| No. | Population | Region | Altitude (m a.s.l.) | Flower Colour Dominance | Study Area (m2) | Method Used | Study Years | Figure |
|---|---|---|---|---|---|---|---|---|
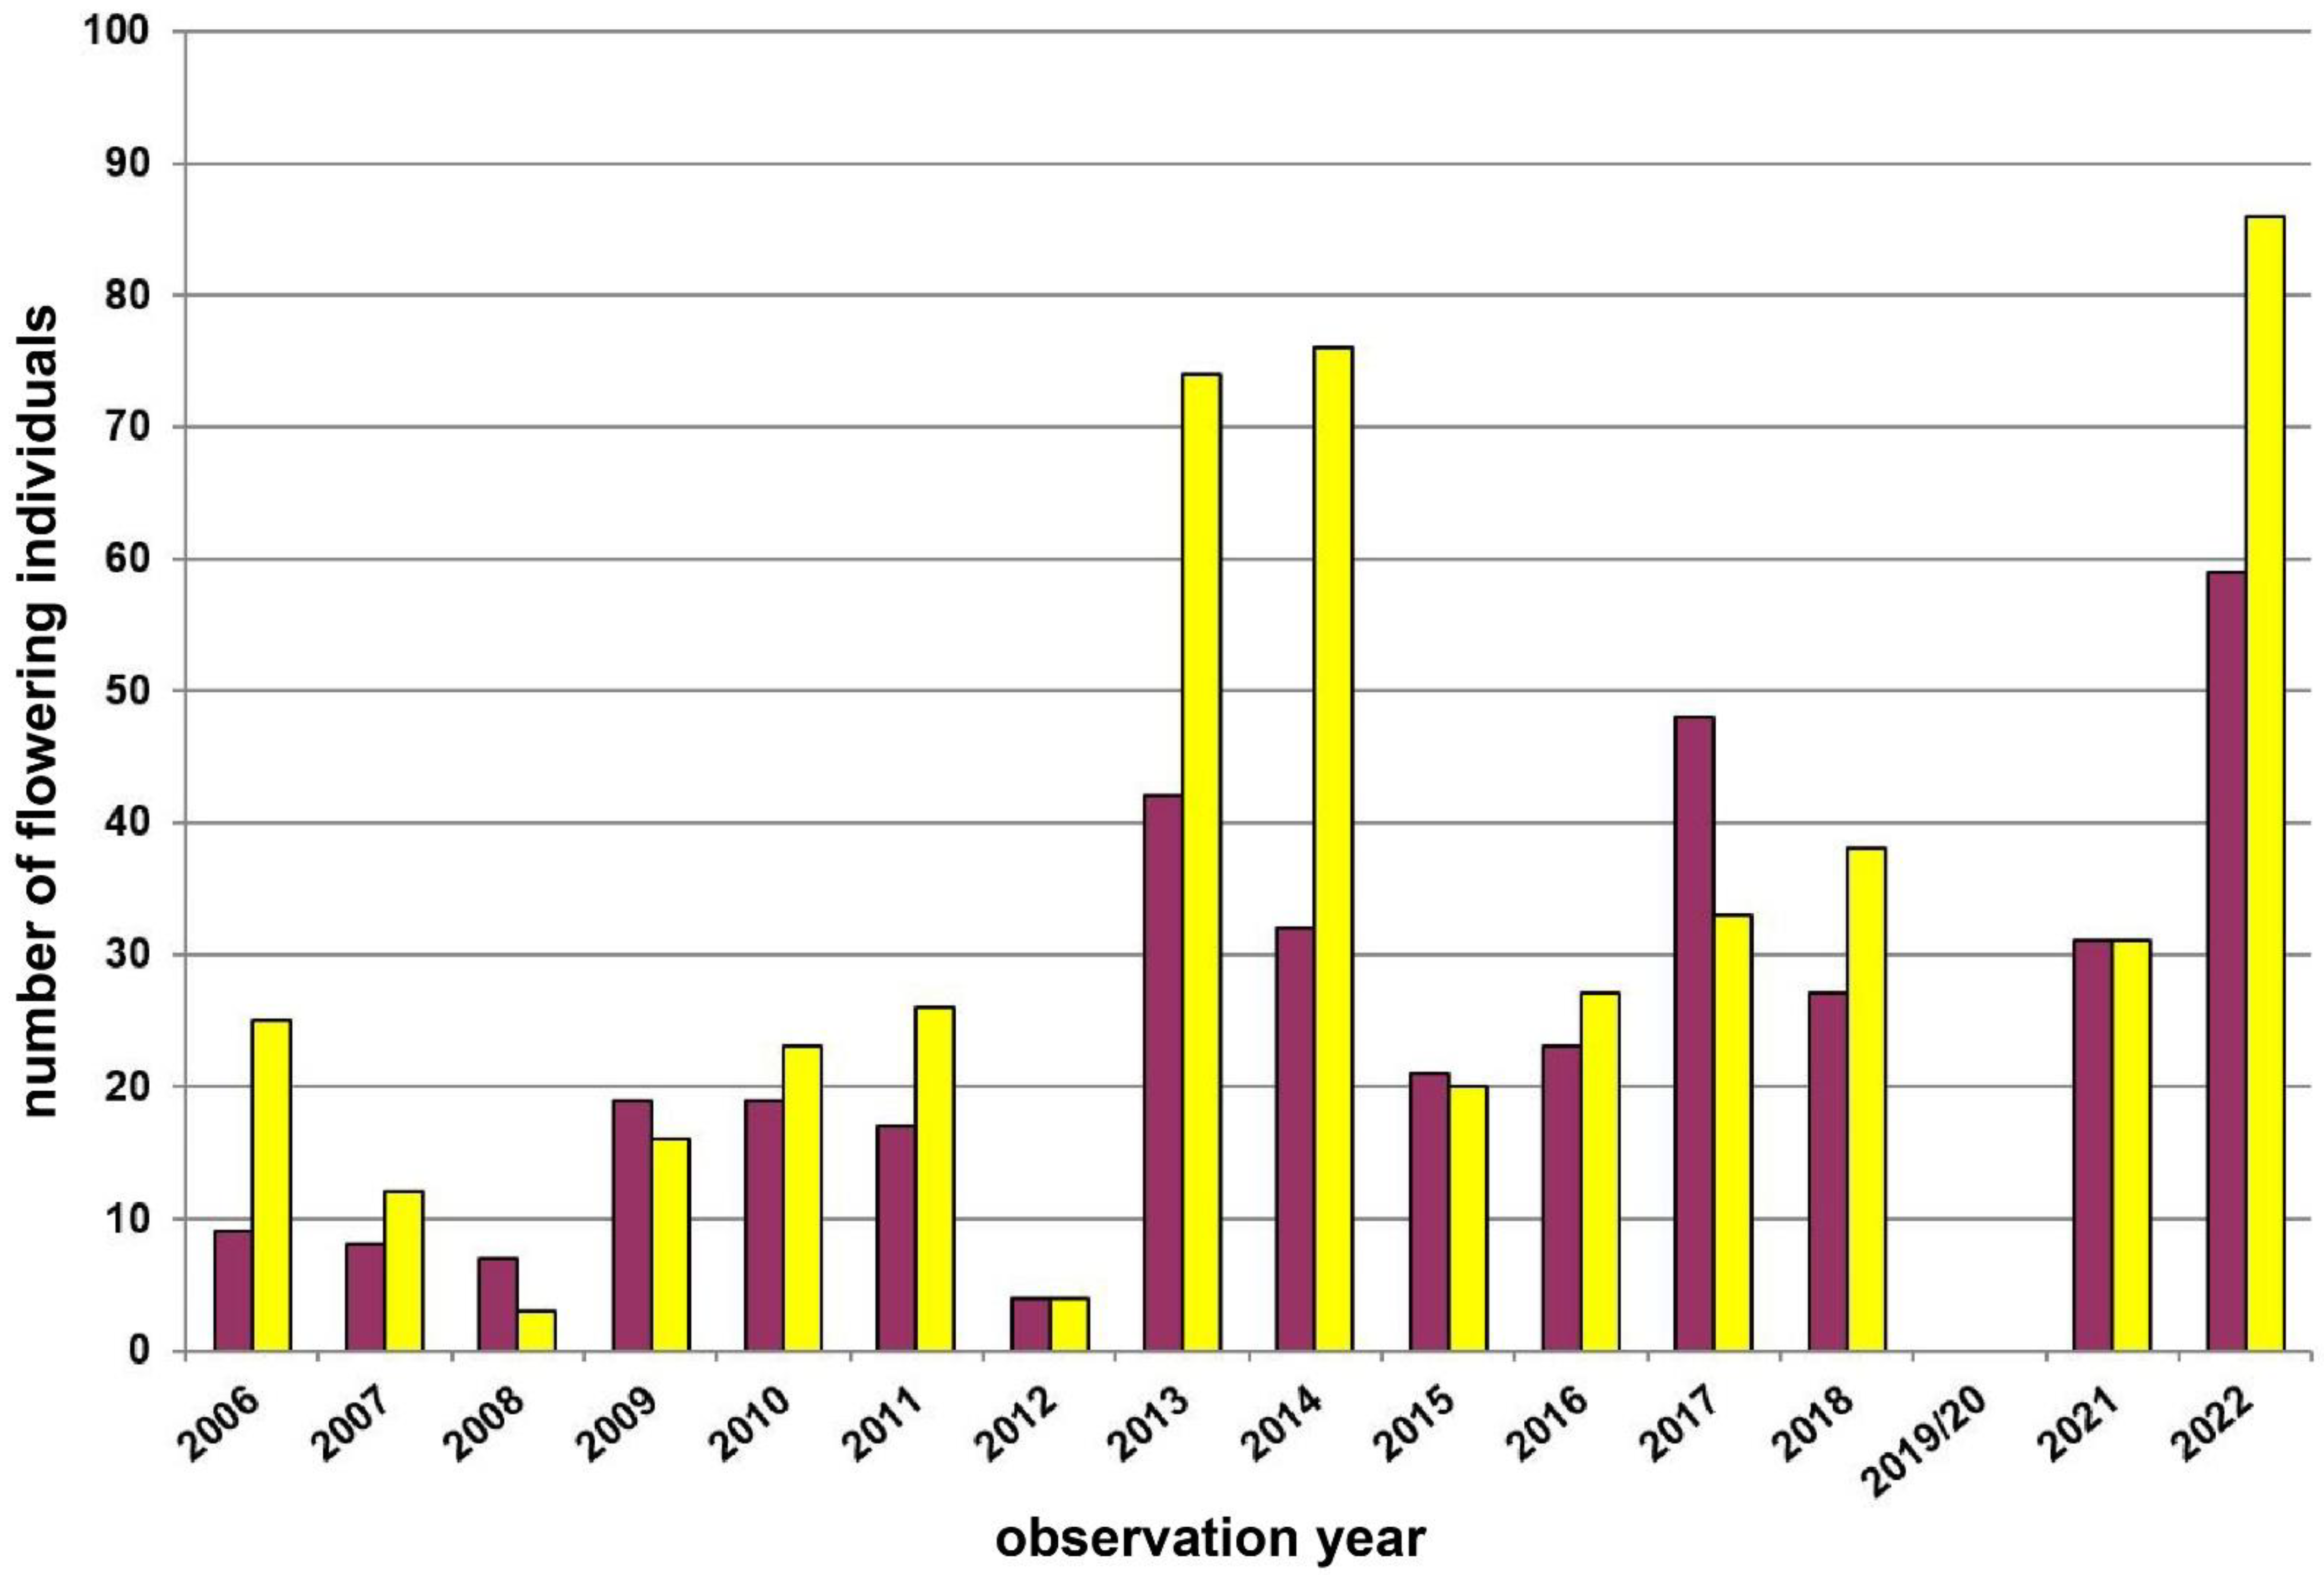
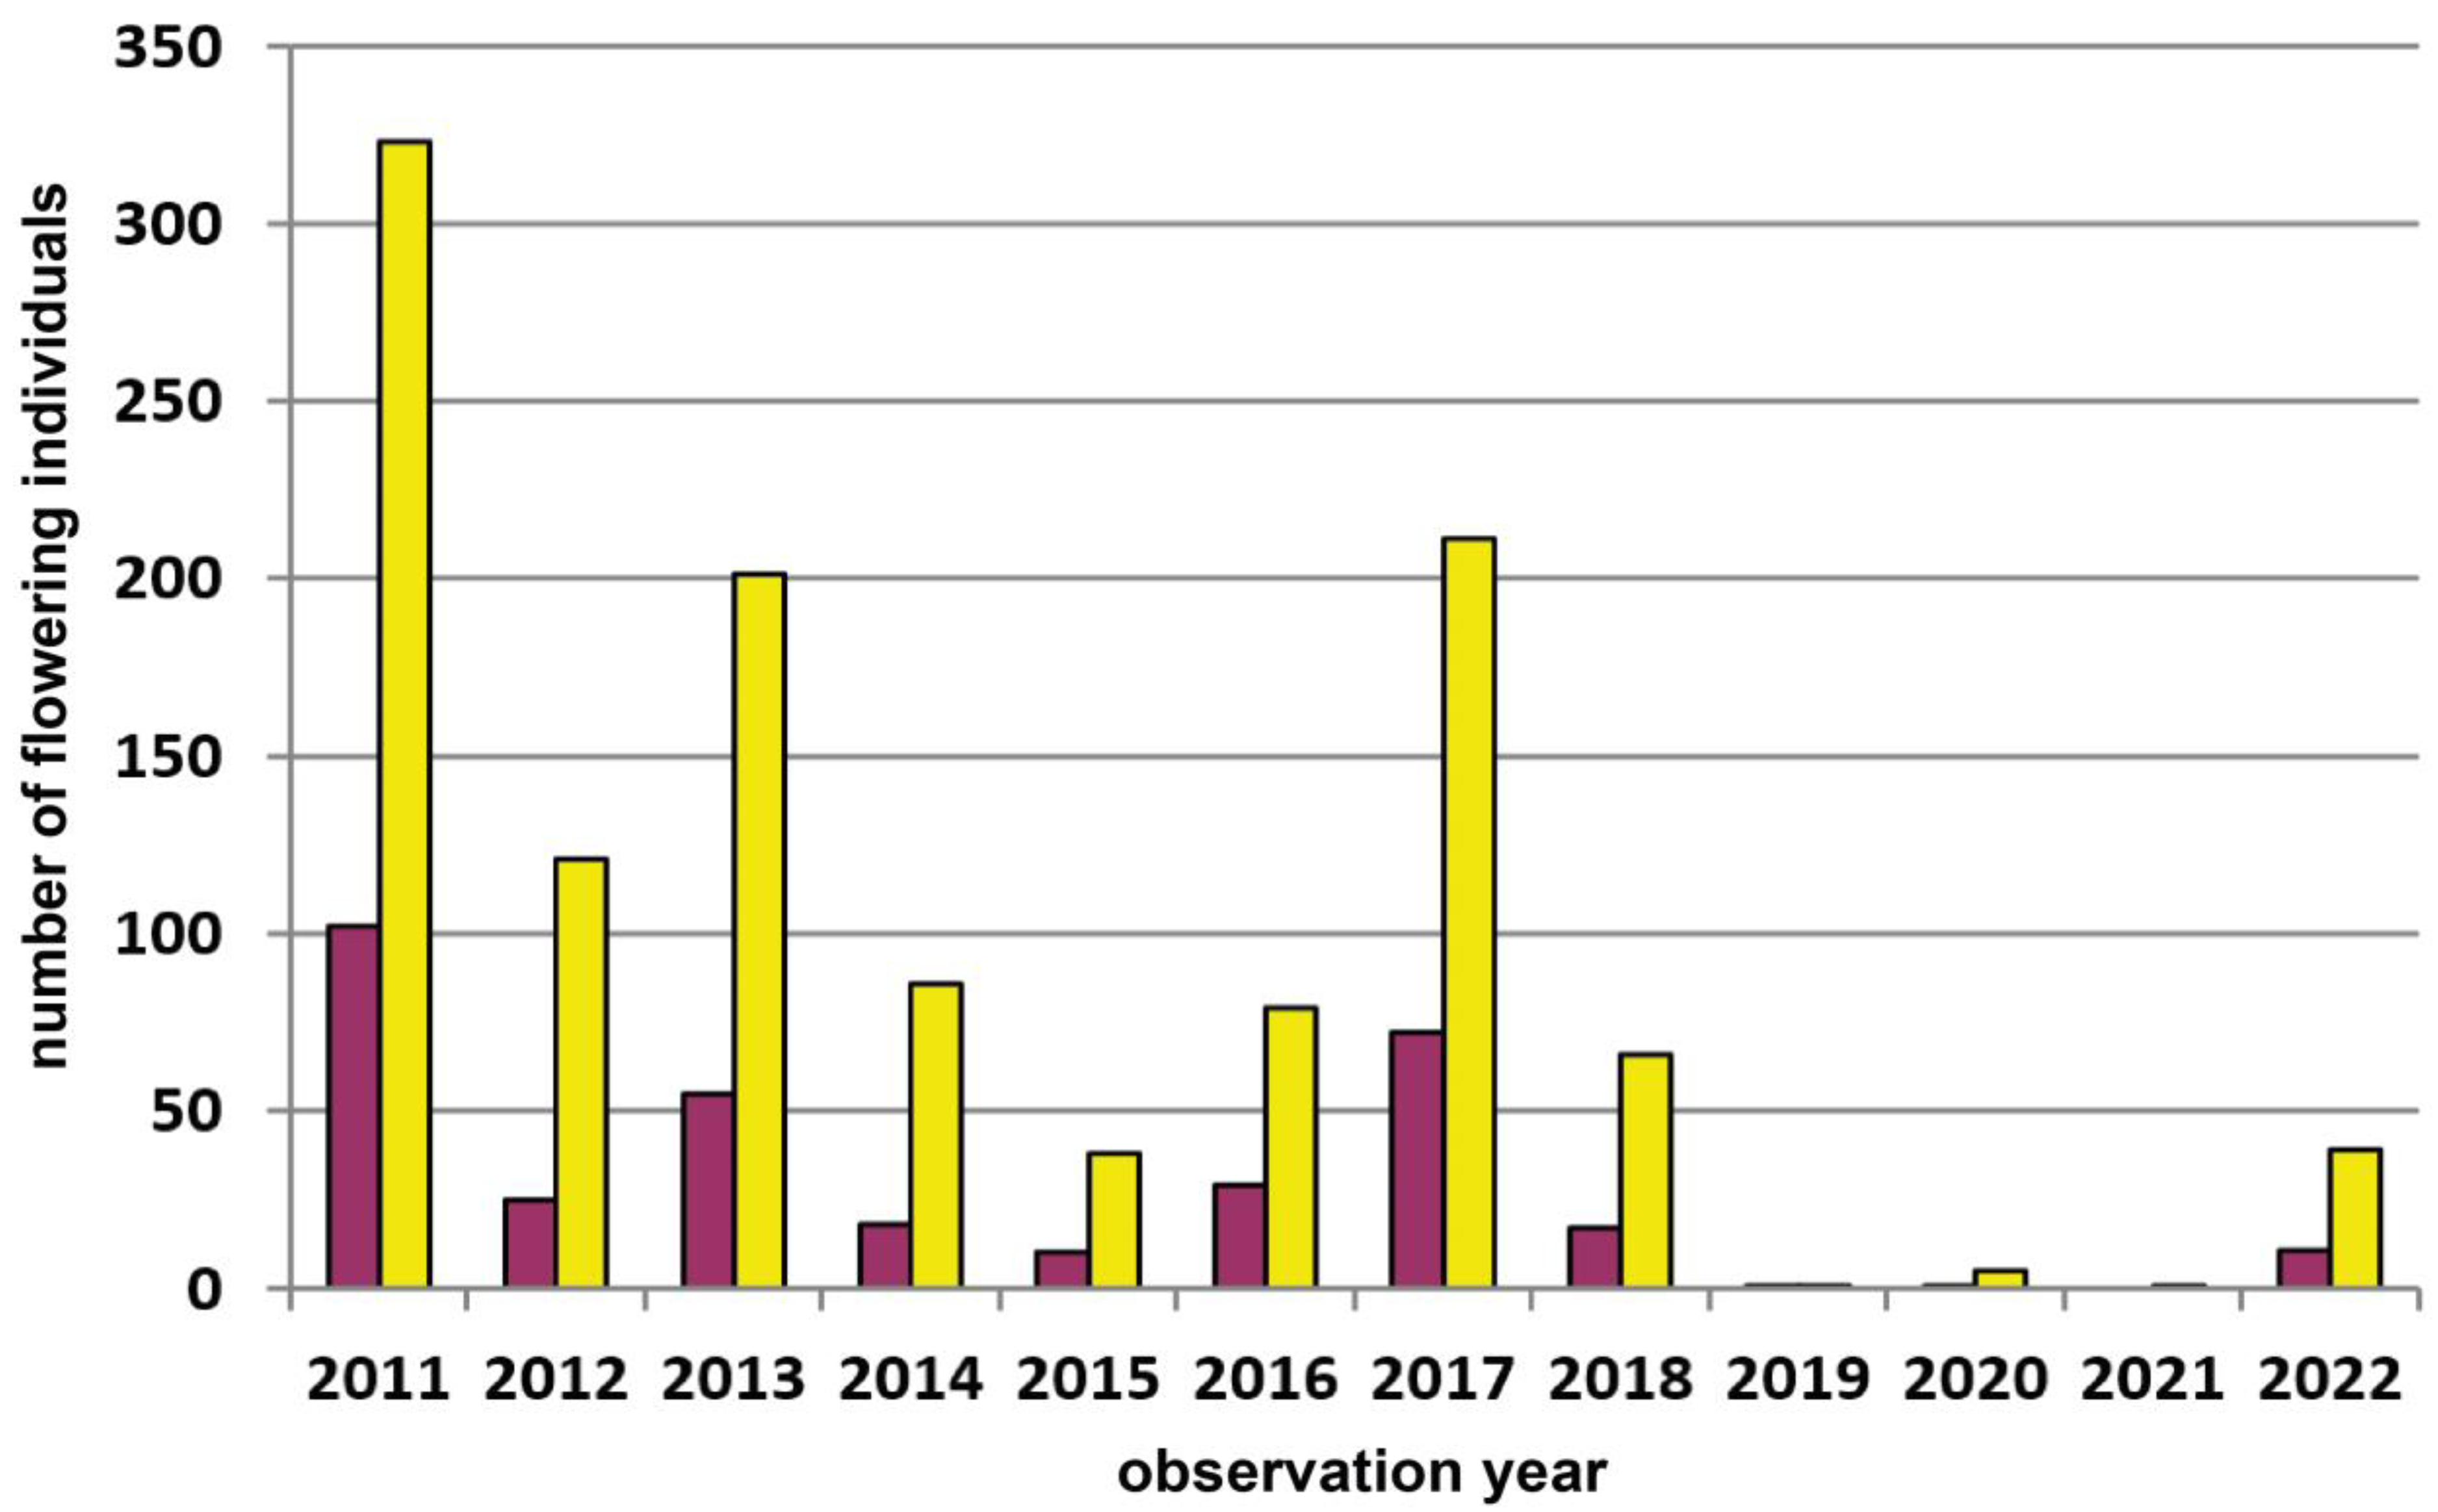
| 1 | Voitsau I | Waldviertel | 760 | yellow | 1700 | Total count of flowering plants | 2006–2022 | Figure 3, p.6 |
| 2 | Voitsau II | Waldviertel | 765 | yellow | 200 | Total count of flowering plants | 2011–2022 | Figure A3, p.14 |
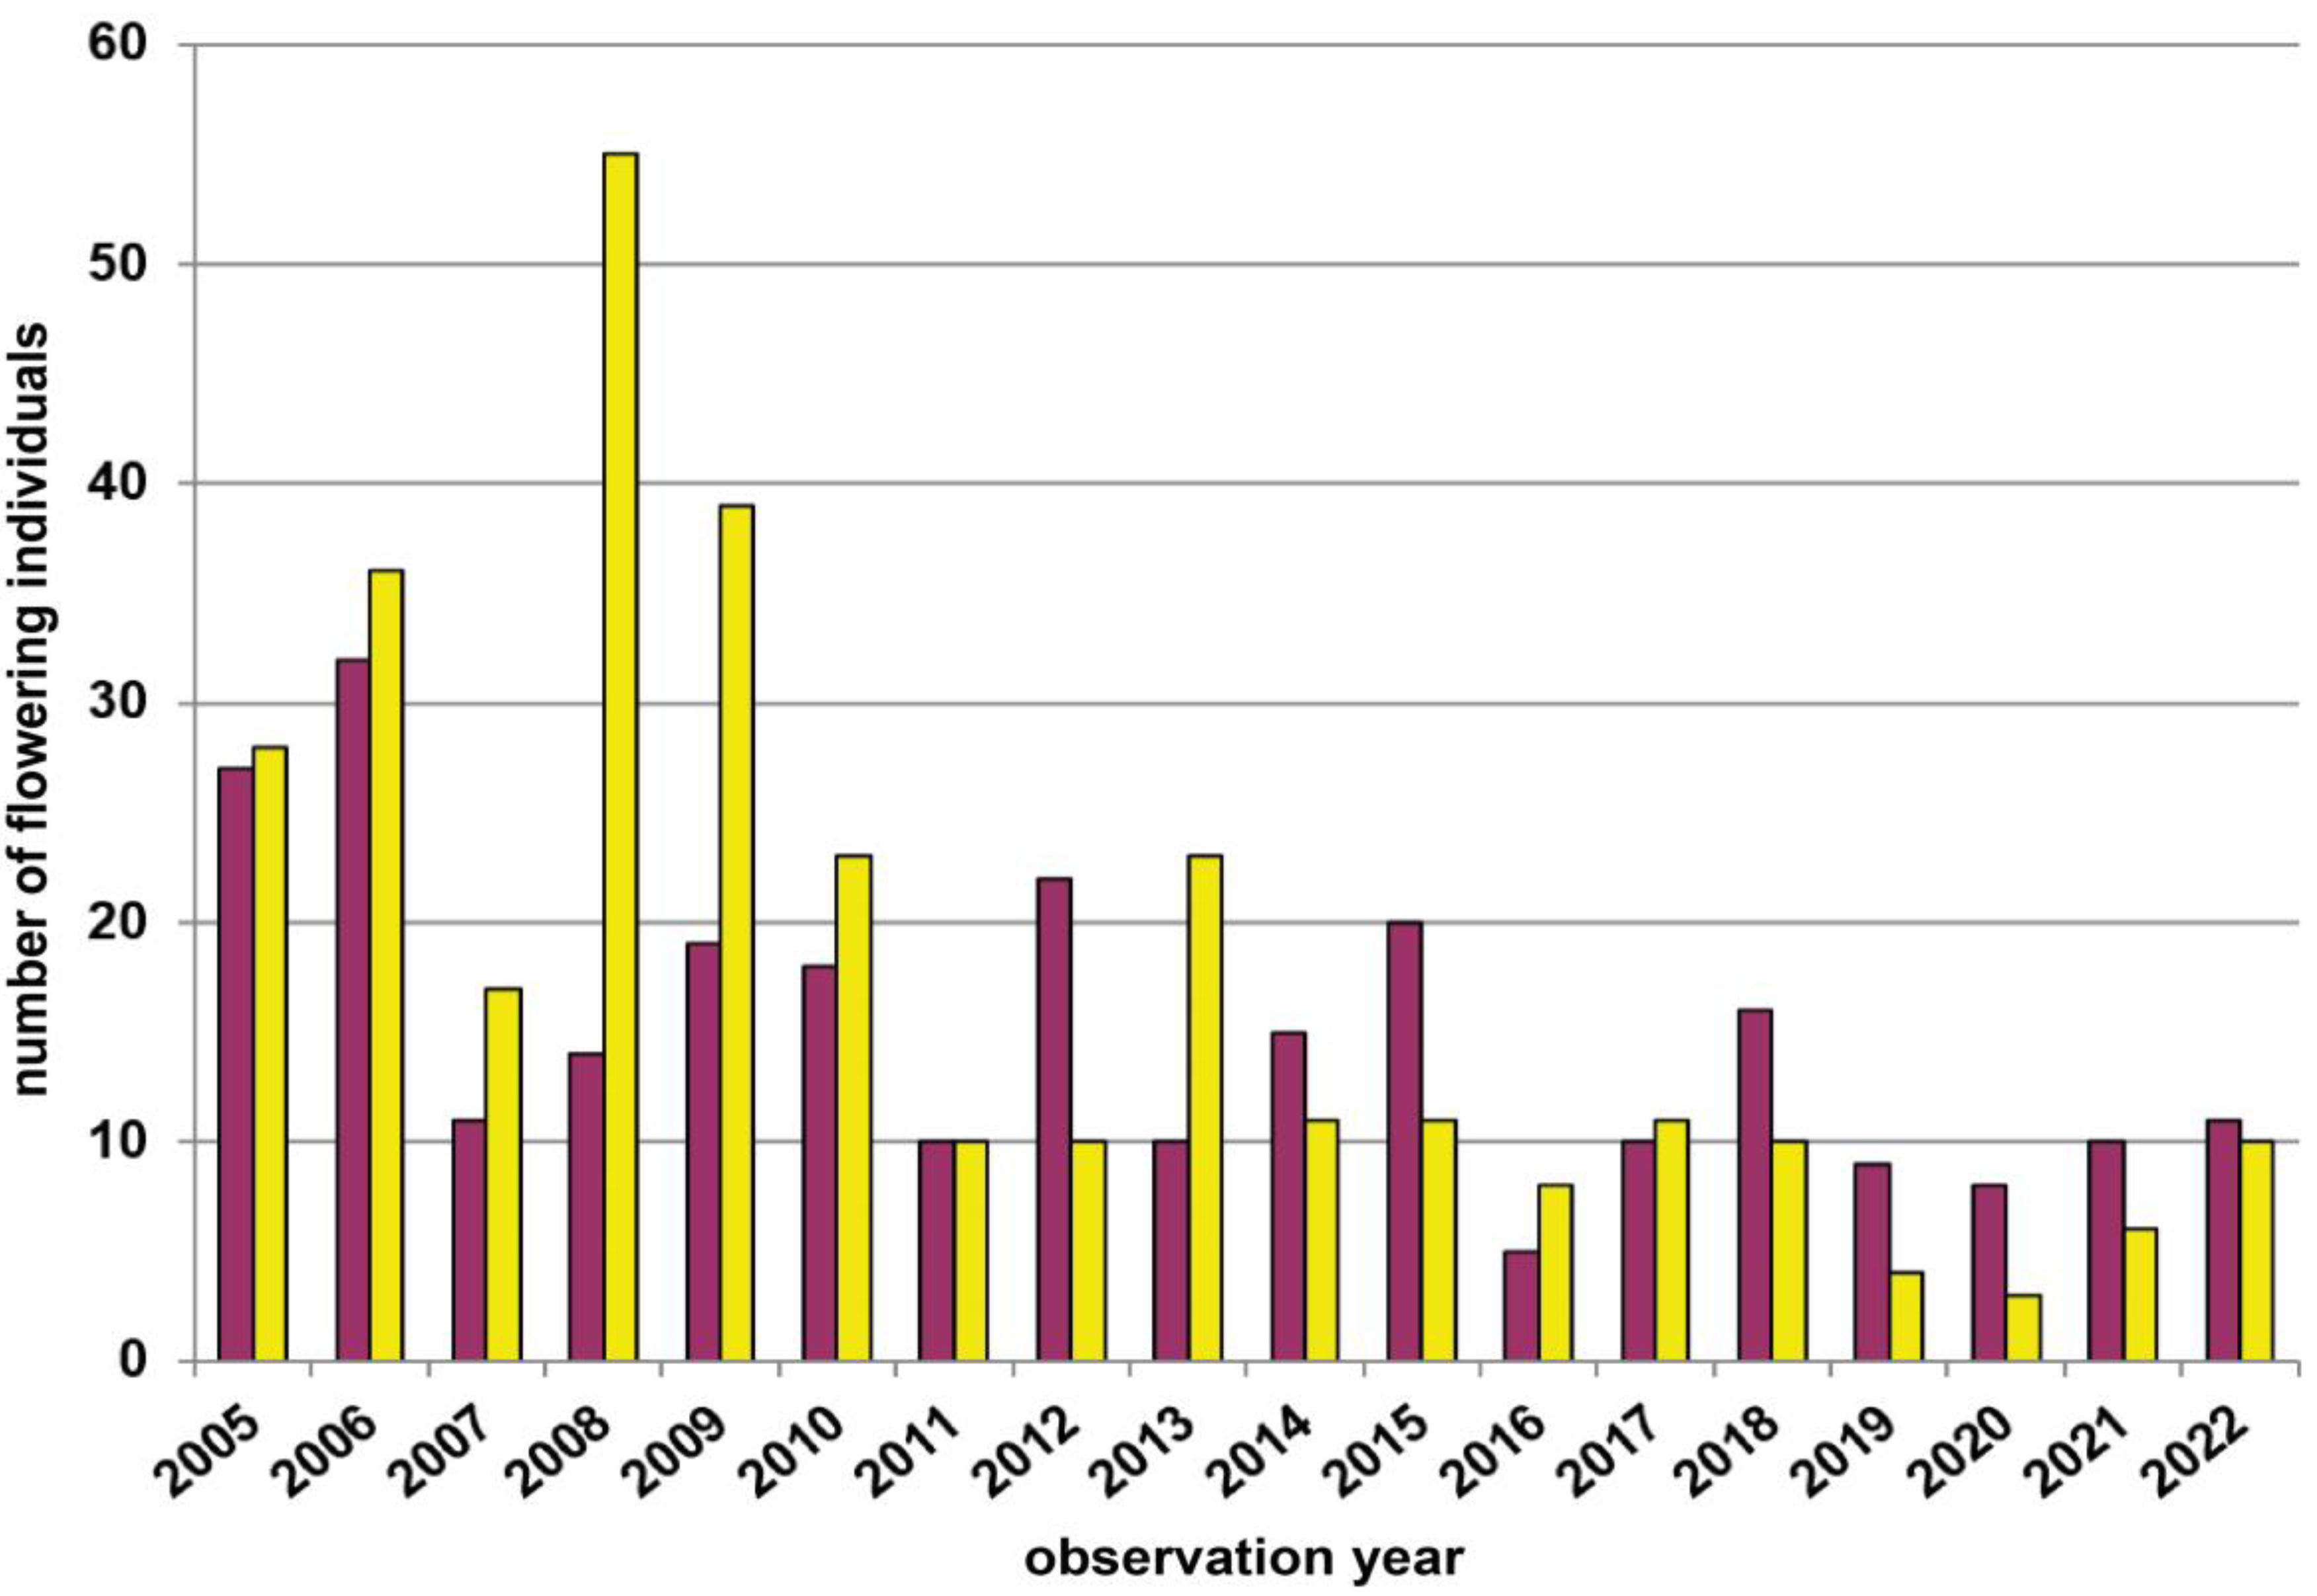
| 3 | Leopolds | Waldviertel | 780 | yellow | 770 | Total count of flowering plants | 2005–2022 | Figure A1, p.13 |
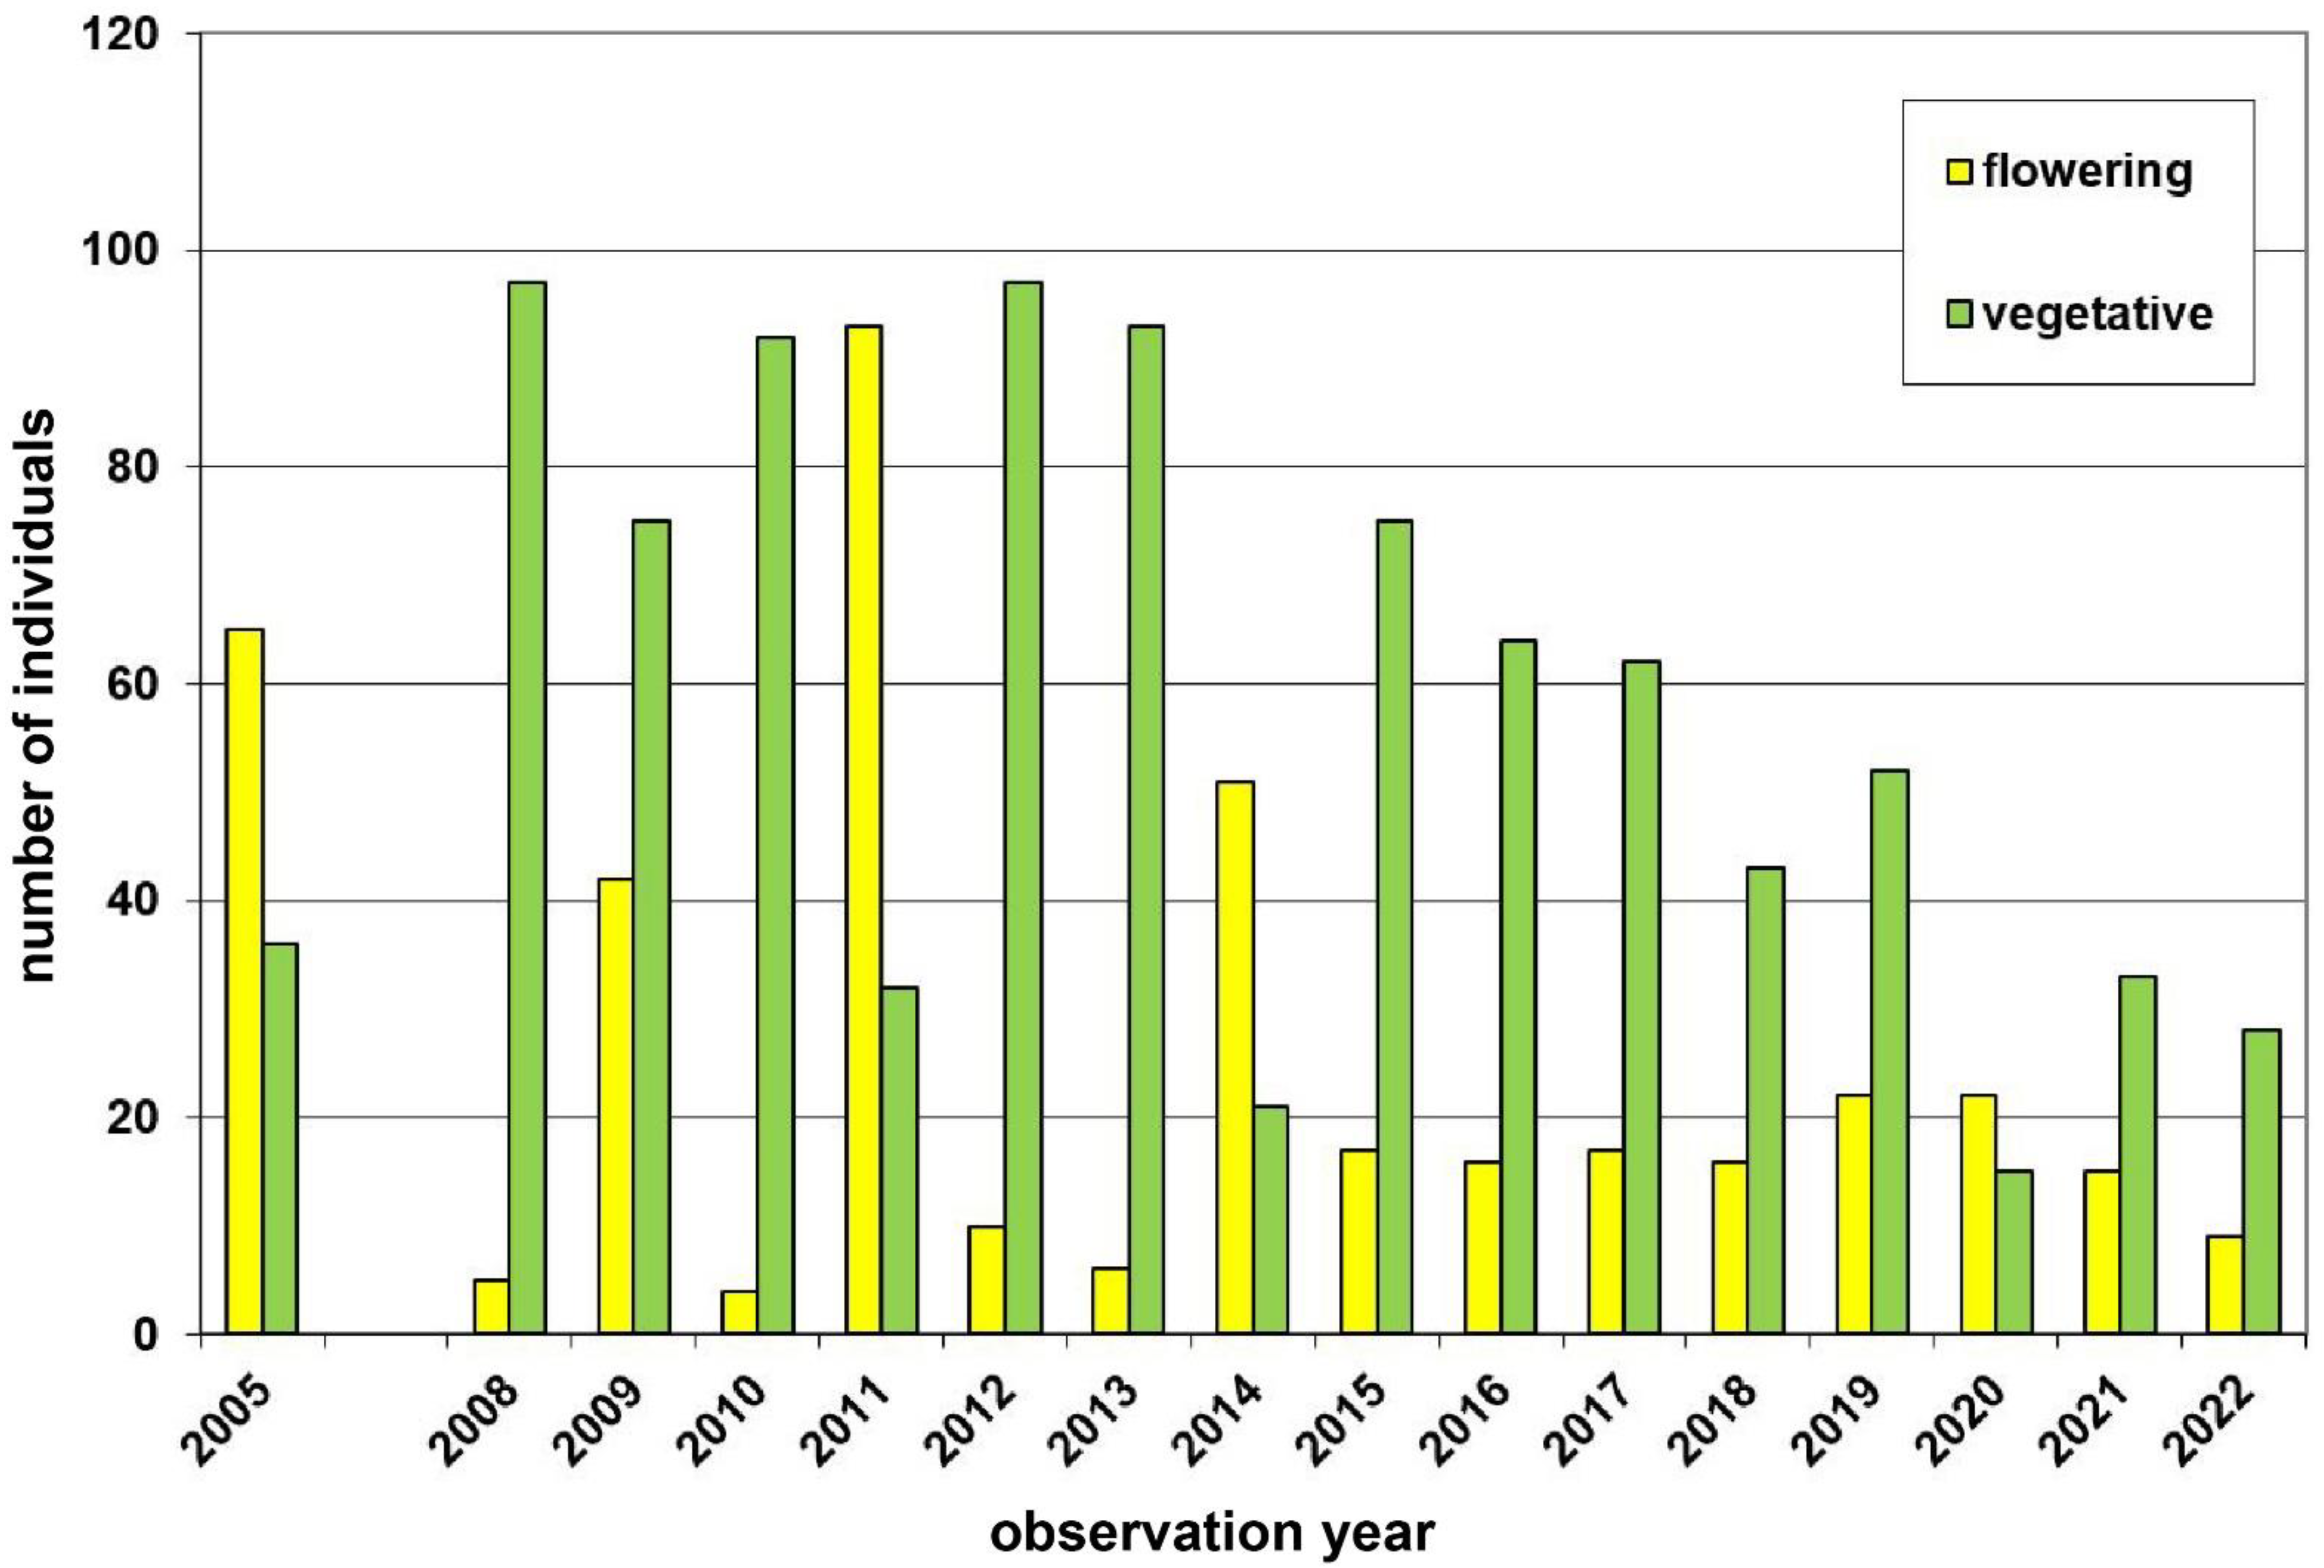
| 4 | Münichreith | Waldviertel | 825 | yellow | 9000 | Total count of flowering plants | 2005–2014 | Figure A2, p.13 |
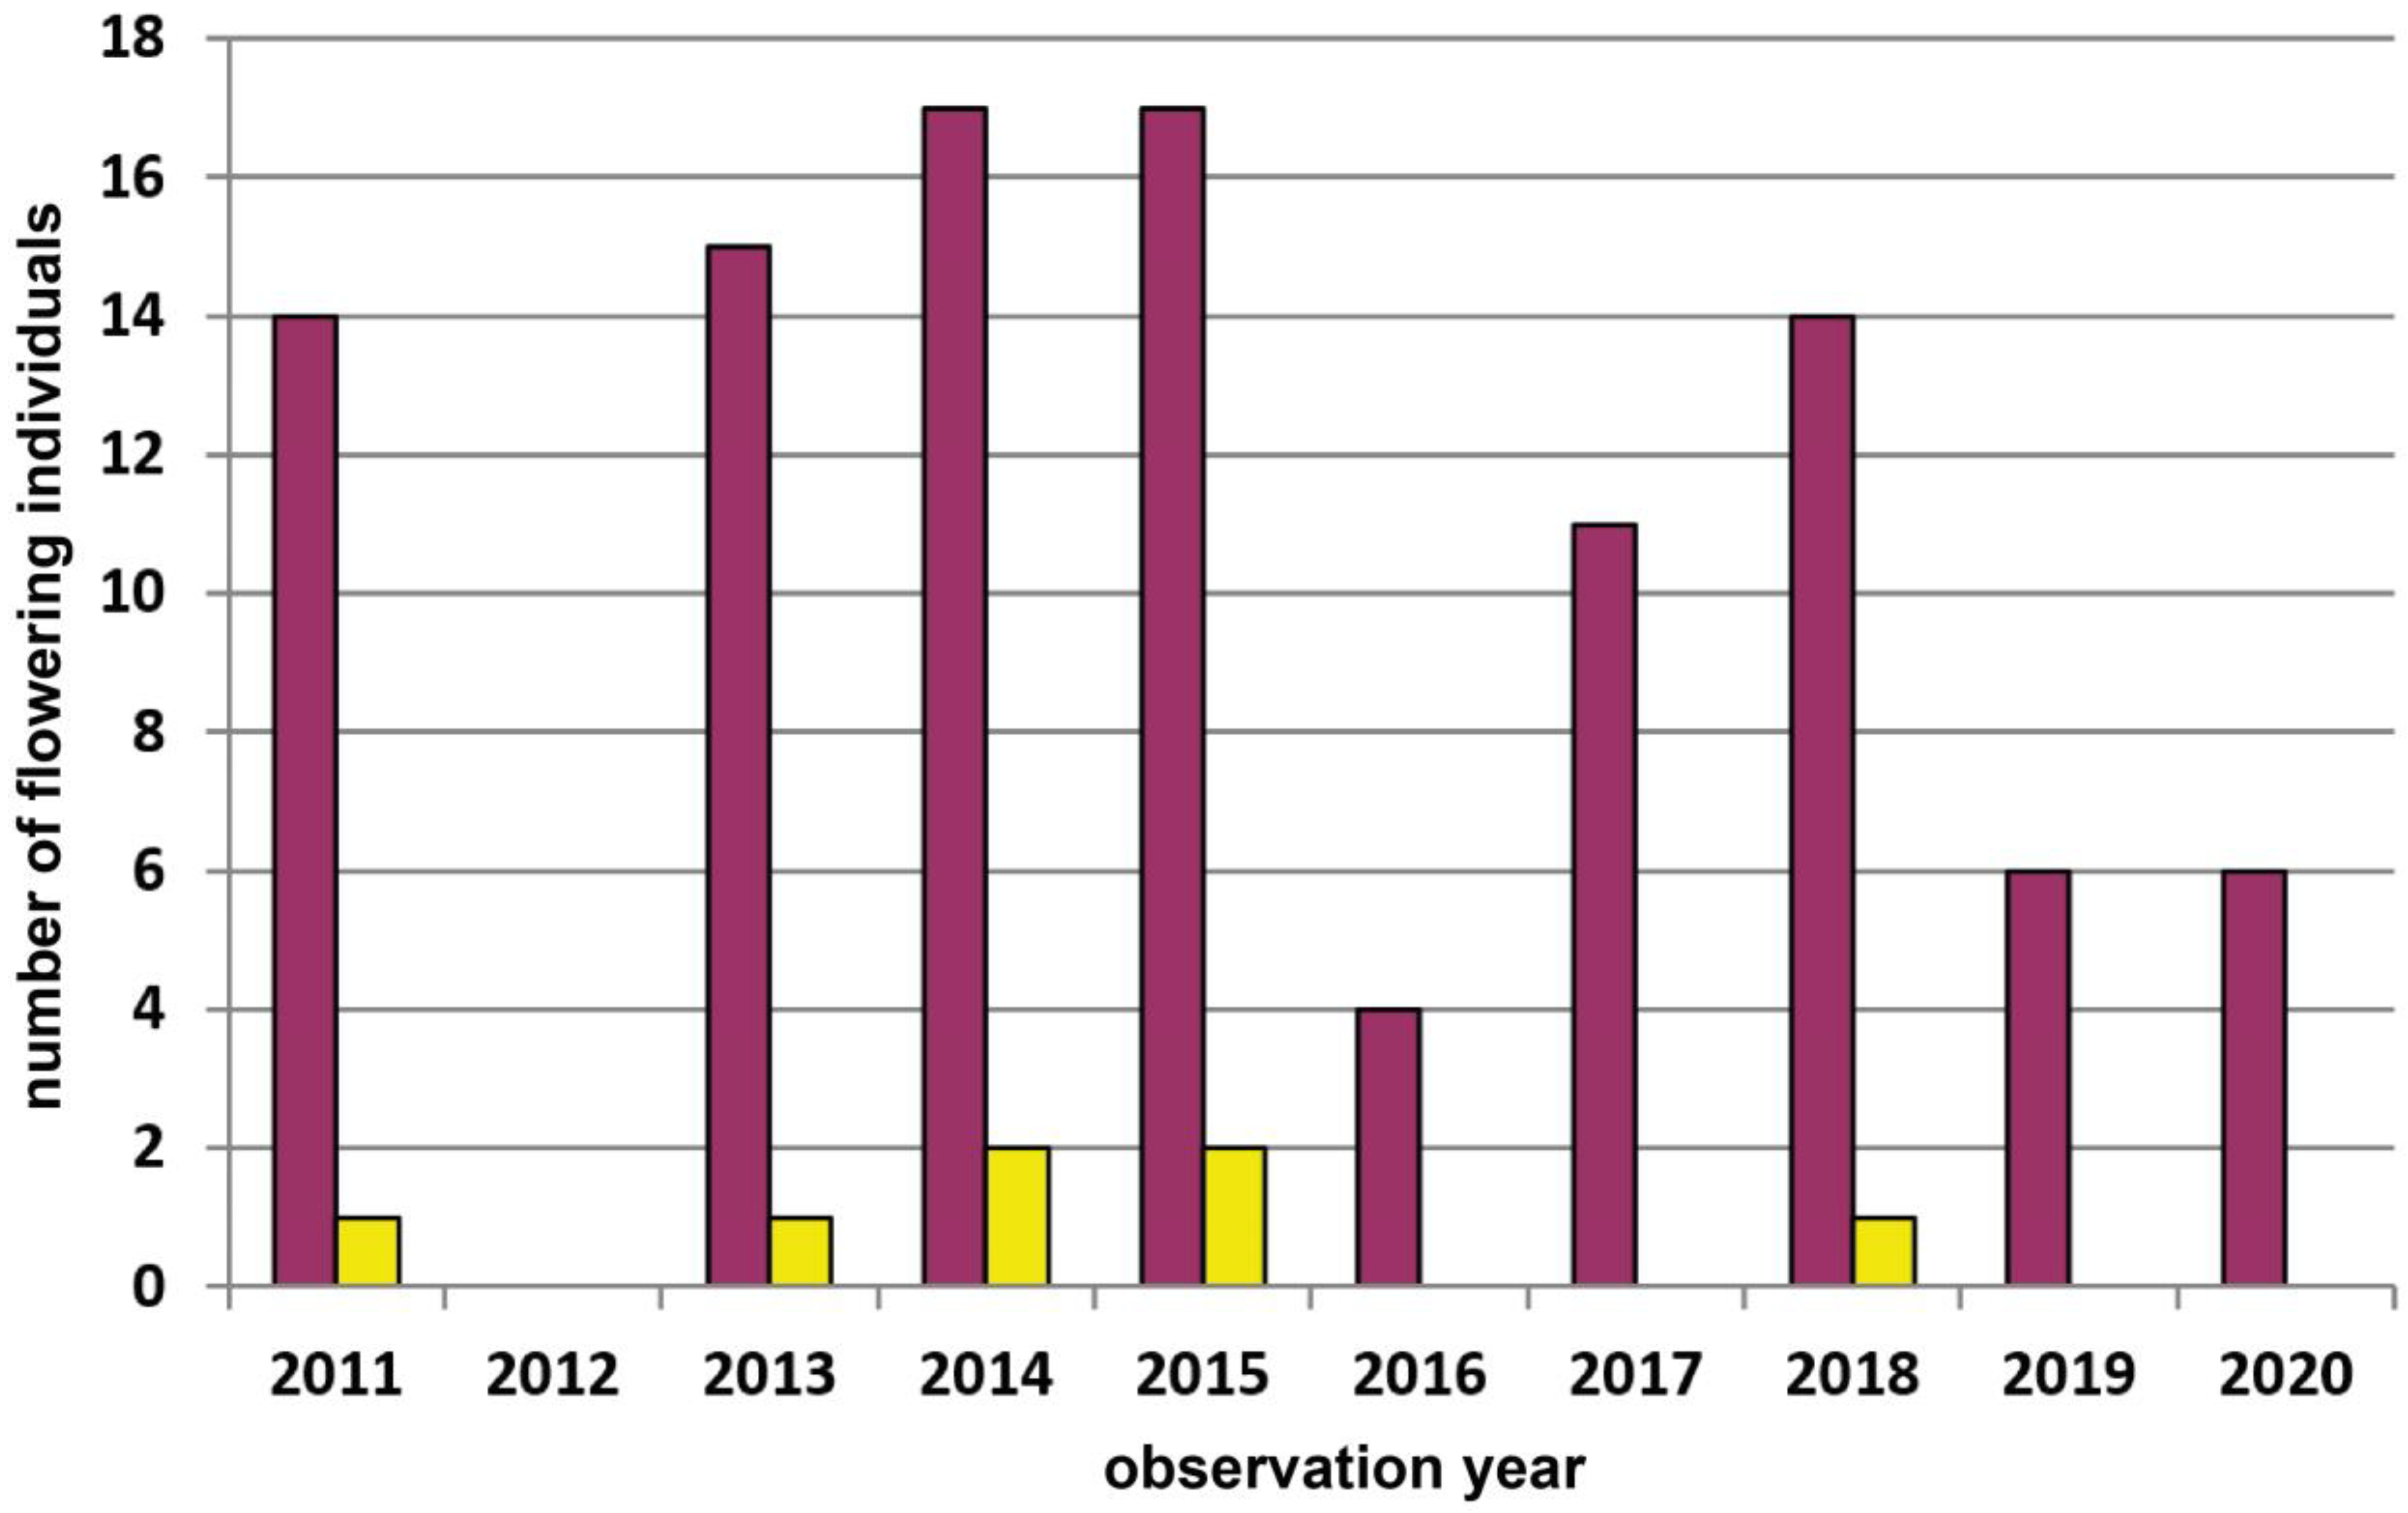
| 5 | Wernhies | Waldviertel | 670 | red | 3000 | Total count of flowering plants | 2007–2022 | Figure 4, p.7 |
| 6 | Wolfenreith | Waldviertel | 740 | red | 340 | Total count of flowering plants | 2011–2020 | Figure A4, p.14 |
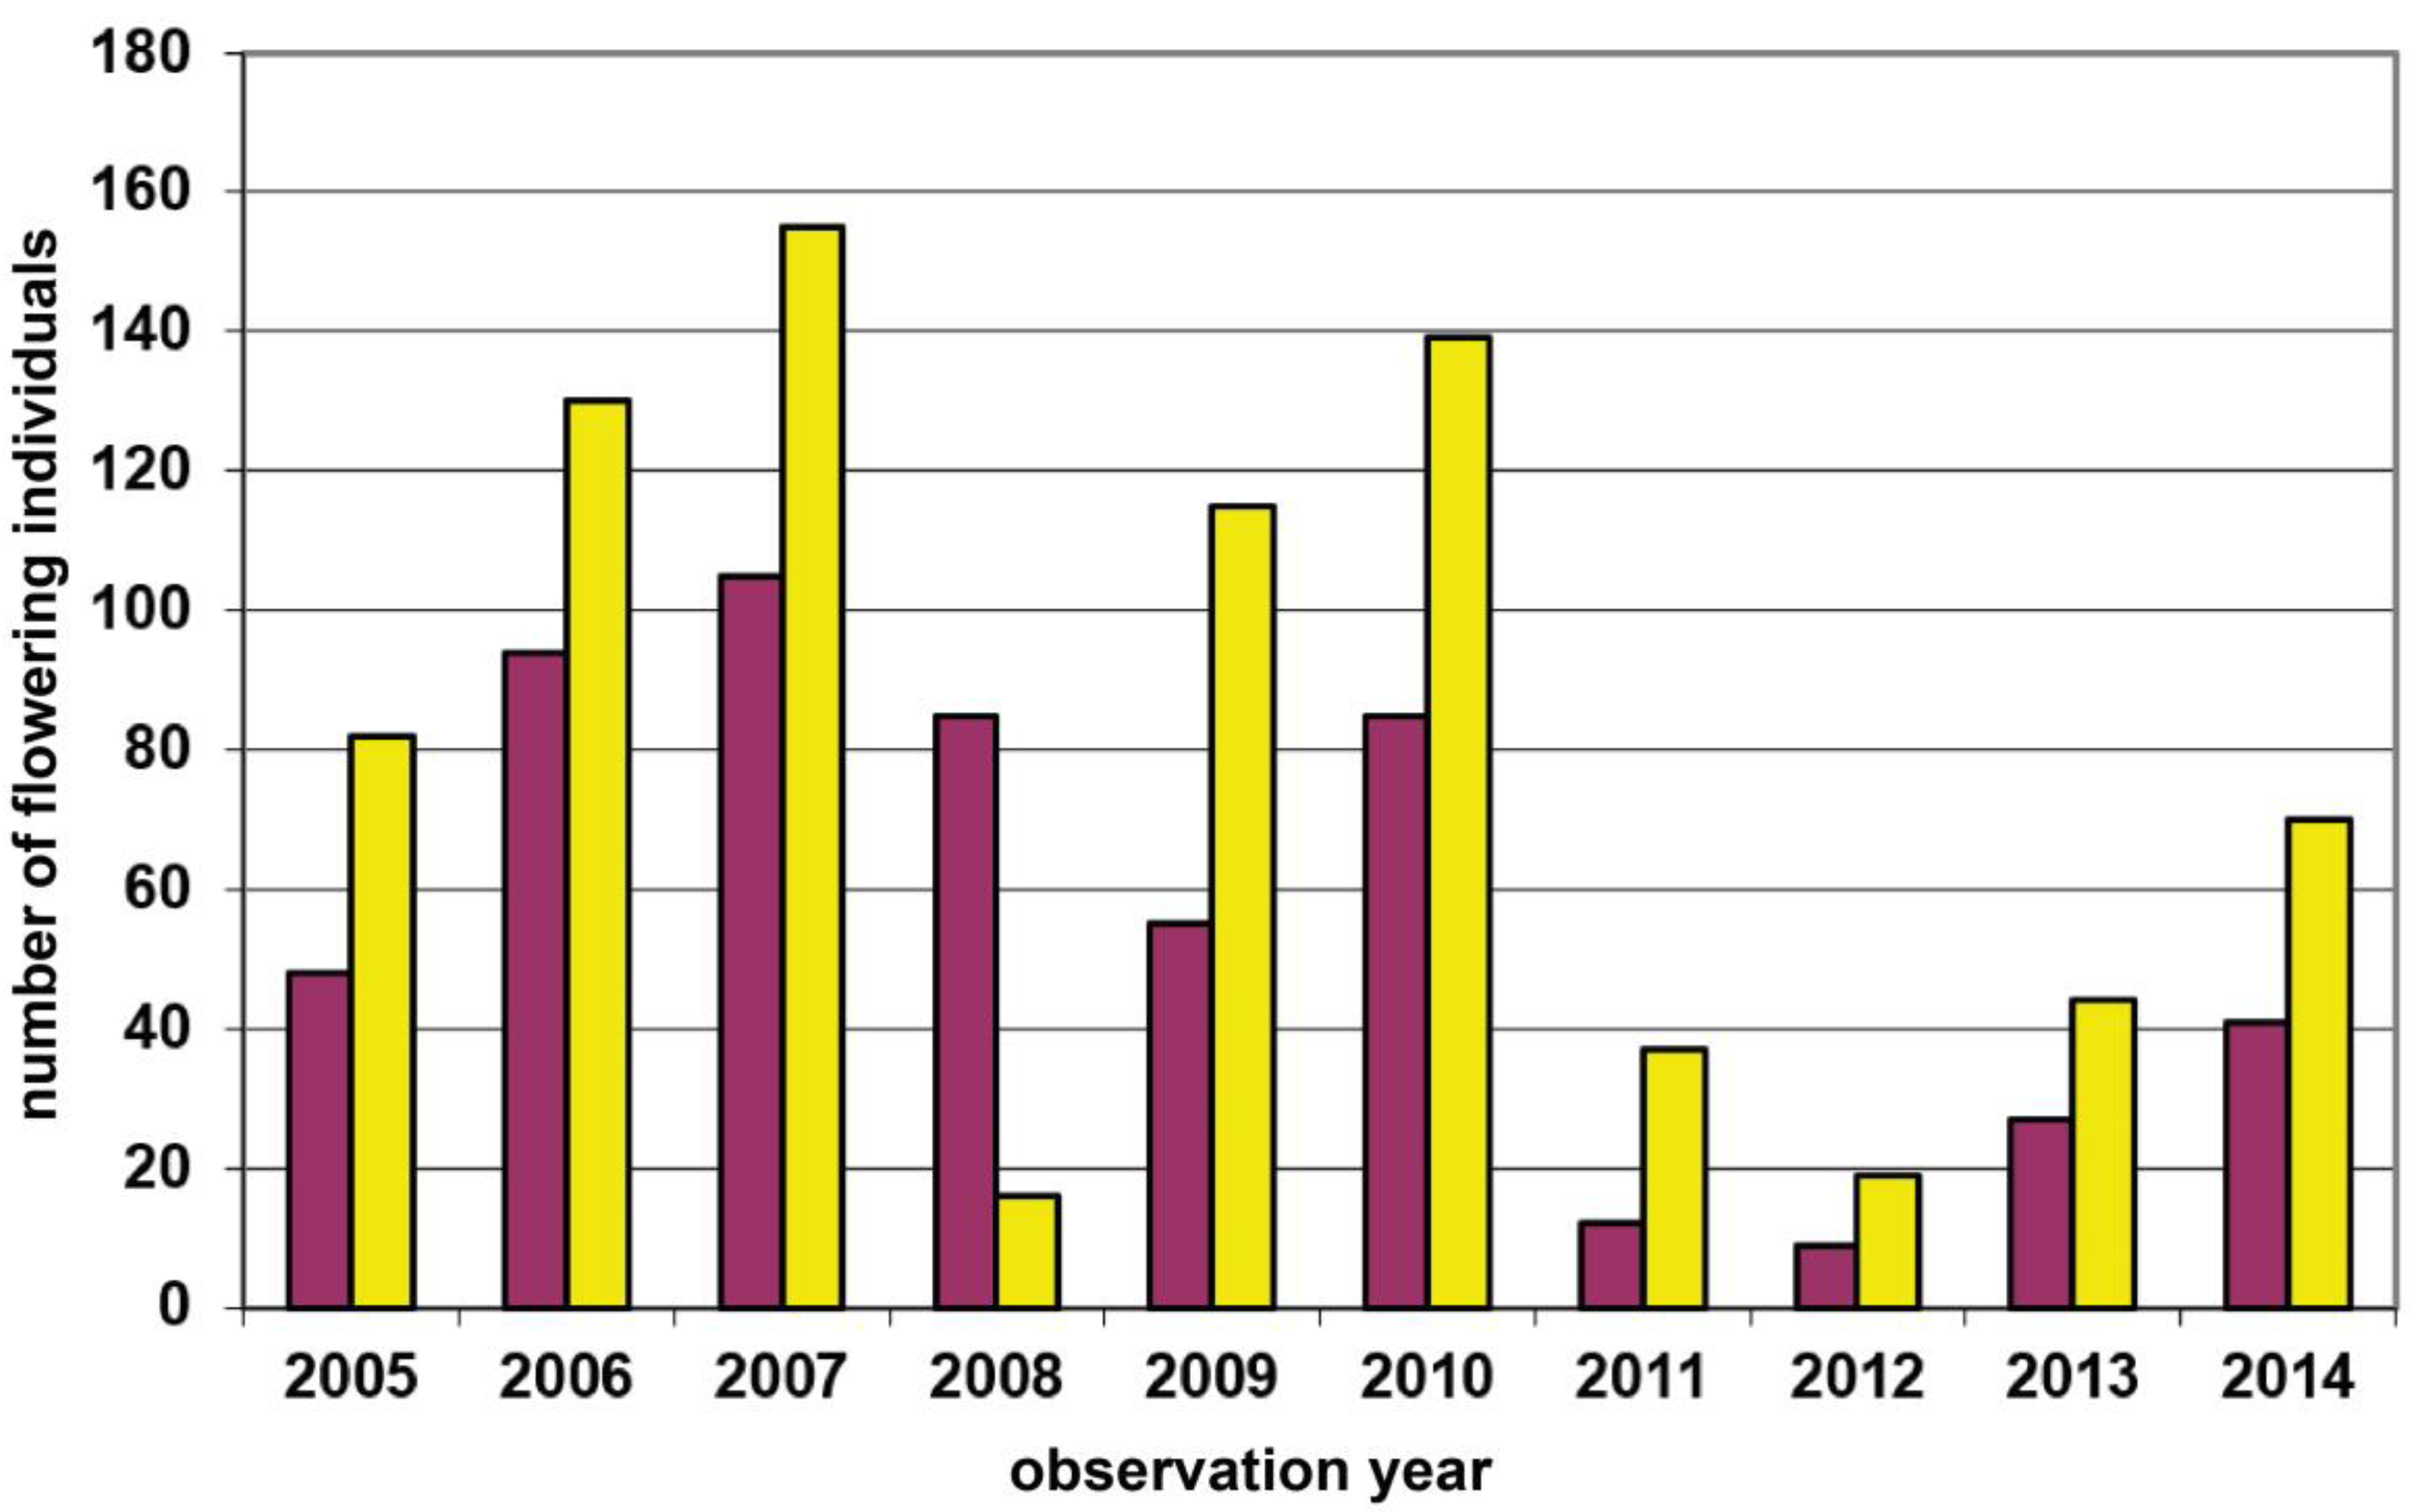
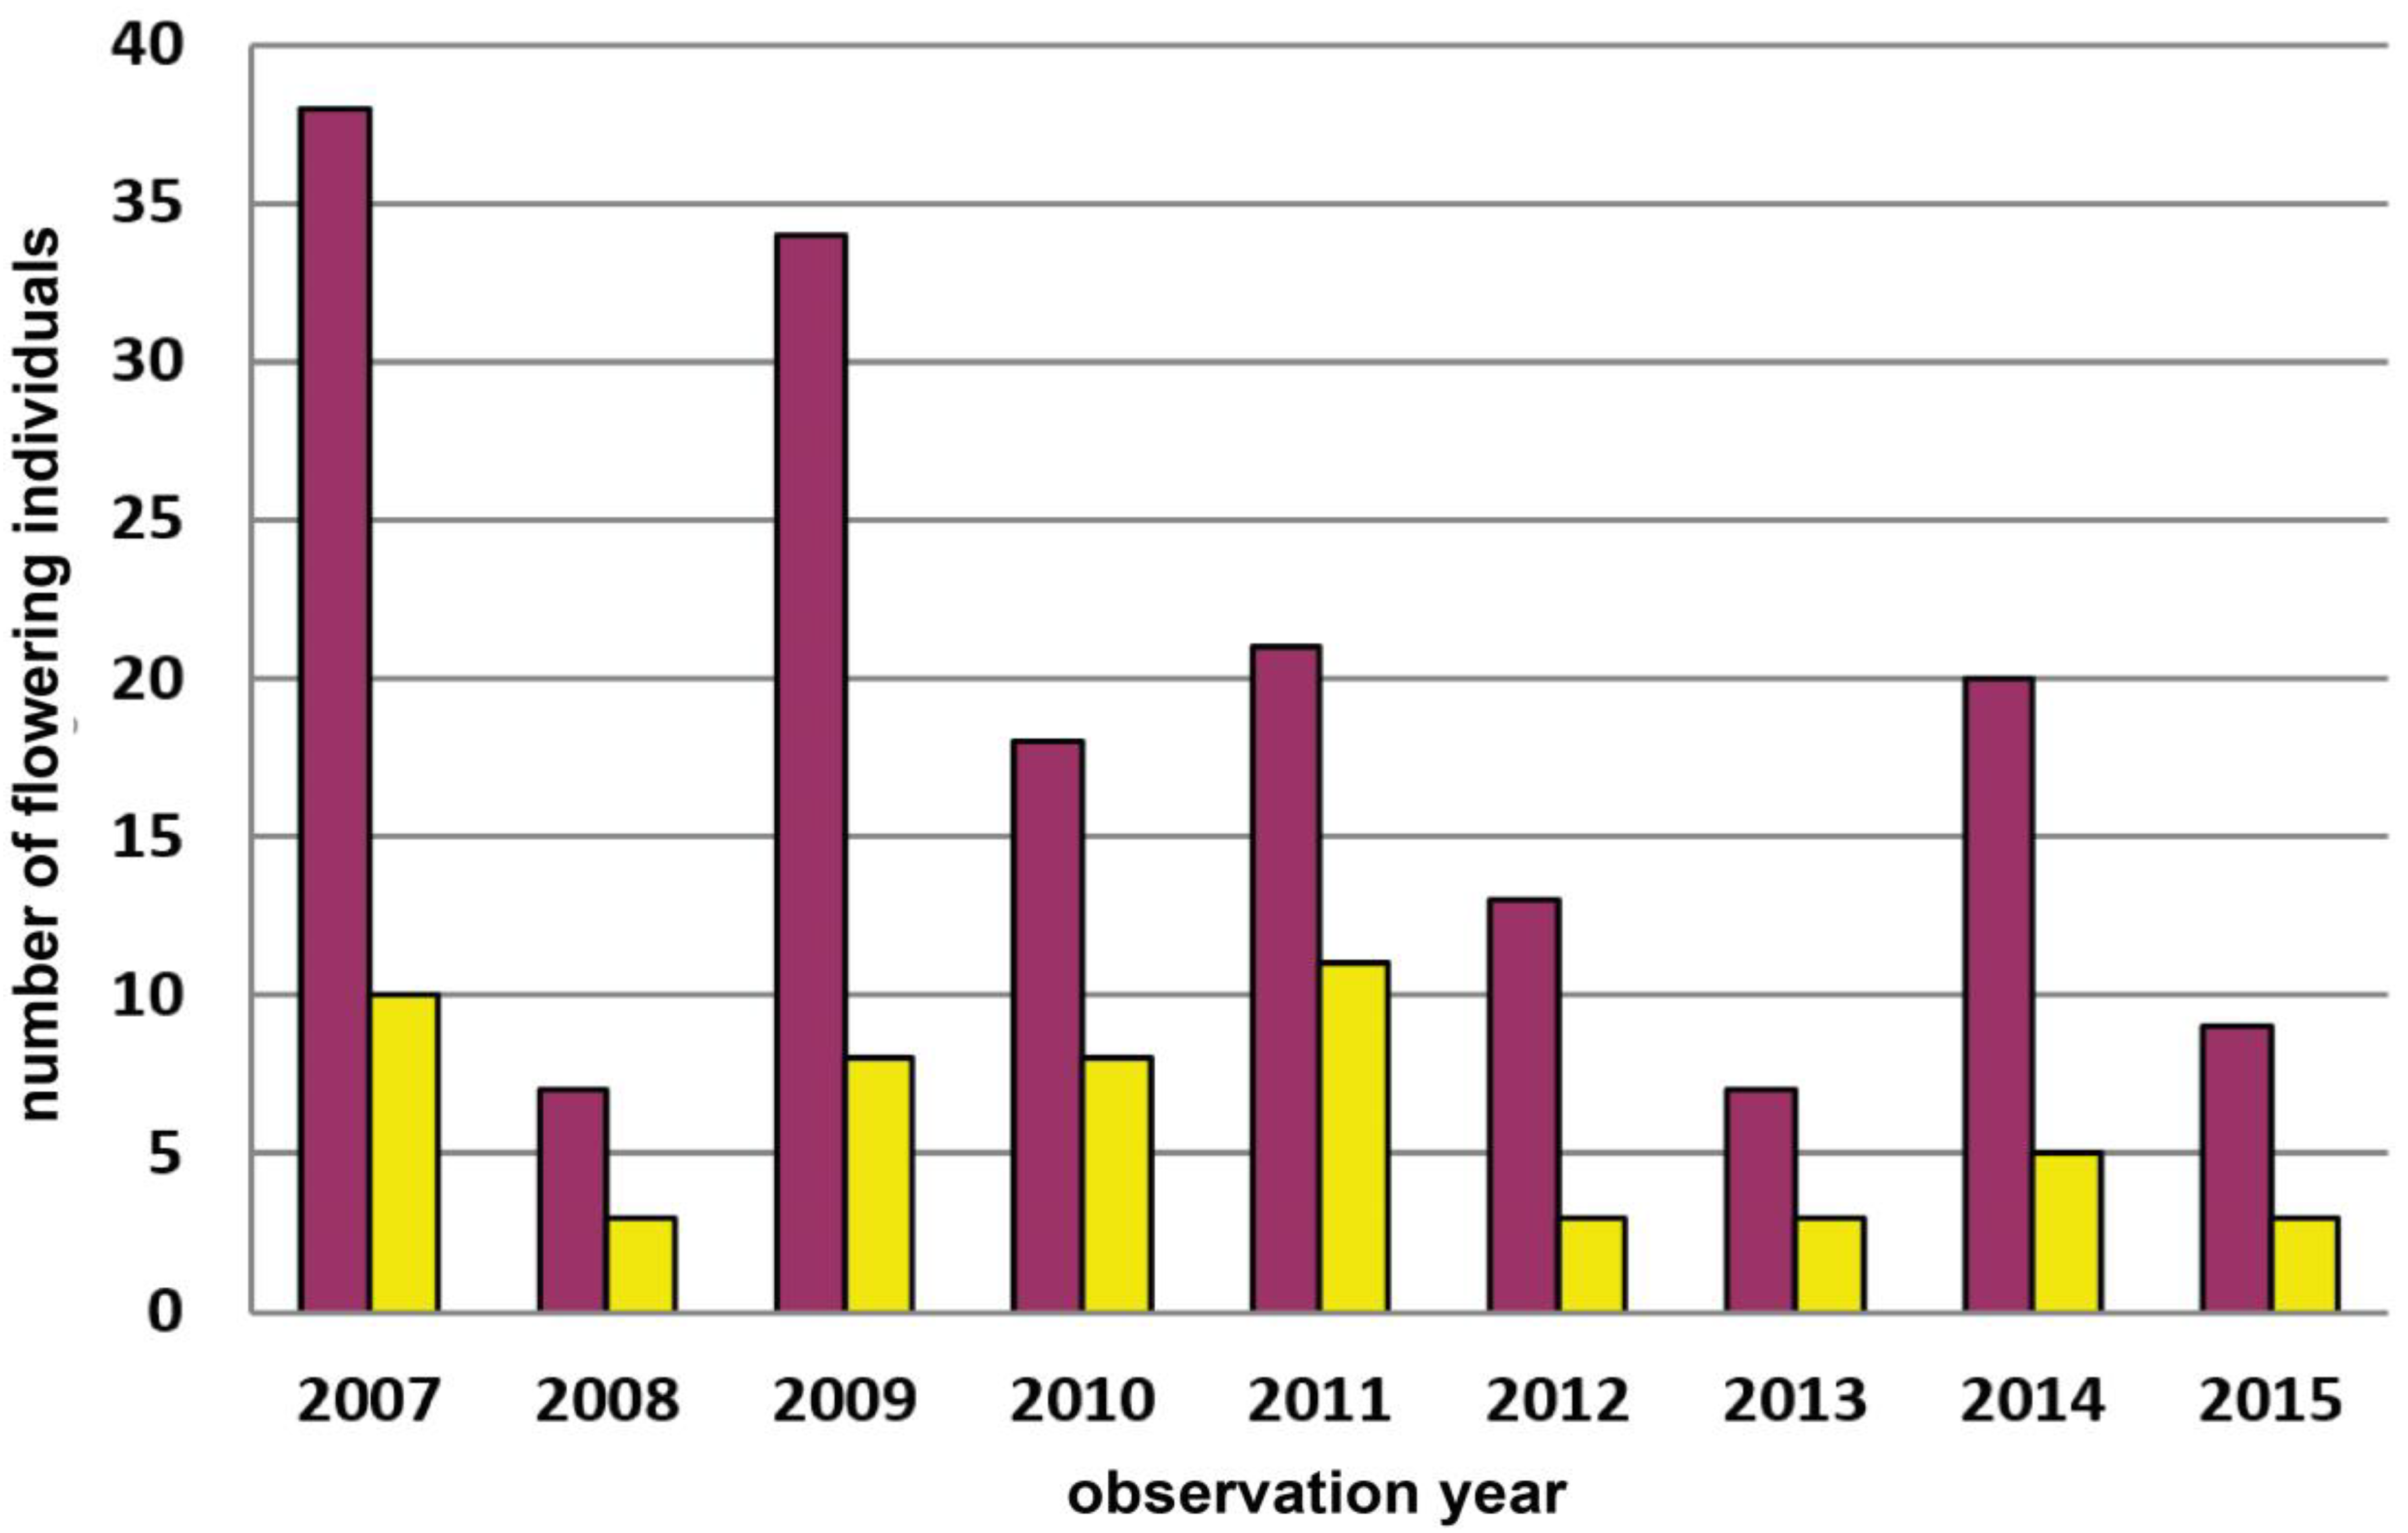
| 7 | Dürnstein–Höhereck | Wachau | 285 | red | 300 | Total count of flowering plants | 2007–2015 | Figure A5, p.15 |
| 8 | Retz–Mittelberg | Weinviertel | 320 | pure yellow | 90 | Total count of all plants | 2005–2022 | Figure 6, p.9 |
| 9 | Groisbach | Wienerwald | 465 | yellow | 2800 | Total count of flowering plants | 2009–2022 | Figure A6, p.15 |
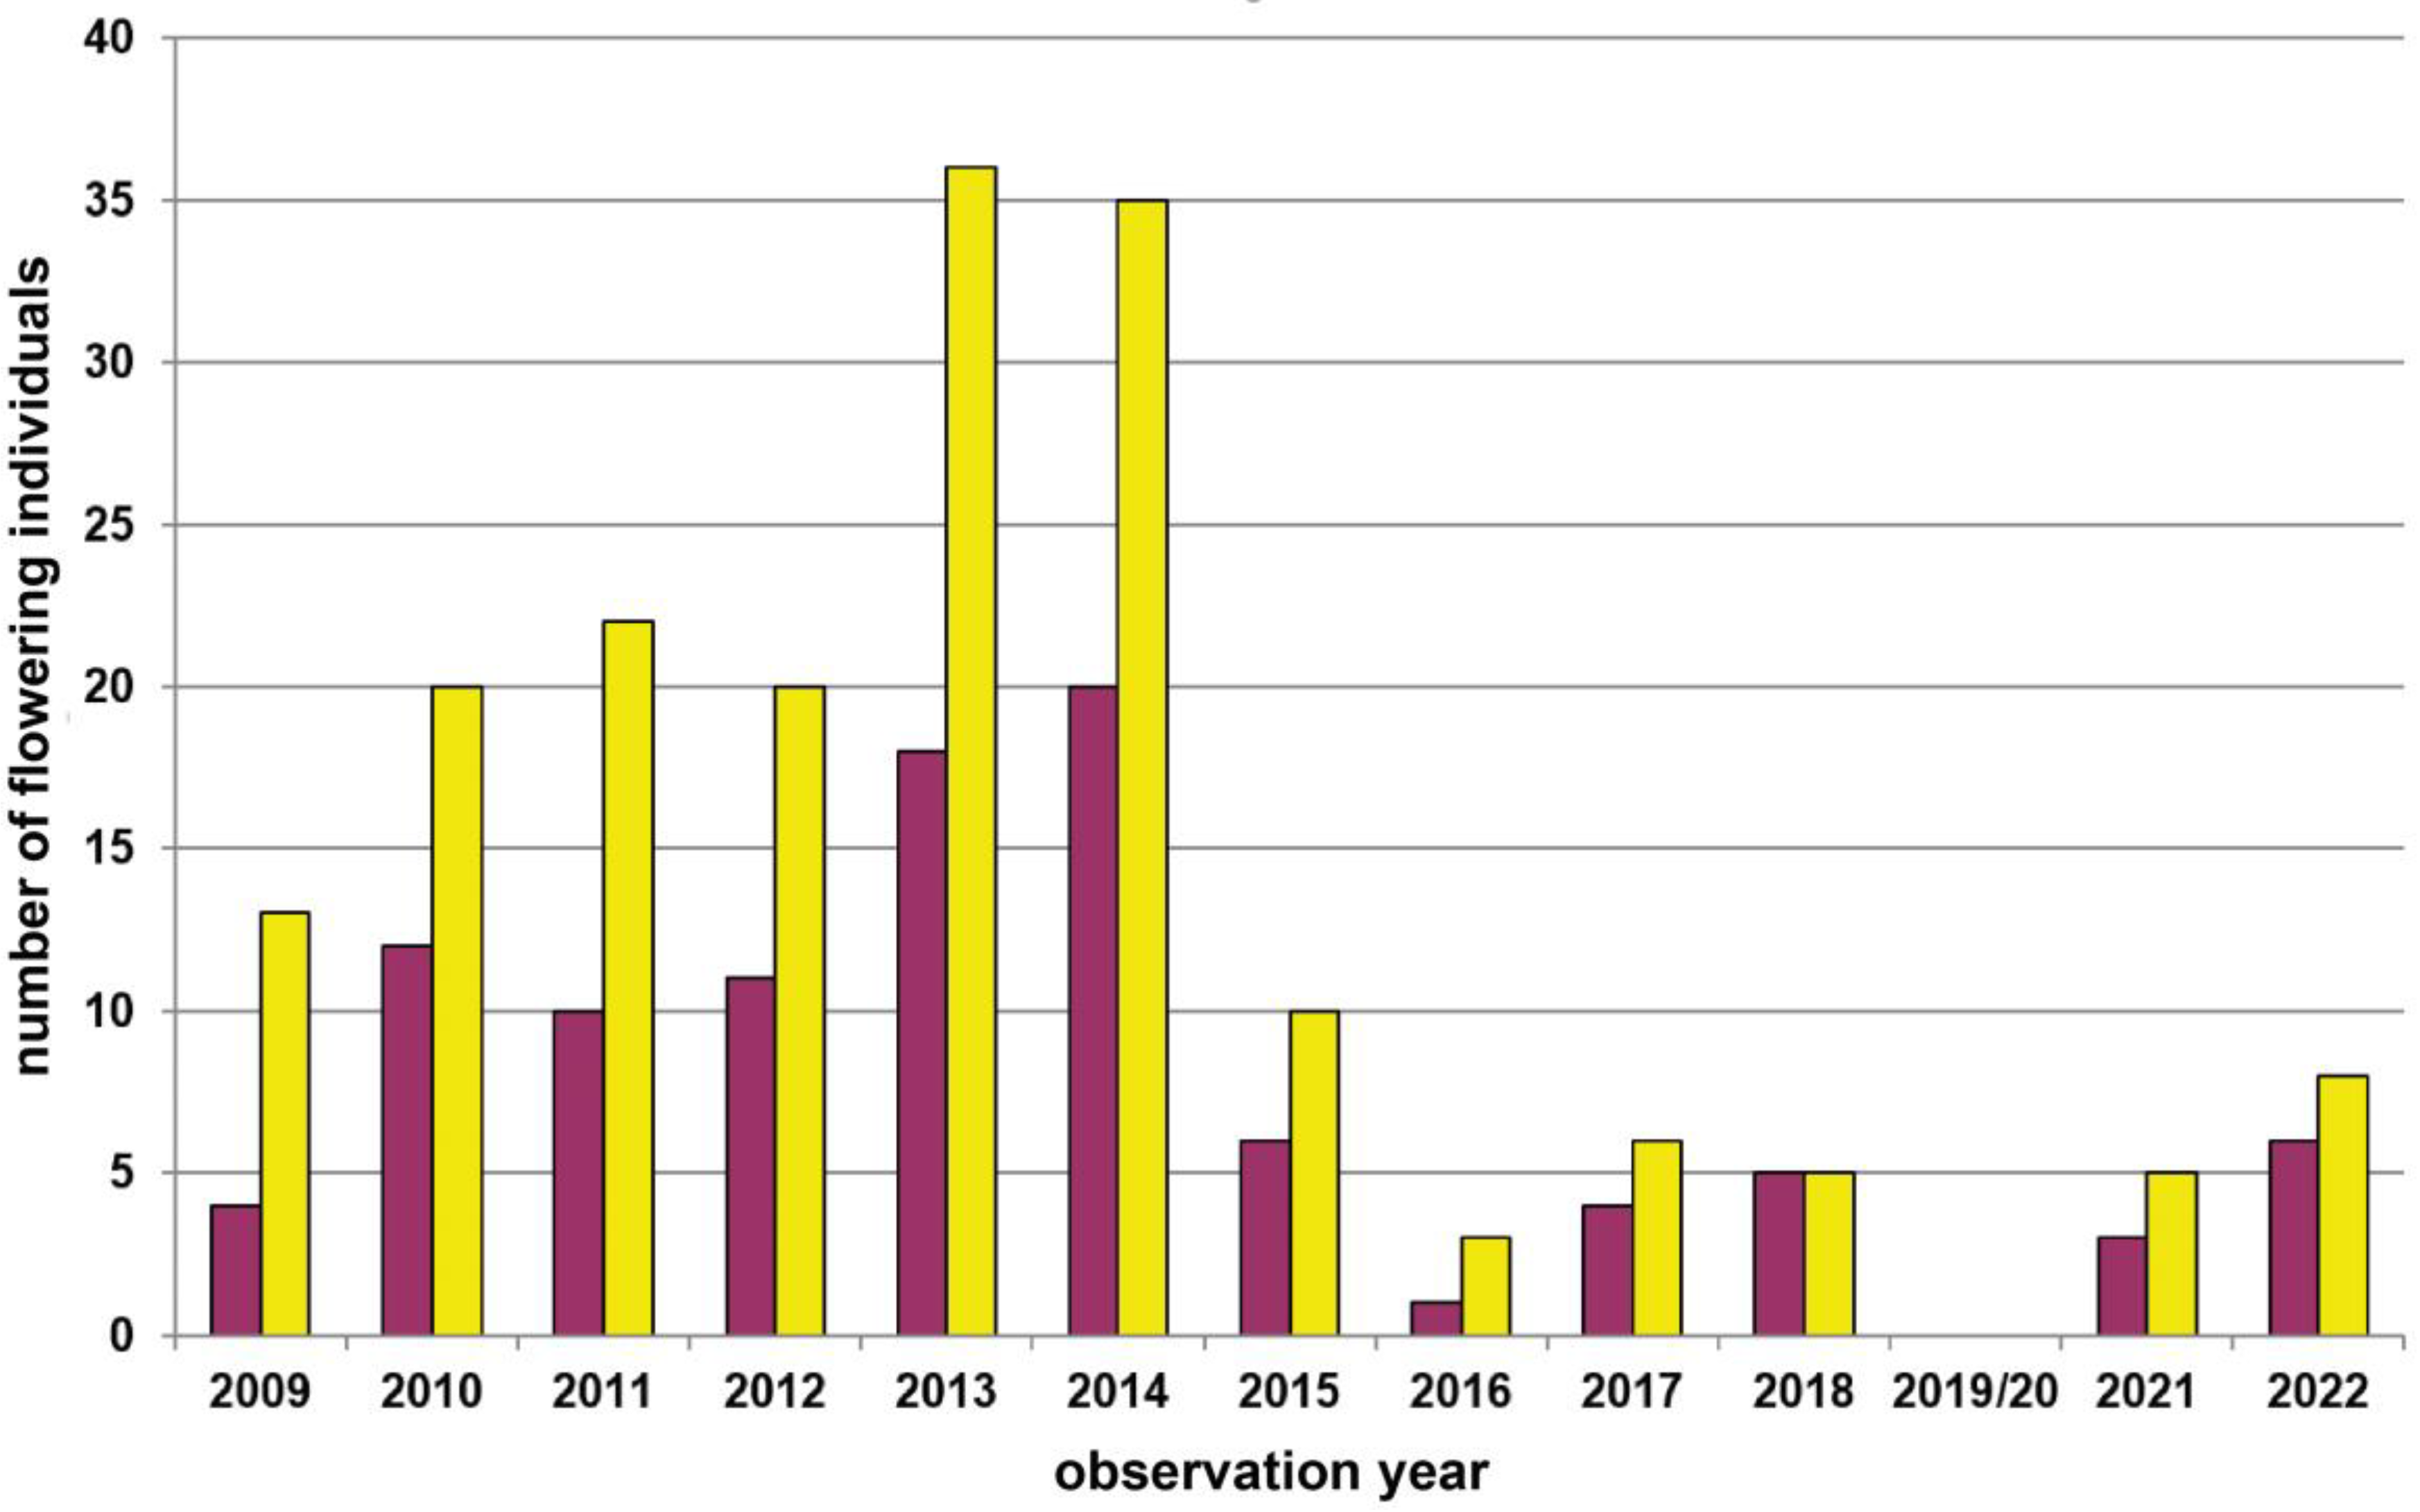
| 10 | Grub–Hocheck | Wienerwald | 435 | yellow | 2250 | Transect (225m) count of flowering plants | 2006–2022 | Figure 5, p.8 |
Disclaimer/Publisher’s Note: The statements, opinions and data contained in all publications are solely those of the individual author(s) and contributor(s) and not of MDPI and/or the editor(s). MDPI and/or the editor(s) disclaim responsibility for any injury to people or property resulting from any ideas, methods, instructions or products referred to in the content. |
© 2023 by the authors. Licensee MDPI, Basel, Switzerland. This article is an open access article distributed under the terms and conditions of the Creative Commons Attribution (CC BY) license (https://creativecommons.org/licenses/by/4.0/).
Share and Cite
Kropf, M.; Kriechbaum, M. Monitoring of Dactylorhiza sambucina (L.) Soó (Orchidaceae)—Variation in Flowering, Flower Colour Morph Frequencies, and Erratic Population Census Trends. Diversity 2023, 15, 179. https://doi.org/10.3390/d15020179
Kropf M, Kriechbaum M. Monitoring of Dactylorhiza sambucina (L.) Soó (Orchidaceae)—Variation in Flowering, Flower Colour Morph Frequencies, and Erratic Population Census Trends. Diversity. 2023; 15(2):179. https://doi.org/10.3390/d15020179
Chicago/Turabian StyleKropf, Matthias, and Monika Kriechbaum. 2023. "Monitoring of Dactylorhiza sambucina (L.) Soó (Orchidaceae)—Variation in Flowering, Flower Colour Morph Frequencies, and Erratic Population Census Trends" Diversity 15, no. 2: 179. https://doi.org/10.3390/d15020179