Article

Dispersal Capabilities Do Not Parallel Ecology and Cryptic Speciation in European Cheliferidae Pseudoscorpions (Pseudoscorpiones: Cheliferidae)

1
Department of Zoology, Faculty of Science, Charles University, Viničná 7, CZ-128 44 Prague, Czech Republic
2
Department of Biology, Faculty of Science, University of Hradec Králové, Rokitanského 62, CZ-500 03 Hradec Králové, Czech Republic
*
Author to whom correspondence should be addressed.
Diversity 2023, 15(10), 1040; https://doi.org/10.3390/d15101040
Submission received: 5 September 2023 / Revised: 23 September 2023 / Accepted: 25 September 2023 / Published: 27 September 2023
(This article belongs to the Special Issue Evolutionary Patterns and Diversity of Arachnida)

Abstract

:
The ability to disperse has continually shaped both the distribution and diversification of biota, and it affects the survival of the species with respect to wide-ranging habitat loss. As a response, organisms unable to spread by their own means often developed surrogate dispersal strategies. Pseudoscorpions possess small body sizes and cannot actively disperse over large distances and geographic barriers; therefore, they have adopted other ecological strategies. They are either sedentary and remain confined to stable environments or passively disperse via phoresy and are capable of inhabiting a wide variety of habitats, including temporary ones. In this paper, we use barcoding data to investigate the genetic diversity of four widely distributed and relatively morphologically uniform Cheliferidae genera Chelifer, Dactylochelifer, Rhacochelifer and Hysterochelifer. We aim to (i) test whether the genera harbor cryptic diversity and (ii) evaluate whether the genetic structure of the species parallels their dispersal capabilities and habitat preferences (i.e., ecological strategies). In general, we uncovered independent lineages within all analyzed genera, which indicates their need for a thorough and integrative taxonomic revision. More specifically, we detected a varying degree of genetic structuring among the lineages. Known phoretic species, as well as some species and delimited lineages that are not known to use this manner of dispersal, showed a complete lack of geographical structure and shared haplotypes over large distances, while other taxa had restricted distributions. We argue that genetic structure can be used as a proxy to evaluate species’ dispersal manner and efficacy. Our results also suggest that taxa inhabiting stable environments might use phoresy for their dispersal.

1. Introduction

One of the central topics in biodiversity research is to uncover the underlying evolutionary mechanisms that created the current distributions of biota [1,2]. Congruencies among phylogeographic patterns in unrelated taxa that share a similar level of dispersal capability can, for example, inform us of past geological and climatic events that played a key role within a geographic region [3,4,5]. As such, the capability to disperse (or the lack thereof) has continually shaped taxa distributions [6,7,8] and critically affects the survival of species in the case of wide-ranging habitat loss [9]. Organisms unable to disperse by their own means often developed passive methods of dispersal, such as the wind-mediated dispersal of eggs and dispersal via attachment to a more vagile carrier, in order to compensate for their small body size or sedentary lifestyle [10,11,12]. However, relatively little is known about the genetic structure of arthropods that rely on other organisms for their own dispersal [13,14,15,16].
Pseudoscorpions, with about 4000 described species [17], belong among smaller arachnid orders that have historically been neglected due to their morphological uniformity, small body size and rather cryptic lifestyle [18]. Due to their small size, pseudoscorpions typically cannot actively disperse over large distances and geographical barriers. As a result, pseudoscorpion taxa adopted one of the two distinct ecological strategies: humicolous species mainly inhabit soil and leaf litter, while arboricolous species are associated with bark, tree hollows and other temporary habitats [19,20,21]. The strategies also presumably have an opposite impact on the diversification and dispersal capabilities of the taxa. The soil-dwelling species, or species inhabiting isolated microhabitats with stable conditions such as caves, are usually sedentary. Consequently, they show high tendencies toward microendemism [22,23,24,25] and might be highly sensitive to habitat degradation [26]. On the other hand, pseudoscorpion species that inhabit temporary and unstable habitats (e.g., tree hollows, bird nests, decaying plant material, insect galls, etc.) were able to surpass their low vagility and disperse via phoresy, i.e., hitchhiking on the body of a more vagile carrier [27], because of the strong evolutionary pressure to disperse in order to find other suitable habitats. Pseudoscorpions’ phoretic hosts are typically a larger and mobile insect, which naturally exists in the same type of patchy microhabitat [27,28,29]. As a result, phoretic species typically have greater distribution ranges [13,16,30,31,32]. Additionally, large distributions are known from synanthropic species that at least partially owe their dispersal to human activity, e.g., transport of goods and landscape transformation. Such distributions may even span across different continents [33].
The assessment of pseudoscorpion diversity and phylogenetic relationships within the order Pseudoscorpiones has traditionally been studied via morphological approaches [33,34]. However, the evaluation of morphological characters and their interpretation in an evolutionary context are challenging because of the compounded effect of the overall external uniformity of the group and our poor understanding of intra- and interspecific variability in the given characters [35,36]. As a result, species routinely oscillated among genera and sometimes even families [17,37]. Our estimation of pseudoscorpion diversity is also likely to be skewed for the same reasons. The notion that morphological approaches typically underestimate the real number of species in morphologically uniform taxa [38] evidently also applies to pseudoscorpions. Molecular methods revealed the presence of cryptic diversity in many genera [25,39,40,41,42], including those from well-studied regions, such as Central and Western Europe [16,21]. Additionally, the implementation of genetic/genomic data [43,44] provided stability to phylogenetic relationships and created the necessary backbone for the targeted investigation of ecologic and evolutionary patterns in pseudoscorpions [13,16,21,45,46,47,48].
In recent years, DNA barcoding has gained popularity as an accessible tool for both specimen identification and species discovery [49,50]. As a result, public databases, such as BOLD [51] and GenBank [52], have amassed large amounts of barcoding data for a broad range of taxa. Such availability facilitates specimen identification via comparison with known reference sequences [53], useful in wide array of applications e.g., environmental DNA analyses [54,55], prey/food analysis [56,57] and linking different developmental stages, sexes or castes within one species [58,59,60]. Barcoding is commonly used for regional diversity assessment [61,62], producing genetic data for widely distributed species, thus allowing the large-scale assessment of population structure and distribution patterns and identification of potential cryptic diversity [63,64,65,66].
In this paper, we investigate the genetic structures of four widely distributed European genera of pseudoscorpions (Chelifer, Dactylochelifer, Rhacochelifer and Hysterochelifer) from the family Cheliferidae. Cheliferidae is cosmopolitan and one of the most diversified pseudoscorpion families (312 described species; [17]); however, its diversity and intrafamiliar relationships remain poorly understood. Cheliferidae have never been sufficiently sampled in any phylogenetic analyses [43,44], and their taxonomy frequently relies on male-specific morphological characters [67]. Interestingly, the species of our target genera show significant differences in terms of the extent of their distributional ranges and habitat preferences [17]. While some species are known to be phoretic [27], as well as synathropic in case of Chelifer cancroides [35], the dispersal capabilities of most taxa are not known. We combine barcoding data [cytochrome c oxidase subunit 1 (Cox1) [68,69]], proceeding both from our targeted sampling and public databases, in order to (i) test whether the genetic structure reflects habitat preferences and dispersal capabilities (i.e., the opposite ecological strategies) and (ii) whether the genera in question harbor cryptic diversity.

2. Materials and Methods

2.1. Taxonomic Sampling

We analyzed 217 samples of pseudoscorpions from the family Cheliferidae collected mostly across Europe and adjacent areas (Table S1). We predominantly targeted common genera, namely Chelifer, Dactylochelifer, Hysterochelifer and Rhacochelifer, in order to assess distribution patterns and genetic structures within their widely distributed species and test for the potential presence of cryptic diversity. The specimens were collected via leaf litter sifting or hand-collected under tree bark, under stones, in tree hollows, in galls and in synanthropic environments. The intensity of sampling and the used collection methods were similar at each site; all specimens have been included in the analyses. However, none of the individuals was collected during phoresy. All samples were stored in 96% ethanol at −20 °C for future DNA analyses. Additional Cheliferidae Cox1 sequences (62 in total) were downloaded from the GenBank and BOLD databases (Table S1) to both broaden geographic sampling of our target groups and increase family-level taxon sampling. Specimens of Cheiridium museorum (Cheirididae), Titanatemnus natalensis (Atemnidae), Chernes hahnii and C. nigrimanus (both Chernetidae) were used as outgroups in our analyses, representing pseudoscorpion families recovered as the closest relatives of Cheliferidae [44]. All distribution maps were created via SimpleMappr [70], and geographic distances among sample localities were calculated via Geographic Distance Matrix Generator [71].

2.2. DNA Extraction and PCR Amplification

Genomic DNA was extracted from the whole specimens using a Geneaid Genomic DNA Extraction Kit (Tissue) (Taipei, Taiwan) following manufacturer’s protocol. To maximize the extraction yield, specimens were carefully opened either in the pleural region or between the carapace and first tergite. The vouchers were subsequently returned to 96% ethanol for future morphological determination and stored in the collections of the Department of Zoology, Faculty of Science, Charles University, Prague. A fragment of mitochondrial protein coding cytochrome c oxidase I gene (Cox1, the animal barcode) was amplified via PCR (95 °C 3 min; 35 cycles of 95 °C 30 s, 45 °C 1 min, 72 °C 1.5 min; 72 °C 10 min) using primer pair C1-J-1490/C1-N-2198 [72]. The PCR products were Sanger-sequenced using the Macrogen (Amsterdam, Netherlands) and Biocev (Vestec, Czech Republic) sequencing facilities.

2.3. Phylogenetic Analyses

The chromatograms were assembled, edited and checked for stop codons in Geneious v. R9 [73]. The sequences were subsequently aligned using the MUSCLE [74] alignment algorithm included among the Geneious built-in options. The resulting matrix (“Cheliferidae_out_total”) comprising all sequences was reduced to unique haplotypes in TCS [75]. The reduced matrix comprising 197 unique haplotypes (“Cheliferidae_out_haplo”) was used for all downstream phylogenetic analyses. The best partitioning scheme (Table S2) was determined via PartitionFinder v. 2.1 [76] using the greedy algorithm and BIC selection criterion. Maximum likelihood (ML) analyses were conducted via RAxML v. 8.2 [77]. The GTRGAMMA evolutionary model was assigned to each partition, and the best tree was selected from 1000 iterations. Nodal support was recovered from 1000 replicates of bootstrap resampling. Bayesian inference (BI) was performed using BEAST 2.5.2 [78]. Two independent runs, each of 108 MCMC (Markow chain Monte Carlo) generations, were remotely run via CIPRES Science Gateway [79]. The input file, created in BEAUTi, was set with a single GTR+G partition and a strict clock in order to facilitate convergence and speed up the analyses. The convergence and effective sample size (ESS) was checked via Tracer v. 1.7.2 [80]; 25% of the samples was discarded as a burn-in for the analyses. The maximum clade credibility tree was inferred via TreeAnnotator v. 2.6.6. All of the resulting trees were visualized and manipulated via FigTree v. 1.4.4 [81]

2.4. Molecular Species Delimitation

Four genera with wide distributions (Chelifer, Dactylochelifer, Hysterochelifer and Rhacochelifer) were subjected to species delimitation analyses in order to assess (i) whether species boundaries were congruent with the morphological characterization of given taxa and (ii) whether widely spread species potentially harbored cryptic diversity. Individual matrices (“Chelifer_out”, “Dactylo_out”, “Hystero_out” and “Rhaco_out”) comprising the unique haplotypes of each taxon and selected outgroups (C. hahnii + D. latreillii for “Chelifer_out” and “Hystero_out” matrixes, and C. hahnii + C. cancroides for “Dactylo_out” and “Rhaco_out” matrixes) were created for each taxon.
We implemented four independent species-discovery approaches. Firstly, we used Assemble Species via Automatic Partitioning (ASAP) [82], which is a method that operates using hierarchical clustering principles. The analyses were performed via the ASAP delimitation server (https://bioinfo.mnhn.fr/abi/public/asap/ [accessed on 2 September 2022]) using both simple p-distances and the Kimura (K80) substitution model [83]. Secondly, we used statistical parsimony (SP) haplotype network analysis in TCS v 1.21 [75]; putative species were delimited under the 95% parsimony criterion. Finally, we used two independent tree-based methods: the Poisson Tree Process (PTP) [84] and the Generalized Mixed Yule coalescent analysis [85]. The PTP analyses were remotely run via the bPTP webserver (https://species.h-its.org/ptp/ [accessed on 15 October 2022]) for 5 × 10⁵ generations. The topologies for the PTP analyses were obtained via RAxML analyses carried out on taxa-specific matrices (“Chelifer_out”, “Dactylo_out”, “Hystero_out” and “Rhaco_out”) with the same parameter settings as the phylogenetic analyses performed on “Cheliferidae_out_haplo” (see above). The best partitioning schemes for each codon position were determined via PartitionFinder (Table S2). The outgroups were removed from each topology prior to the delimitation analyses. The GMYC analyses with a single threshold were carried out for taxa-specific matrices in the R environment (http://www.r-project.org [accessed on 15 February 2023]) using the SPLITS package [86]. The topologies were obtained via BEAST analyses performed on taxa-specific matrices with removed outgroups. Each analysis comprised two independent runs of 5 × 10⁷ generations, remotely performed via CIPRES Science Gateway and by implementing the best partitioning schemes for each codon position determined via PartitionFinder (Table S2). Delimitation analyses yielding lower numbers of putative species were preferred in the results interpretation stage (see Section 4.2).
Inter- and intraspecific genetic distances among the delimited Chelifer, Dactylochelifer, Hysterochelifer and Rhacochelifer species were calculated using Mega 11 [87] via both uncorrelated p-distances and the Tamura–Nei distance model [88].

3. Results

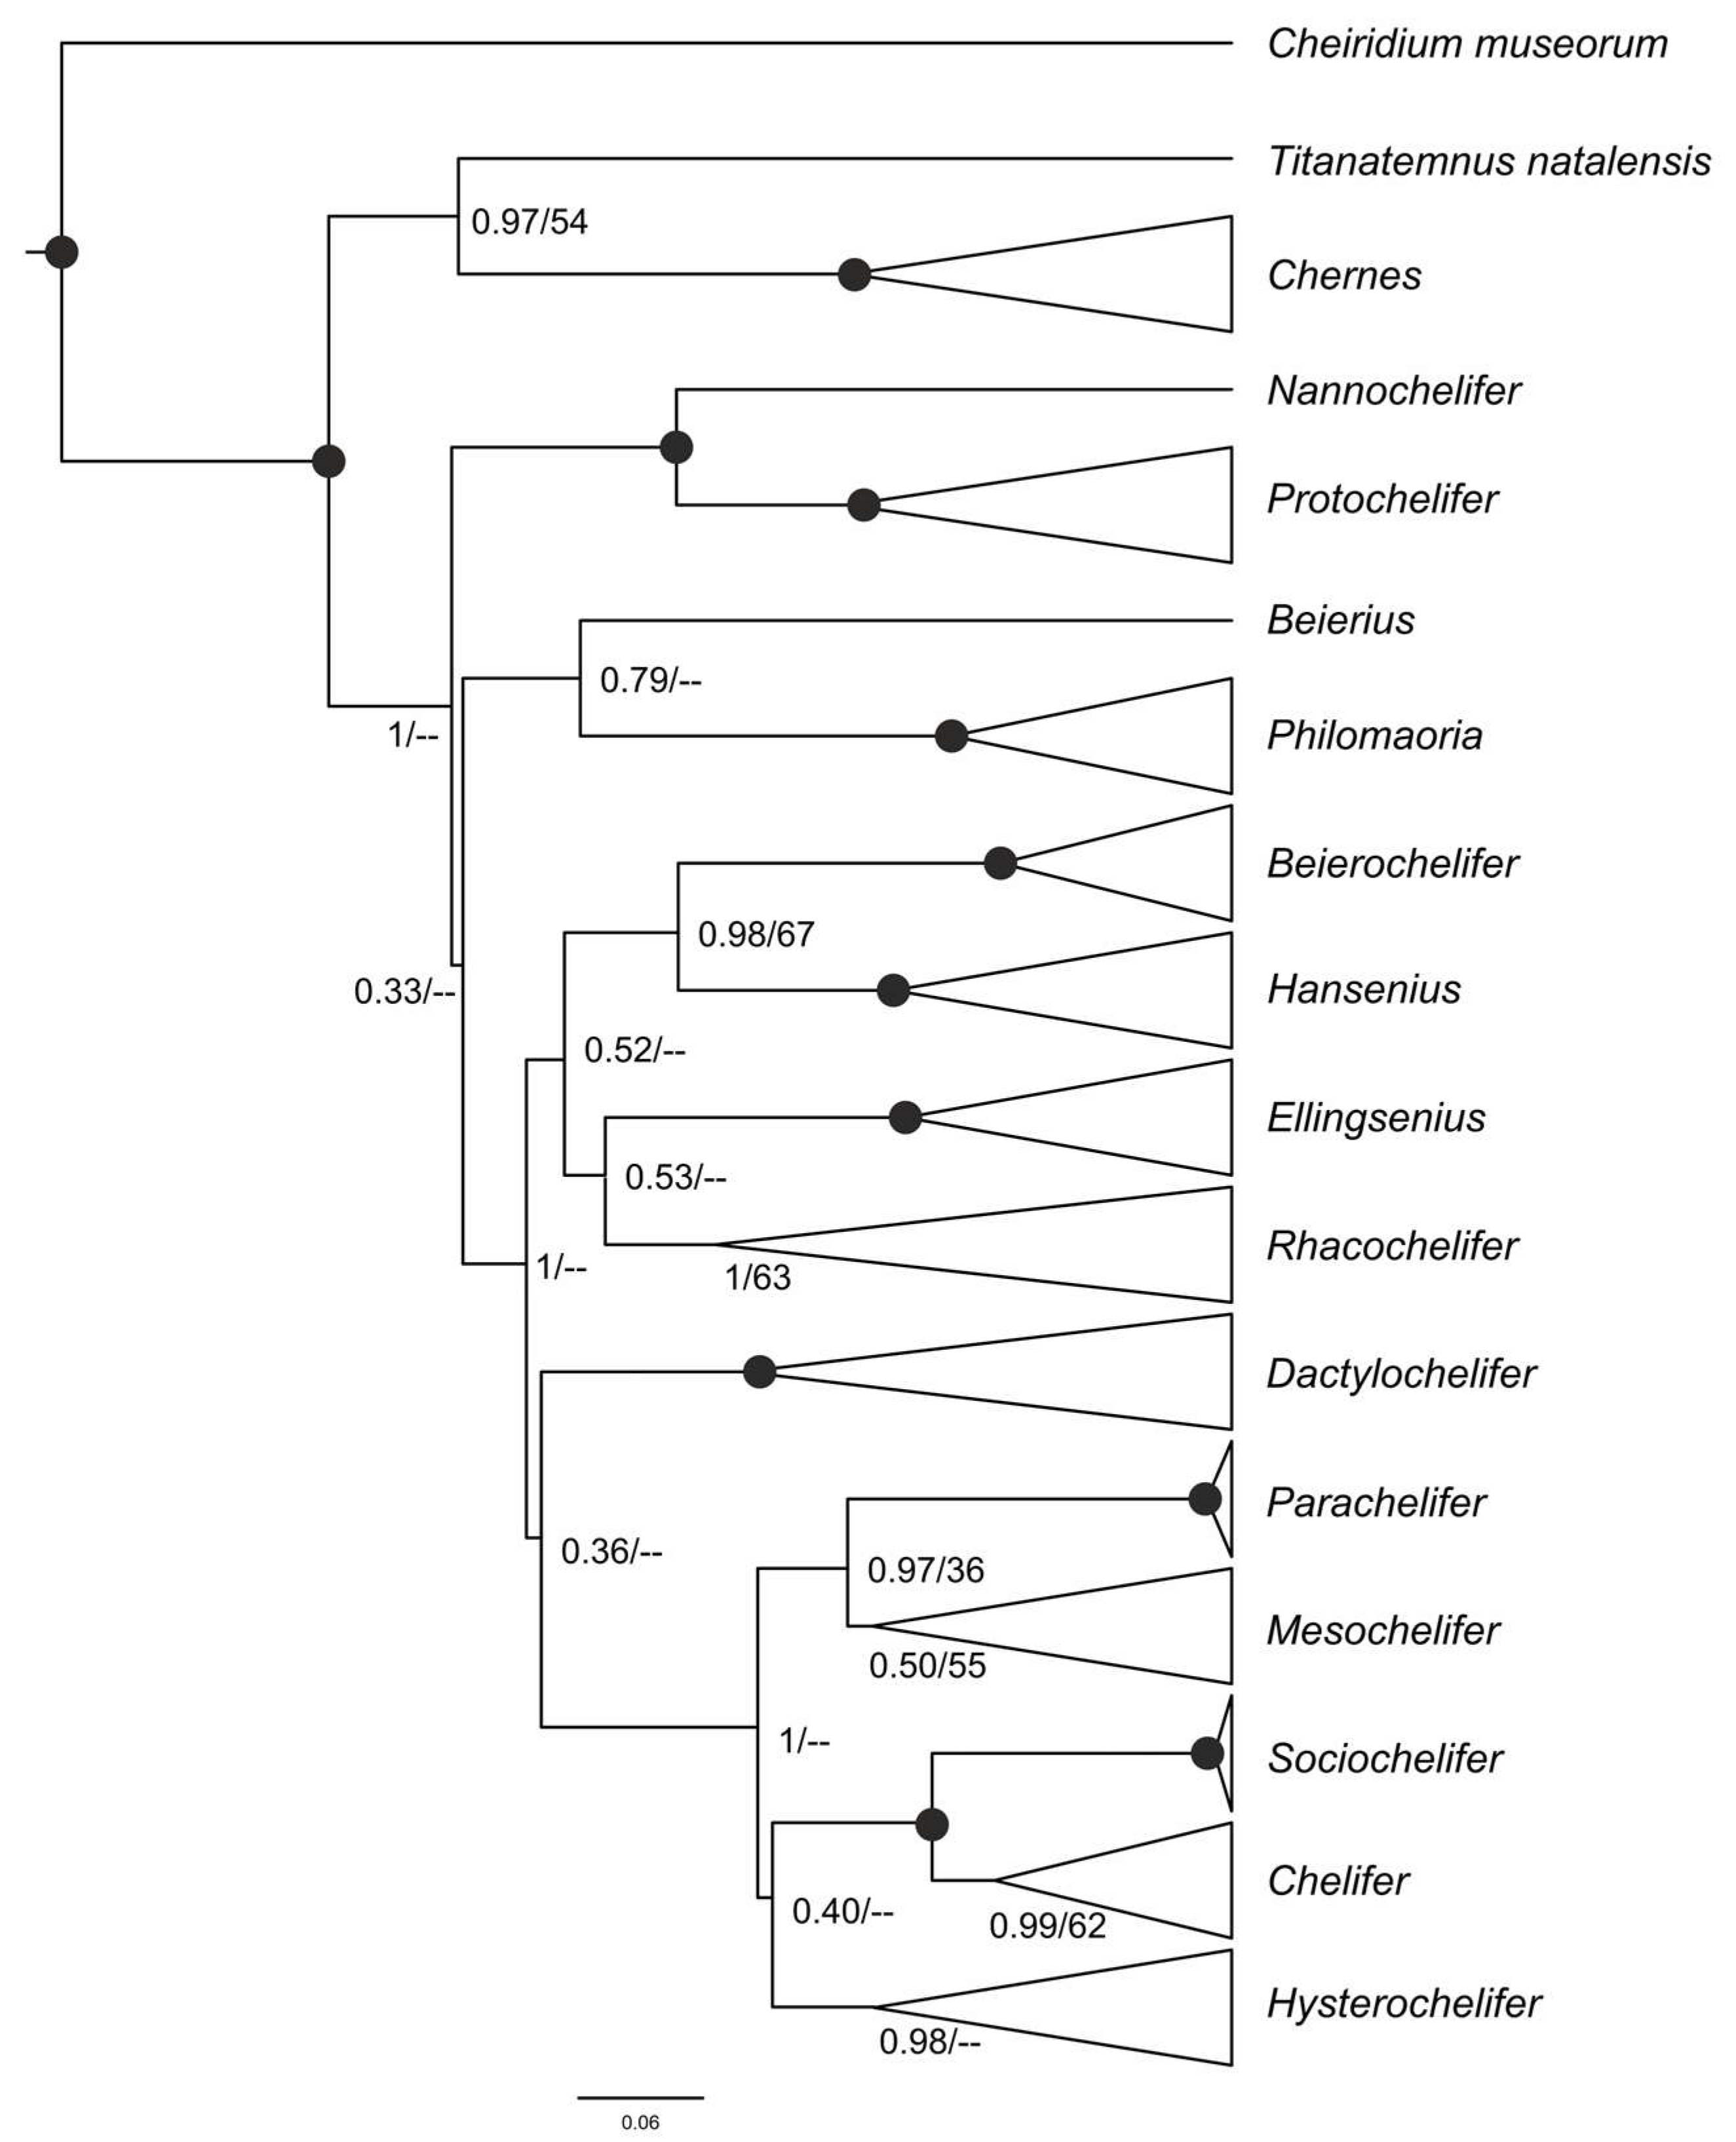
3.1. Taxonomic Sampling and Phylogenetic Analyses

A total of 282 specimens (278 Cheliferidae samples, four outgroups) representing Cheliferidae species worldwide was used in this study (Table S1). The Cox1 fragment (654 bp) was newly acquired for 218 individuals, while the remaining 64 sequences were obtained from public databases (Table S1). The “Cheliferidae_out_haplo” matrix comprising 198 unique haplotypes (193 ingroup and 5 outgroup taxa) was used as an input for ML and BI analyses. The matrix was further used as a source of reduced individual taxon-specific matrices used in species delimitation. The partitions and evolutionary substitution models selected via PartitionFinder are reported in Table S2.
The phylogenetic analyses performed via ML (−lnL= −15,350.541) and BI yielded topologies that lacked support for deeper nodes (Figure 1 and Figure S1); however, the supported nodes (mostly at crown level) were topologically congruent between the results of both approaches. Overall, the topology recovered in BI was better supported. In both analyses, Cheliferoidea outgroups (T. natalensis, C. hahnii and C. nigrimanus) formed a clade sister to the monophyletic Cheliferidae. Nannochelifer and Protochelifer were recovered in a clade (supported in both analyses) sister to all of the remaining Cheliferidae taxa. Within the remaining Cheliferids, the relationships between genera were largely unresolved; all genera, with the exception of Beierius and Philomaoria, formed a clade supported in BI. The sister relationships of Beierochelifer and Hansenius, Parachelifer and Mesochelifer and Socio-chelifer and Chelifer were supported in BI, which also supported a clade formed by Parachelifer, Mesochelifer, Sociochelifer, Chelifer and Hysterochelifer. All genera included in the analyses, with the exception of Mesochelifer, were supported at least in the BI (Figure 1 and Figure S1).

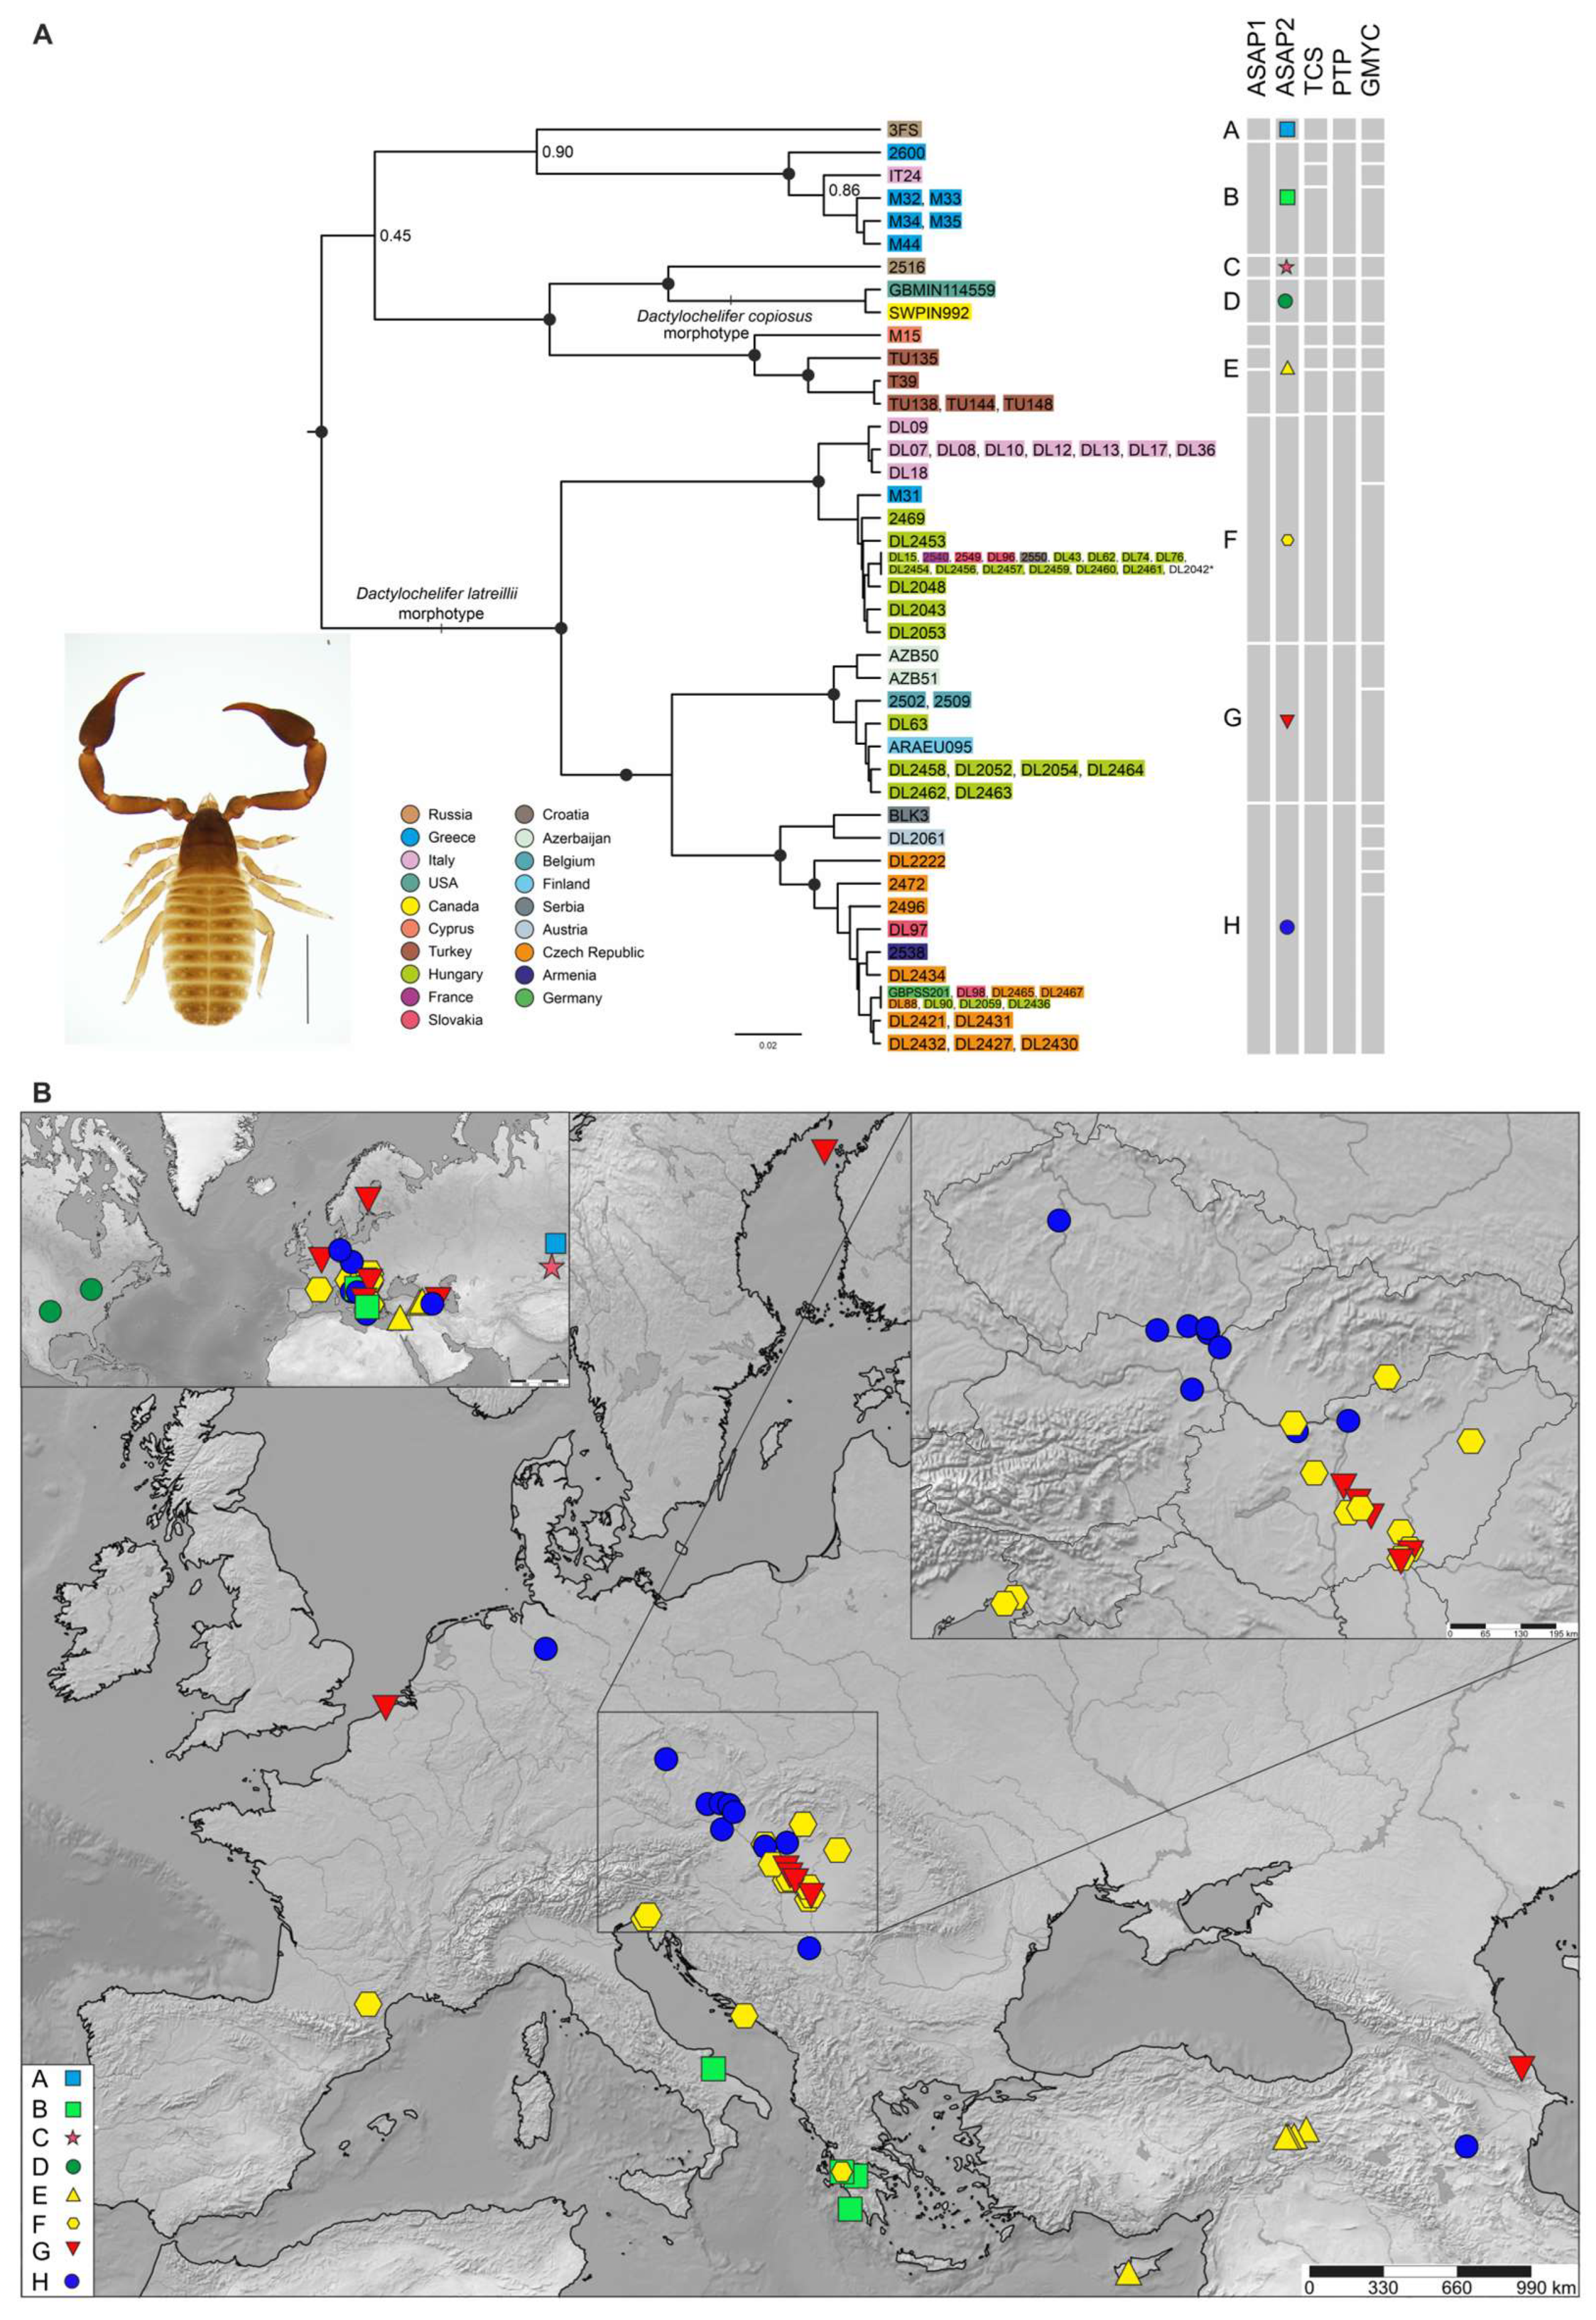
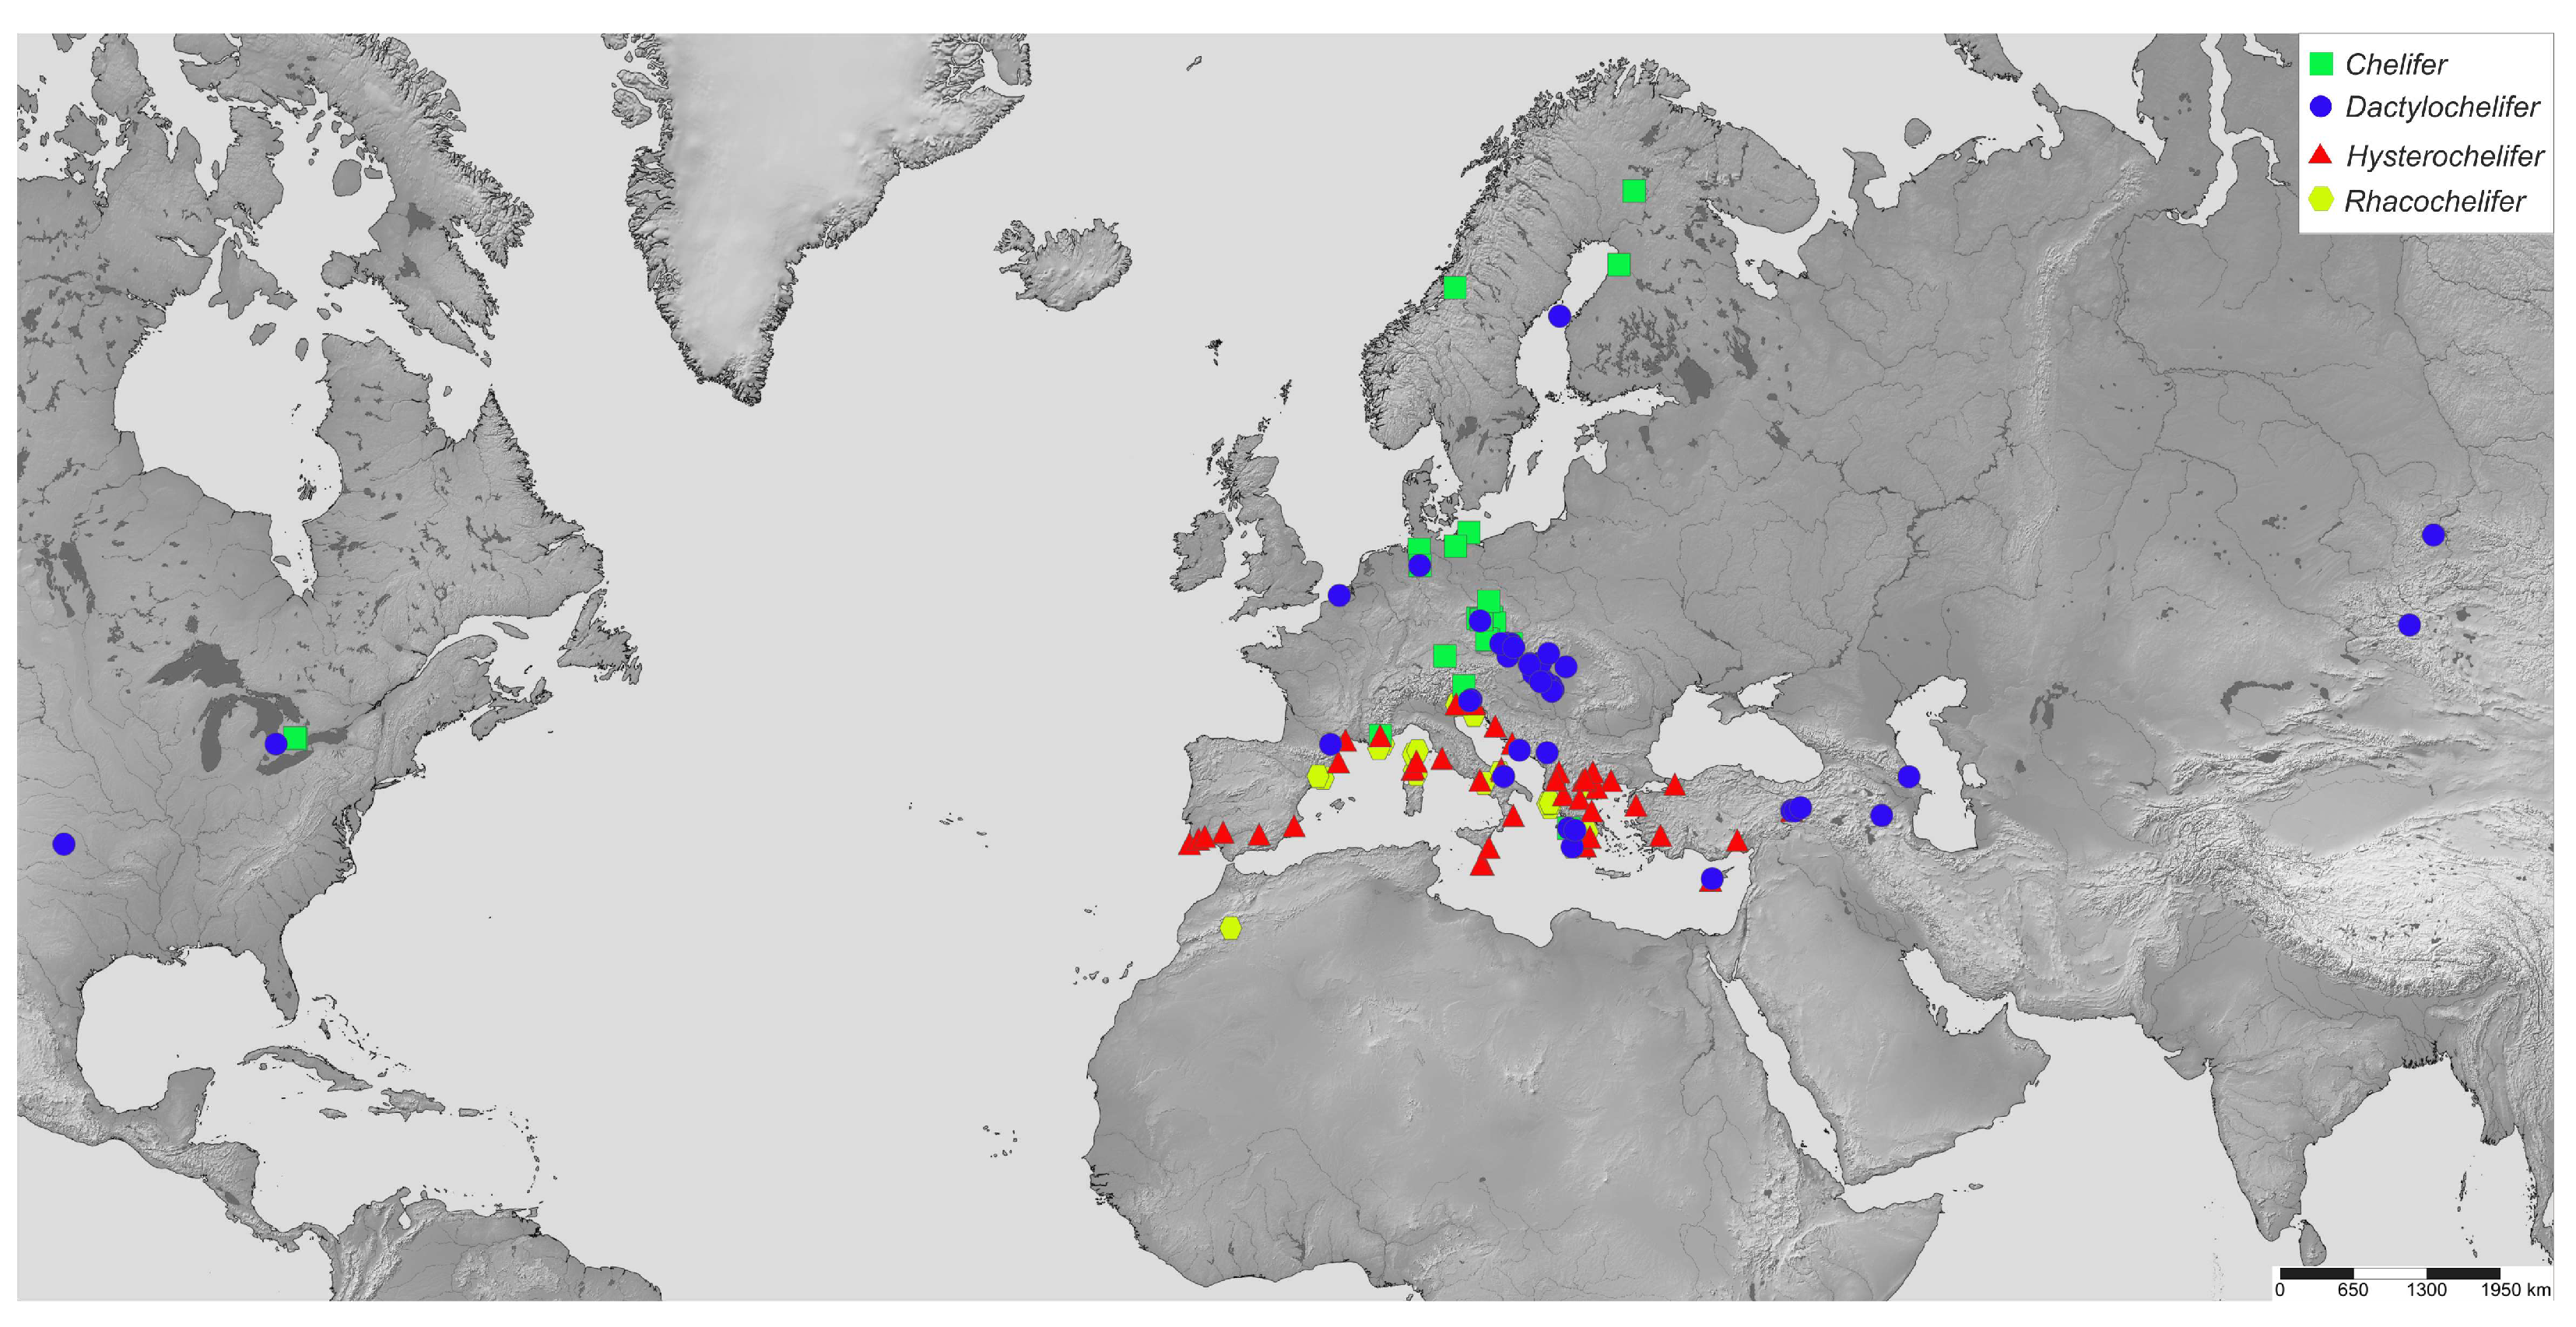
3.2. Molecular Species Delimitation and Geographic Distribution of the Lineages

3.2.1. Chelifer

Our “Chelifer_out” matrix comprised 21 unique haplotypes of 32 individuals, all identified as C. cancroides (Figure 2) and two outgroups (C. hahnii and D. latreillii). The results of our species delimitation analyses were not congruent between the delimitation approaches, with the number of recovered independent lineages ranging from three to six (Figure 2). The lowest number of lineages was recovered via ASAP1. The method delimited three independent lineages at the first ranked parsimony scheme (threshold distance 0.067). The second ranked ASAP2 scheme (threshold distance 0.020) recovered six evolutionary lineages congruent with the results of statistical parsimony (SP) performed in TCS. The tree-based methods (PTP and GMYC) recovered between five and six independent lineages, respectively. However, the distribution between taxa slightly differed from the SP results. The independent lineages delimited from our Chelifer dataset were spatially overlapping and did not show any intra-lineage geographical structure (Figure 2). The most sample-rich evolutionary lineage (lineage C in ASAP1 top ranked scheme) contained 27 individuals (16 unique haplotypes) distributed across Europe and North America. The largest distance between individuals sharing the same haplotype was 6837 km (Table S3).

3.2.2. Dactylochelifer

Our Dactylochelifer dataset (“Dactylo_out” matrix) comprised 41 unique haplotypes proceeding from 81 individuals. The species delimitation results varied (8–18 independent lineages) depending on the implemented method (Figure 3). The lowest number of lineages was recovered via ASAP2. The second ranked scheme (threshold distance 0.067) identified eight evolutionary lineages, while the top ranked scheme (threshold distance 0.039) yielded ten lineages. Twelve evolutionary lineages were recovered via SP (95% parsimony criterion) performed in TCS. The tree-based PTP approach yielded congruent results via ASAP1, i.e., ten independent lineages. GMYC delimited the highest number of lineages (18).
The majority of our delimited lineages was detected in relatively large geographic areas; the three most densely sampled lineages belonging to D. latreillii morphotype (F, G, H) showed large and geographically overlapping distributions across Europe and Western Asia with no apparent geographic structure. The largest geographic distance (1443 km) between individuals sharing the same haplotype was detected in lineage F (Table S3).

3.2.3. Hysterochelifer

The “Hystero_out” matrix comprised 61 unique haplotypes corresponding to 77 Hysterochelifer individuals. Nine to seventeen independent lineages were identified via the species delimitation process (Figure 4). The results from the top ranked ASAP1 score (threshold distance 0.062) indicated the existence of nine independent lineages (Figure 4), while second ranked ASAP2 score (threshold distance 0.032) detected 13 lineages. Statistical parsimony (95% parsimony criterion) performed in TCS delimited 17 lineages. The PTP approach delimited 15 lineages, while the GMYC approach yielded 13 lineages congruent with the results of the second ranked ASAP score.
Two distributional patterns were detected within the Hysterochelifer diversity. Some independent lineages exhibited local endemism to some extent (e.g., lineages B, C and D), while the lineages A (H. meridianus morphotype) and F (H. tuberculatus morphotype) had wider distributions that often overlapped with the distributions of other, more geographically isolated lineages. The distribution area of lineage A (H. meridianus morphotype), for example, spanned from eastern Spain to eastern Turkey, and the largest distance between individuals sharing the same haplotype was 851 km (Table S3).
Figure 2. Chelifer cancroides species delimitation. (A) Phylogenetic tree of Chelifer cancroides with the results of different species delimitation approaches (right). Topology was obtained via the BI conducted in BEAST, the numbers on the nodes denote PP support values, and the nodes with PP values > 0.95 are marked with black circles. White star marks a node that had a different topology in the ML analyses used for species delimitation in PTP. Terminal tree taxa are color-coded according to the country of their collection. Bottom left corner insert shows an adult male of C. cancroides; scale bar: 1 mm. (B) Map depicting the sampling locations of C. cancroides delimited lineages according to our preferred species delimitation outcome obtained via ASAP1 (upper right). Top left corner of the map shows the sampling locations in North America.
Diversity 15 01040 g002
Figure 3. Dactylochelifer species delimitation. (A) Phylogenetic tree of the genus Dactylochelifer with the results of different species delimitation approaches (right). Topology was obtained via the BI conducted in BEAST, the numbers on the nodes denote PP values, and the nodes with PP values > 0.95 are marked with black circles. Terminal tree taxa are color-coded according to the country of their collection. Specimen DL2042 (marked with asterisk) lacks locality information. Bottom left corner insert shows an adult of Dactylochelifer latreillii; scale bar: 1 mm. (B) Map depicting sampling locations of the Dactylochelifer delimited lineages according to our preferred species delimitation outcome obtained via ASAP2 (upper right). Top left corner of the map shows the sampling locations in the whole sampling area and the upper right corner insert shows locations from Central Europe in detail.
Diversity 15 01040 g003
Figure 4. Hysterochelifer species delimitation. (A) Phylogenetic tree of the genus Hysterochelifer with the results of different species delimitation approaches (right). Topology was obtained via the BI conducted in BEAST, the numbers on the nodes denote PP values, and the nodes with PP values > 0.95 are marked with black circles. Terminal tree taxa are color-coded according to the country of their collection. Bottom left corner insert shows an adult female of H. tuberculatus; scale bar: 1 mm. (B) Map depicting sampling the locations of Hysterochelifer delimited lineages according to our preferred species delimitation outcome obtained via ASAP1 (upper right).
Diversity 15 01040 g004

3.2.4. Rhacochelifer

The “Rhaco_out” dataset comprised 26 unique haplotypes derived from 36 Rhacochelifer individuals. The results of our species delimitation analyses ranged from three to six delimited lineages, depending on the method used (Figure 5). The most conservative results (i.e., three lineages) were obtained from the second ranked ASAP2 scheme (threshold distance 0.128), and the top ranked scheme (threshold distance 0.073) delimited four lineages (ASAP1), which was congruent with the results of the PTP approach. Statistical parsimony (95% parsimony criterion) performed in TCS delimited six lineages, while the GMYC method detected five lineages within our dataset.
Two distinct distribution patterns were detected within the Rhacochelifer diversity. Three unidentified independent Rhacochelifer lineages (A, B, C) showed tendencies toward local endemism, while the most sample-rich lineage D (R. maculatus morphotype) had a wider distribution that overlapped with the remaining geographically isolated lineages. Within R. maculatus, the longest geographical distance recorded among individuals with a shared haplotype was 1512 km (Table S3).

4. Discussion

4.1. Phylogenetic Relationships among Cheliferidae

Although Cheliferidae have been included in phylogenetic analyses of the order Pseudoscorpiones, their intrafamiliar relationships remain poorly understood because of the relatively sparse taxon sampling [43,44]. In our study, we analyzed a dataset comprising a significant portion of known European Cheliferidae diversity (66% of genera in Europe and 24% worldwide). Our Cox1 data did not possess sufficient informativeness to resolve deeper nodes of Cheliferidae relationships. However, the relationships that were supported contradicted the traditional views of Cheliferidae classification [34], i.e., the basal division into Philomaoriinae (comprising only Philomaria) and Cheliferinae (comprising the remaining genera) [67] subfamilies. Given the ancient origins of pseudoscorpions and the deep divergences between their lineages [44], it is clear that genomic or transcriptomic data will be needed in order to resolve the pseudoscorpion relationships at the intrafamilial level, as in other arachnid groups [89,90]. On the other hand, all sampled genera, with the exception of Mesochelifer, were recovered as monophyletic in our analyses (at least by BI; Figure 1), implying that traditional morphological characters used in higher level taxonomy [34,36] are likely only suitable for correct delimitation to the genus level in this family.

4.2. Cheliferidae Diversity and Delimitation

Pseudoscorpions belong to morphologically uniform arthropod taxa [18], and the application of molecular methods has highlighted that morphology-based delimitation approaches largely underestimate species diversity. The presence of cryptic diversity has been found in many families [21,25], and our results suggest that Cheliferidae are no exception to these reports. We identified several independent lineages in each of the studied genera, but the delimitation outcomes differed among the used methods (Figure 2, Figure 3, Figure 4 and Figure 5). Different delimitation methods are known to give different results, particularly in relation to how prone they are to oversplitting [38,91,92]. The delimitation should, thus, be based on an integration of multiple independent methods and the congruence between their outcomes [92,93]. In our case, it was impossible to integrate molecular approaches with morphologic or morphometric analyses [16,94]. We had limited sampling of males, which is the sex bearing species-specific characters; therefore, the assessment of character variability was not possible. For this reason, we cannot discard the notion that some of the independent lineages delimited in our analyses may correspond to previously described or synonymized species [17].
As pseudoscorpions have an accelerated substitution rate [95] and single-locus species delimitation methods tend to over-split taxa [38], we adopted a conservative approach while interpreting the species delimitation results. We, thus, favored the delimitation outcomes proposing a smaller number of putative species (ASAP threshold 0.062 to 0.072). Under the conservative approach, the divergences between our delimited lineages reached up to 20% (Table S4), which, on average, corresponds to interspecific distances recovered in other arachnid groups, e.g., spiders (17.4%) and harvestmen (19.4%) [96], as well as pseudoscorpions (19.7–25.6%) [16,21]. Similarly, intraspecific variability (1–4% in Chelifer, 1–3% in Dactylochelifer, 1–3% in Rhacochelifer and 0–4% in Hysterochelifer; Table S5) was congruent with the values reported from other arachnids e.g., spiders (0.7%), harvestmen (1.3%) and other pseudoscorpions (0.9–8%) [16,21,40,41,97].

4.2.1. Chelifer cancroides

The monotypic genus Chelifer, comprising cosmopolitan species C. cancroides, belongs to the most recognizable and frequently studied pseudoscorpion species [98,99,100,101]. It is ecologically plastic. Chelifer cancroides is most commonly found inside buildings, less frequently found in bee hives, under bark and inside tree hollows and nests and occasionally found in leaf litter (Table S1). According to our results, C. cancroides harbors three cryptic lineages that are not geographically segregated. All lineages co-occur in Central Europe; however, the most geographically widespread lineage (lineage C) is present across both Europe and North America (Figure 2). We even detected haplotype sharing among individuals from Canada and Czech Republic (up to 6837 km apart; Table S3). The lack of geographic structure, thus, supports our previous knowledge of C. cancroides ecology [27,100]. Its cosmopolitan distribution was traditionally attributed to a combined effect of phoretic dispersal and synanthropy [18,27,100,102]. Although phoresy in C. cancroides may be efficient, the haplotype sharing between continents may be more plausibly explained by human-mediated activities than long-distance trans-oceanic dispersal [103].
There are currently ten species synonymized to C. cancroides [17] as a consequence of previous morphological revisions of the genus (e.g., [100,104,105]). We detected three independent lineages in our analyses, thus contradicting the taxonomic status of C. cancroides. Unfortunately, most of the original descriptions of the formerly synonymized species are rather uninformative and lack the necessary details (e.g., [106]) to match with our delineated lineages. Furthermore, the challenges affiliated with analyzing historical pseudoscorpion materials [16] compound the complexity of the taxonomic revision of this species. Future studies utilizing C. cancroides as a model organism [101] should, thus, take into account the species most likely comprises cryptic diversity. Working with unrecognized species complexes may bias the conclusions drawn from the data, which unfortunately was the case in previously used animal models, such as ascidians [107], amphipods [108] and annelids [109].

4.2.2. Dactylochelifer

The genus Dactylochelifer with 52 described species represents the most specious genus of the family Cheliferidae [17]. Most of the described species have, with a few exceptions, geographically restricted occurrences [17]. Dactylochelifer latreillii, with its distribution spanning across Europe, North Africa and Central Asia, represents such an exception. The results of our study, based on samples covering a large portion of the species range, uncovered three independent lineages with overlapping (in some cases syntopic) distributions (lineages F, G, H) (Figure 3). These lineages neither can be distinguished based on the analysis of the traditional morphological characters nor exhibit strong habitat preferences. The representatives of a single lineage can be found in leaf litter, under tree bark or in cigar-like galls induced on the common reed (Phragmites australis) by the fruit fly genus Lipara (Table S1). The galls provide habitat for a wide assemblage of arthropods, including hymenopterans, hemipterans and beetles [110,111,112], that, in turn, could serve as phoretic carriers [27]. Compared to C. cancroides, D. latreillii does not have tendencies for synanthropy and likely owes its larger distributional patterns to effective phoretic dispersal. Shared haplotypes were detected in all of its lineages across substantial geographic distances (F: 1443 km, G: 90 km, H: 880 km; Figure 3, Table S3). The pattern is consistent with haplotype sharing distances in Chernes hahnii and Lamprochernes [13,16], which has largely been attributed to phoresy. However, some portions of D. latreillii distribution were not sampled in our analyses (e.g., North Africa and Mediterranean islands). Given the challenging taxonomy of Dactylochelifer, it is, thus, possible that the wide distribution [17] of the D. latreillii morphotype could also stem from the incorrect identification and underestimation of local species diversity.
Besides D. latreillii, we detected five additional lineages within the genus Dactylochelifer (lineages A–E, Figure 3) that likely correspond to previously described species with more geographically restricted ranges. However, the diagnostic characters are mainly male specific, and their variability is poorly understood. The combination of these factors prevented us from performing specific species identification.

4.2.3. Hysterochelifer

The genus Hysterochelifer comprises 13 nominal species distributed across North America, Europe and Central Asia; however, its center of diversification lies in the Mediterranean region [17]. Our sampling covers most of its known Mediterranean distribution (Figure 4). Our results recovered two morphologically distinct groups, one (lineage A) corresponding to H. meridianus morphotype and a second to several lineages identified as a H. tuberculatus morphotype (lineages B–I, Figure 4). The results of our analyses support the traditional view concerning the wide distribution of H. meridianus [17]. Although some delimitation approaches yielded between four and six independent lineages, the most conservative ASAP results support the existence of a single species (Figure 4). Its wide distribution, including the islands, and the fact that the specimens were exclusively collected under tree bark indicate that the species most likely disperses via phoresy. We detected shared haplotypes among localities 509 km apart (Table S3), but overall, 3% p-distance within the lineage A (H. meridianus morphotype) corresponds to intraspecific variability in other pseudoscorpion groups [25,40] and other species in this study (Table S5).
Interestingly, the lineages forming the H. tuberculatus morphotype likely have different ecological strategies. According to the literature, H. tuberculatus inhabits both leaf litter and tree bark [35]. However, it is clear from our results that this morphotype comprises multiple lineages, which may differ in terms of their ecology. All of our samples stem from leaf litter. It is, thus, interesting that at least some lineages (e.g., E, F, I) show wider distributions. For example, the lineage F is spanning between Italy and Turkey, and both lineages F and E are also present on the Mediterranean islands of Malta and Sicily. Such distributions would be consistent with phoretic dispersal [13,16], which would suggest that this manner of dispersal may be common in some soil-dwelling lineages. The remaining H. tuberculatus morphotype lineages (B, C, D, G, H) show restricted distributions that would most likely correspond to a more sedentary lifestyle. In this case, the lack of dispersal likely promoted the diversification of the H. tuberculatus morphotype. The inability to cross geographical barriers and maintain isolated populations is known to result in genetic diversification in many sedentary organisms. Similar patterns were detected among a wide variety of arachnids, such as harvestmen [113], scorpions [114] and pseudoscorpion families that do not possess phoretic dispersal capabilities [23,48].

4.2.4. Rhacochelifer

The distribution of Rhacochelifer is restricted to the Old World (Europe, Africa, and Central Asia), with the largest portion of the diversity (70% species) originating from the Mediterranean [17]. Our sampling is sparser relative to previously discussed genera (see above); however, our results suggest similar ecological and distribution patterns as those in Hysterochelifer (Figure 4 and Figure 5). Similar to H. meridianus, the R. maculatus morphotype (lineage D) spans most of the Mediterranean, with individuals sharing the same haplotype across 1575 km. Such a pattern also implies phoretic dispersal [13,16,45], which was historically documented in the literature [27]. Our samples of the R. maculatus morphotype were collected under tree bark, where pseudoscorpions typically encounter a wide variety of potential carriers. At the same time, we detected few soil-dwelling lineages (A–C) with restricted distributions (Figure 5), which implies their dispersal capabilities are limited. Despite our intensive and standardized sampling efforts across localities and different types of habitats inhabited by pseudoscorpions (Figure 6, Table S1), we were not able to collect a large number of locally distributed species, which may suggest that R. maculatus are significantly more abundant than other species.

4.3. Effects of Dispersal Strategies on Distribution and Diversity of Cheliferids

Our study targeted several related pseudoscorpion taxa with large areas of occurrence [17]; however, the results do not show geographically congruent distribution patterns. Interestingly, we detected varying degrees of haplotype sharing and population structuring among the target genera, which gave us insight into their ecology [16,21] and dispersal capabilities. For example, R. maculatus and C. cancroides, known phoretic species [27], show a similar lack of geographic structure compared to other species that are known to phoretically disperse, e.g., Dinocheirus arizonensis [45] and Lamprochernes spp. [16] (both Chernetidae). The same lack of geographic structure and haplotype sharing was detected in the H. meridianus morphotype (Hysterochelifer lineage A), H. tuberculatus (lineages E, F, I) and the D. latreillii morphotype (Dactylochelifer lineages F-H) (Figure 3 and Figure 4), which are not known for this type of dispersal. Documenting phoresy in pseudoscorpions is challenging due to their small size and cryptic lifestyle. Insights into their genetic background could, thus, be used as a proxy for studying their dispersal capabilities, supplementing our lack of direct observations [13]. The lack of geographic structure is even more pronounced in C. cancroides, which likely owes its distribution to the compound effect of synanthropy and phoretic dispersal [100]. At the same time, it seems that varying degrees of genetic structuring may exist between closely related taxa, e.g., the Hysterochelifer lineages A, E, F and I with wide distributions vs. the remaining Hysterochelifer lineages (B, C, D, G and H), that are geographical constrained (Figure 4). Such discrepancies may result from an association with rare and geographically constrained habitats [45,115] rather than different dispersal capabilities. Our findings suggest that the lifestyles of Cheliferidae are more flexible than the two previously followed strategies suggest [19,20,21]. We found support for a strong propensity of phoretic dispersal in lineages inhabiting temporary habitats; however, lineages from presumably stable environments (leaf litter and soil) might not be as limited dispersal-wise as would be expected.
Sedentary pseudoscorpions are well known for their abundant cryptic diversity (e.g., [40,41,42]); however, there is an increasing amount of evidence that the same phenomenon is realized between species with phoretic dispersal that were traditionally perceived as being widely distributed [13,16,39,115]. Due to the challenging taxonomy of cheliferids (see above) and their often cryptic lifestyles, we may still lack relatively basic knowledge concerning their diversity, distribution and ecology. Barcoding data can, thus, be used as a first step in research that will subsequently guide targeted taxonomical efforts and help to identify an appropriate methodological framework for detecting better diagnostic characteristics to define stable taxonomic units [16].

5. Conclusions

We investigated the genetic diversity of four widely distributed and relatively morphologically uniform Cheliferidae genera (Chelifer, Dactylochelifer, Rhacochelifer and Hysterochelifer) in order to (i) uncover the potential presence of cryptic diversity and (ii) evaluate whether the habitat preferences (i.e., ecological strategies) of species go hand in hand with their dispersal capabilities. We uncovered unidentifiable lineages within all genera, some of which might represent either cryptic diversity or previously synonymized species. Some lineages showed a complete lack of geographical structure and shared haplotypes over large distances, and some did not. A lack of geographical structure was detected among all known phoretic species, as well as among lineages that are not known to use this manner of dispersal. We, therefore, argue that genetic structure can be used as a proxy to evaluate the species’ dispersal manner and efficacy. Lineages from temporary habitats are most likely phoretic; however, lineages inhabiting presumably stable environments might be more capable in terms of dispersal than previously thought. Our results highlight the challenges involved in Cheliferidae research, particularly the poor definition of characters used for identification and the presence of male specimens needed for correct species determination. It is clear that all of the analyzed genera included in this paper are in need of thorough and integrative taxonomic revision.

Supplementary Materials

The following supporting information can be downloaded via this link: https://www.mdpi.com/article/10.3390/d15101040/s1, Figure S1: Phylogenetic tree of the family Cheliferidae. The topology was obtained in Bayesian inference; values on nodes denote support values obtained in both BI and ML analyses (left to right): Bayesian posterior probabilities (PP), RAxML bootstrap support. Black circles indicate both PP values > 0.95 and bootstrap support > 85. Table S1: Sampled pseudoscorpion material. Table S2: Best partitioning schemes determined via PartitionFinder 2.1. Table S3: Geographic distances (in km) among individuals sharing identical haplotypes. Table S4: Uncorrected p-distances and Tamura–Nei genetic distances among the studied Cheliferidae lineages. Upper values: p-distances, lower values: Tamura–Nei, L: Lineage. Numbers in brackets represent the standard error. Table S5: Uncorrected p-distances, Tamura–Nei genetic distances within the studied Cheliferidae pseudoscorpions. DL: Delimited lineage, H: number of haplotypes within the lineage, S.E.: standard error.

Author Contributions

P.J.: Formal analysis, sample collection, sample identification, data duration, writing—original draft, and writing—review and editing; F.Š.: Conceptualization, resources, sample collection, sample identification, writing—original draft, and writing—review and editing, P.B.: Sample collection; A.A.: Sample collection; V.O.: Methodology, validation, resources, formal analysis, sample collection, writing—original draft, and writing—review and editing. All authors have read and agreed to the published version of the manuscript.

Funding

This project was supported by the Grant Agency of Charles University (GAUK 36908) (V.O.) and by the Ministry of Education, Youth and Sports of the Czech Republic (SVV 260 686/2023) (P.J.). Additional support was obtained from the Charles University Research Centre program (UNCE 204069) (V.O.) and the Specific Research Project of University of Hradec Kralove (No. 2101/2022) (P.B., A.A.).

Institutional Review Board Statement

Not applicable.

Data Availability Statement

The data present in the study are available in the article and in public databases.

Acknowledgments

The authors are grateful to M. Byronová, P. Dolejš, H. Henderickx, M. Hiřman, J. Horáčková, M. Horsák, M. Jankásek, L. Juřičková, B. Kaftanová, P. Kment, J. Král, S. Pekár, M. Řezáč, D. Říhová, I. Šťáhlavská, J. Šumpich and J. Zaragoza for supplying specimens to this study. We would also like to thank M. Forman, J. Hartvichová, B. Karásková, M. Kotz, D. Král, M. Peprný, D. Sommer, P. Šípek, M. Šlachta and T. Vařil for their assistance in the field and E. Kosnicki for the grammatical review of the manuscript. We are grateful to three anonymous reviewers for the time and effort spent reviewing our paper and their constructive comments.

Conflicts of Interest

The authors declare no conflict of interest.

References

  1. MacArthur, R. Patterns of species diversity. Biol. Rev. 1965, 40, 510–533. [Google Scholar] [CrossRef]
  2. Wilson, R.J.; Thomas, C.D.; Fox, R.; Roy, D.B.; Kunin, W.E. Spatial patterns in species distributions reveal biodiversity change. Nature 2004, 432, 393–396. [Google Scholar] [CrossRef] [PubMed]
  3. Arbogast, B.S.; Kenagy, G.J. Comparative phylogeography as an integrative approach to historical biogeography. J. Biogeogr. 2001, 28, 819–825. [Google Scholar] [CrossRef]
  4. Hewitt, G.M. Genetic consequences of climatic oscillations in the Quaternary. Philos. Trans. R. Soc. Lond. Ser. B Biol. Sci. 2004, 359, 183–195. [Google Scholar] [CrossRef] [PubMed]
  5. Barrow, L.N.; Lemmon, A.R.; Lemmon, E.M. Targeted sampling and target capture: Assessing phylogeographic concordance with genome-wide data. Syst. Biol. 2018, 67, 979–996. [Google Scholar] [CrossRef] [PubMed]
  6. Johnson, M.L.; Gaines, M.S. Evolution of dispersal: Theoretical models and empirical tests using birds and mammals. Annu. Rev. Ecol. Syst. 1990, 21, 449–480. [Google Scholar] [CrossRef]
  7. Nathan, R. Long-distance dispersal of plants. Science 2006, 313, 786–788. [Google Scholar] [CrossRef] [PubMed]
  8. Opatova, V.; Hamilton, C.A.; Hedin, M.; De Oca, L.M.; Král, J.; Bond, J.E. Phylogenetic systematics and evolution of the spider infraorder Mygalomorphae using genomic scale data. Syst. Biol. 2020, 69, 671–707. [Google Scholar] [CrossRef]
  9. Travis, J.M.; Dytham, C. Dispersal and climate change: A review of theory. In Dispersal Ecology and Evolution; Oxford University Press: Oxford, UK, 2012; pp. 337–348. [Google Scholar]
  10. Bartlow, A.W.; Agosta, S.J. Phoresy in animals: Review and synthesis of a common but understudied mode of dispersal. Biol. Rev. 2021, 96, 223–246. [Google Scholar] [CrossRef]
  11. Szymkowiak, P.; Górski, G.; Bajerlein, D. Passive dispersal in arachnids. Biol. Lett. 2007, 44, 75–101. [Google Scholar]
  12. Fontaneto, D. Long-distance passive dispersal in microscopic aquatic animals. Mov. Ecol. 2019, 7, 1–10. [Google Scholar] [CrossRef] [PubMed]
  13. Opatova, V.; Šťáhlavský, F. Phoretic or not? Phylogeography of the pseudoscorpion Chernes hahnii (Pseudoscorpiones: Chernetidae). J. Arachnol. 2018, 46, 104–113. [Google Scholar] [CrossRef]
  14. Ohnishi, O.; Takenaka, M.; Okano, R.; Yoshitomi, H.; Tojo, K. Wide-scale gene flow, even in insects that have lost their flight ability: Presence of dispersion due to a unique parasitic ecological strategy of piggybacking hosts. Zool. Sci. 2021, 38, 122–139. [Google Scholar] [CrossRef] [PubMed]
  15. López-Estrada, E.K.; Sanmartín, I.; Uribe, J.E.; Abalde, S.; Jiménez-Ruiz, Y.; García-París, M. Mitogenomics and hidden-trait models reveal the role of phoresy and host shifts in the diversification of parasitoid blister beetles (Coleoptera: Meloidae). Mol. Ecol. 2022, 31, 2453–2474. [Google Scholar] [CrossRef] [PubMed]
  16. Christophoryová, J.; Krajčovičová, K.; Šťáhlavský, F.; Španiel, S.; Opatova, V. Integrative Taxonomy Approach Reveals Cryptic Diversity within the Phoretic Pseudoscorpion Genus Lamprochernes (Pseudoscorpiones: Chernetidae). Insects 2023, 14, 122. [Google Scholar] [CrossRef] [PubMed]
  17. World Pseudoscorpiones Catalog. Available online: http://wac.nmbe.ch (accessed on 4 September 2023).
  18. Harvey, M.S. The smaller arachnid orders: Diversity, descriptions and distributions from Linnaeus to the present (1758 to 2007). Zootaxa 2007, 1668, 363–380. [Google Scholar] [CrossRef]
  19. Weygoldt, P. Biology of Pseudoscorpions; Harvard University Press: Cambridge, MA, USA, 1969. [Google Scholar]
  20. Legg, G. The possible significance of spermathecae in pseudoscorpions (Arachnida). Bull. Br. Arach. Soc. 1975, 3, 91–95. [Google Scholar]
  21. Muster, C.; Spelda, J.; Rulik, B.; Thormann, J.; von der Mark, L.; Astrin, J.J. The dark side of pseudoscorpion diversity: The German Barcode of Life campaign reveals high levels of undocumented diversity in European false scorpions. Ecol. Evol. 2021, 11, 13815–13829. [Google Scholar] [CrossRef]
  22. Zaragoza, J.A.; Šťáhlavský, F. A new Roncus species (Pseudoscorpiones: Neobisiidae) from Montseny Natural Park (Catalonia, Spain), with remarks on karyology. Zootaxa 2008, 1693, 27–40. [Google Scholar] [CrossRef]
  23. Kotrbová, J.; Opatova, V.; Gardini, G.; Šťáhlavský, F. Karyotype diversity of pseudoscorpions of the genus Chthonius (Pseudoscorpiones, Chthoniidae) in the Alps. Comp. Cytogenet. 2016, 10, 325–345. [Google Scholar]
  24. Zaragoza, J.A. Revision of the Ephippiochthonius complex in the Iberian Peninsula, Balearic Islands and Macaronesia, with proposed changes to the status of the Chthonius subgenera (Pseudoscorpiones, Chthoniidae). Zootaxa 2017, 4246, 1–221. [Google Scholar] [CrossRef] [PubMed]
  25. Hlebec, D.; Podnar, M.; Kučinić, M.; Harms, D. Molecular analyses of pseudoscorpions in a subterranean biodiversity hotspot reveal cryptic diversity and microendemism. Sci. Rep. 2023, 13, 430. [Google Scholar] [CrossRef] [PubMed]
  26. Colado, R.; García-Meseguer, A.J.; Mirón-Gatón, J.M.; Botella-Cruz, M.; Pallarés, S.; Sánchez-Fernández, D. Thermal tolerance and vulnerability to climate change in subterranean species: A case study using an Iberian endemic pseudoscorpion. Insect Conserv. Divers. 2022, 15, 181–190. [Google Scholar] [CrossRef]
  27. Poinar, G.O., Jr.; Curcic, B.P.; Cokendolpher, J.C. Arthropod phoresy involving pseudoscorpions in the past and present. Acta Arachnol. 1998, 47, 79–96. [Google Scholar] [CrossRef]
  28. Zeh, D.W.; Zeh, J.A. On the function of harlequin beetle-riding in the pseudoscorpion, Cordylochernes scorpioides (Pseudoscorpionida: Chernetidae). J. Arachnol. 1992, 20, 47–51. [Google Scholar]
  29. Zeh, J.A.; Zeh, D.W. On the threshold of dispersal: Hitchhiking on a giant fly favours exaggerated male traits in a male-dimorphic pseudoscorpion. Biol. J. Linn. Soc. 2013, 108, 509–520. [Google Scholar] [CrossRef]
  30. Judson, M.L.I.; Heurtault, J. Nanolpium species (Garypoidea, Olpiidae) on grasses in southern Africa-a new niche for pseudoscorpions. Rev. Suisse Zool. 1996, 1, 321–326. [Google Scholar]
  31. Ranius, T.; Douwes, P. Genetic structure of two pseudoscorpion species living in tree hollows in Sweden. Anim. Biodivers. Conserv. 2002, 25, 67–74. [Google Scholar]
  32. Harvey, M. Pseudoscorpions of the World, Version 2.0. Available online: https://www.museum.wa.gov.au/catalo-gues/pseudoscorpions (accessed on 12 March 2023).
  33. Beier, M. Revision der Chernetidae (Pseudoscorp.). Zool. Jahrbücher Abt. Für Syst. Okol. Und Geogr. Der Tiere 1933, 64, 509–548. [Google Scholar]
  34. Harvey, M.S. The phylogeny and classification of the Pseudoscorpionida (Chelicerata: Arachnida). Invertebr. Syst. 1992, 6, 1373–1435. [Google Scholar] [CrossRef]
  35. Beier, M. Ordnung Pseudoscorpionidea (Afterskorpione). In Bestimmungsbücher zur Bodenfauna Europas; Akademie-Verlag: Berlin, Germany, 1963; Volume 1, pp. 1–313. [Google Scholar]
  36. Christophoryova, J.; Šťáhlavský, F.; Fedor, P. An updated identification key to the pseudoscorpions (Arachnida: Pseudoscorpiones) of the Czech Republic and Slovakia. Zootaxa 2011, 2876, 35–48. [Google Scholar] [CrossRef]
  37. Harvey, M.S. Catalogue of the Pseudoscorpionida; Manchester University Press: Manchester, UK, 1990. [Google Scholar]
  38. Kekkonen, M.; Hebert, P.D. DNA barcode-based delineation of putative species: Efficient start for taxonomic workflows. Mol. Ecol. Resour. 2014, 14, 706–715. [Google Scholar] [CrossRef] [PubMed]
  39. Wilcox, T.P.; Hugg, L.; Zeh, J.A.; Zeh, D.W. Mitochondrial DNA sequencing reveals extreme genetic differentiation in a cryptic species complex of neotropical pseudoscorpions. Mol. Phylogenetics Evol. 1997, 7, 208–216. [Google Scholar] [CrossRef] [PubMed]
  40. Ohira, H.; Sato, K.; Tsutsumi, T.; Kaneko, S.; Choi, H.-J. DNA barcoding suggested the existence of cryptic species and high biodiversity of South Korean pseudoscorpions (Arachnida, Pseudoscorpiones). J. Asia-Pac. Biodivers. 2018, 11, 399–407. [Google Scholar] [CrossRef]
  41. Ohira, H.; Kaneko, S.; Faulks, L.; Tsutsumi, T. Unexpected species diversity within Japanese Mundochthonius pseudoscorpions (Pseudoscorpiones: Chthoniidae) and the necessity for improved species diagnosis revealed by molecular and morphological examination. Invertebr. Syst. 2018, 32, 259–277. [Google Scholar] [CrossRef]
  42. Harrison, S.E.; Guzik, M.T.; Harvey, M.S.; Austin, A.D. Molecular phylogenetic analysis of Western Australian troglobitic chthoniid pseudoscorpions (Pseudoscorpiones: Chthoniidae) points to multiple independent subterranean clades. Invertebr. Syst. 2014, 28, 386–400. [Google Scholar] [CrossRef]
  43. Murienne, J.; Harvey, M.S.; Giribet, G. First molecular phylogeny of the major clades of Pseudoscorpiones (Arthropoda: Chelicerata). Mol. Phylogenetics Evol. 2008, 49, 170–184. [Google Scholar] [CrossRef] [PubMed]
  44. Benavides, L.R.; Cosgrove, J.G.; Harvey, M.S.; Giribet, G. Phylogenomic interrogation resolves the backbone of the Pseudoscorpiones tree of life. Mol. Phylogenetics Evol. 2019, 139, 106509. [Google Scholar] [CrossRef]
  45. Pfeiler, E.; Bitler, B.G.; Castrezana, S.; Matzkin, L.M.; Markow, T.A. Genetic diversification and demographic history of the cactophilic pseudoscorpion Dinocheirus arizonensis from the Sonoran Desert. Mol. Phylogenetics Evol. 2009, 52, 133–141. [Google Scholar] [CrossRef]
  46. Harms, D.; Roberts, J.D.; Harvey, M.S. Climate variability impacts on diversification processes in a biodiversity hotspot: A phylogeography of ancient pseudoscorpions in south-western Australia. Zool. J. Linn. Soc. 2019, 186, 934–949. [Google Scholar] [CrossRef]
  47. Harms, D. The origins of diversity in ancient landscapes: Deep phylogeographic structuring in a pseudoscorpion (Pseudotyrannochthoniidae: Pseudotyrannochthonius) reflects Plio-Pleistocene climate fluctuations. Zool. Anz. 2018, 273, 112–123. [Google Scholar] [CrossRef]
  48. Lorenz, M.; Loria, S.F.; Harvey, M.S.; Harms, D. The Hercules pseudoscorpions from Madagascar: A systematic study of Feaellidae (Pseudoscorpiones: Feaelloidea) highlights regional endemism and diversity in one of the “hottest” biodiversity hotspots. Arthropod Syst. Phylogeny 2022, 80, 649–691. [Google Scholar] [CrossRef]
  49. DeSalle, R.; Goldstein, P. Review and interpretation of trends in DNA barcoding. Front. Ecol. Evol. 2019, 7, 302. [Google Scholar] [CrossRef]
  50. Yu, J.; Wu, X.; Liu, C.; Newmaster, S.; Ragupathy, S.; Kress, W.J. Progress in the use of DNA barcodes in the identification and classification of medicinal plants. Ecotoxicol. Environ. Saf. 2021, 208, 111691. [Google Scholar] [CrossRef] [PubMed]
  51. Ratnasingham, S.; Hebert, P.D. BOLD: The Barcode of Life Data System (http://www.barcodinglife.org). Mol. Ecol. Notes 2007, 7, 355–364. [Google Scholar] [CrossRef] [PubMed]
  52. Benson, D.A.; Karsch-Mizrachi, I.; Lipman, D.J.; Ostell, J.; Wheeler, D.L. GenBank. Nucleic Acids Res. 2012, 41, D36–D42. [Google Scholar] [CrossRef] [PubMed]
  53. Dewaard, J.R.; Levesque-Beaudin, V.; Dewaard, S.L.; Ivanova, N.V.; McKeown, J.T.; Miskie, R.; Naik, S.; Perez, K.H.; Ratnasingham, S.; Sobel, C.N.; et al. Expedited assessment of terrestrial arthropod diversity by coupling Malaise traps with DNA barcoding. Genome 2019, 62, 85–95. [Google Scholar] [CrossRef]
  54. Senapati, D.; Bhattacharya, M.; Kar, A.; Chini, D.S.; Das, B.K.; Patra, B.C. Environmental DNA (eDNA): A promising biological survey tool for aquatic species detection. In Proceedings of the Zoological Society; Springer: Berlin/Heidelberg, Germany, 2019; pp. 211–228. [Google Scholar]
  55. Schenk, J.; Kleinbölting, N.; Traunspurger, W. Comparison of morphological, DNA barcoding, and metabarcoding characterizations of freshwater nematode communities. Ecol. Evol. 2020, 10, 2885–2899. [Google Scholar] [CrossRef]
  56. Unger, S.D.; Williams, L.A.; Diaz, L.; Jachowski, C.B. DNA barcoding to assess diet of larval eastern hellbenders in North Carolina. Food Webs 2020, 22, e00134. [Google Scholar] [CrossRef]
  57. Johnson, N.S.; Lewandoski, S.A.; Merkes, C. Assessment of sea lamprey (Petromyzon marinus) diet using DNA metabarcoding of feces. Ecol. Indic. 2021, 125, 107605. [Google Scholar] [CrossRef]
  58. Fisher, B.L.; Smith, M.A. A revision of Malagasy species of Anochetus Mayr and Odontomachus Latreille (Hymenoptera: Formicidae). PLoS ONE 2008, 3, e1787. [Google Scholar] [CrossRef] [PubMed]
  59. Alcántar-Escalera, F.J.; García-Varela, M.; Vázquez-Domínguez, E.; de León, G.P.-P. Using DNA barcoding to link cystacanths and adults of the acanthocephalan Polymorphus brevis in central Mexico. Mol. Ecol. Resour. 2013, 13, 1116–1124. [Google Scholar] [PubMed]
  60. Grzywacz, A.; Jarmusz, M.; Walczak, K.; Skowronek, R.; Johnston, N.P.; Szpila, K. DNA barcoding identifies unknown females and larvae of Fannia R.-D. (Diptera: Fanniidae) from carrion succession experiment and case report. Insects 2021, 12, 381. [Google Scholar] [CrossRef] [PubMed]
  61. DeWaard, J.R.; Ratnasingham, S.; Zakharov, E.V.; Borisenko, A.V.; Steinke, D.; Telfer, A.C.; Perez, K.H.J.; Sones, J.E.; Young, M.R.; Levesque-Beaudin, V.; et al. A reference library for Canadian invertebrates with 1.5 million barcodes, voucher specimens, and DNA samples. Sci. Data 2019, 6, 308. [Google Scholar] [CrossRef] [PubMed]
  62. Lopez-Vaamonde, C.; Kirichenko, N.; Cama, A.; Doorenweerd, C.; Godfray, H.C.J.; Guiguet, A.; Gomboc, S.; Huemer, P.; Landry, J.-F.; Laštůvka, A.; et al. Evaluating DNA barcoding for species identification and discovery in European gracillariid moths. Front. Ecol. Evol. 2021, 9, 626752. [Google Scholar] [CrossRef]
  63. Hajibabaei, M.; Singer, G.A.; Hebert, P.D.; Hickey, D.A. DNA barcoding: How it complements taxonomy, molecular phylogenetics and population genetics. TRENDS Genet. 2007, 23, 167–172. [Google Scholar] [CrossRef] [PubMed]
  64. James, S.W.; Porco, D.; Decaens, T.; Richard, B.; Rougerie, R.; Erseus, C. DNA barcoding reveals cryptic diversity in Lumbricus terrestris L., 1758 (Clitellata): Resurrection of L. herculeus (Savigny, 1826). PLoS ONE 2010, 5, e15629. [Google Scholar] [CrossRef] [PubMed]
  65. Lynghammar, A.; Christiansen, J.S.; Griffiths, A.M.; Fevolden, S.-E.; Hop, H.; Bakken, T. DNA barcoding of the northern Northeast Atlantic skates (Chondrichthyes, Rajiformes), with remarks on the widely distributed starry ray. Zool. Scr. 2014, 43, 485–495. [Google Scholar] [CrossRef]
  66. Brasier, M.J.; Harle, J.; Wiklund, H.; Jeffreys, R.M.; Linse, K.; Ruhl, H.A.; Glover, A.G. Distributional patterns of polychaetes across the West Antarctic based on DNA barcoding and particle tracking analyses. Front. Mar. Sci. 2017, 4, 356. [Google Scholar] [CrossRef]
  67. Chamberlin, J.C. A synoptic revision of the generic classification of the chelonethid family Cheliferidae Simon. (Arachnida). Can. Entomol. 1932, 64, 35–39. [Google Scholar] [CrossRef]
  68. Hebert, P.D.; Cywinska, A.; Ball, S.L.; DeWaard, J.R. Biological identifications through DNA barcodes. Proc. R. Soc. Lond. Ser. B Biol. Sci. 2003, 270, 313–321. [Google Scholar] [CrossRef]
  69. Hebert, P.D.; Ratnasingham, S.; De Waard, J.R. Barcoding animal life: Cytochrome c oxidase subunit 1 divergences among closely related species. Proc. R. Soc. Lond. Ser. B Biol. Sci. 2003, 270 (Suppl. S1), S96–S99. [Google Scholar] [CrossRef]
  70. Shorthouse, D.P. SimpleMappr, an online tool to produce publication-quality point maps. 2010. Available online: https://www.simplemappr.net (accessed on 18 June 2023).
  71. Ersts, P.J. Geographic Distance Matrix Generator Version 1.23; American Museum of Natural History: New York, NY, USA, 2012; Available online: https://biodiversityinformatics.amnh.org/open_source/gdmg (accessed on 11 July 2023).
  72. Folmer, O.; Black, M.; Hoeh, W.; Lutz, R.; Vrijenhoek, R. DNA primers for amplification of mitochondrial cytochrome c oxidase subunit 1 from diverse metazoan invertebrates. Mol. Mar. Biol. Biotechnol. 1994, 3, 294–299. [Google Scholar] [PubMed]
  73. Kearse, M.; Moir, R.; Wilson, A.; Stones-Havas, S.; Cheung, M.; Sturrock, S.; Buxton, S.; Cooper, A.; Markowitz, S.; Duran, C.; et al. Drummond. Geneious Basic: An integrated and extendable desktop software platform for the organization and analysis of sequence data. Bioinformatics 2012, 28, 1647–1649. [Google Scholar] [CrossRef] [PubMed]
  74. Edgar, R.C. MUSCLE: Multiple sequence alignment with high accuracy and high throughput. Nucleic Acids Res. 2004, 32, 1792–1797. [Google Scholar] [CrossRef] [PubMed]
  75. Clement, M.; Posada, D.; Crandall, K.A. TCS: A computer program to estimate gene genealogies. Mol. Ecol. 2000, 9, 1657–1659. [Google Scholar] [CrossRef] [PubMed]
  76. Lanfear, R.; Frandsen, P.B.; Wright, A.M.; Senfeld, T.; Calcott, B. PartitionFinder 2: New methods for selecting partitioned models of evolution for molecular and morphological phylogenetic analyses. Mol. Biol. Evol. 2017, 34, 772–773. [Google Scholar] [CrossRef]
  77. Stamatakis, A. RAxML version 8: A tool for phylogenetic analysis and post-analysis of large phylogenies. Bioinformatics 2014, 30, 1312–1313. [Google Scholar] [CrossRef]
  78. Bouckaert, R.; Vaughan, T.G.; Barido-Sottani, J.; Duchêne, S.; Fourment, M.; Gavryushkina, A.; Heled, J.; Jones, G.; Kühnert, D.; De Maio, N.; et al. BEAST 2.5: An advanced software platform for Bayesian evolutionary analysis. PLoS Comput. Biol. 2019, 15, e1006650. [Google Scholar] [CrossRef]
  79. Miller, M.A.; Pfeiffer, W.; Schwartz, T. Creating the CIPRES Science Gateway for inference of large phylogenetic trees. In Proceedings of the 2010 Gateway Computing Environments Workshop (GCE), New Orleans, LA, USA, 14 November 2010; IEEE: Piscataway, NJ, USA, 2010; pp. 1–8. [Google Scholar]
  80. Rambaut, A.; Drummond, A.J.; Xie, D.; Baele, G.; Suchard, M.A. Posterior summarization in Bayesian phylogenetics using Tracer 1.7. Syst. Biol. 2018, 67, 901–904. [Google Scholar] [CrossRef]
  81. FigTree. Available online: http://tree.bio.ed.ac.uk/software/figtree/ (accessed on 4 September 2023).
  82. Puillandre, N.; Brouillet, S.; Achaz, G. ASAP: Assemble species by automatic partitioning. Mol. Ecol. Resour. 2021, 21, 609–620. [Google Scholar] [CrossRef] [PubMed]
  83. Kimura, M. A simple method for estimating evolutionary rates of base substitutions through comparative studies of nucleotide sequences. J. Mol. Evol. 1980, 16, 111–120. [Google Scholar] [CrossRef] [PubMed]
  84. Zhang, J.; Kapli, P.; Pavlidis, P.; Stamatakis, A. A general species delimitation method with applications to phylogenetic placements. Bioinformatics 2013, 29, 2869–2876. [Google Scholar] [CrossRef] [PubMed]
  85. Pons, J.; Barraclough, T.G.; Gomez-Zurita, J.; Cardoso, A.; Duran, D.P.; Hazell, S.; Kamoun, S.; Sumlin, W.D.; Vogler, A.P. Sequence-based species delimitation for the DNA taxonomy of undescribed insects. Syst. Biol. 2006, 55, 595–609. [Google Scholar] [CrossRef] [PubMed]
  86. Ezard, T.; Fujisawa, T.; Barraclough, T.G. Splits: Species’ limits by threshold statistics. R Package Version 2009, 1, r29. [Google Scholar]
  87. Tamura, K.; Stecher, G.; Kumar, S. MEGA11: Molecular evolutionary genetics analysis version 11. Mol. Biol. Evol. 2021, 38, 3022–3027. [Google Scholar] [CrossRef] [PubMed]
  88. Tamura, K.; Nei, M. Estimation of the number of nucleotide substitutions in the control region of mitochondrial DNA in humans and chimpanzees. Mol. Biol. Evol. 1993, 10, 512–526. [Google Scholar]
  89. Santibáñez-López, C.E.; González-Santillán, E.; Monod, L.; Sharma, P.P. Phylogenomics facilitates stable scorpion systematics: Reassessing the relationships of Vaejovidae and a new higher-level classification of Scorpiones (Arachnida). Mol. Phylogenetics Evol. 2019, 135, 22–30. [Google Scholar] [CrossRef]
  90. Benavides, L.R.; Pinto-da-Rocha, R.; Giribet, G. The phylogeny and evolution of the flashiest of the armored harvestmen (Arachnida: Opiliones). Syst. Biol. 2021, 70, 648–659. [Google Scholar] [CrossRef]
  91. Dupuis, J.R.; Roe, A.D.; Sperling, F.A. Multi-locus species delimitation in closely related animals and fungi: One marker is not enough. Mol. Ecol. 2012, 21, 4422–4436. [Google Scholar] [CrossRef]
  92. Edwards, D.L.; Knowles, L.L. Species detection and individual assignment in species delimitation: Can integrative data increase efficacy? Proc. R. Soc. B Biol. Sci. 2014, 281, 20132765. [Google Scholar] [CrossRef] [PubMed]
  93. Carstens, B.C.; Pelletier, T.A.; Reid, N.M.; Satler, J.D. Satler. How to fail at species delimitation. Mol. Ecol. 2013, 22, 4369–4383. [Google Scholar] [CrossRef] [PubMed]
  94. Hlebec, D.; Harms, D.; Kučinić, M.; Harvey, M.S. Integrative taxonomy of the pseudoscorpion family Chernetidae (Pseudoscorpiones: Cheliferoidea): Evidence for new range-restricted species in the Dinaric Karst. Zool. J. Linn. Soc. 2023. [Google Scholar] [CrossRef]
  95. Arabi, J.; Judson, M.L.I.; Deharveng, L.; Lourenço, W.R.; Cruaud, C.; Hassanin, A. Nucleotide composition of CO1 sequences in Chelicerata (Arthropoda): Detecting new mitogenomic rearrangements. J. Mol. Evol. 2012, 74, 81–95. [Google Scholar] [CrossRef] [PubMed]
  96. Astrin, J.J.; Höfer, H.; Spelda, J.; Holstein, J.; Bayer, S.; Hendrich, L.; Huber, B.A.; Kielhorn, K.-H.; Krammer, H.-J.; Lemke, M.; et al. Towards a DNA barcode reference database for spiders and harvestmen of Germany. PLoS ONE 2016, 11, e0162624. [Google Scholar] [CrossRef] [PubMed]
  97. Lin, H.-Y.; Huang, J.-X.; Liu, H.-H.; Chang, C.-H. Two New Pseudoscorpion Species of the Coastal Genus Garypus L. Koch, 1873 (Garypidae) and an Updated Checklist of the Pseudoscorpiones of Taiwan. Zool. Stud. 2022, 61, e24. [Google Scholar] [PubMed]
  98. Levi, H.W. Notes on the life history of the pseudoscorpion Chelifer cancroides (Linn.) (Chelonethida). Trans. Am. Microsc. Soc. 1948, 67, 290–298. [Google Scholar] [CrossRef]
  99. Stemme, T.; Pfeffer, S.E. Anatomy of the nervous system in Chelifer cancroides (Arachnida: Pseudoscorpiones) with a distinct sensory pathway associated with the pedipalps. Insects 2021, 13, 25. [Google Scholar] [CrossRef]
  100. Harvey, M.S. A review and redescription of the cosmopolitan pseudoscorpion Chelifer cancroides (Pseudoscorpiones: Cheliferidae). J. Arachnol. 2014, 42, 86–104. [Google Scholar] [CrossRef]
  101. Krämer, J.; Lüddecke, T.; Marner, M.; Maiworm, E.; Eichberg, J.; Hardes, K.; Schäberl, T.F.; Vilcinskas, A.; Predel, R. Antimicrobial, insecticidal and cytotoxic activity of linear venom peptides from the pseudoscorpion Chelifer cancroides. Toxins 2022, 14, 58. [Google Scholar] [CrossRef]
  102. Červená, M.; Krajčovičová, K.; Christophoryová, J. Recent data about diversity and distribution of pseudoscorpions (Arachnida: Pseudoscorpiones) collected from different habitat types in Slovakia. Klapalekiana 2020, 56, 1–18. [Google Scholar]
  103. Rowe, D.L.; Dunn, K.A.; Adkins, R.M.; Honeycutt, R.L. Molecular clocks keep dispersal hypotheses afloat: Evidence for trans-Atlantic rafting by rodents. J. Biogeogr. 2010, 37, 305–324. [Google Scholar] [CrossRef]
  104. Beier, M. Pseudoscorpionidea II. Subord. C. Cheliferinea; Tierreich, 58, i–xxi+ 1–294; De Gruyter: Berlin, Germany; Boston, MA, USA, 1932. [Google Scholar]
  105. Novák, J.; Danyi, L. Catalogue of the type material of pseudoscorpions (Arachnida: Pseudoscorpiones) deposited in the Hungarian Natural History Museum, Budapest. Zootaxa 2018, 4527, 301–322. [Google Scholar] [CrossRef] [PubMed]
  106. Menge, A. Uber die Scheerenspinnen, Chernetidae. Schr. Naturf. Ges. Danz. 1855, 5, 1–41. [Google Scholar]
  107. Caputi, L.; Andreakis, N.; Mastrototaro, F.; Cirino, P.; Vassillo, M.; Sordino, P. Cryptic speciation in a model invertebrate chordate. Proc. Natl. Acad. Sci. USA 2007, 104, 9364–9369. [Google Scholar] [CrossRef] [PubMed]
  108. Wattier, R.; Mamos, T.; Copilaş-Ciocianu, D.; Jelić, M.; Ollivier, A.; Chaumot, A.; Danger, M.; Felten, V.; Piscart, C.; Žganec, K.; et al. Continental-scale patterns of hyper-cryptic diversity within the freshwater model taxon Gammarus fossarum (Crustacea, Amphipoda). Sci. Rep. 2020, 10, 16536. [Google Scholar] [CrossRef] [PubMed]
  109. Erséus, C.; Gustafsson, D. Cryptic speciation in clitellate model organisms. In Annelids in Modern Biology; John Wiley & Sons: Hoboken, NJ, USA, 2009; pp. 31–46. [Google Scholar]
  110. Heneberg, P.; Bogusch, P.; Astapenková, A. Reed galls serve as an underestimated but critically important resource for an assemblage of aculeate hymenopterans. Biol. Conserv. 2014, 172, 146–154. [Google Scholar] [CrossRef]
  111. Bogusch, P.; Macek, J.; Janšta, P.; Kubík, Š.; Řezáč, M.; Holý, K.; Malenovský, I.; Baňař, P.; Mikát, M.; Astapenková, A.; et al. Industrial and post-industrial habitats serve as critical refugia for pioneer species of newly identified arthropod assemblages associated with reed galls. Biodivers. Conserv. 2016, 25, 827–863. [Google Scholar] [CrossRef]
  112. Bogusch, P.; Heneberg, P.; Astapenková, A. Habitat requirements of wetland bees and wasps: Several reed-associated species still rely on peaty meadows and other increasingly rare wetland habitats. Wetl. Ecol. Manag. 2020, 28, 921–936. [Google Scholar] [CrossRef]
  113. Schwentner, M.; Giribet, G. Phylogeography, species delimitation and population structure of a Western Australian short-range endemic mite harvestman (Arachnida: Opiliones: Pettalidae: Karripurcellia). Evol. Syst. 2018, 2, 81–87. [Google Scholar] [CrossRef]
  114. Štundlová, J.; Šmíd, J.; Nguyen, P.; Šťáhlavský, F. Cryptic diversity and dynamic chromosome evolution in Alpine scorpions (Euscorpiidae: Euscorpius). Mol. Phylogenetics Evol. 2019, 134, 152–163. [Google Scholar] [CrossRef]
  115. Moulds, T.A.; Murphy, N.; Adams, M.; Reardon, T.; Harvey, M.S.; Jennings, J.; Austin, A.D. Phylogeography of cave pseudoscorpions in southern Australia. J. Biogeogr. 2007, 34, 951–962. [Google Scholar] [CrossRef]
Figure 1. Phylogenetic tree of the family Cheliferidae based on Cox1 data. The topology was obtained via Bayesian inference; values on nodes denote support values obtained via both BI and ML analyses (left to right): Bayesian posterior probabilities (PP) and RAxML bootstrap support. Black circles indicate both PP values > 0.95 and bootstrap support > 85. Branches are collapsed at the genus level.
Diversity 15 01040 g001
Figure 5. Rhacochelifer species delimitation. (A) Phylogenetic tree of the genus Rhacochelifer with the results of different species delimitation approaches (right). Topology was obtained via the BI conducted in BEAST, numbers on the nodes denote PP values, and the nodes with PP values > 0.95 are marked with black circles. Terminal tree taxa are color-coded according to the country of their collection. Bottom left corner insert shows an adult female of R. maculatus; scale bar: 1 mm. (B) Map depicting sampling locations of Rhacochelifer delimited lineages according to our preferred species delimitation outcome obtained via ASAP1 (upper right).
Diversity 15 01040 g005
Figure 6. Sampling localities of the targeted genera Chelifer, Dactylochelifer, Hysterochelifer and Rhacochelifer.
Diversity 15 01040 g006
Disclaimer/Publisher’s Note: The statements, opinions and data contained in all publications are solely those of the individual author(s) and contributor(s) and not of MDPI and/or the editor(s). MDPI and/or the editor(s) disclaim responsibility for any injury to people or property resulting from any ideas, methods, instructions or products referred to in the content.

