Article

Climatic and Non-Climatic Drivers of Plant Diversity along an Altitudinal Gradient in the Taihang Mountains of Northern China

1
Center for Agricultural Resources Research, Key Laboratory of Agricultural Water Resources, Institute of Genetics and Developmental Biology, Chinese Academy of Sciences, No.286 Huaizhong Road, Shijiazhuang 050021, China
2
University of Chinese Academy of Sciences, No.19 (A) Yuquan Road, Beijing 100049, China
3
College of Life Sciences, Hebei Normal University, No.20 Road East. 2nd Ring South, Shijiazhuang 050024, China
*
Author to whom correspondence should be addressed.
These authors contributed equally to this work.
Diversity 2023, 15(1), 66; https://doi.org/10.3390/d15010066
Submission received: 28 October 2022 / Revised: 18 December 2022 / Accepted: 21 December 2022 / Published: 5 January 2023
(This article belongs to the Special Issue Mountain Biodiversity, Ecosystem Functioning and Services)

Abstract

:
Climate is critical for plant altitudinal distribution patterns. Non-climatic factors also have important effects on vegetation altitudinal distribution in mountain regions. The purpose of this study was to explore the current distribution of plant diversity along the altitudinal gradient in the Taihang Mountain range of northern China and to estimate the effects of climatic and non-climatic factors on the elevational pattern. Through a field survey, a total of 480 sampling plots were established in the central Taihang Mountain range. Alpha diversities (the Shannon–Weiner index and Simpson index) and beta diversities (the Jaccard index and Cody index) were measured based on the survey data. Plant community structure change based on the altitudinal gradient was explored by measuring the diversity indices. Canonical correspondence analysis was carried out to determine the factors influencing plant altitudinal distribution. The contributions of climatic and non-climatic factors on plant distribution were determined by partial methods. The results showed that the plant diversity of the elevational gradient complied with a “hump-shaped” pattern, in which communities in the medium altitude area with higher plant diversity had a higher species turnover rate, and non-climatic factors, particularly the anthropogenic factors, had an important influence on the plant altitudinal pattern. In conclusion, climatic and non-climatic factors both had important effects on the plant altitudinal pattern. It is strongly recommended to reduce human interference in mountain vegetation protection and management.

1. Introduction

A mountain is an area with certain elevations, slopes, and relative heights that are a reflection and condensed point of the gradients in natural geographical and ecological features [1]. Due to relatively low human disturbance, mountains provide habitat and shelter for terrestrial biological species [2]. Mountains also represent the most abundant unit of biodiversity on Earth and are key areas for the conservation of biodiversity [3,4]. Mountain areas are extremely sensitive to climate change [5]. The response of mountain ecosystems to climate change is an increasing focus of global change research [6,7].
Biological groups form cluster patterns of vertical and horizontal gradients. Kattan et al., suggested that clustering patterns in dendrograms formed two major patterns of differentiation of the biological groups in Colombia: one horizonal and one elevational [8]. The distribution of vegetation has obvious patterns of horizontal and vertical zonality [9]. This implies that the composition of vegetation varies with altitude [10,11]. Multiple environmental factors drive the altitudinal zonality of vegetation [12]. Natural factors, such as climate, geomorphology, and hydrology, drive obvious changes in altitudinal gradients from the bottom to the top of mountains [13,14]. Generally, changes in a mountain landscape along elevation gradients are 1000 times higher than that in horizontal gradients [15], which can be understood to mean that the landscape change on the vertical scale condenses the change on the horizontal scale. Distribution models of plant species diversity in mountain areas are increasingly used in ecological community research. Such models lead to a better understanding of the mechanism of maintenance of biodiversity and altitudinal change in mountain vegetation [16,17].
Research is still not conclusive about the primary factors that determine the patterns of biodiversity on Earth [18,19]. The gradients of diversity patterns at a large scale have been explained mainly by temperature, productivity, water availability, and geographical area [20]. The study of the altitudinal patterns of species diversity in mountain plant communities is critical for the understanding of zonal variations in vegetation along elevation gradients [21]. Plant diversity varies with altitude gradients [22], showing a variety of altitudinal patterns [23,24]. In the study of altitudinal patterns of plant diversity in mountain terrains, the α-diversity (such as the species richness, Shannon–Weiner index and Simpson index), β-diversity (such as the Jaccard index, Cody index) and γ-diversity indices are widely used [23,24,25]. The β-diversity index best reflects a community composition and turnover under an environmental gradient [25,26], which is critical for biodiversity conservation [27,28].
The rapid development of quantitative ecological methods and computer technology are innovatively changing data processing and analysis of biodiversity [29]. Studies suggest that surveys in mountain regions provide valuable insights into biological conservation [30,31]. While the relationship between the patterns of biodiversity and elevation gradients depends on various environmental variables [32], altitudinal patterns of mountain plant communities in different geographical regions differ [33,34,35]. Studies on the process of the development of altitudinal patterns of plant diversity in mountain regions are also attracting much attention [6].
The Taihang Mountain range is a transitional zone from low-elevation plains to high-elevation plateaus, and it is an important ecological barrier to the economic circle of Beijing–Tianjin–Hebei in northern China [36]. Because of the special geographical location of the Taihang Mountain range, it plays an important role as a windbreak, in sand-fixing, and in water conservation. Furthermore, it is a transition zone from economically developed regions to undeveloped regions, where the natural ecosystems are cross-distributed. The Taihang Mountain range is extremely ecologically sensitive. Serious damage to the natural environment and biodiversity has been caused by historical development, which led to serious soil and water loss, frequent droughts, and other significant environmental problems [37]. After decades of overexploitation, along the elevational gradient, the vegetation presents a different distribution pattern. As vegetation provides most of the ecosystem services, the elevational pattern is a reference for evaluating the effects of natural and anthropogenic factors on the vegetation in the Taihang Mountain range. Therefore, the objective of this study was to explore the impact of climate related factors and non-climatic factors on the vertical pattern of plant diversity in the Taihang Mountains.

2. Materials and Methods

2.1. Study Area

The Taihang Mountains (34°36′–40°47′ N, 110°42′–116°34′ E) are a highly heterogeneous geological setting, spreading from the northeast to southwest in northern China (Figure 1). The mountain range acts as a natural boundary between the North China Plain and the Loess Plateau. The altitude across the Taihang Mountains decreases from northwest to southeast, with the highest elevation of 2882 m in the north.
A temperate continental monsoon climate prevails in the study area. From 2009 to 2017, the annual mean temperature was 8.91 °C, and the annual mean precipitation was 529 mm. Both temperature and precipitation increase from the northwest to the southeast. The Taihang Mountains are also known for their expansive biodiversity in northern China. Warm temperate deciduous broad-leaved forest is the dominant vegetation type in the central Taihang Mountain region.
The eastern slopes (sunny slopes) of the Taihang Mountains are steeper than the western slopes (shady slopes); therefore, the vegetation has a more obvious vertical change on the sunny slopes. The survey plots in this study were mainly on the sunny slopes in the central Taihang Mountain region, where the highest peak (Tuoliang) is 2282 m. The central Taihang Mountain region is divided into three ecological zones: a hilly zone (<500 m), mid-mountain zone (500–1500 m), and sub-alpine zone (>1500 m) [38]. Each zone is characterized by a different set of biodiversity and ecosystem services.

2.2. Field Survey

This field survey was carried out during the growing season from May 2017 to October 2019 in Tuoliang National Nature Reserve, which is located in the central part of the Taihang Mountain range. A total of 480 survey plots (including tree, shrub, and herb plots) were established at 16 elevations (100 m, 200 m, 300 m, 400 m, 500 m, 600 m, 700 m, 900 m, 1100 m, 1300 m, 1500 m, 1700 m, 1800 m, 1900 m, 2100 m, and 2200 m). At each elevation, five tree plots (10 m × 10 m for each plot), 10 shrub plots (5 m × 5 m), and 15 herb plots (1 m × 1 m) were established, and the species and individual numbers of trees, shrubs and herbs were recorded in each plot. For soil water content (VWC%) and soil pH analyses, three soil samples at a 0–20 cm depth were collected by a cylindrical soil sampler of 5 cm diameter at the same time as the field survey.

2.3. Environmental Data Source

The climatic factors (temperature and precipitation) were collected for the period of 2008–2017 from 101 automatic weather stations installed across the Taihang Mountain range. The temperature and precipitation of each survey plot were derived by kriging interpolation. Non-climatic factors in this study, including elevation, slope, aspect, human footprint index (Hfp), human influence index (Hii), net primary productivity (NPP), human population density, soil pH, and soil water content (VWC%) were derived by synchronizing with the field survey region. The elevation of each plot was measured by GPS, and slope and aspect were detected by a gradiometer. Net primary productivity (NPP) was derived from MOD17A3 data released by the University of Montana, USA (http://ipdaac.usgs.gov, accessed on 28 October 2022). Hfp and Hii were derived from the Socioeconomic Data and Applications Center of NASA (SEDAC, https://sedac.ciesin.columbia.edu/, accessed on 28 October 2022). Human population density is often used as an indicator of vegetation disturbance [39]. The population density was obtained from the Geographical Information Monitoring Cloud Platform maintained by China. The datasets were interpolated for each sampling plot using ordinary kriging. Descriptive statistics of the climatic and non-climatic factors along the altitudinal gradient in the Taihang Mountain study area are given in Table 1.

2.4. α-Diversity and β-Diversity Indices

The α-diversity represents species richness within a community. The diversity indices at different altitudes were calculated in terms of the plot survey. The richness index represents the number of species in the sampling plots. The formulas for the Shannon–Weiner index (H) and the Simpson index (D) are as follows:
Shannon-Weiner index:
H = i = 1 s P i l n P i
Simpson index:
D = 1 i = 1 s n i N 2
where Pi is the proportion of the ith individual to the total number of individuals, ni represents the number of individuals of the ith species, and N represents the number of individuals of all species in the community.
The β-diversity is often expressed as the ratio of regional (γ-diversity) to α-diversity, and it is often measured as species turnover between different communities. In this study, we used the Jaccard index and Cody index to explore the traits of plant community succession along the altitudinal gradient. While the Jaccard index represents the similarity of different communities and quadrats, the Cody index represents the turnover rate of species along an environmental gradient. The indices are calculated as follows:
Jaccard index:
CJ = c a + b c
Cody index:
β c = g H + l H 2 = a + b 2 c 2
where a and b denote the number of species in two communities, c denotes the number of species shared by the two communities, g(H) is the number of species increasing along the gradient (H), and l(H) is the number of species lost along the gradient.

2.5. Data Analysis

Based on the sample data and remote sensing image data for the Taihang Mountains, climatic and non-climatic factors were processed and analyzed by SPSS 23 and mapped in ArcGIS 12.2. Ordination analysis is often used to explain variations in data in relation to species and area [40]. To investigate the distribution patterns of plant diversity and lifeform groups in the survey plots, principal components analysis (PCA) was used to analyze the altitudinal gradient. The influences of climatic and non-climatic factors on species altitudinal distribution were evaluated using canonical correspondence analysis (CCA) in R 3.4.5, and contributions of climatic and non-climatic factors to the plant altitudinal pattern were estimated with partial CCA in R 3.4.5. To verify the significance of environmental factors and the plant species altitudinal distribution, a Monte Carlo permutation test was performed in CANOCO 4.5.

3. Results

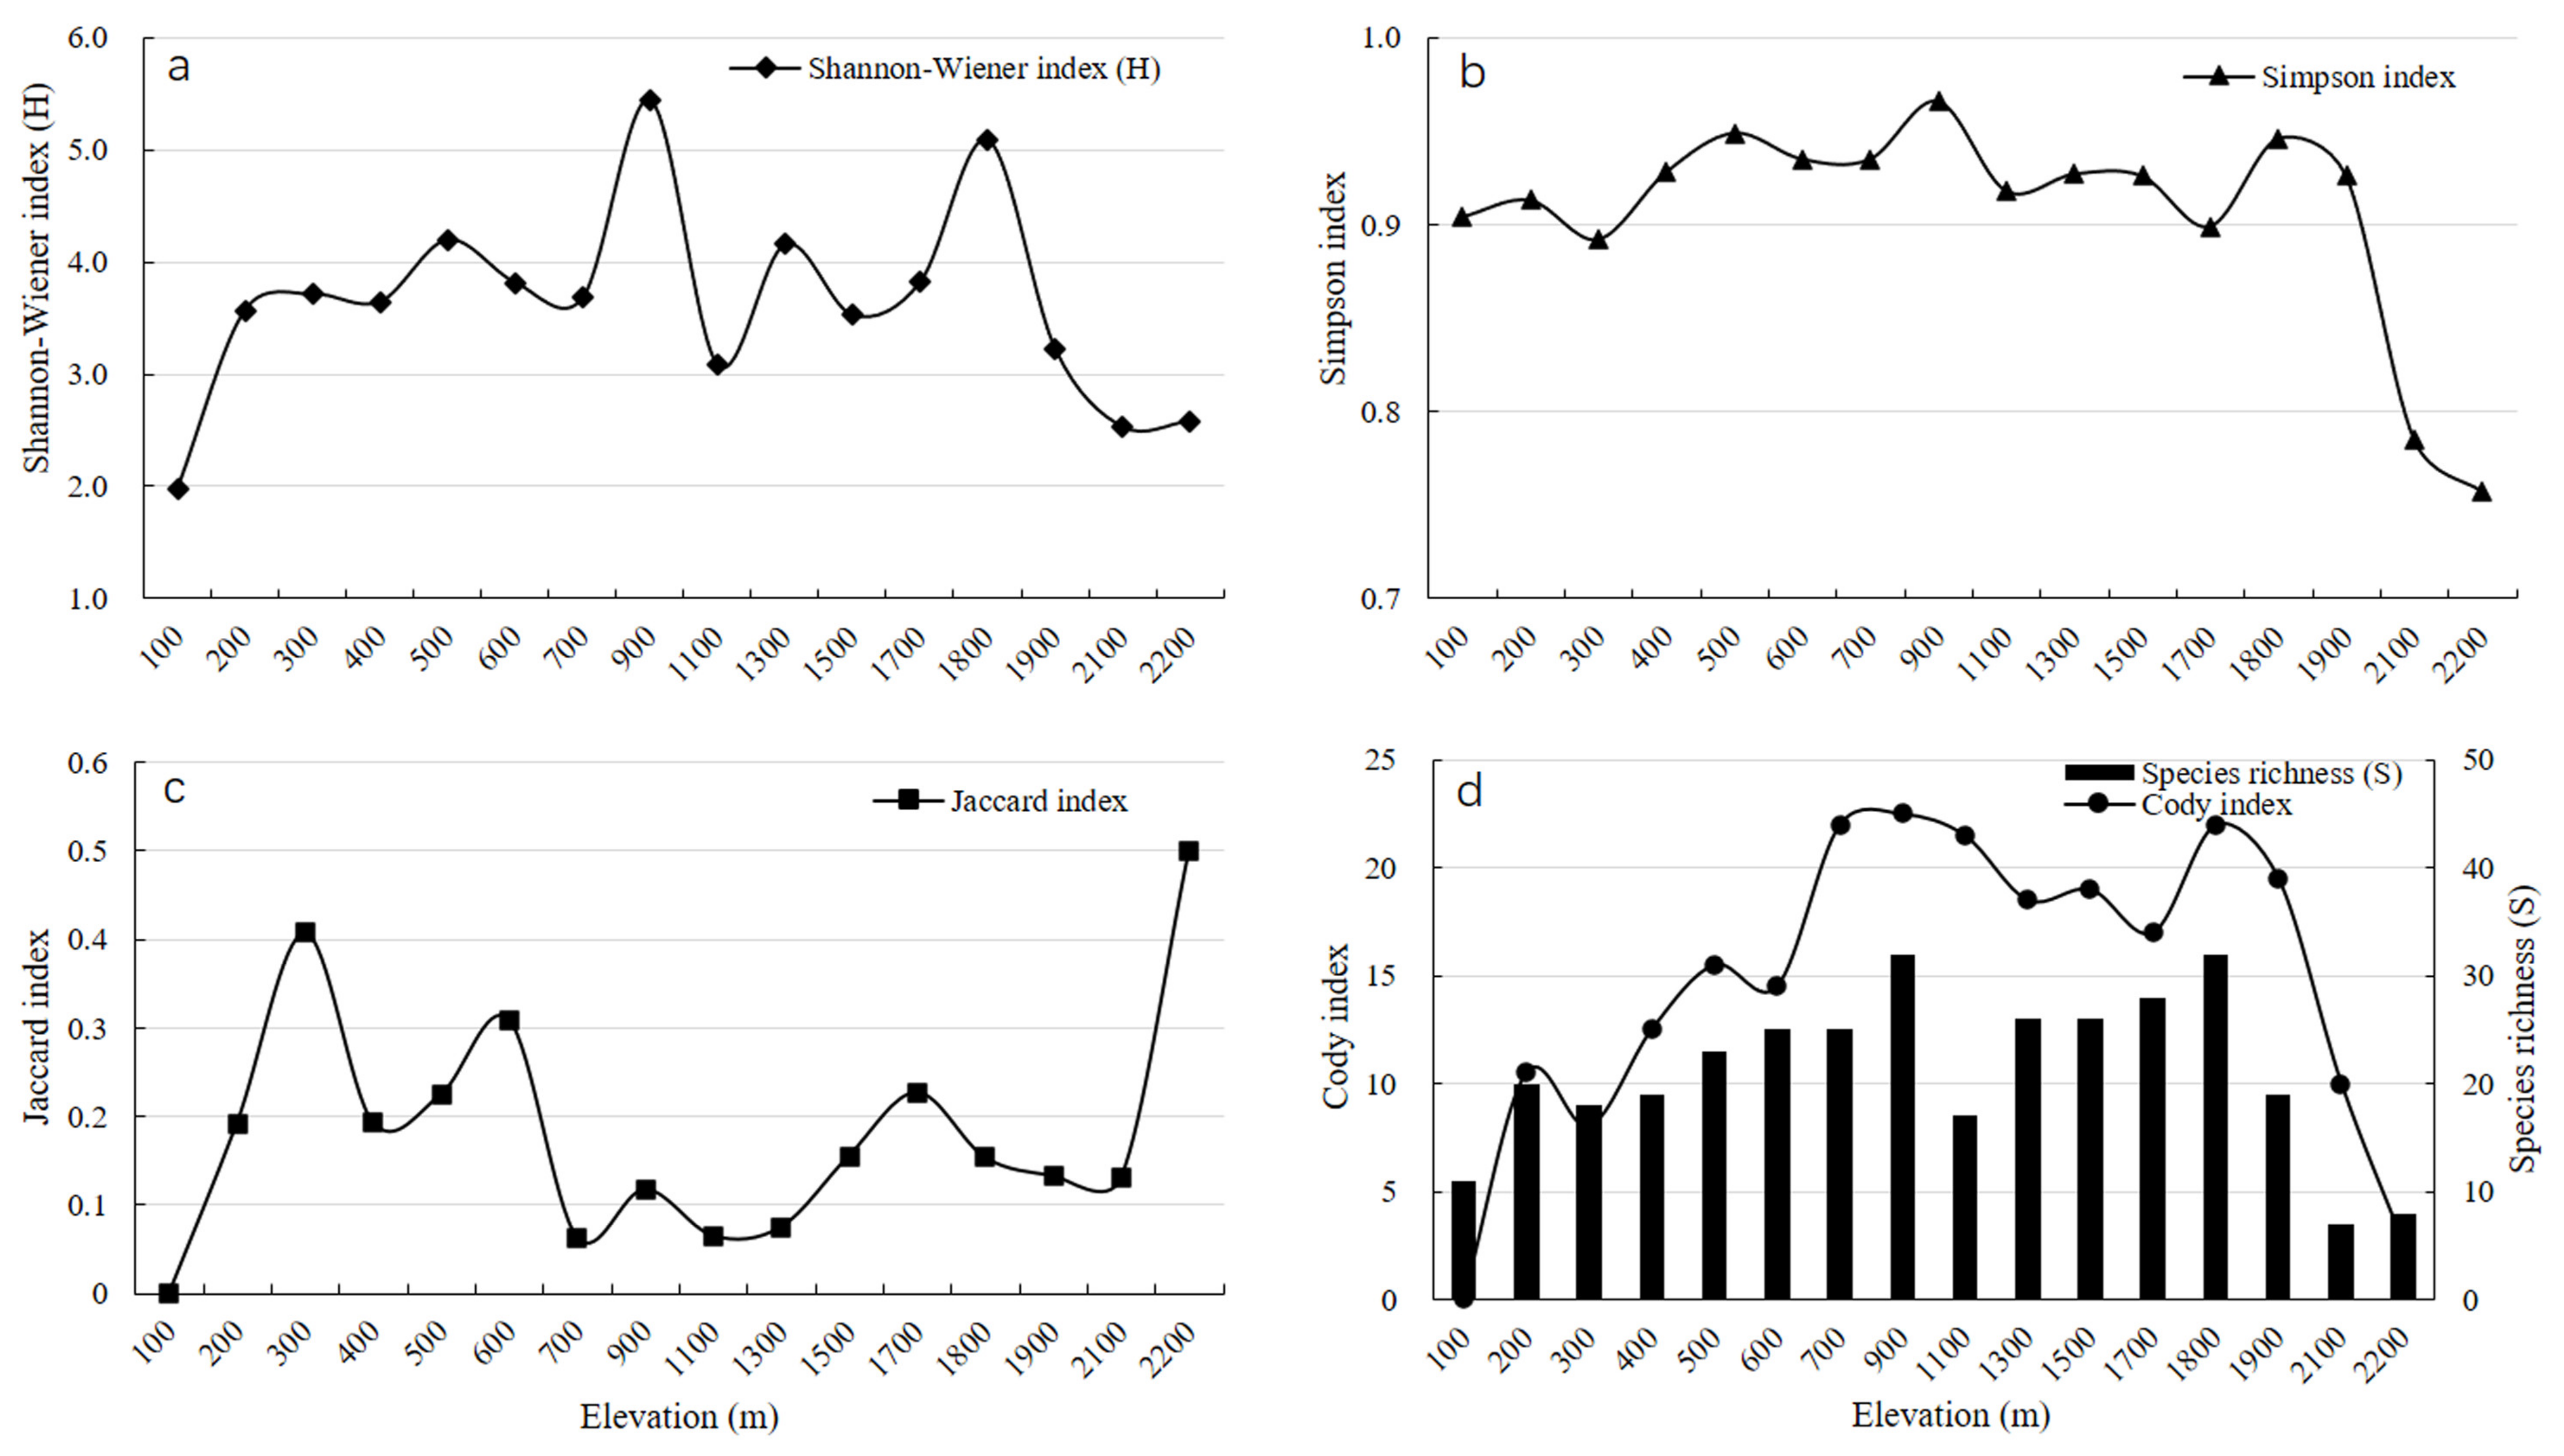
3.1. Altitudinal Distribution of A-Diversity in Plants

Based on the field survey, 54 vascular plant species were recorded in the hilly zone, belonging to 32 families and 49 genera; 103 species in the mid-mountain zone, belonging to 47 families and 88 genera; and 58 species in the sub-alpine zone, belonging to 21 families and 48 genera. As the overall elevation was not very high (with the lowest altitude of 0 m and the highest peak of 2282 m in the central Taihang Mountain region), there was not an obvious altitudinal spectrum of vegetation in this region.
Generally, the vascular plants (including trees, shrubs, and herbs) had the same altitudinal pattern, in which the number of plant species increased with increasing elevation. At elevation ranges of 600–900 m and 1500–1900 m, the plant richness (Figure 2d), Shannon-Wiener index (Figure 2a) and Simpson index (Figure 2b) had two peak intervals, and then began to decrease with increasing elevation. The distribution of plant diversity in the central Taihang Mountain region was relatively complicated in terms of the elevation gradient.
Quantitative measurement is needed to show differences in communities [41]. PCA analysis (Figure 3) indicated that plant species richness was mainly concentrated in the mid-elevation zone (sites 5–14). Individual plants, species of trees and herbs, and the richness and Shannon–Weiner indices were highest in the area covering sites 5–14, which meant that plant richness was highest in the mid-elevation zone. Shrubs mainly occurred in the low elevation zone, in the area covering sites 1–4.

3.2. Β-Diversity of Plants along the Altitudinal Gradient

Figure 2 shows that the Shannon–Weiner index, Simpson index and Cody index had coincident altitudinal patterns of plant richness, implying a relatively high plant diversity concentrated in the mid-elevation zone. The patterns of the Jaccard index indicated that the sampling plots in the mid-elevation range had a high similarity in plant community structure.
Low β-diversity can lead to low species turnover rates [42]. The Cody index represents the rate of species turnover between communities, with the highest species turnover always taking place in pioneer and mountain species [43]. In this study, the Jaccard index showed the opposite altitudinal patterns to the richness, Shannon–Weiner index and Simpson index, while the Cody index showed a consistent distribution trend, implying that the altitudinal gradient with lower community similarity had a higher species turnover rate of plant communities.

3.3. Relationships between Plant Diversity and Environmental Factors along the Altitudinal Gradient

In predicting species distribution, canonical correspondence analysis (CCA) is widely used [44]. CCA ordination (Figure 4) showed that the driving factors with positive effects on tree, shrub, and herb richness were soil water content (VWC%), precipitation, and pH. The factors with negative effects on plant richness were temperature, Hii, Hfp, and population density. Slope and pH had the smallest effects on altitudinal distribution of plants in the central Taihang Mountain area.

4. Discussion

4.1. Plant Diversity Pattern along the Altitudinal Gradient

Based on the field survey and species identification, there were 54 species of vascular plants in the hilly zone, belonging to 32 families and 49 genera; 103 species in the mid-mountain zone, belonging to 47 families and 88 genera; and 58 species in the sub-alpine zone, belonging to 21 families and 48 genera. This conformed with the richness distribution theory on “middle height expansion,” consistent with studies of vine plants in other mountain regions [45,46,47,48].
In this study, trees were mainly found in the hilly and mid-mountain zones, with few trees in the sub-alpine zone. Shrubs and herbs were widely distributed from the low to the high elevation zones in the central Taihang Mountain region. The richness of herbs was higher than that of shrubs and trees. PCA ordination showed that plant groups were mainly concentrated in the mid-elevation range in the central Taihang Mountain region.
In the sub-alpine zone, temperate herbal plants were the main vegetation type. There was a higher proportion of annual herbaceous plants with more endemic species in this zone, indicating that biodiversity endured to a certain degree even in an area with intense human disturbance. While species richness decreased significantly at elevations above 2000 m, the community similarity index increased sharply. This implied that more common species of vascular plants were concentrated in the sub-alpine areas; therefore, there was relatively low species diversity.

4.2. Characteristics of the Β-Diversity Pattern of the Altitudinal Gradient

Patterns of species turnover are vital to the geography of biodiversity [49]. The Cody index for elevations above 2000 m decreased sharply, indicating that the rate of replacement of plant communities decreased to a relatively low degree. Studies show that areas with lower species richness are more easily invaded by exotic species [50], and thus the plant community structure of a low richness area is more easily disturbed. According to this hypothesis, the results in Figure 2 indicated that the community structure of the sub-alpine zone with a lower plant diversity richness was more unstable in the central Taihang Mountain region.
While the processes of biodiversity maintenance and species coexistence are the focus of ecological studies, those of community construction and succession along altitudinal gradients still remain unclear. Ecological niche theories are increasingly becoming a mainstream issue in community construction and species distribution. Species diversity increases with increasing heterogeneity of the environment along vertical or horizontal gradients [6,47]. In β-diversity research, numerous methods of measurement have been proposed. Using combined β-diversity, gradient analysis, and ecological niche modeling, significant and novel insights are made into biological diversity patterns [51]. Among these, similarly and dissimilarity indices are widely used. The application of additive decomposition in β-diversity better reveals the processes of community construction along elevation gradients. In this study, we mainly focused on the Jaccard and Cody indices, which can give insight into the plant community structure change and species turnover rate along the elevational gradient. As mentioned at the beginning, the Taihang Mountain range is a mountainous region that has been overexploited for a long period; thus, human disturbances have created a lasting pressure on the ecosystem of the Taihang Mountains. The altitudinal pattern of α-diversity was found to be relatively complicated, and two peaks of plant richness appeared at the elevation range of 600–900 m and 1500–1900 m, which reflected more suitable natural conditions and less anthropogenic disturbance of the plant diversity. Characteristics of the β-diversity at the elevational gradients with higher richness showed that the plant community had more active succession capacity and a higher species turnover rate. Inner succession activity, natural conditions, and human disturbance formed the current plant altitudinal distribution pattern.
In summary, the altitudinal distribution pattern and species diversity of plant communities on the sunny slopes of the central Taihang Mountain region were a result of the joint actions of community succession and natural and anthropogenic disturbances.

4.3. Effects of Climatic and Non-Climatic Factors on the Plant Diversity Altitudinal Pattern

Although environmental factors can influence species distribution, plants can have positive effects on each other [52]. In this study, we focused mainly on the effects of environmental factors on the altitudinal pattern of plant species. Using partial analysis, we evaluated the contribution of climatic (temperature and precipitation) and non-climatic (slope, Hfp, Hii, NPP, population density, pH, and VWC%) factors to the altitudinal patterns of plant diversity. Partial methods are often used to analyze the effects of the main environmental variables and covariates on species distribution. We measured the contribution of climatic and non-climatic factors to plant distribution along the altitudinal gradient by partial CCA. The results showed that the interpretation rate of climatic factors on the altitudinal distribution of plant species (28.89%) was less than that of non-climatic factors (44.51%), which indicated that non-climatic factors were the main driving forces of plant altitudinal distribution in the central Taihang Mountain region. Ohmann and Spies [53] noted that the contribution of climate to species distribution in an Oregon forest was the most significant factor, which contrasted with the results in this study. The joint contribution of climatic and non-climatic factors was 13.72%, and 12.88% of the altitudinal pattern could not be explained by climatic and non-climatic factors (Figure 5). These results implied that the plant distribution pattern was more significantly influenced by altitudinal gradients than by temperature and precipitation gradients.
By using the Monte Carlo significance test of CCA ordination (Table 2), it was noted that the climatic factors (temperature and precipitation) had the most significant effect on plant altitudinal distribution patterns; moreover, the coefficients of temperature and precipitation reached the most significant and extremely significant levels, respectively. The coefficients of non-climatic factors, including Hfp, Hii, and population density, reached extremely significant levels, implying that these factors also had an important effect on plant altitudinal distribution patterns in the study area. The coefficients of slope, NPP, and soil pH were not significant (Pr > 0.05), implying that these factors were not the dominant drivers of the plant altitudinal distribution in the study area. According to the results of partial CCA, non-climatic factors played a more important role than climatic factors in the plant altitudinal pattern. Among the non-climatic factors, coefficients of Hfp, Hii, and human population density reached an extremely significant level, and the coefficient of water soil content reached a significant level, which implied the anthropogenic factors (Hfp, Hii, and population density) had more important effects than the other non-climatic factors on the plant altitudinal pattern in the central Taihang Mountain region of northern China.

5. Conclusions

In conclusion, climatic and non-climatic factors both had important effects on the plant altitudinal pattern. Non-climatic factors were the more significant drivers of plant distribution along the altitudinal gradient compared to climatic factors in the central Taihang Mountain region. In addition, among the non-climatic factors, the anthropogenic factors were the main driving forces of the plant altitudinal distribution. To a certain degree, both climatic and non-climatic factors drove the altitudinal distribution of species richness in the study area. The results of the study suggested that in the central Taihang Mountain region, even in the sub-alpine zone, human disturbance was still a critical factor driving the altitudinal distribution of species richness. From the perspective of sustainable development, in the mountain vegetation protection and management, it is strongly recommended to reduce the impact of human interference.

Author Contributions

Conceptualization, J.L. and H.L.; methodology, H.L.; software, T.F.; validation, H.G. and H.L.; formal analysis, H.L.; investigation, H.G.; resources, T.F. and M.L.; data curation, H.L.; writing—original draft preparation, H.L.; writing—review and editing, J.L.; visualization, T.F.; supervision, J.L.; project administration, H.L.; funding acquisition, J.L. All authors have read and agreed to the published version of the manuscript.

Funding

This work was supported by the Key Programme of National Natural Science Foundation of China (No. 41930651).

Institutional Review Board Statement

Not applicable.

Informed Consent Statement

Not applicable.

Data Availability Statement

Data supporting the reported results are included in the manuscript text.

Acknowledgments

We thank Hongjun Li for the statistics analysis, Jiancheng Zhao and Lin Li for their excellent technical support, and Huijun Gao and Fei Qi for the support in the field survey. We also thank LetPub (www.letpub.com, accessed on 28 October 2022) for its linguistic assistance during the preparation of this manuscript.

Conflicts of Interest

The authors declare no conflict of interest. The founding sponsors had no role in the design of the study; in the collection, analyses, or interpretation of data; in the writing of the manuscript, and in the decision to publish the results.

References

  1. Dullinger, S.; Gattringer, A.; Thuiller, W.; Moser, D.; Zimmermann, N.E.; Guisan, A.; Willner, W.; Plutzar, C.; Leitner, M.; Mang, T.; et al. Extinction debt of high-mountain plants under twenty-first-century climate change. Nat. Clim. Change 2012, 2, 619–622. [Google Scholar] [CrossRef]
  2. Gottfried, M.; Pauli, H.; Futschik, A.; Akhalkatsi, M.; Barančok, P.; Benito Alonso, J.L.; Coldea, G.; Dick, J.; Erschbamer, B.; Fernández Calzado, M.R.; et al. Continent-wide response of mountain vegetation to climate change. Nat. Clim. Change 2012, 2, 111–115. [Google Scholar] [CrossRef]
  3. Beniston, M. Climatic change in mountain regions: A review of possible impacts. Clim. Change 2003, 59, 5–31. [Google Scholar] [CrossRef]
  4. Engler, R.; Randin, C.F.; Thuiller, W.; Dullinger, S.; Zimmermann, N.E.; Araújo, M.B.; Pearman, P.B.; Le Lay, G.; Piedallu, C.; Albert, C.H.; et al. 21st century climate change threatens mountain flora unequally across Europe. Glob. Change Biol. 2011, 17, 2330–2341. [Google Scholar] [CrossRef]
  5. McFadden, I.R.; Sandel, B.; Tsirogiannis, C.; Morueta-Holme, N.; Svenning, J.; Enquist, B.J.; Kraft, N.J. Temperature shapes opposing latitudinal gradients of plant taxonomic and phylogenetic β diversity. Ecol. Lett. 2019, 22, 1126–1135. [Google Scholar] [CrossRef] [PubMed]
  6. Gallardo-Cruz, J.A.; Perez-Garcia, E.A.; Meave, J.A. β-diversity and vegetation structure as influenced by slope aspect and altitude in a seasonally dry tropical landscape. Landsc. Ecol. 2009, 24, 473–482. [Google Scholar] [CrossRef]
  7. Loarie, S.R.; Duffy, P.B.; Hamilton, H.; Asner, G.P.; Field, C.B.; Ackerly, D.D. The velocity of climate change. Nature 2009, 462, 1052–1055. [Google Scholar] [CrossRef]
  8. Kattan, G.H.; Franco, P.; Rojas, V.; Morales, G. Biological diversification in a complex region: A spatial analysis of faunistic diversity and biogeography of the Andes of Colombia. J. Biogeogr. 2004, 31, 1829–1839. [Google Scholar] [CrossRef]
  9. Seipel, T.; Kueffer, C.; Rew, L.J.; Daehler, C.C.; Pauchard, A.; Naylor, B.J.; Alexander, J.M.; Edwards, P.J.; Parks, C.G.; Arevalo, J.R.; et al. Processes at multiple scales affect richness and similarity of non-native plant species in mountains around the world. Glob. Ecol. Biogeogr. 2012, 21, 236–246. [Google Scholar] [CrossRef]
  10. Vazquez, G.; Givnish, T.J. Altitudinal gradients in tropical forest composition, structure, and diversity in the Sierra de Manantalan. J. Ecol. 1998, 86, 999–1020. [Google Scholar]
  11. Willig, M.R.; Presley, S.J. The spatial configuration of taxonomic biodiversity along a tropical elevational gradient: α-, β-, and γ-partitions. Biotropica 2019, 51, 104–116. [Google Scholar] [CrossRef]
  12. Britton, A.J.; Beale, C.M.; Towers, W.; Hewison, R.L. Biodiversity gains and losses: Evidence for homogenization of Scottish alpine vegetation. Biol. Conserv. 2009, 142, 1728–1739. [Google Scholar] [CrossRef]
  13. Hoorn, C.; Wesselingh, F.P.; Ter Steege, H.; Bermudez, M.A.; Mora, A.; Sevink, J.; Sanmartín, I.; Sanchez-Meseguer, A.; Anderson, C.L.; Antonelli, A. Amazonia through time: Andean uplift, climate change, landscape evolution, and biodiversity. Science 2010, 330, 927–931. [Google Scholar] [CrossRef] [Green Version]
  14. Zhao, H.; Wang, Q.-R.; Fan, W.; Song, G.-H. The relationship between secondary forest and environmental factors in the southern Taihang Mountains. Sci. Rep. 2017, 7, 16431. [Google Scholar] [CrossRef] [Green Version]
  15. Walter, H. Vegetation of the Earth in Relation to Climate and the Eco-Physiological Conditions; English University Press: London, UK, 1973. [Google Scholar]
  16. Brown, J.H.; Whitham, T.G.; Ernest, S.K.M.; Gehring, C.A. Complex species interactions and the dynamics of ecological systems: Long-term experiments. Science 2001, 293, 643–650. [Google Scholar] [CrossRef] [Green Version]
  17. Pauli, H.; Gottfried, M.; Dullinger, S.; Abdaladze, O.; Akhalkatsi, M.; Alonso, J.L.B.; Coldea, G.; Dick, J.; Erschbamer, B.; Calzado, R.F.; et al. Recent plant diversity changes on Europe’s mountain summits. Science 2012, 336, 353–356. [Google Scholar] [CrossRef] [Green Version]
  18. Gaston, K.J. Global patterns in biodiversity. Nature 2000, 405, 220–227. [Google Scholar] [CrossRef]
  19. Fine, P.V.A. Ecological and evolutionary drivers of geographic variation in species diversity. Annu. Rev. Ecol. Evol. Syst. 2015, 46, 369–392. [Google Scholar] [CrossRef] [Green Version]
  20. Peters, M.; Hemp, A.; Appelhans, T.; Behler, C.; Classen, A.; Detsch, F.; Ensslin, A.; Ferger, S.W.; Frederiksen, S.B.; Gebert, F.; et al. Predictors of elevational biodiversity gradients change from single taxa to the multi-taxa community level. Nat. Commun. 2016, 7, 13736. [Google Scholar] [CrossRef] [Green Version]
  21. Zimmermann, P.; Tasser, E.; Leitinger, G.; Tappeiner, U. Effects of land-use and land-cover pattern on landscape-scale biodiversity in the European Alps. Agriculture. Ecosyst. Environ. 2010, 139, 13–22. [Google Scholar] [CrossRef]
  22. Linder, H.P.; De Klerk, H.M.; Born, J.; Burgess, N.D.; Fjeldså, J.; Rahbek, C. The partitioning of Africa: Statistically denied biogeographical regions in sub-Saharan Africa. J. Biogeogr. 2012, 39, 1189–1205. [Google Scholar] [CrossRef]
  23. Sanders, N.J.; Rahbek, C. The patterns and causes of elevational diversity gradients. Ecography 2012, 35, 1–3. [Google Scholar] [CrossRef]
  24. Guo, Q.; Kelt, D.A.; Sun, Z.; Liu, H.; Hu, L.-J.; Ren, H.; Wen, J. Global variation in elevational diversity patterns. Sci. Rep. 2013, 3, srep03007. [Google Scholar] [CrossRef] [PubMed] [Green Version]
  25. Whittaker, R.H. Vegetation of the Siskiyou Mountains, Oregon and California. Ecol. Monogr. 1960, 30, 279–338. [Google Scholar] [CrossRef]
  26. De Frenne, P.; Rodríguez-Sánchez, F.; Coomes, D.A.; Baeten, L.; Verstraeten, G.; Vellend, M.; Bernhardt-Römermann, M.; Brown, C.D.; Brunet, J.; Cornelis, J.; et al. Microclimate moderates plant responses to macroclimate warming. Proc. Natl. Acad. Sci. USA 2013, 110, 18561–18565. [Google Scholar] [CrossRef] [Green Version]
  27. Chun, J.H.; Lee, C.B. Partitioning the regional and local drivers of phylogenetic and functional diversity along temperate elevational gradients on an East Asian peninsula. Sci. Rep. 2018, 8, 2853. [Google Scholar] [CrossRef] [Green Version]
  28. Horák, J.; Materna, J.; Halda, J.P.; Mladenović, S.; Bogusch, P.; Pech, P. Biodiversity in remnants of natural mountain forests under conservation-oriented management. Sci. Rep. 2019, 9, 89. [Google Scholar] [CrossRef] [Green Version]
  29. Naud, L.; Måsviken, J.; Freire, S.; Angerbjörn, A.; Dalén, L.; Dalerum, F. Altitude effects on spatial components of vascular plant diversity in a subarctic mountain tundra. Ecol. Evol. 2019, 9, 4783–4795. [Google Scholar] [CrossRef] [Green Version]
  30. Lomolino, M.V. Elevation gradients of species-density: Historical and prospective views. Glob. Ecol. Biogeogr. 2001, 10, 3–13. [Google Scholar] [CrossRef]
  31. Hansen, A.J.; Spies, T.A.; Swanson, F.J.; Ohmann, J.L. Conserving biodiversity in Managed forests. BioScience 1991, 21, 382–392. [Google Scholar] [CrossRef] [Green Version]
  32. Zhao, C.; Wang, J.; Yu, F.; Zhang, X.; Yao, Y.; Zhang, B. Altitudinal biodiversity gradient and ecological drives for different lifeforms in the Baotianman Nature Reserve of the eastern Qinling Mountains. Forests 2019, 10, 332. [Google Scholar] [CrossRef]
  33. Cabrera, O.; Benítez, A.; Cumbicus, N.; Naranjo, C.; Ramón, P.; Tinitana, F.; Escudero, A. Geomorphology and altitude effects on the diversity and structure of the vanishing montane forest of southern Ecuador. Diversity 2019, 11, 32. [Google Scholar] [CrossRef] [Green Version]
  34. Dhakal, B.; Kattel, R.R. Effects of global changes on ecosystems services of multiple natural resources in mountain agricultural landscapes. Sci. Total Environ. 2019, 676, 665–682. [Google Scholar] [CrossRef]
  35. Xu, M.; Zhang, S.; Wen, J.; Yang, X. Multiscale spatial patterns of species and biomass together with their correlations along geographical gradients in subalpine meadows. PLoS ONE 2019, 14, e0211560. [Google Scholar] [CrossRef] [Green Version]
  36. Fan, X. The Road to the Taihang Mountains; China Forestry Publishing House: Beijing, China, 2015. [Google Scholar]
  37. Liu, X.; Ge, J.; Feng, X. Study on ecological security of land resources in Taihang Mountain Hebei. J. Arid Land Resour. Environ. 2007, 21, 68–74. [Google Scholar]
  38. Gao, H.; Fu, T.G.; Liu, J.T.; Liang, H.; Han, L. Ecosystem services management based on differentiation and regionalization along altitudinal gradient in Taihang Mountain, China. Sustainability 2018, 10, 986. [Google Scholar] [CrossRef] [Green Version]
  39. Ribeiro, E.M.; Arroyo-Rodríguez, V.; Santos, B.A.; Tabarelli, M.; Leal, I.R. Chronic anthropogenic disturbance drives the biological impoverishment of the Brazilian Caatinga vegetation. J. Appl. Ecol. 2015, 52, 611–620. [Google Scholar] [CrossRef]
  40. Wolf, H.D.J. Diversity patterns and biomass of epiphytic bryophytes and lichens along an altitudinal gradient in the northern Andes. Ann. Mo. Bot. Gard. 1993, 4, 928–960. [Google Scholar]
  41. Lozupone, C.A.; Hamady, M.; Kelley, S.T.; Knight, R. Quantitative and qualitative β diversity measures lead to different insights into factors that structure microbial communities. Appl. Environ. Microbiol. 2007, 73, 1576–1585. [Google Scholar] [CrossRef] [Green Version]
  42. Jankowski, J.E.; Ciecka, A.L.; Meyer, N.Y.; Rabenold, K.N. Beta diversity along environmental gradients: Implications of habitat specialization in tropical montane landscapes. J. Anim. Ecol. 2009, 78, 315–327. [Google Scholar] [CrossRef]
  43. Koellner, T.; Hersperger, A.M.; Wohlgemuth, T. Rarefaction method for assessing plant species diversity on a regional scale. Ecography 2004, 27, 532–544. [Google Scholar] [CrossRef]
  44. Guisan, A.; Weiss, S.B.; Weiss, A. GLM versus CCA spatial modeling of plant species distribution. Plant Ecol. 1999, 143, 107–122. [Google Scholar] [CrossRef]
  45. Kessler, M. Patterns of diversity and range size of selected plant groups along an elevational transect in the Bolivian Andes. Biodivers. Conserv. 2001, 10, 1897–1921. [Google Scholar] [CrossRef]
  46. Wang, G.; Zhou, G.; Yang, L.; Li, Z. Distribution, species diversity and life-form spectra of plant communities along an altitudinal gradient in the northern slopes of Qilianshan Mountains, Gansu, China. Plant Ecol. 2002, 165, 169–181. [Google Scholar] [CrossRef]
  47. Sanchez-Gonzalez, A.; Lopez-Mata, L. Plant species richness and diversity along an altitudinal gradient in the Sierra Nevada, Mexico. Divers. Distrib. 2005, 11, 567–575. [Google Scholar] [CrossRef]
  48. Cardelus, C.L.; Colwell, R.K.; Watkins, J.E. Vascular epiphyte distribution patterns: Explaining the mid-elevation richness peak. J. Ecol. 2006, 94, 144–156. [Google Scholar] [CrossRef]
  49. Buckley, L.B.; Jetz, W. Linking global turnover of species and environments. Proc. Natl. Acad. Sci. USA 2008, 105, 17836–17841. [Google Scholar] [CrossRef] [Green Version]
  50. Stohlgren, T.J.; Binkley, D.; Chong, G.W.; Kalkhan, M.A.; Schell, L.D.; Bull, K.A.; Otsuki, Y.; Newman, G.; Bashkin, M.; Son, Y. Exotic plant species invade hot spots of native plant diversity. Ecol. Monogr. 1999, 69, 25–46. [Google Scholar] [CrossRef]
  51. Graham, C.H.; Fine, P.V.A. Phylogenetic beta diversity: Linking ecological and evolutionary processes across space in time. Ecol. Lett. 2008, 11, 1265–1277. [Google Scholar] [CrossRef]
  52. Callaway, R.M.; Brooker, R.W.; Choler, P.; Kikvidze, Z.; Lortie, C.J.; Michalet, R.; Paolini, L.; Pugnaire, F.I.; Newingham, B.; Aschehoug, E.T.; et al. Positive interactions among alpine plants increase with stress. Nature 2002, 417, 844–848. [Google Scholar] [CrossRef]
  53. Ohmann, J.L.; Spies, T.A. Regional gradient analysis and spatial pattern of woody plant communities of Oregon forest. Ecol. Monogr. 1998, 68, 151–182. [Google Scholar] [CrossRef]
Figure 1. A map depicting the location of Taihang Mountains in northern China (left panel) and an expanded map depicting elevation and sampling sites in the study area.
Diversity 15 00066 g001
Figure 2. Indices of plant diversity along the altitudinal gradient in the central Taihang Mountain region, northern China.
Diversity 15 00066 g002
Figure 3. PCA ordination showing the characteristics of altitudinal distribution of plants in the central Taihang Mountain region.
Diversity 15 00066 g003
Figure 4. CCA ordination showing the relationship between environmental factors and altitudinal plant patterns in the Taihang Mountain study area, northern China.
Diversity 15 00066 g004
Figure 5. Venn diagram showing the contributions of climatic and non-climatic factors to plant altitudinal distribution in the central Taihang Mountain region, northern China.
Diversity 15 00066 g005
Table 1. Descriptive statistics of climatic and non-climatic factors along the vertical gradient of Taihang Mountain study area in northern China.
FactorsMinMaxMeanStandard DeviationSkewnessKurtosis
Climatic factorsTemperature (°C)7.4011.568.911.260.43−0.47
Precipitation (mm)49154752915.68−1.010.86
Non-climatic factorsSlope (°)3.1343.8417.6512.510.880.46
Hfp 214328.567.310.50−0.80
Hii 142819.134.260.57−0.22
NPP (gC·m−2·a−1)139.93412.47339.0162.21−2.277.15
Population density (p/km2)025843.8893.221.881.97
pH 5.316.916.070.41−0.200.52
VWC (100%) 0.020.610.200.031.401.61
Notes: Climatic factors: temperature and precipitation; non-climatic factors: factors in addition to temperature and precipitation; temperature: annual mean temperature from 2008 to 2017; precipitation: annual precipitation from 2008 to 2017; Hfp: human footprint index; Hii: human influence index; p in p/km2 denotes persons; pH: soil pH; VWC%: soil water content to 20 cm depth.
Table 2. Monte Carlo significance test of the environmental factors and plant species altitudinal distribution.
FactorsCCA1CCA2r2Pr (>r)
Hfp−0.660.750.690.002 **
Temperature−0.880.480.660.001 ***
Hii−0.710.700.620.002 **
Population density−0.260.960.550.005 **
Precipitation0.82-0.580.520.004 **
VWC (%)0.99-0.070.400.033 *
NPP−0.64-0.770.280.09
pH0.99-0.170.020.85
Slope-0.74-0.670.010.90
Notes: *** represents the most significant level; ** represents an extremely significant level; * represents a significant level.
Disclaimer/Publisher’s Note: The statements, opinions and data contained in all publications are solely those of the individual author(s) and contributor(s) and not of MDPI and/or the editor(s). MDPI and/or the editor(s) disclaim responsibility for any injury to people or property resulting from any ideas, methods, instructions or products referred to in the content.

