Article

High-Throughput Sequencing Reveals the Effect of Feeding on Overwintering Hirudo nipponia

College of Life Sciences, China Jiliang University, Hangzhou 310018, China
*
Author to whom correspondence should be addressed.
Diversity 2022, 14(9), 768; https://doi.org/10.3390/d14090768
Submission received: 10 August 2022 / Revised: 12 September 2022 / Accepted: 14 September 2022 / Published: 16 September 2022

Abstract

:
To investigate the effect of feeding on hibernating Hirudo nipponia, metagenomic sequencing was performed on the microorganisms collected from the digestive tract of H. nipponia individuals that were fed (FW) or starving (SW) before hibernation. In addition, the salivary gland tissues were obtained from these individuals to conduct transcriptome sequencing. Results showed that feeding before hibernation increased the relative abundance of Bacteroidetes and Proteobacteria at the phylum level and that of Aeromonas, Mucinivorans, Bacteroides, and Desulfovibrio at the genus level. Functional prediction results indicated that feeding before hibernation not only improved metabolic capacity but also increased the susceptibility of H. nipponia to pathogens. Among the 133,082 unigenes obtained by transcriptome sequencing, a total of 2801 differentially expressed genes (DEGs) were found, of which 355 were up-regulated and 2446 were down-regulated; the expression patterns of 15 selected DEGs were validated by qRT-PCR. Results from the GO and KEGG enrichment analyses showed that a majority of these DEGs were involved in the signal transduction pathways. This study established a basis for H. nipponia breeding during hibernation through analyses of the abundance of microorganisms in the digestive tract and the gene expression pattern of salivary glands by high-throughput sequencing. The findings also revealed the effect of feeding on the expression of both gastrointestinal microorganisms and salivary gland genes of hibernating H. nipponia.

1. Introduction

Hirudo nipponia, belonging to the Hirudinidae family, prefers to live in dark and wet environments such as ponds, ditches, and swamps [1], and mainly feeds on the blood of livestock [2,3]. H. nipponia is one of the most recognized Chinese medicinal leeches and exhibits high anticoagulant activity [4]. The various anticoagulant-related active substances in the salivary gland of H. nipponia play a role in direct coagulation, analgesia, anti-inflammatory, blood flow promotion, inhibition of platelet aggregation, and degradation of exosomes during blood sucking [5]. Moreover, these active substances, such as hirudin [6,7], antistasin [8], hirustasin [9], and guamerin [10], as well as the newly found protein NPL-1 that has anticoagulant activity [11], further establish high medicinal value of H. nipponia. However, the wild resources of H. nipponia have been largely decreased due to deterioration of the environment and human activities, and artificial breeding of H. nipponia is a major way for maintaining the H. nipponia resources at present [12]. Therefore, researchers are actively exploring ways to increase the survival rate of leeches under artificial conditions [13].
Microorganisms inhabiting guts are closely related to food digestion and nutrition absorption, growth and development, and immune defense of animals [14,15], and can provide the best nutritional environment for the ingested food [16]. The gut microbes of blood-sucking leeches exhibit a strong symbiotic effect [17]; for example, H. nipponia gut microbes play an important role in the maintenance of vital signs during long-term starvation [12]. These microbes help in obtaining nutrients by digesting and absorbing the sucked blood in the absence of corresponding enzymes [18,19], assist the decomposition of red blood cells, accelerate the rate of hemolysis, and maintain the integrity of the red blood cell structure, which can resist the invasion of pathogens and show a direct link with the immune response in the gut [20,21,22]. However, gut microbes can also become opportunistic pathogens or be manipulated by invasive pathogens to enhance infection and be detrimental to the host [23,24,25,26].
Hibernation is an adaptive behavior that helps animals reduce their energy expenditure during winter when food is scarce [27]. H. nipponia stays in deep hibernation at 2–12 °C [28], during which the gut microbes spontaneously alter the community structure to maintain a mutually beneficial relationship with the host under long-term fasting and low-temperature conditions [29,30]. In addition to changing the structure of gut microbial community, hibernation also affects the metabolic activity of gut microbes [31,32].
Illumina high-throughput sequencing technology is characterized by “sequencing-by-synthesis” [33], which not only reduces costs but also ensures high sequencing accuracy, showing advantages over the first-generation sequencing technology [34]. High-throughput sequencing technology has been widely applied in genomics, transcriptomics, and metagenomics research in humans, animals, and plants, as well as in microorganisms [35]. Metagenomics refers to the systematic study of metagenomes using non-culturing techniques and methods, that is, to study the community structure and ecological functions of microorganisms by analyzing the genome collection of microorganisms in a specific environment [36]. As a high-throughput metagenomic technique, marker-gene amplicon analysis shows the advantages of rapidity, simplicity, and cheapness [37]. The gut microbiome is dominated by bacteria, and amplicon sequencing is generally performed using 16S rRNA fragments of the bacterial genome. Traditional assays based on 16S rRNA genes cannot be utilized to analyze the metabolic potential of microbial communities; therefore, it would be beneficial to predict the functional capabilities of microbial communities based on marker-gene data [38]. In addition to macro-genomes, recent high-throughput sequencing studies of leeches have included transcriptome sequencing [39]. Transcriptomics studies the overall pattern of gene transcription and regulation of transcriptional activities at the RNA level [35]; it also determines the transcriptional structure of genes and analyzes the molecular mechanism based on changes in transcriptional expression levels [40]. Transcriptome sequencing technology is developed on the basis of high-throughput sequencing technology [41] and is characterized by high throughput, high accuracy, and low cost [42], which provides a new method for the research on leeches.
In studies of overwintering H. nipponia, it was found that the mortality rate of H. nipponia individuals that are mortality fed before hibernation is higher than that of H. nipponia individuals fasted before hibernation. The effect of feeding before hibernation on H. nipponia remains elusive. The salivary glands, an important tissue in the digestive tract of H. nipponia, secrete a variety of active substances, including antibacterial substances in addition to anticoagulant substances. Therefore, in this study, metagenome and transcriptome sequencing were used to study the microbial composition of digestive tracts and gene expression patterns in the salivary gland of H. nipponia fed and fasted before hibernation, respectively. The results provide a theoretical basis for the scientific feeding of H. nipponia during hibernation.

2. Materials and Methods

2.1. H. nipponia Material and Culture Conditions

H. nipponia individuals used in this study were purchased from the Daweijia Liwen Aquaculture Base in Jinzhou District, Dalian City, Liaoning Province, China. One hundred of H. nipponia individuals in good conditions, with no scars on the surface and similar sizes, were selected. The initial weight of H. nipponia individuals was 0.46 ± 0.12 g. They were divided into two groups after feeding and cultured in two identical plastic boxes (248 × 180 × 150 mm). The light/dark cycle was 10/14 h for the first 30 d, and the leeches were kept in the dark for the following 30 d; the water was changed every other day. H. nipponia individuals were placed into an incubator (MODEL SPX-150B-Z, Boxun, Shanghai, China) for stepwise cooling treatment. One group was fed on fresh chicken blood poured into the sterilized casing every 7 d for the first 30 d (denoted as FW), and the other group was starved (denoted as SW). Three biological replicates were set for each treatment group for metagenome sequencing, and salivary gland tissues were collected from 10 randomly selected H. nipponia individuals in each group for transcriptome sequencing.
To mimic the hibernation environment of H. nipponia, the initial temperature of the incubator was set at 25 °C, decreased by 4 °C every 5 d, maintained at 9 °C for 5 d, and finally decreased to 6 °C. H. nipponia lost the ability to feed at 6 °C, stopped moving, curled up into a crescent shape, and remained in the hibernation state for 30 d.

2.2. Sample Collection

To obtain the microbes in the digestive tract, the surface of the H. nipponia body was cleaned using sterile water, and the whole body was immediately frozen in liquid nitrogen. After the body recovered to a soft state, the surface of the H. nipponia body was sterilized with 75% ethanol, and H. nipponia was dissected to obtain the contents of the digestive tract as well as intestinal tissues, which were placed into 1.5 mL sterilized Eppendorf (EP) tubes and snap-frozen in liquid nitrogen. H. nipponia individuals were dissected along the abdomen starting at the mouth. The salivary glands were cut as accurately as possible using ophthalmic scissors, placed in 1.5 mL EP tubes, and snap-frozen in liquid nitrogen. All samples were stored at −80 °C until further use.

2.3. DNA Extraction and Metagenomic Library Preparation

DNA was extracted using E.Z.N.A Mag-Bind Soil DNA Kit (M5635-02, Omega Bio-Tek, Norcross, GA, USA), DNA integrity was detected by 1.5% agarose gel electrophoresis, and DNA concentration was determined by a Qubit 3.0 fluorometer (Thermo Fisher Scientific, Carlsbad, CA, USA). Metagenome sequencing was performed by Sangon Bioengineering Co., Ltd. (Shanghai, China) based on an Illumina MiSeq platform. The primer pair 341F/805R (341F: 5′-CCTACGGGNGGCWGCAG-3′, 805R: 5′-GACTACHVGGGTATCTAATCC-3′) was designed according to the conserved sequence of the V3-V4 region of bacterial 16S rDNA. After the first round of PCR amplification, the Illumina bridge PCR compatible primers were introduced for the second round of amplification using 2× Hieff Robust PCR Master Mix (10105ES03, Yeasen Biotech Co., Ltd., Shanghai, China). The library size was detected by 2% agarose gel electrophoresis, and the concentration was determined using a Qubit 3.0 fluorometer (Thermo Fisher Scientific, Carlsbad, CA, USA).

2.4. Analysis of Metagenomic Data

The adaptors were removed from the raw paired-end reads, which were then filtered according to the following criteria: the bases with a quality score below 20 at the tail end were excised using PRINSEQ; if the average quality score in a 10 bp window was below 20, the back-end bases were truncated from the window. The N-containing reads and short sequences were removed, and the low-complexity sequences were also filtered out. Operational taxonomic unit (OTU) clustering and taxonomic identification were performed based on clean reads. Alpha-diversity analysis, beta-diversity analysis, and sequencing depth were investigated based on OTU clustering results, and community structure was examined at various taxonomic levels. Beta-diversity analysis based on Bray–Curtis distance, significance test, and functional prediction were performed, and independent t-test was conducted to analyze the functional differences of gut microorganisms by using SPSS 20.0 (IBM, Armonk, NY, USA). Beta-diversity patterns were visualized using the principal component analysis (PCA), principal co-ordinates analysis (PCoA) and nonmetric multidimensional scaling (NMDS).
We used PICRUSt (Phylogenetic Investigation of Communities by Reconstruction of Unobserved States) and BugBase to predict functional changes in leeches. The PICRUSt method was proposed to predict KEGG Ortholog (KO) using 16S rRNA gene sequence for microbial community function analysis, and 16S rRNA gene sequencing data were associated with microbial reference gene bank with known metabolic function. BugBase analyzes the phenotype of microbiome samples to help better understand the relationship between microorganisms and disease.

2.5. RNA Extraction and cDNA Library Preparation for Transcriptome Sequencing

Total RNA was extracted by FastPure Cell/Tissue Total RNA Isolation Kit (RC101, Vazyme Biotech Co., Ltd., Nanjing, China), and RNA concentration and integrity were determined by a Qubit 2.0 fluorometer (Thermo Fisher Scientific, Carlsbad, CA, USA) and agarose gel electrophoresis, respectively. cDNA library construction was performed by Sangon Bioengineering Co., Ltd. (Shanghai, China) and sequenced on an Illumina HiSeq 2500 platform.

2.6. Analysis of Transcriptome Data

Raw sequencing data were quality controlled using the FastQC online tool. Data processing was performed using Trimmomatic to filter the raw data for sequences with connectors and low-quality sequences in the raw data to obtain clean data. The clean data were De novo assembled into transcripts using Trinity and the transcripts obtained from Trinity assembly were de-redundant and the longest transcripts in each transcript cluster was taken as the unigene, which was used as the reference sequence for subsequent analysis. The transcripts were compared with the CDD (https://www.ncbi.nlm.nih.gov/cdd/ (accessed on 1 November 2021)), KOG (https://www.ncbi.nlm.nih.gov/COG/ (accessed on 1 November 2021)), COG (https://www.ncbi.nlm.nih.gov/COG/ (accessed on 1 November 2021)), NR (http://ncbi.nlm.nih.gov/ (accessed on 1 November 2021)), NT (http://ncbi.nlm.nih.gov/ (accessed on 1 November 2021)), PFAM (http://pfam.xfam.org/ (accessed on 1 November 2021)), SWISS-PROT (http://www.uniprot.org/ (accessed on 24 November 2021)), and TrEMBL (http://www.uniprot.org/ (accessed on 24 November 2021)) databases using NCBI BLAST+, and the functional annotation information was obtained.
The method took into account the effect of sequencing depth and gene length, as well as the effect of the sample on reads count, by computing TPM (transcripts per million) values to compare gene expression differences between samples. TMM was used to standardize read count data, followed by DEGseq for differential analysis. Significant differential genes were obtained using the following criteria: the TPM value ≥ 5 in at least one of the two samples; |log2(fold-change)| > 1; and Q-value < 0.05. Cluster Profiler was used for KEGG pathway and KOG classification enrichment analysis of differential genes. Q value < 0.05 indicates significant enrichment of this function.

2.7. qRT-PCR Analysis

Fifteen differentially expressed genes (DEGs) were selected from cAMP signaling pathway and cGMP-PKG signaling pathway for qRT-PCR analysis, using β-actin as an internal reference gene. Specific primers were designed according to the cDNA sequences using Clone Manager software (Table S1). After extracting total RNA from the same sample for transcriptome sequencing, first-strand cDNA was synthesized using the HiScript III RT SuperMix for qPCR kit (R323, Vazyme Biotech Co., Ltd., Nanjing, China), which completely removes residual genomic DNA from RNA templates. Subsequently, the qPCR system was configured according to the instructions of the PerfectStartTM Green qPCR SuperMix kit (AQ601, TransGen Biotech Co., Ltd., Beijing, China), and qRT-PCR was performed on an ABI Prism7500 fluorescence qPCR instrument. The reaction volume was 10 μL, including 3.4 μL of ddH2O, 0.3 μL of each primer, 5 μL of 2× PerfectStart Green qPCR SuperMix, and 1 μL of cDNA template (5 ng. μL−1). The reaction was carried out according to the two-step qPCR method: pre-denaturation at 95 °C for 30 s; and 40 cycles of denaturation at 95 °C for 5 s, annealing at 60 °C for 34 s.

3. Results

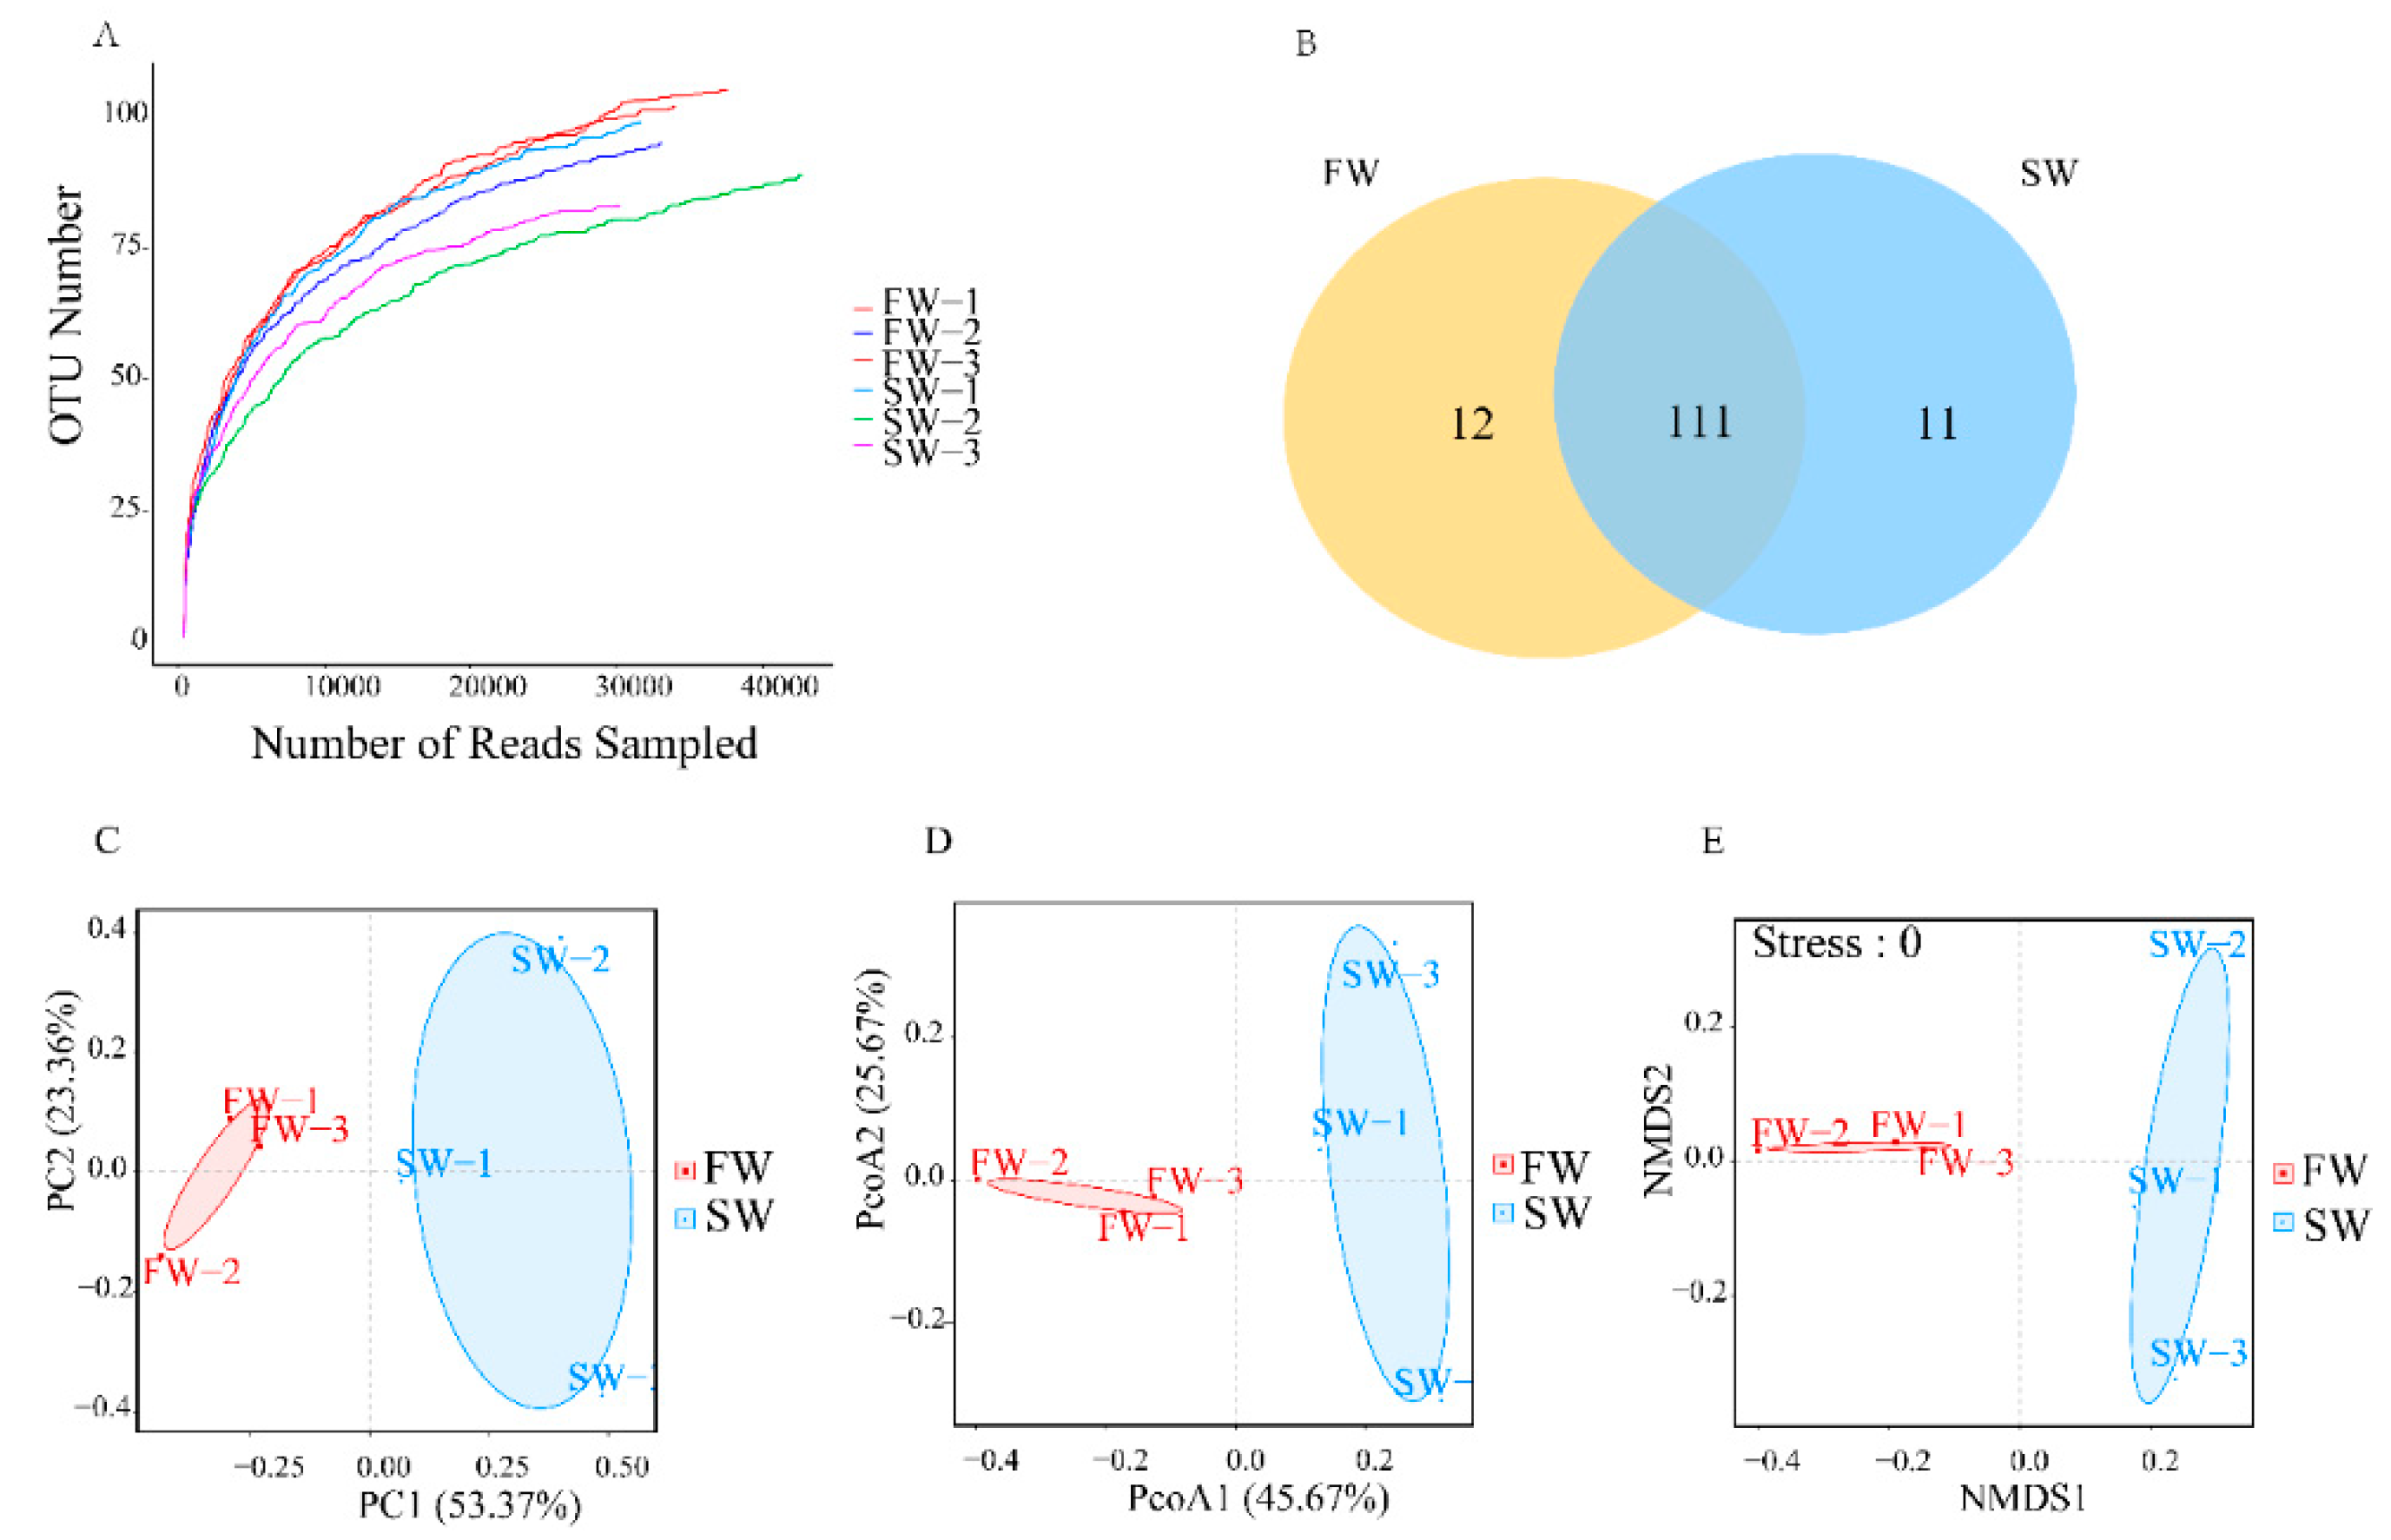
3.1. Microbial Diversity in the Digestive Tracts of H. nipponia

A total of 265,253 raw reads were obtained from six samples, and 263,306 clean reads were obtained after quality control. Clustering analysis yielded 134 OTUs, with a coverage of >99.9% for both FW and SW groups (Table 1). Results of alpha-diversity analysis showed that the Shannon, Chao1, and Ace indices of the FW group were all higher than those of the SW group (Table 1), indicating higher microbial richness of the FW group compared with the SW group. A clear distance between the FW and SW groups was observed in both PCA (Figure 1C) and PCoA (Figure 1D) at the OTU level, suggesting the microbial community structures were different between these two groups. Moreover, the NMDS analysis at the OTU level also indicated differences in the non-linear structure of microbial communities between the two groups, with a stress value of <0.05 (Figure 1E). The results of Venn diagrams showed that the total number of OTUs shared between these two groups was 111, with 12 and 11 OTUs specific to the FW and SW groups, respectively (Figure 1B).

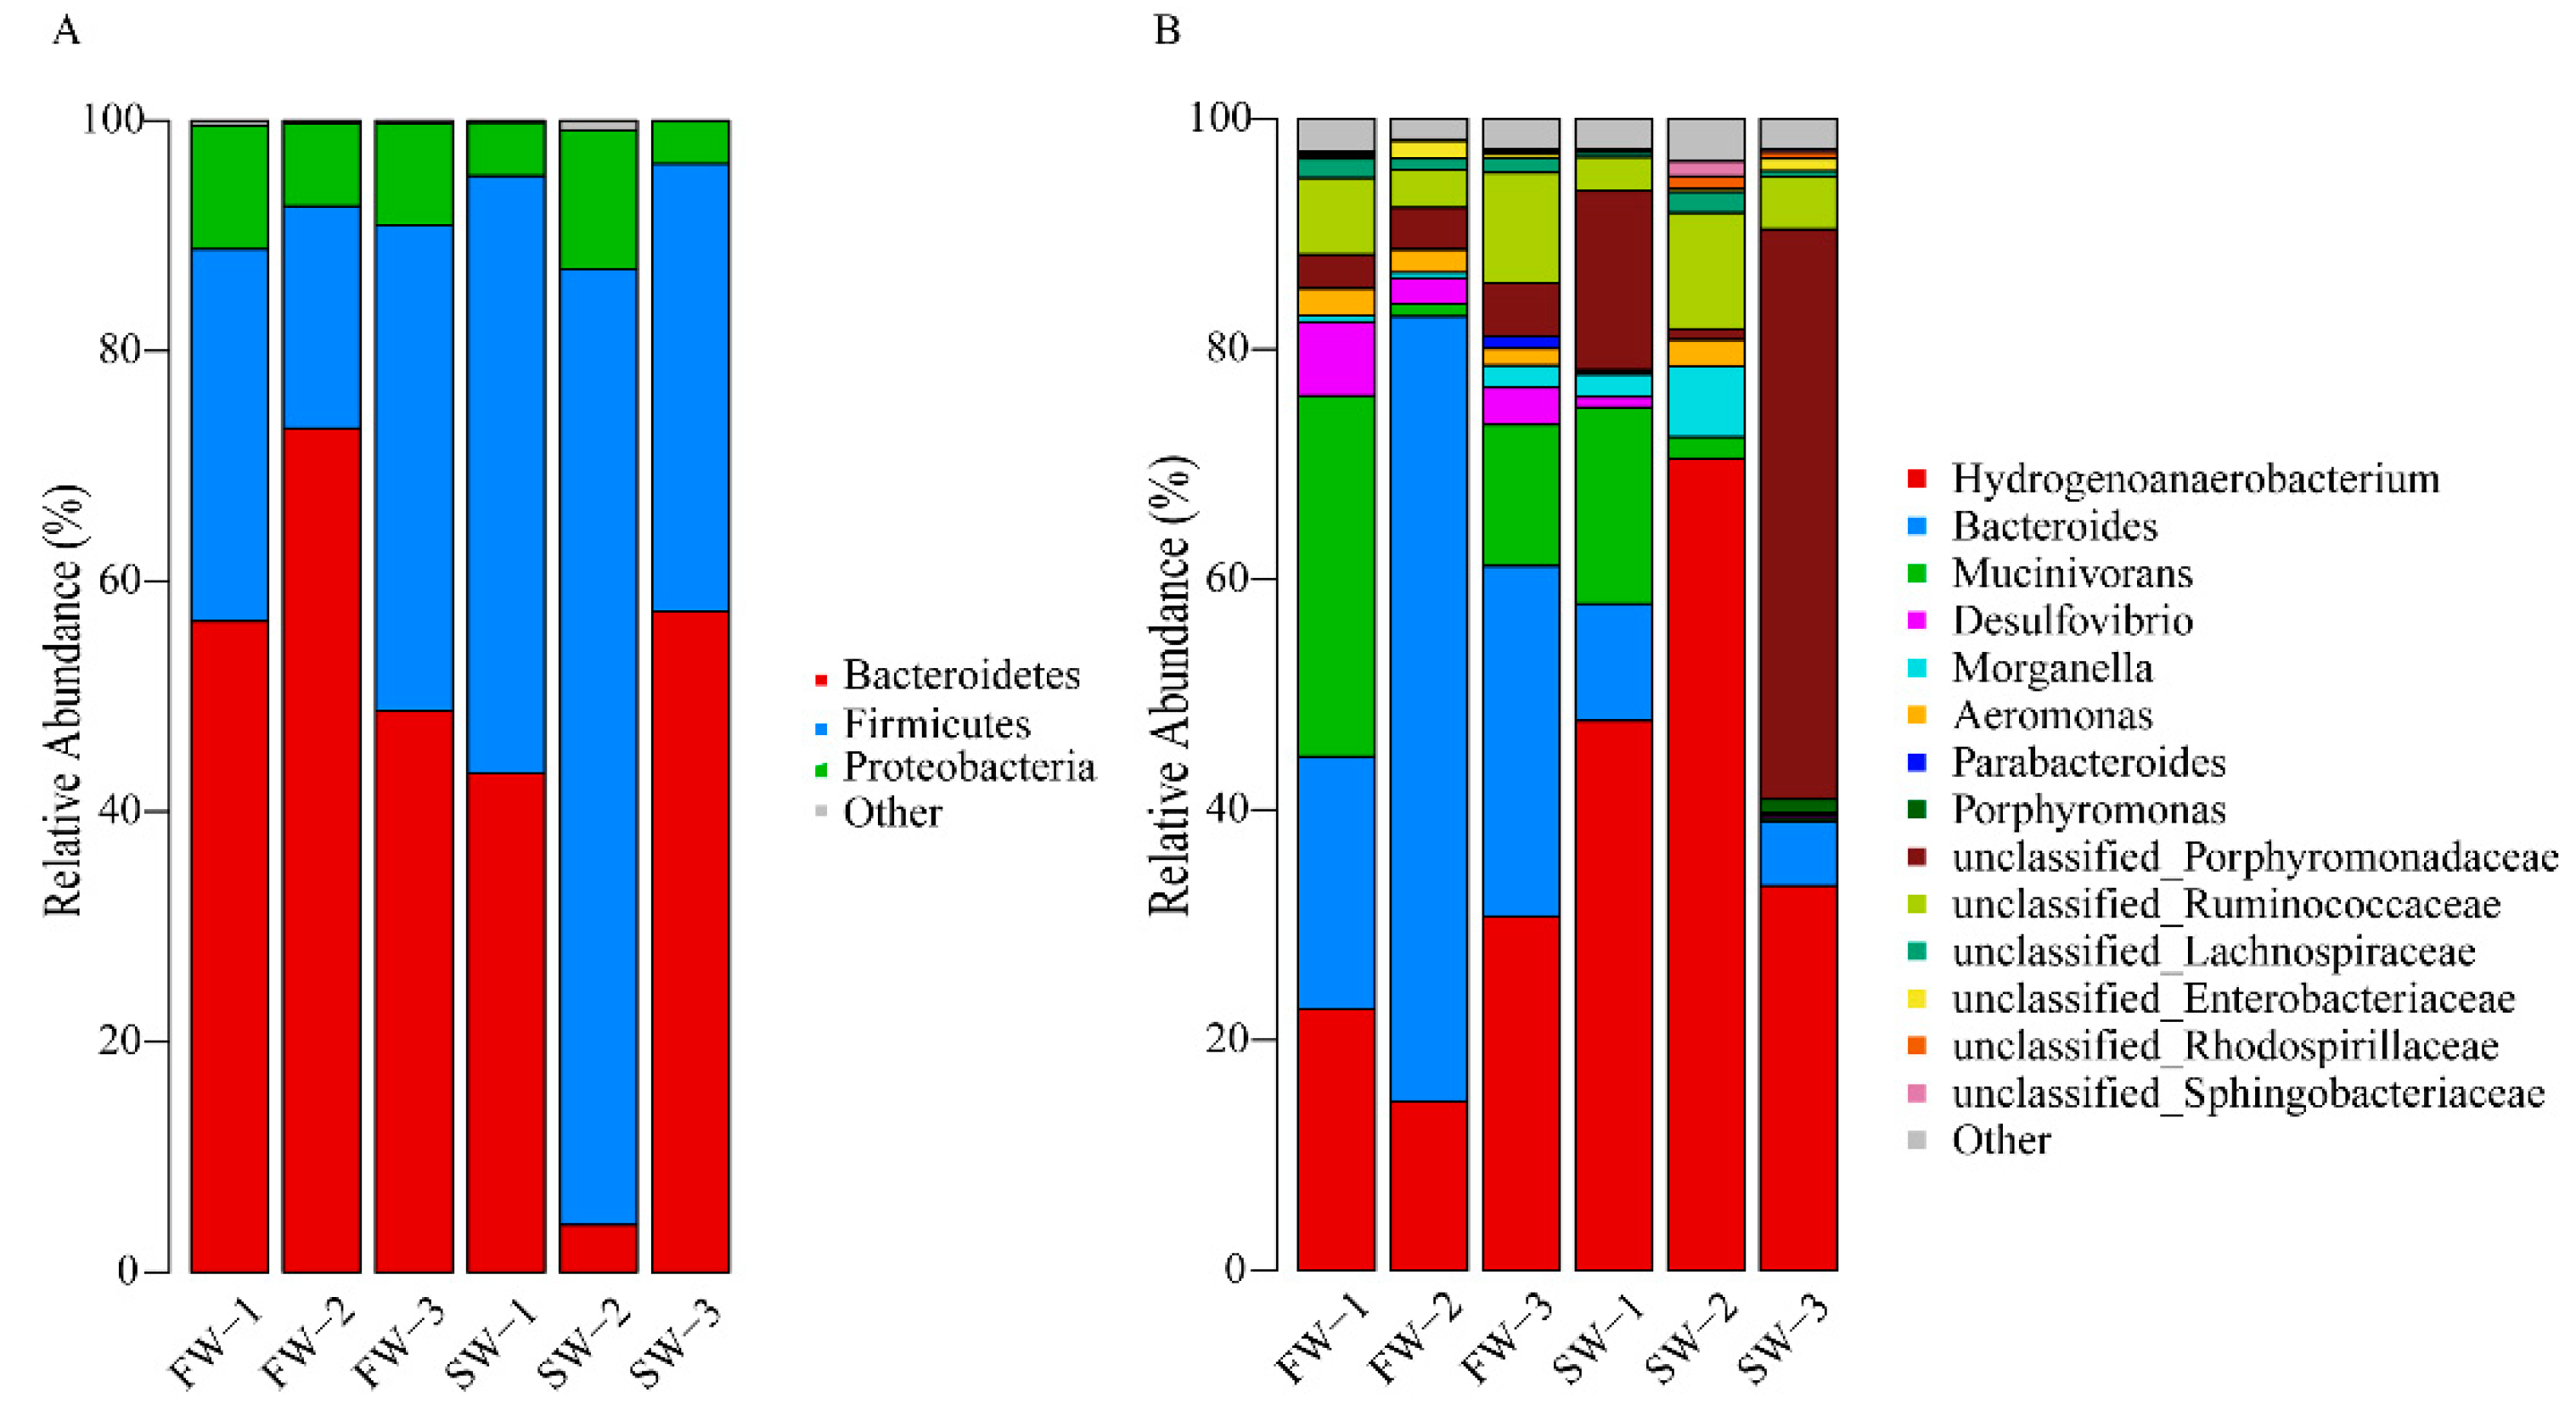
3.2. Changes in Microbial Abundance in the Digestive Tract of H. nipponia

Figure 2 shows that Bacteroidetes, Firmicutes, and Proteobacteria were dominant phyla in the digestive tract of H. nipponia from both the FW and SW groups, accounting for more than 99% of the total microbes. The relative abundance of Bacteroidetes and Proteobacteria was higher in the FW group compared with the SW group, while that of Firmicutes was lower. At the genus level, the top three dominant genera in the digestive tract of H. nipponia were different between the two groups, with an order from high to low abundance being Bacteroides, Hydrogenoanaerobacterium, and Mucinivorans in the FW group, and that being Hydrogenoanaerobacterium, unclassified_Porphyromonadaceae, and unclassified_Ruminococcaceae in the SW group. In addition, the relative abundance of Aeromonas, Mucinivorans, Bacteroides, Desulfovibrio, and unclassified_Ruminococcaceae was higher in the FW group than in the SW group (Table 2).

3.3. Functional Prediction of Leeches

Based on the metagenome from our 16S rRNA sequencing results, PICRUSt and BugBase were employed to predict the metabolic function of microbes in the digestive tract of H. nipponia and its relationship with diseases. KEGG enrichment analysis showed that compared with the SW group, the FW group exhibited significant enhanced activities in ‘amino acid metabolism’, ‘nucleotide metabolism’, ‘lipid metabolism’, and ‘infectious diseases’ categories (p < 0.05), while decreased activities in ‘membrane transport’, ‘cellular processes and signaling’, and ‘cell motility’ (Table 3). In addition, according to the BugBase analysis, the abundance of microbes related to ‘potentially pathogenic’ was higher in the FW group relative to the SW group (Figure 3A). These results suggest that feeding before hibernation not only altered the metabolic and cellular activities of H. nipponia during hibernation but also played an important role in the immune system and pathogen invasion activities.

3.4. Identification of Differentially Expressed Genes (DEGs)

Transcriptome sequencing was performed on the salivary gland of H. nipponia from both the FW and SW groups, and 59,119,968 and 4,541,8088 raw reads were obtained, respectively. The proportion of reads with Q20 bases yielded from both groups exceeded 96.99%. After quality control and filtering, a total of 57,361,528 and 43,641,780 clean reads were obtained, respectively (Table S2). These clean reads yielded 133,082 unigenes, with N50 and N90 sizes of 983 bp and 245 bp, respectively, and an average length of 612.99 bp (Table S3). All unigenes were annotated (Table S4) by blasting against the GO, KEGG, and NR databases. A total of 2801 DEGs were identified between the two groups, of which 355 genes were up-regulated and 2446 genes were down-regulated (Figure S1).

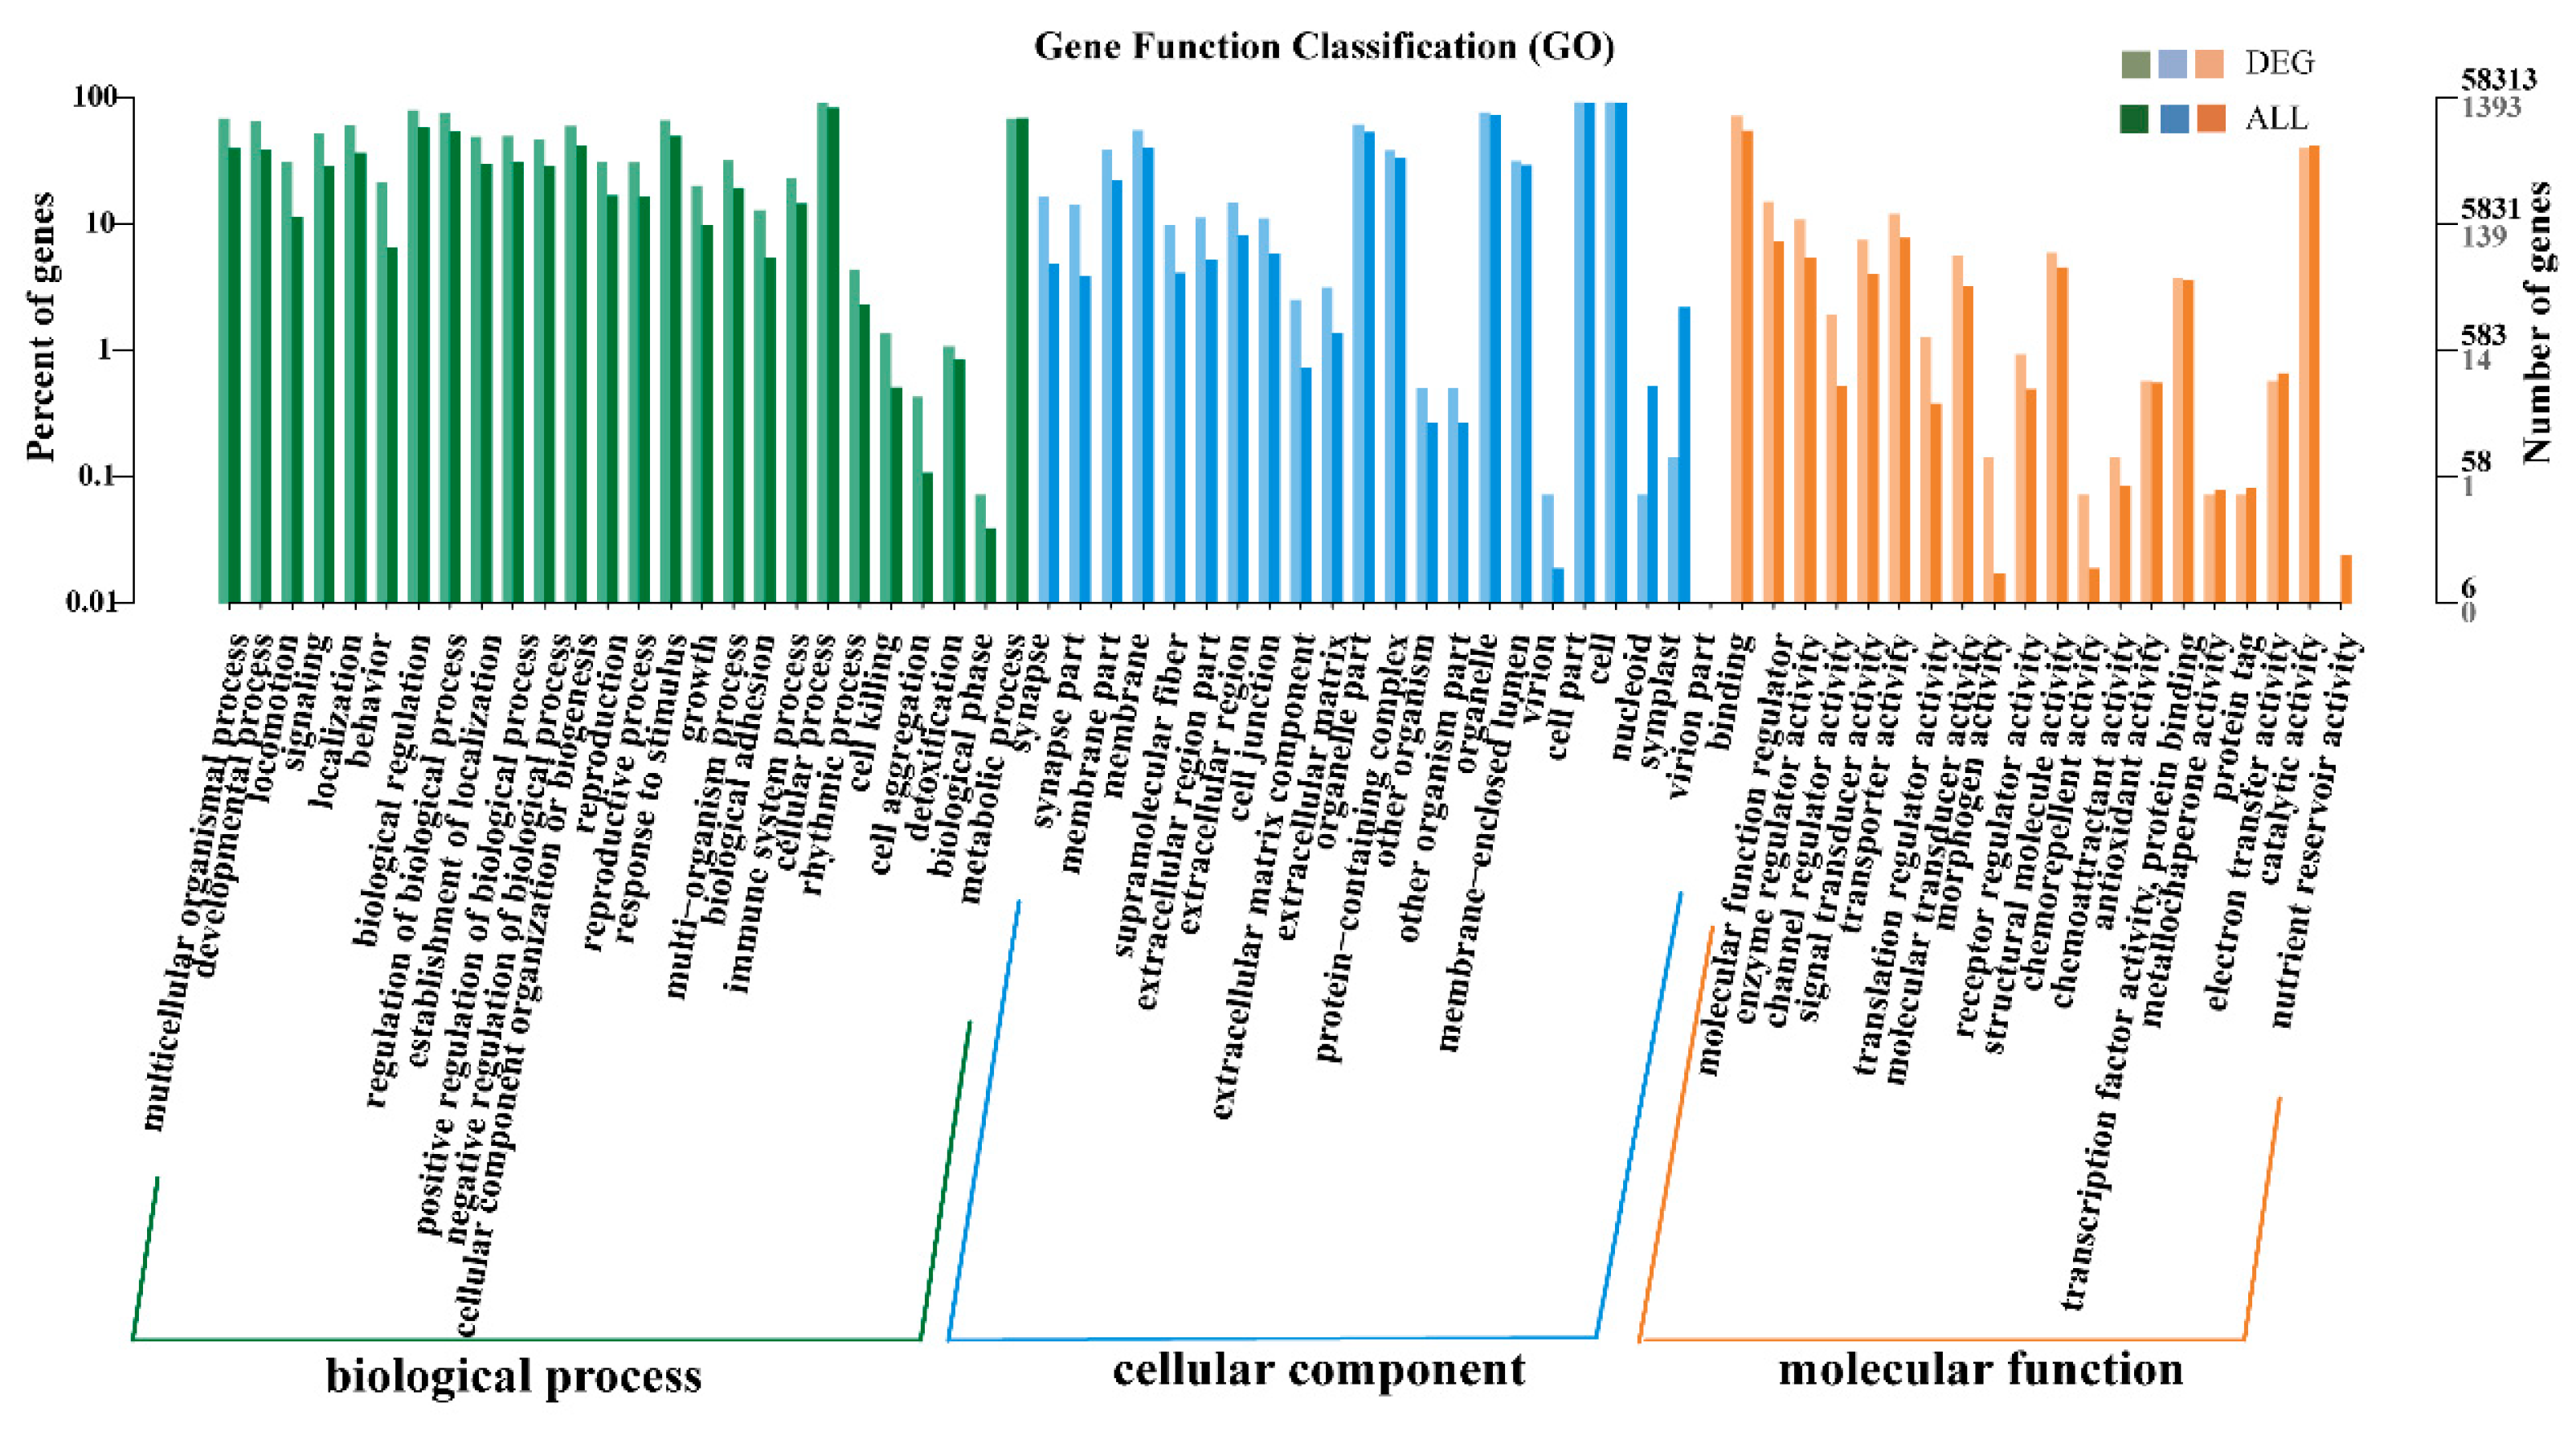
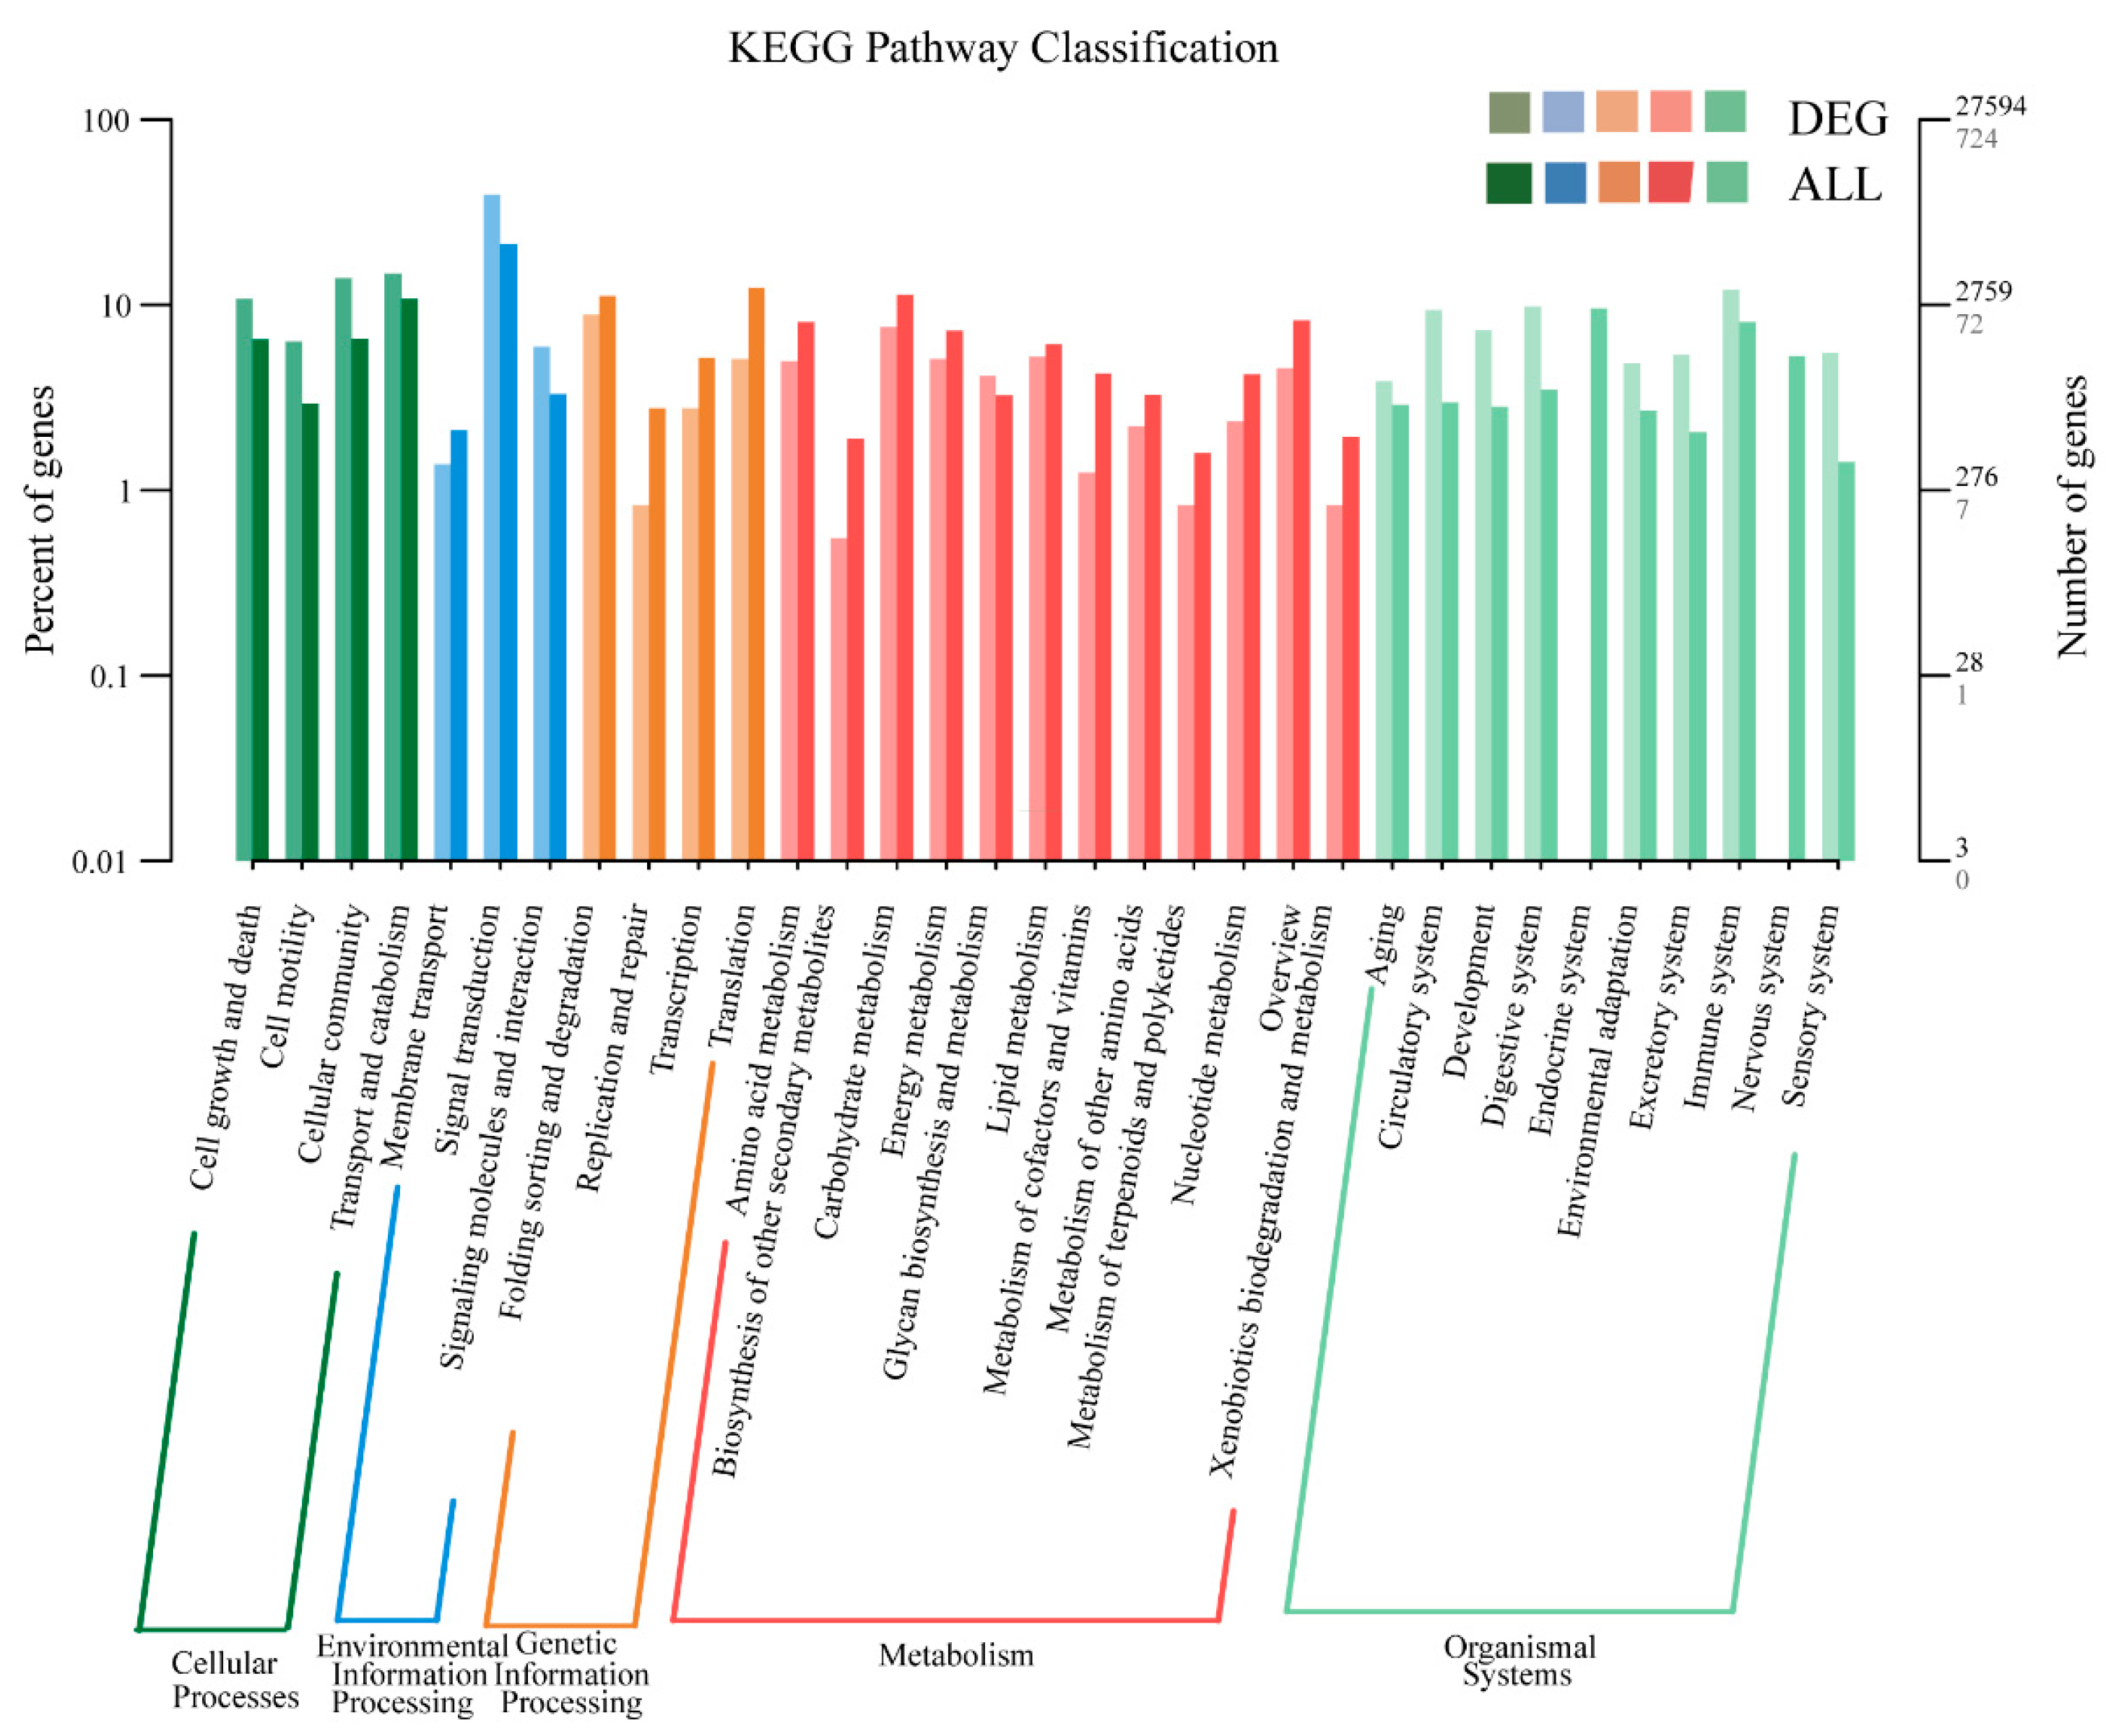
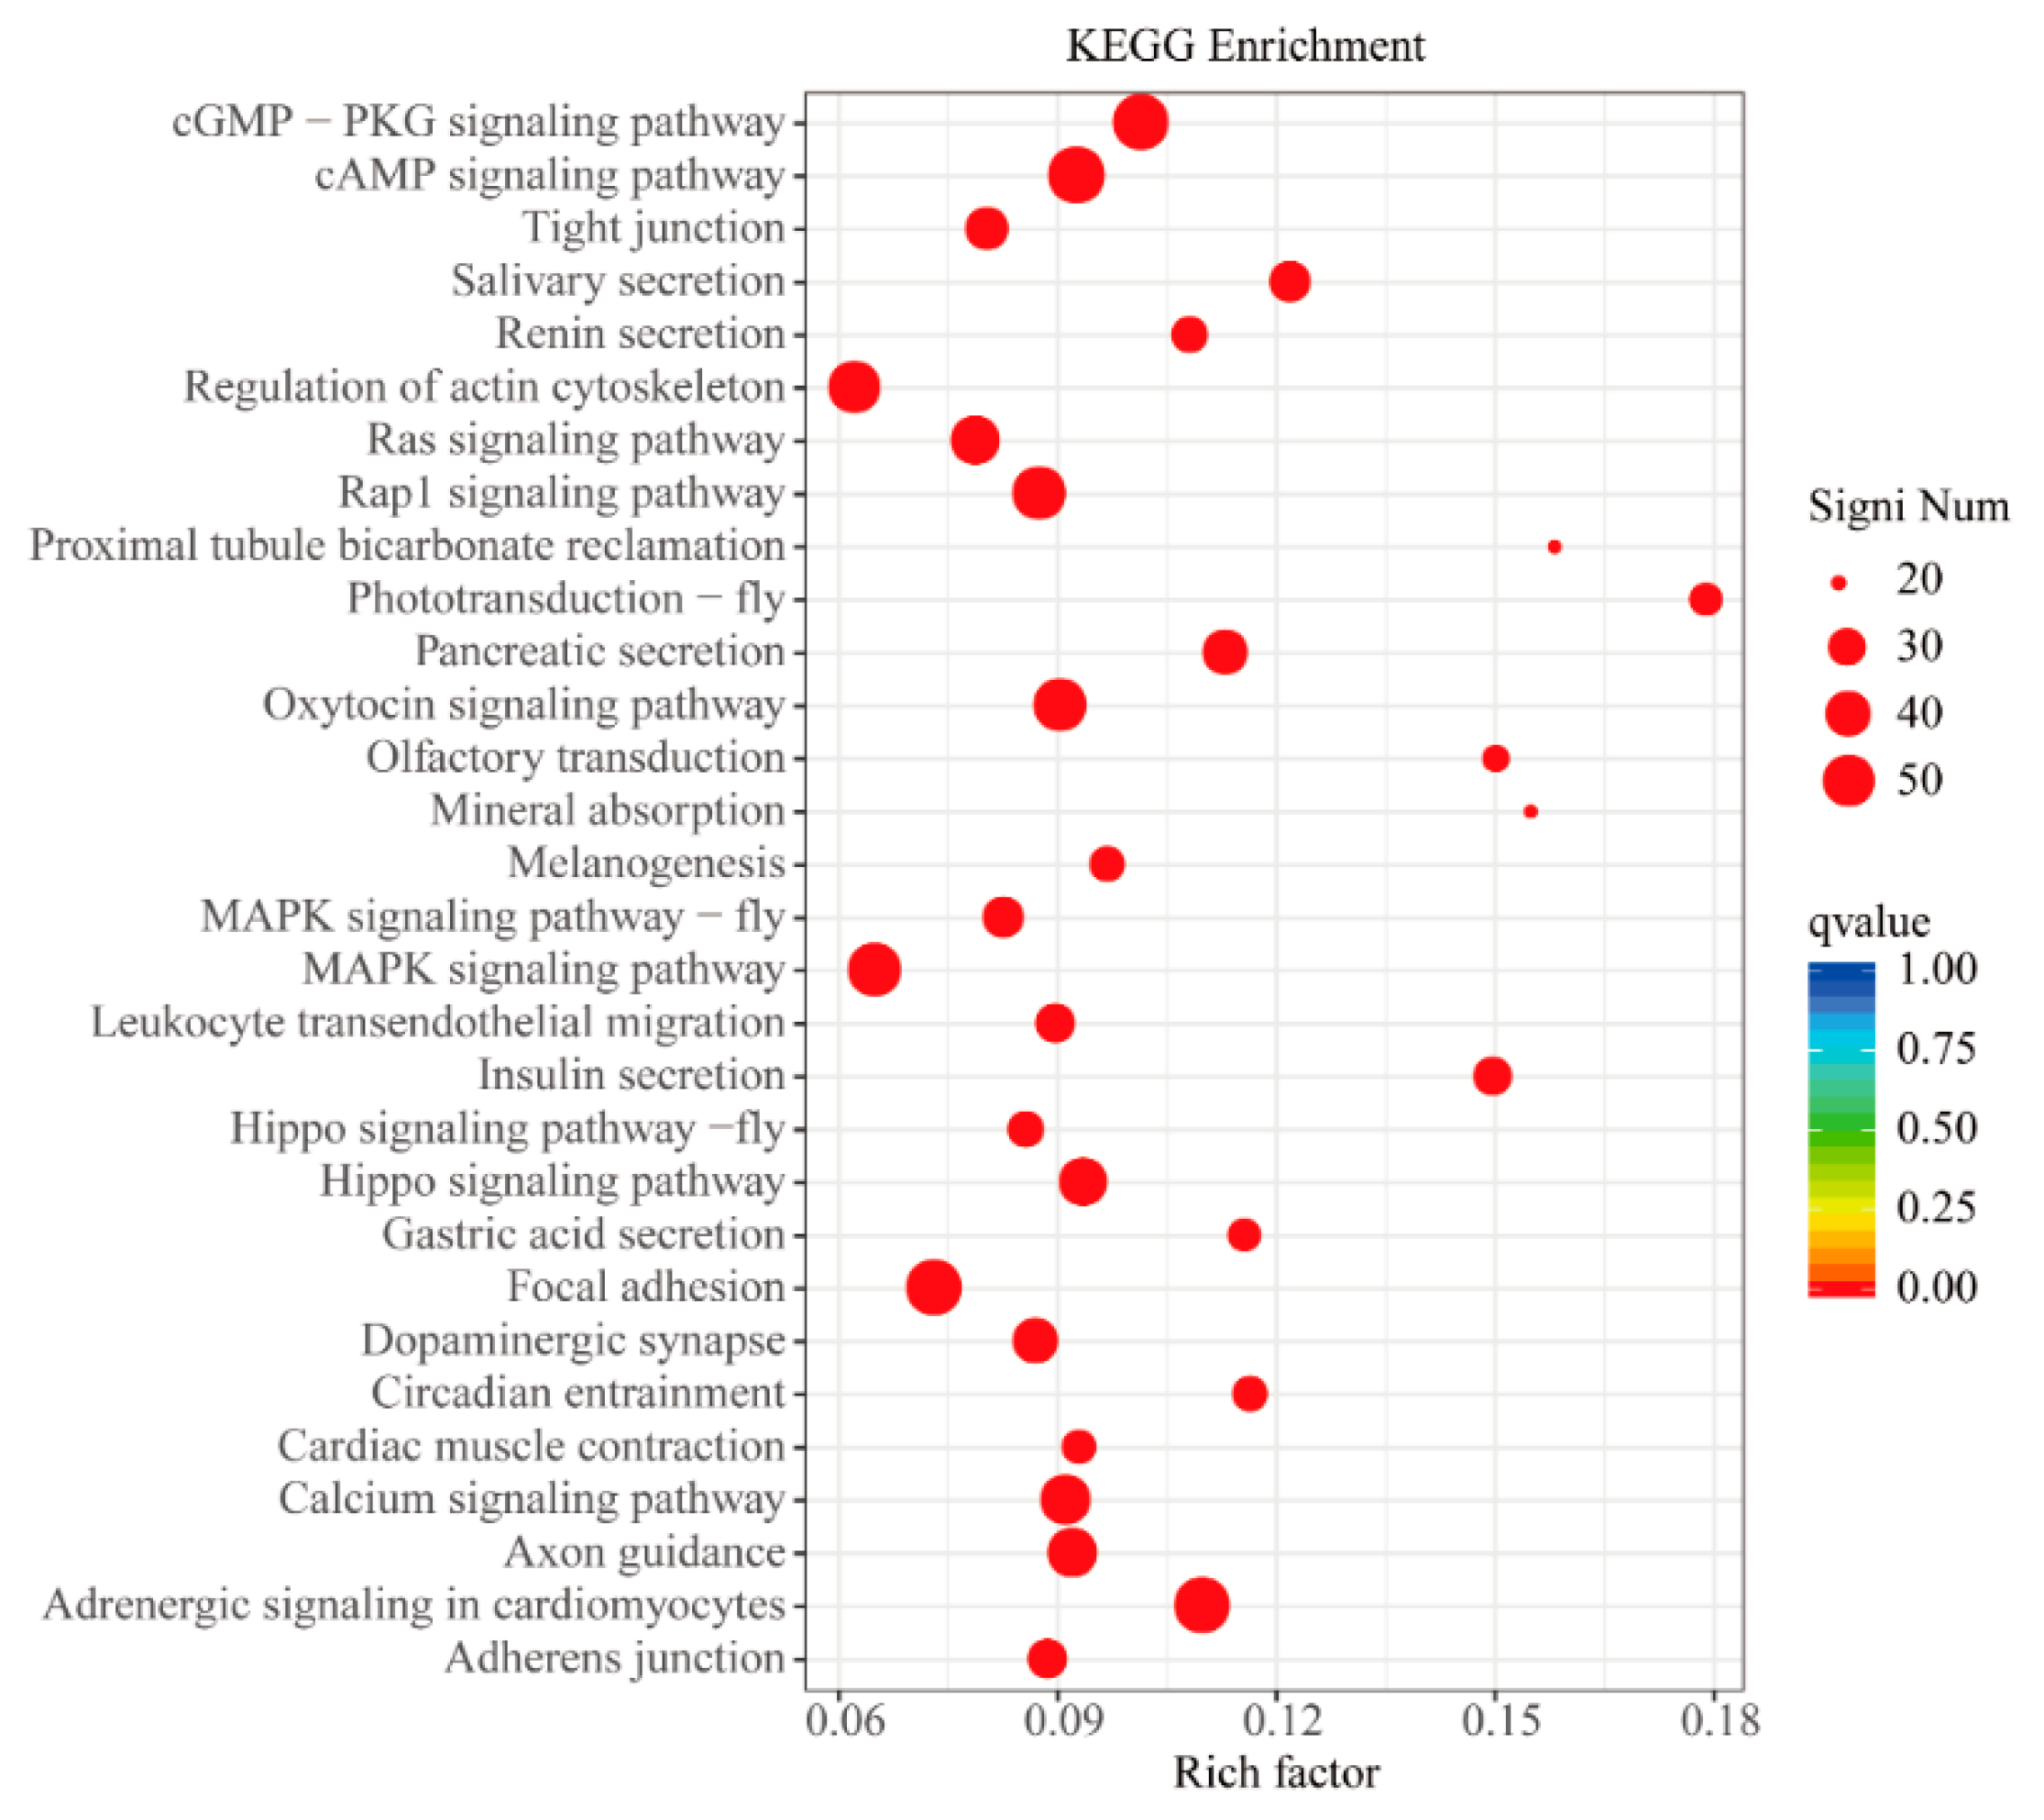
3.5. GO and KEGG Enrichment Analyses of DEGs

GO clustering analysis was performed on the DEGs identified between the two groups. A total of 1393 DEGs were annotated to 68 GO groups, including 21 groups belonging to the molecular function (MF) category, 19 groups belonging to the cellular component (CC) category, and 26 groups belonging to the biological process (BP) category. Most of the DEGs in MF belonged to ‘binding’ (35.74%) and ‘catalytic activity’ (19.89%); most DEGs in CC were assigned to ‘cell part’ (45.98%) and ‘cell’ (45.98%); and in BP, ‘cellular process’ (45.56%) was the most abundant subgroup, followed by ‘biological regulation’ (39.66%) (Figure 4).
A total of 724 DEGs were classified into 33 categories of metabolic pathways, including ‘signal transduction’, ‘endocrine system’, and ‘transport and catabolism’ (Figure 5), and most of these DEGs were down-regulated (Table S5). Results from the hypergeometric test on these pathways showed that the 724 DEGs were significantly enriched in 97 metabolic pathways, including cAMP signaling pathway (ko04024), cGMP-PKG signaling pathway (ko04022), and focal adhesion (ko04510) (Figure 6).

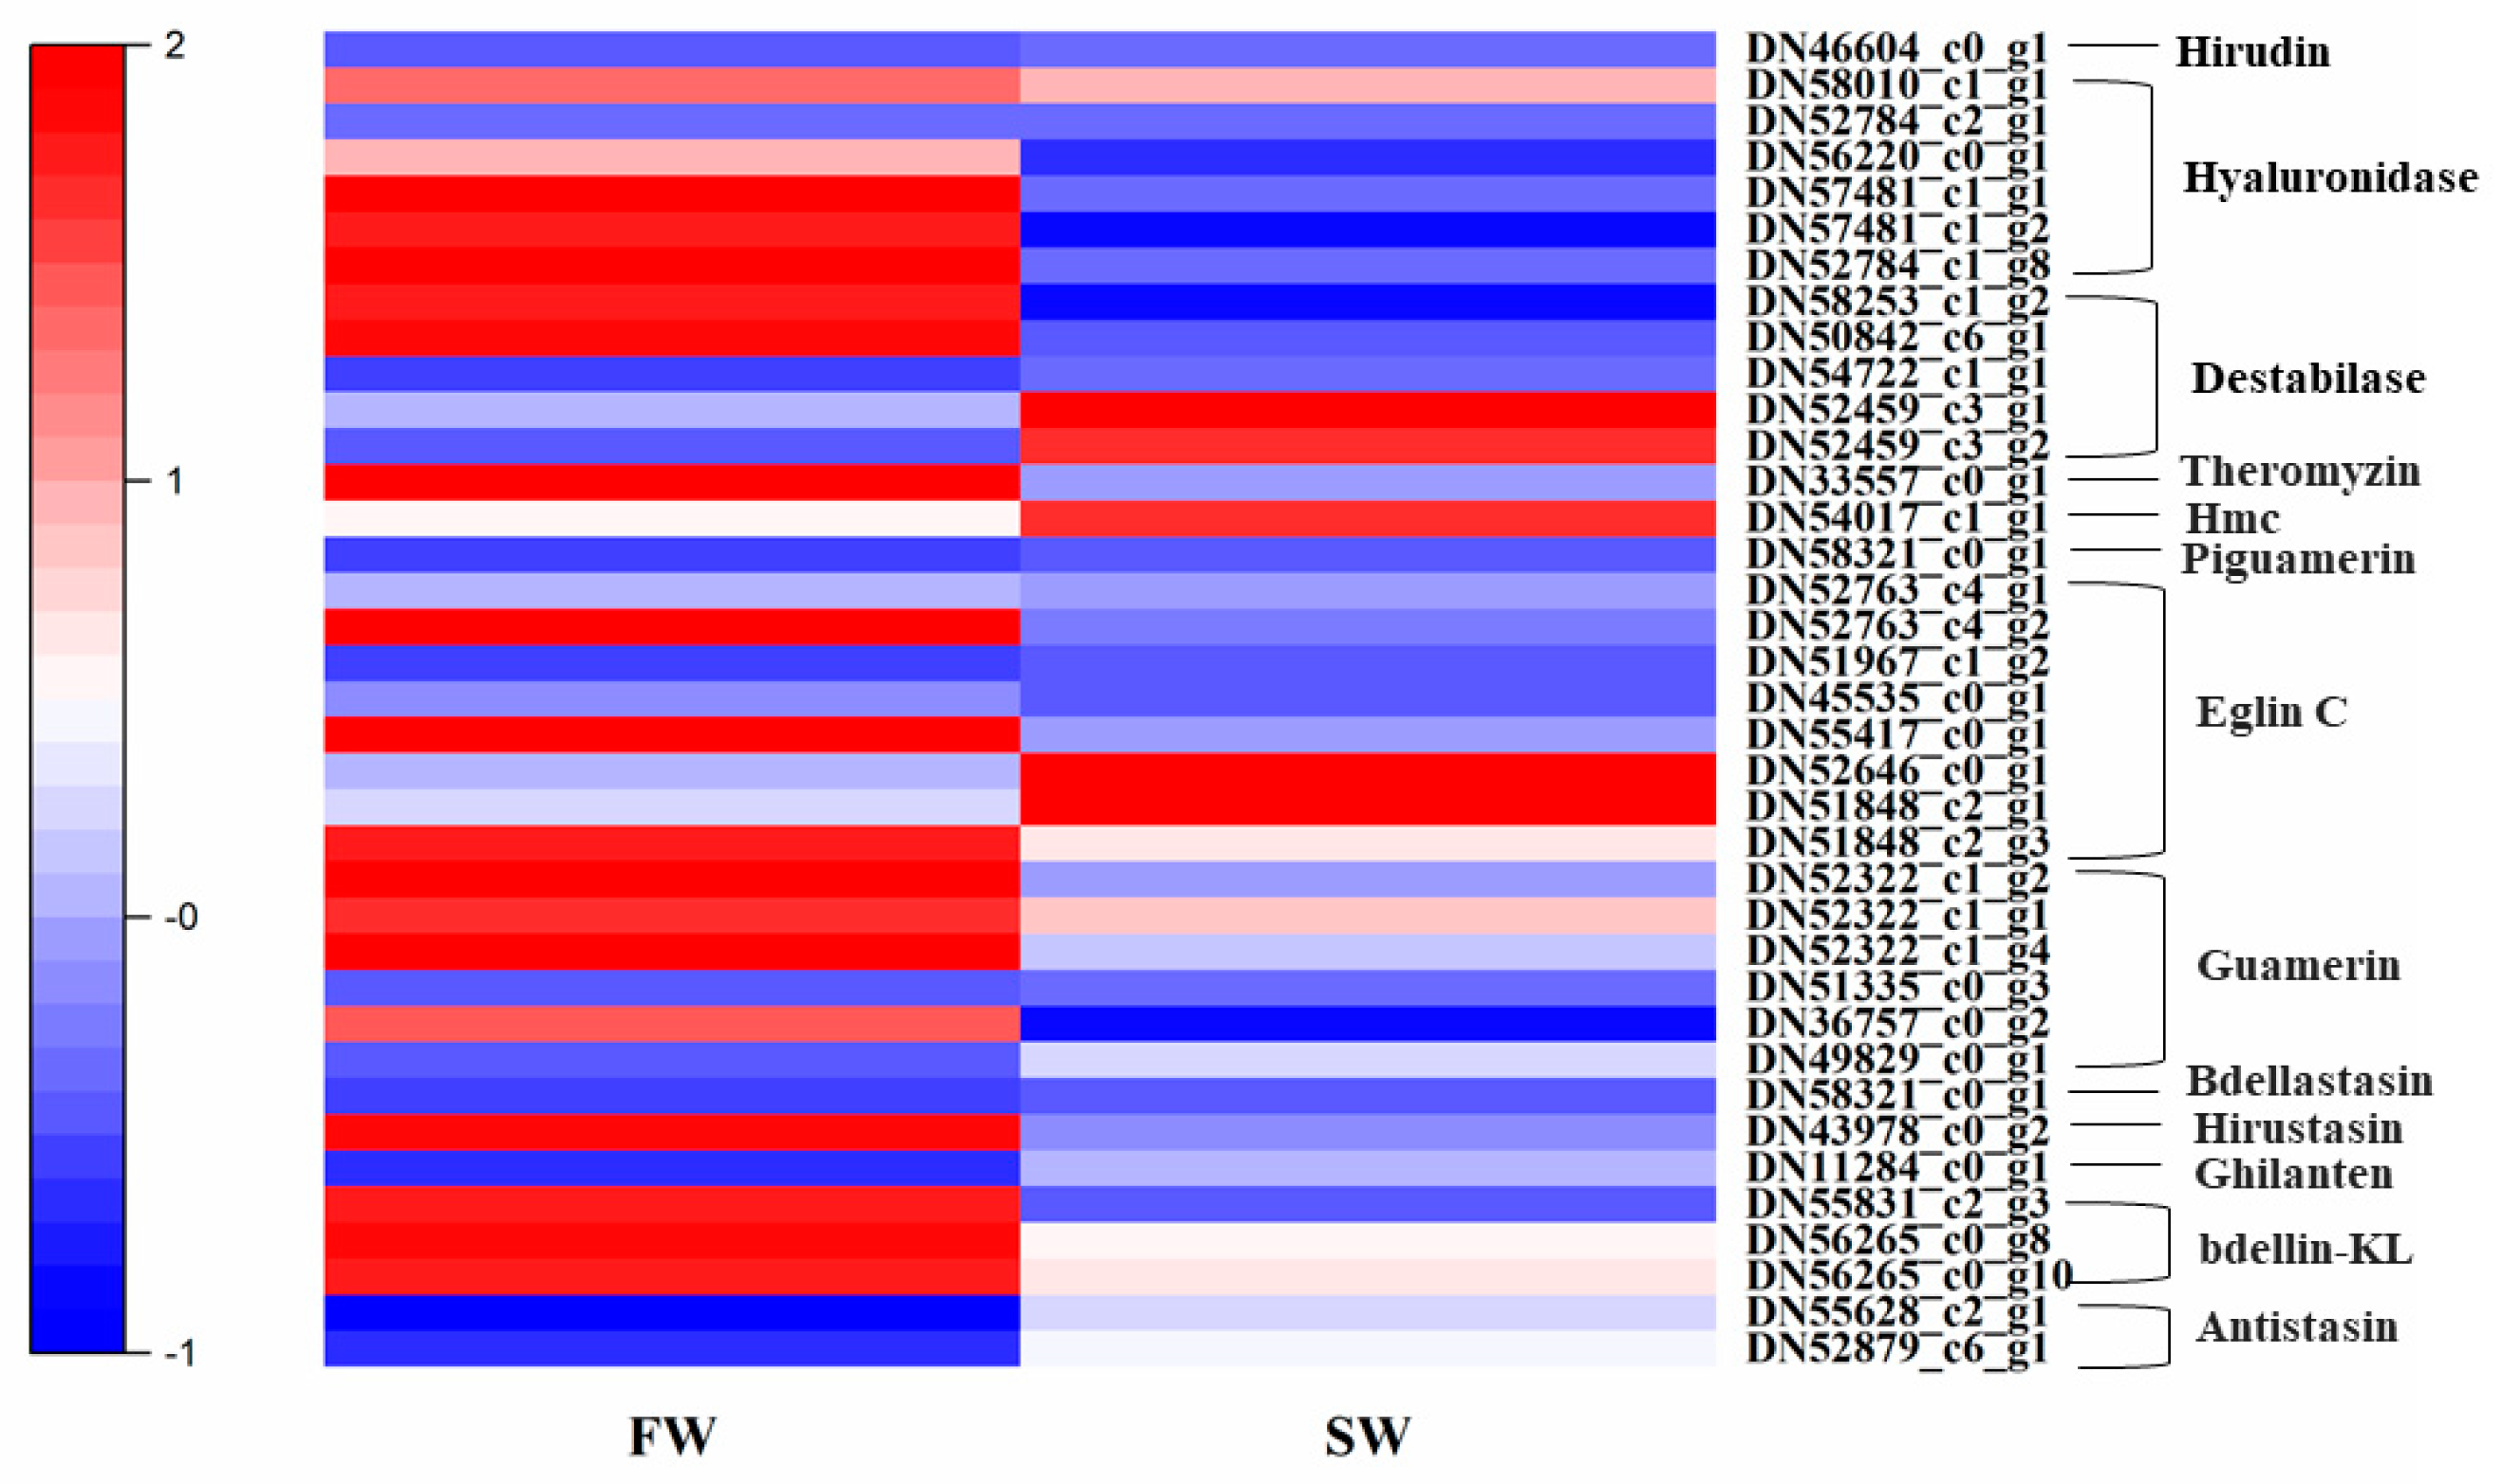
3.6. Expression Patterns of Genes Related to Anticoagulation and Antibacterial Activities

Anticoagulation-related genes were identified from the transcriptome data, including those coding for analgesic and anti-inflammatory components that can interfere with immune and inflammatory responses (e.g., antistasin, ghilanten, bdellin, eglin, guamerin, piguamerin, and hirustasin); those coding for extracellular matrix degradation components (e.g., hyaluronidase); those coding for fibrinogen inhibitor components (e.g., destabilase); and the gene coding for hirudin that can directly inhibit thrombin activity. In addition, other antibacterial-related genes were also identified, including those coding for Theromyzin and Hirudomacin (Hmc). Compared with the SW group, the expression levels of genes coding for bdellin-KL, guamerin, Theromyzin, destabilase, and hyaluronidase were higher in the FW group (Figure 7).

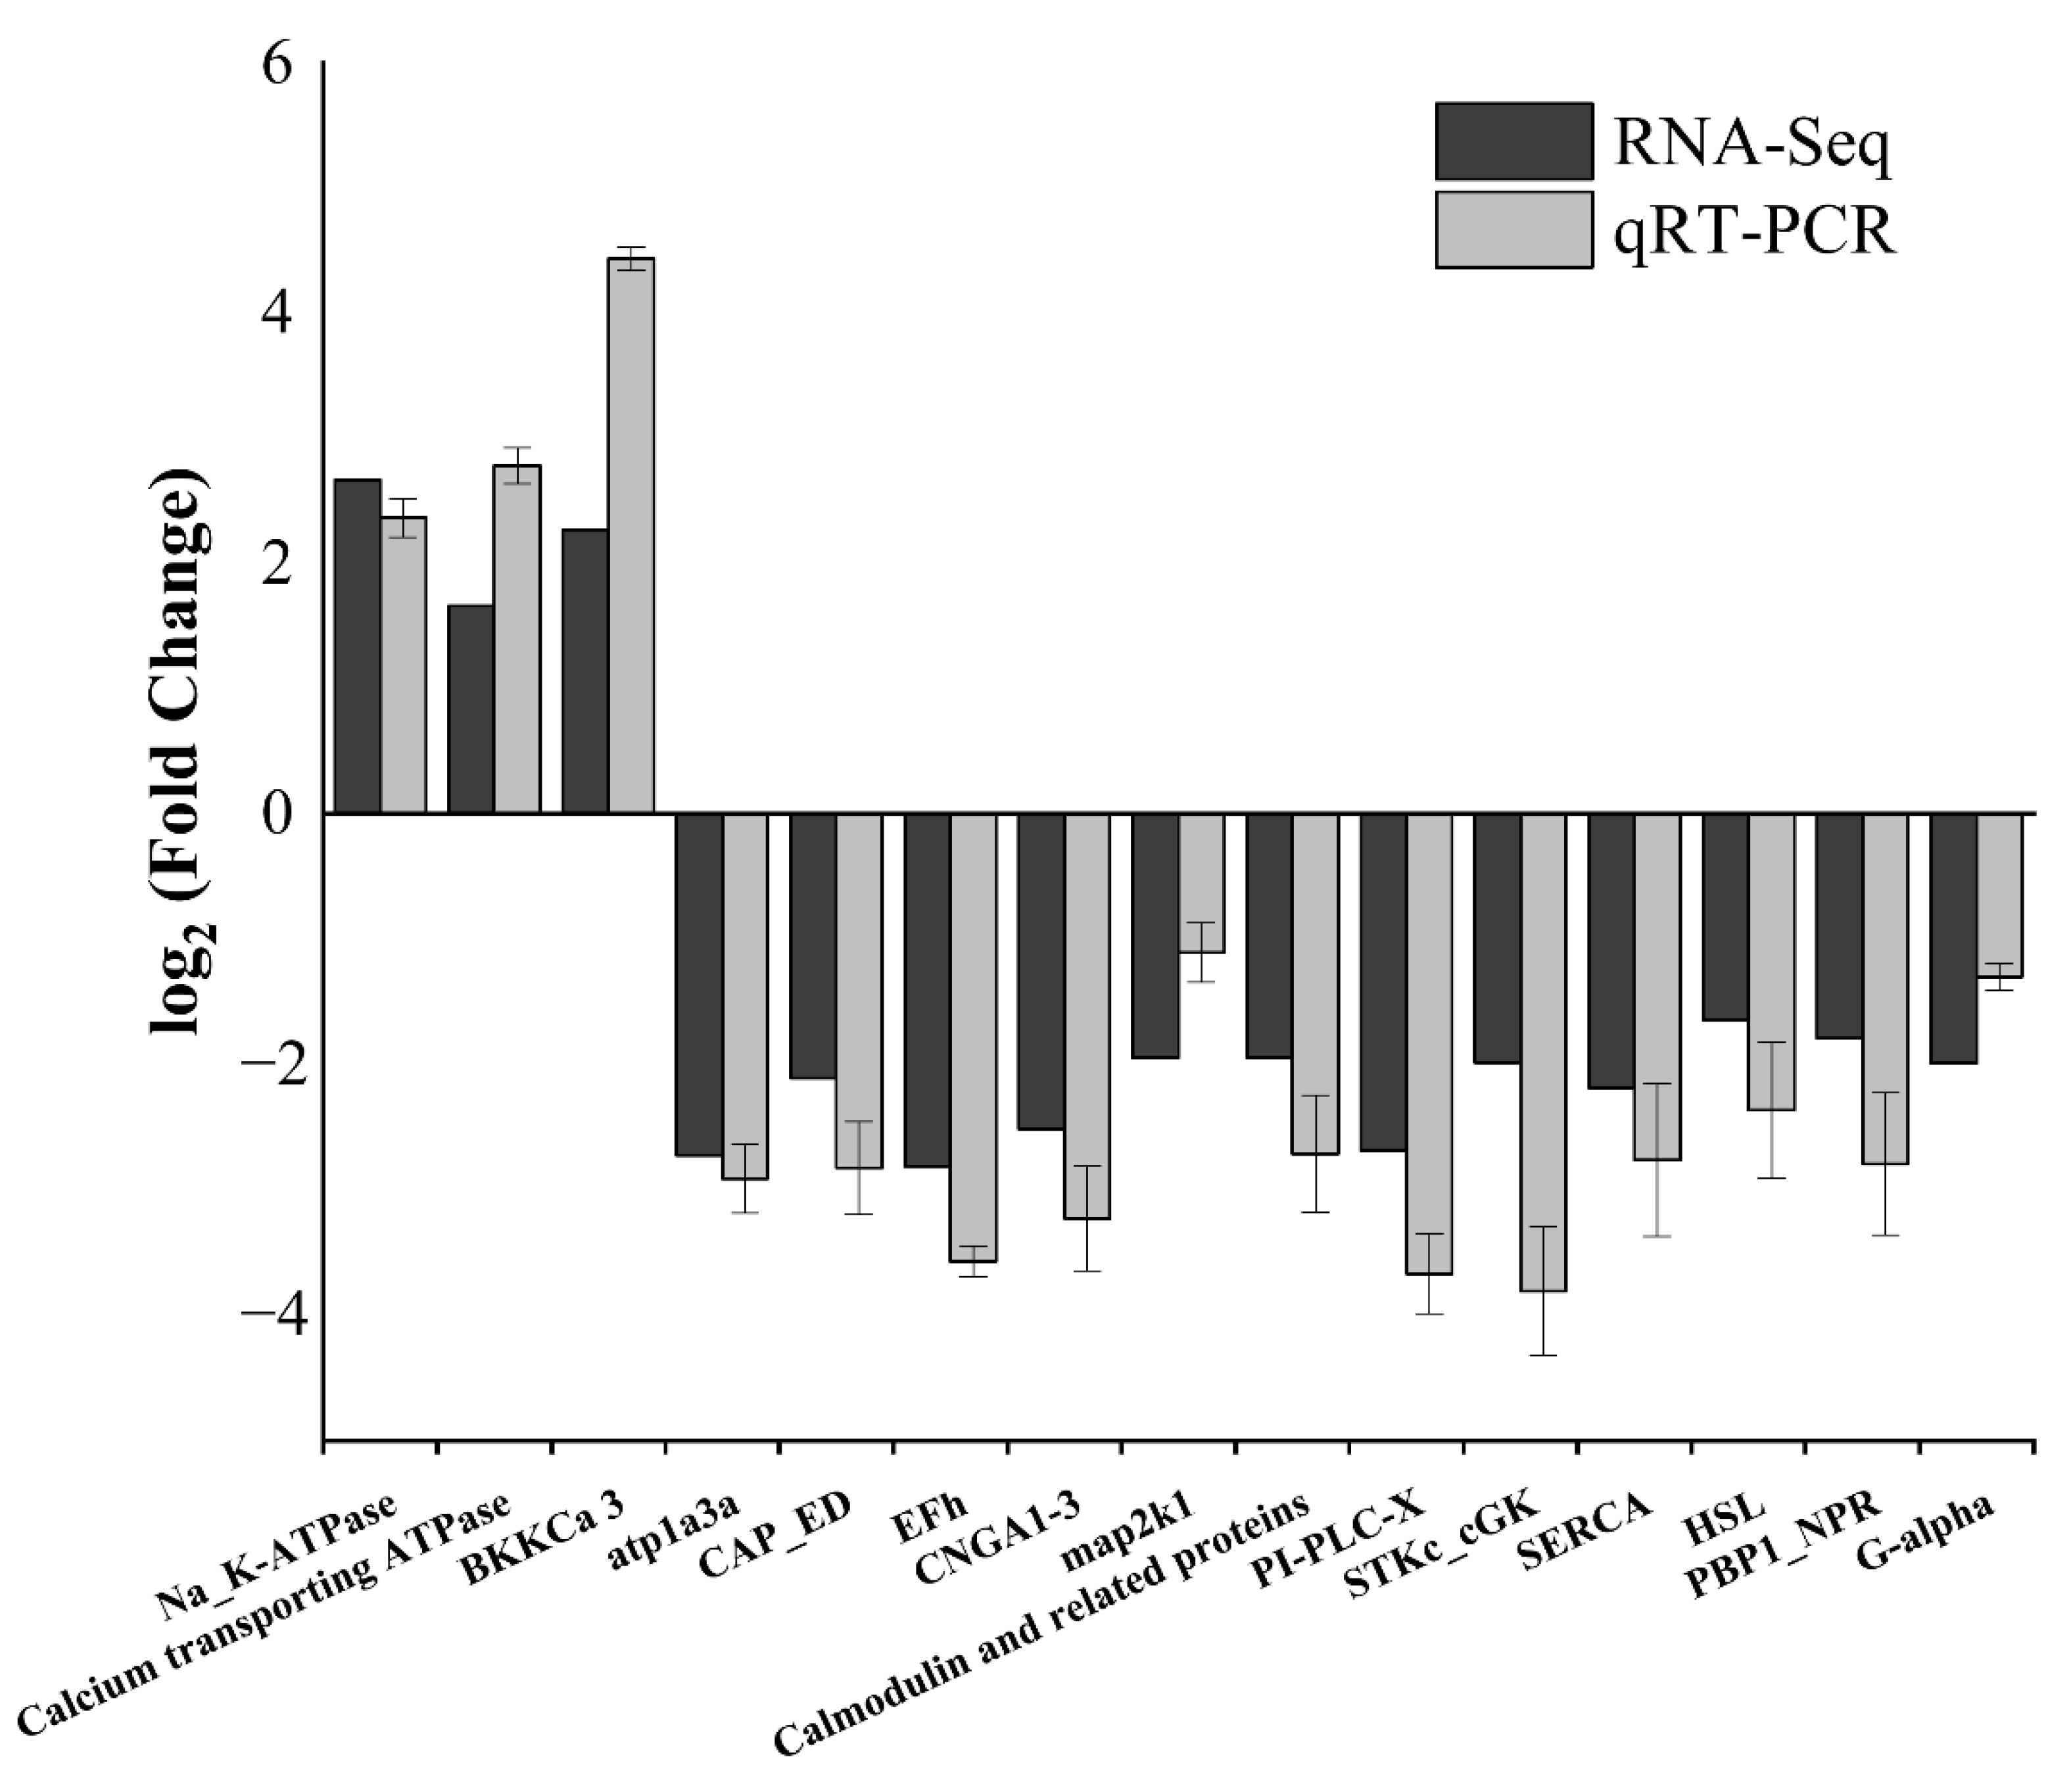
3.7. qRT-PCR Validation

To verify the accuracy and reliability of transcriptome sequencing, 15 DEGs were selected for qRT-PCR validation. The expression patterns of all the 15 DEGs obtained from qRT-PCR analysis were consistent with those from transcriptome sequencing in both the FW and SW groups (Figure 8), indicating that the transcriptome sequencing results are reliable.

4. Discussion

To ingest and digest the host’s blood, the salivary gland of H. nipponia, as part of the anterior segment of the digestive tract, can secrete more than 100 active substances [43,44], including many substances related to anticoagulation and antibacterial activities [41]. Microbes in the digestive tract aid in the digestion and absorption of sucked blood and the host immune response [15,18,21,22]. Metagenomic and transcriptome sequencing on the microorganisms in the digestive tract and salivary gland of H. nipponia were carried out in order to thoroughly explore the impact of feeding on overwintering H. nipponia. The results showed that feeding before hibernation altered the microbial community structure and increased the taxonomic richness in the digestive tract of H. nipponia (Table 1). Compared with the SW group, Bacteroidetes, Firmicutes, and Proteobacteria were the dominant phyla in the FW group, and the relative abundance of Bacteroidetes and Proteobacteria was higher. Bacteroidetes can promote carbohydrate fermentation and maintain the balance of gut microbiota [45]. In addition to participating in the metabolism of polysaccharides, bile acids, and steroids, Bacteroidetes also play a role in the metabolism of proteins and fats provided by the intestinal epidermis [46,47]. Proteobacteria are associated with the instability of gut microbiota [48] and are the main cause of the increase in the potential pathogenicity in leeches. The dominant phyla in the digestive tract of H. nipponia revealed in this study are consistent with the findings of Shi et al. [12,49], and similar to those found in grass carp [50] and Nile tilapia [51].
At the genus level, the relative abundance of Mucinivorans, Bacteroides, Desulfovibrio, Aeromonas, and unclassified_Ruminococcaceae was higher in the FW group relative to the SW group (Figure 2, Table 2). Bacteroide are widely distributed in humans, animals, and aquaculture environments. An increase in the abundance of Bacteroide indicates a pro-inflammatory response [52], which may also be one of the reasons for increased pathogenicity of leeches. Mucinivorans belonging to Rikenallaceae [16,53] is involved in anaerobic metabolism and utilizes carbohydrates as an energy source [54]. It metabolizes glucose, lactose, mannose, and melibiose [55], as well as mucus secreted by enterocytes of leeches, providing favorable habitats for the colonization of gut microbiota [56]. Desulfovibrio, a kind of sulfate-reducing bacteria (SRB), does not produce toxins [57], but generates a large amount of H2S in the process of reducing sulfate, which changes the environmental pH and inhibits the normal metabolism of aerobic bacteria [58]. It is associated with the occurrence and development of enteritis, intestinal cancer, and metabolic syndrome [59], and may be related to the antagonism between other microorganisms [49]. Aeromonas is a dominant genus in the gut of H. medicinalis [60,61], Hirudo verbana [16], and North American leech [62]. It is a Gram-negative facultative anaerobic bacterium, and Aeromonas species were reported as pathogens in most studies [63,64]. Aeromonas can secrete hemolysin, which can release glucose and potassium from erythrocytes, thereby enabling colloid osmotic lysis and hemoglobin release to achieve hemolysis [22,65] and helping blood digestion of H. nipponia. Ruminococcaceae can metabolize mucopolysaccharides and proteins [31,66], thereby assisting in digestion of food in the gut. The core genera in the digestive tract of H. nipponia revealed in this study are different from those found by Shi et al. [12,49], which is probably due to the different breeding and feeding conditions of H. nipponia.
Functional prediction of microbes in the digestive tract of H. nipponia based on PICRUSt analysis showed that the metabolic activities of amino acids, nucleotides, and glycans were significantly promoted in the FW group (Table 3). At the same time, the pathways associated with immune-related diseases were significantly increased. These results are consistent with those obtained from BugBase analysis in which increased pathogenicity was observed in the FW group (Figure 3). H. nipponia individuals fed before hibernation showed reduced immunity and were more susceptible to infection by pathogens, resulting in death during hibernation. The interactions between microbes altered with the changing microbial compositions, resulting in a change in the microbial functions in the digestive tract. We speculated that feeding before hibernation may potentially affect primary immune deficiencies and increase the risk of pathogen infection while altering the microbial community structure in the digestive tract of H. nipponia to improve intestinal absorption and metabolism.
Transcriptome analysis was performed on salivary glands of H. nipponia in both the FW and SW groups, and the obtained data help us understand the differential gene expression in salivary glands between these two groups. The most enriched KEGG category was signal transduction, including 97 pathways, with the most significantly enriched pathway being the cAMP signaling pathway (Figure 5 and Figure 6). The down-regulation of genes involved in signal transduction pathways was speculated to be related to the reduced response to external stimuli during H. nipponia hibernation when the food in the digestive tract was sufficient. The expression levels of 15 DEGs selected in the cAMP and cGMP-PKG signaling pathways showed the same trend in qRT-PCR and RNA-seq analyses, which verified the reliability of RNA-seq (Figure 8).
Leeches stimulate host bleeding through anticoagulant substances [16,18,67,68], and antibacterial active ingredients secreted by the salivary gland can inhibit the growth of ingested microbes when leeches ingest host’s blood. At the digestive tract of leeches, the water in the blood is concentrated; the blood is stored in the foregut and digested and absorbed in the intestinal tract. The protein decomposition process in the leech gut requires a cooperation of multiple proteases that break down different peptide bonds [69]. The digestion process of proteins in blood cells in the leech gut is slow during hibernation, which is related to the fact that protease inhibitors can regulate exopeptidases and endopeptidases secreted by microbial symbionts in the leech gut [70]. The protease inhibitors secreted by the salivary gland, e.g., eglin and bdellin [69], are involved in the digestion and storage of blood in the gut. Eglin is a serine inhibitor, and eglin-C is classified as an anti-inflammatory agent due to its ability to effectively block the activities of neutrophil elastase and cathepsin G secreted by neutrophils [71], which can induce inflammatory defense responses. Bdellin can specifically inhibit trypsin, plasmin, and acrosome protease chymotrypsin [72]. Both bdellin A and bdellin-KL are non-classical Kazal-type cysteine protease inhibitors, which exert anti-inflammatory effects by inhibiting proteases involved in the spread of inflammation [73]. Serine protease, as a proteolytic enzyme with a wide range of biological activities, participates in biological activities including food digestion and immune system regulation [74]. In addition to eglin, serine protease inhibitors secreted in leech salivary glands also include antistasin, ghilanten, piguamerin, guamerin, and hirustasin [75]. Antistasin and ghilanten are highly homologous and harbor very similar functions. They are both serine protease inhibitors and can effectively inhibit coagulation factor Xa [9,76]. Both guamerin and piguamerin can inhibit neutrophils and pancreatic elastase; however, guamerin is more specific in effectively inhibiting plasma kallikrein, tissue kallikrein, and pancreatic enzymes [77,78]. Hirustasin, with its strong anti-inflammatory effect, is the first tissue kallikrein inhibitor found in leeches, which can inhibit trypsin, chymotrypsin, and neutrophil cathepsin G [9,79].
Hyaluronidase has antibiotic and β-endo-glucuronidase activities and can digest hyaluronic acid in the extracellular matrix [80]. Theromyzin, the first anionic antimicrobial peptide observed in invertebrates, can inhibit the activity of Gram-positive bacteria [81]. Hirudomacin, secreted in both the gut and salivary gland, can lyse bacteria by affecting bacterial membranes through electrostatic interactions, and has significant antibacterial activity against Gram-negative and Gram-positive bacteria [20]. Destabilase is a multifunctional protein that not only inhibits fibrinogen, but also acts as lysozyme to lyse bacterial cells by digesting the β-1,4 glycosidic bond of peptidoglycan (a component of bacterial cell wall) or inhibits Micrococcus luteus and Escherichia coli by the peptide synthesized from the sequence of its α1 domain [82]. Although the proportion of pathogenic bacteria in gut microbes was up-regulated in H. nipponia fed before overwintering, which were outwardly more susceptible to mortality (Figure S2), gene expression in salivary glands also changed significantly. Significantly higher expression was observed in bdellin-KL, guamerin, theromyzin, destabilase, and hyaluronidase, which have anti-inflammatory and antibacterial effects (Figure 7), suggesting regulation by digestive tract microbes to cope with external microbes encountered in post-hibernation feeding and thus gut microbial instability.
Hirudin is a potent and specific thrombin inhibitor, which directly binds to thrombin [6,83]. The expression level of hirudin was low during the hibernation of H. nipponia, which was speculated to be related to the decreased demand for food during hibernation. When sucking blood, in addition to the fact that the salivary gland secretes a large number of anticoagulant and antibacterial active substances, the abundance of microbes in the leech gut also increases [20,84]. When the pathogenicity of microbes in the digestive tract increases, the expression of genes related to antimicrobial substances is also increased in salivary glands.

5. Conclusions

In this study, high-throughput sequencing was performed on microbes in the digestive tract and salivary gland of H. nipponia fed or fasted before hibernation, and the changes in microbial community structure in the digestive tract and the differential gene expression in the salivary gland during hibernation were analyzed. Feeding before hibernation not only increased the microbial diversity as well as the abundance of microbes related to metabolism and infectious diseases in the digestive tract of H. nipponia, but also promoted the expression of antibacterial-related genes in salivary glands. The stability of the microbes in the digestive tract of H. nipponia is jointly maintained by the salivary gland and the gut microbes, and the changes in the microbes in the digestive tract can lead to differential gene expression in the salivary gland. These results provide new insight for the research on the relationship between gene expression in salivary glands and the changes in bacterial composition in the digestive tract of H. nipponia and lay a foundation for the study of overwinter culture in H. nipponia. However, further investigations are needed on the relationship between gene regulation in salivary glands and microbes in digestive tracts.

Supplementary Materials

The following supporting information can be downloaded at: https://www.mdpi.com/article/10.3390/d14090768/s1, Table S1: Primers used for gene expression validation; Table S2: Statistic summary of sequencing data; Table S3: Statistic summary of De nove assembly data; Table S4: Statistics of functional annotation; Table S5: Gene expression in KEGG enrichment in FW and SW; Figure S1: Differential gene scatter diagram in FW leeches and SW leeches; Figure S2: Survival rate of FW leeches and SW leeches.

Author Contributions

Methodology, H.S. and Y.L.; validation, H.S. and M.C.; formal analysis, H.S. and J.L.; data curation, H.S. and M.C.; writing—original draft preparation, H.S..; writing—review and editing, H.S. and Y.L.; visualization, H.S.; supervision, H.S.; project administration, Y.L.; funding acquisition, Y.L. All authors have read and agreed to the published version of the manuscript.

Funding

This research was funded by the China Jiliang University Science and Technology Cooperation Project, grant number 03106-223031 (to Y.L.).

Institutional Review Board Statement

Not applicable.

Data Availability Statement

The raw data of high-throughput sequencing is available at the NCBI GenBank Sequence Read Archive (SRA), under accession number PRJNA863450 and PRJNA864561.

Conflicts of Interest

The authors declare no conflict of interest.

References

  1. Yang, T. Annelida: Hirudinea. In Fauna Sinica; Science Press: Beijing, China, 1996; Volume 5, pp. 1–256. [Google Scholar]
  2. Zhang, T.; Yu, X.; Gong, Y.; Li, J.; Zhang, J. Effects of feed supplementation with Aeromonas hydrophila on the growth and survival of Hirudo nipponia. Hebei Fish. 2017, 6, 10–17. [Google Scholar] [CrossRef]
  3. Ding, Z.; Chen, K.; She, Y.; Chen, Y. Research Advances of Medicinal Leeches and Leech Polypeptides. Mod. Chin. Med. 2022, 24, 1–10. [Google Scholar] [CrossRef]
  4. Lu, Z.; He, Z.; Shi, P.; Li, Q.; You, H.; Chen, S. Anticoagulant activity analysis of Hirudo nipponica. Mod. Chin. Med. 2017, 19, 37–39. [Google Scholar] [CrossRef]
  5. Koh, C.Y.; Kini, R.M. Anticoagulants from hematophagous animals. Expert Rev. Hematol. 2008, 1, 135–139. [Google Scholar] [CrossRef]
  6. Chen, J.; Xie, X.; Zhang, H.; Li, G.; Yin, Y.; Cao, X.; Gao, Y.; Li, Y.; Zhang, Y.; Peng, F.; et al. Pharmacological Activities and Mechanisms of Hirudin and Its Derivatives—A Review. Front. Pharmacol. 2021, 12, 660757. [Google Scholar] [CrossRef]
  7. Scacheri, E.; Nitti, G.; Valsasina, B.; Orsini, G.; Visco, C.; Ferrera, M.; Sawyer, R.T.; Sarmientos, P. Novel hirudin variants from the leech Hirudinaria manillensis. Amino acid sequence, cDNA cloning and genomic organization. Eur. J. Biochem. 1993, 214, 295–304. [Google Scholar] [CrossRef]
  8. Dunwiddie, C.T.; Waxman, L.; Vlasuk, G.P.; Friedman, P.A. Purification and characterization of inhibitors of blood coagulation factor Xa from hematophagous organisms. Methods Enzymol. 1993, 223, 291–312. [Google Scholar] [CrossRef]
  9. Söllner, C.; Mentele, R.; Eckerskorn, C.; Fritz, H.; Sommerhoff, C.P. Isolation and characterization of hirustasin, an antista-sin-type serine-proteinase inhibitor from the medical leech Hirudo medicinalis. Eur. J. Biochem. 2010, 219, 937–943. [Google Scholar] [CrossRef]
  10. Jung, H.I.; Kim, S.I.; Ha, K.S.; Joe, C.O.; Kang, K.W. Isolation and characterization of guamerin, a new human leukocyte elastase inhibitor from Hirudo nipponia. J. Biol. Chem. 1995, 270, 13879–13884. [Google Scholar] [CrossRef]
  11. Gui, Y.; Dong, D.; Li, R. Bionic affinity purification and identification of a new anticoagulant protein from Hirudo nipponia. Chin. J. Biochem. Drugs 2008, 29, 145–148. [Google Scholar]
  12. Shi, P.; Zeng, L.; You, H.; He, Y.; Zhang, D.; Xing, K.; Chen, S. Effects of fasting and refeeding on Hirudo nipponia intestinal microflora diversity. Acta Hydrobiol Sin. 2019, 43, 537–544. [Google Scholar] [CrossRef]
  13. Aminov, R.; Frolov, A.; Aminova, A. The influence of the planting time and conditions on the reproductive properties of Hirudo verbana and Hirudo medicinalis. Ann. Parasitol. 2021, 67, 169–174. [Google Scholar] [CrossRef]
  14. Upadhyay, V.; Poroyko, V.; Kim, T.; Devkota, S.; Fu, S.; Liu, D.; Tumanov, A.V.; Koroleva, E.P.; Deng, L.; Nagler, C.; et al. Lymphotoxin regulates commensal responses to enable diet-induced obesity. Nat. Immunol. 2012, 13, 947–953. [Google Scholar] [CrossRef]
  15. Koppel, N.; Balskus, E.P. Exploring and understandingthe biochemical diversity of the human microbiota. Cell Chem. Biol. 2016, 23, 18–30. [Google Scholar] [CrossRef]
  16. Nelson, M.C.; Graf, J. Bacterial symbioses of the medicinal leech Hirudo verbana. Gut Microbes. 2012, 3, 322–331. [Google Scholar] [CrossRef]
  17. Graf, J.; Kikuchi, Y.; Rio, R.V.M. Leeches and their microbiota: Naturally simple symbiosis models. Trends Microbiol. 2006, 14, 365–371. [Google Scholar] [CrossRef]
  18. McClure, E.A.; Nelson, M.C.; Lin, A.; Graf, J. Macrobdella decora: Old World Leech Gut Microbial Community Structure Conserved in a New World Leech. Appl. Environ. Microbiol. 2021, 87, e02082-20. [Google Scholar] [CrossRef]
  19. Song, D.; Feng, Z. Leech; Science Press: Beijing, China, 1978. [Google Scholar]
  20. Ding, A. Gene cloning and expression of a partial sequence of Hirudomacin, an antimicrobial protein that is increased in leech (Hirudo nipponica Whitman) after a blood meal. Comp. Biochem. Physiol. B Biochem. Mol. Biol. 2019, 231, 75–86. [Google Scholar] [CrossRef]
  21. Lemke, E.; Pavlova, E.; Babenko, V.V.; Latsis, I.; Malakhova, M.; Lavrenova, V.; Bashkirov, P.; Belousov, D.; Klinov, D.; Lazarev, V. The Hirudo Medicinalis Microbiome Is a Source of New Antimicrobial Peptides. Int. J. Mol. Sci. 2020, 21, 7141. [Google Scholar] [CrossRef]
  22. Lemke, S.; Vilcinskas, A. European Medicinal Leeches—New Roles in Modern Medicine. Biomedicines 2020, 8, 99. [Google Scholar] [CrossRef]
  23. Ma, M.; Tu, C.; Luo, J.; Lu, M.; Zhang, S.; Xu, L. Metabolic and immunological effects of gut microbiota in leaf beetles at the local and systemic levels. Integr Zool. 2021, 16, 313–323. [Google Scholar] [CrossRef]
  24. Luo, J.; Cheng, Y.; Guo, L.; Wang, A.; Lu, M.; Xu, L. Variation of gut microbiota caused by an imbalance diet is detrimental to bugs’ survival. Sci Total. Environ. 2021, 771, 144880. [Google Scholar] [CrossRef]
  25. Naggar, Y.A.; Singavarapu, B.; Paxton, R.J.; Wubet, T. Bees under interactive stressors: The novel insecticides flupyradifurone and sulfoxaflor along with the fungicide azoxystrobin disrupt the gut microbiota of honey bees and increase opportunistic bacterial pathogens. Sci Total Environ. 2022, 849, 157941. [Google Scholar] [CrossRef]
  26. Xu, L.; Deng, J.; Zhou, F.; Cheng, C.; Zhang, L.; Zhang, J.; Lu, M. Gut microbiota in an invasive bark beetle infected by a pathogenic fungus accelerates beetle mortality. J Pest Sci. 2019, 92, 343–351. [Google Scholar] [CrossRef]
  27. Heldmaier, G.; Ortmann, S.; Elvert, R. Natural hypometabolism during hibernation and daily torpor in mammals. Resp. Physiol. Neurobi. 2004, 141, 317–329. [Google Scholar] [CrossRef]
  28. Yu, M.; Liu, J.; Zhou, M.; Feng, X.; Cao, M. Primary investigation on habitat waters and biological characteristics of Hirudo nipponica. J. Chin. Med. Mater. 2019, 42, 2782–2785. [Google Scholar] [CrossRef]
  29. Sisa, C.; Turroni, S.; Amici, R.; Brigidi, P.; Candela, M.; Cerri, M. Potential role of the gut microbiota in synthetic torpor and therapeutic hypothermia. World J. Gastroentero. 2017, 23, 406–413. [Google Scholar] [CrossRef]
  30. Maltz, M.A.; Bomar, L.; Lapierre, P.; Morrison, H.G.; McClure, E.A.; Sogin, M.L.; Graf, J. Metagenomic analysis of the medicinal leech gut microbiota. Front. Microbiol. 2014, 5, 151. [Google Scholar] [CrossRef]
  31. Zhu, Y.; Si, H.; Zhang, Y.; Xu, C. Research progress on interaction mechanism between animal hibernation behavior and gut microbiota. Chin. J. Anim. Nutr. 2021, 33, 3719–3725. [Google Scholar]
  32. Dittmer, J.; Brucker, R.M. When your host shuts down: Larval diapause impacts host-microbiome interactions in Nasonia vitripennis. Microbiome 2021, 9, 85. [Google Scholar] [CrossRef]
  33. Quail, M.A.; Kozarewa, I.; Smith, F.; Scally, A.; Stephens, P.J.; Durbin, R.; Swerdlow, H.; Turner, D.J. A large genome centre’s improvements to the Illumina sequencing system. Nat. Methods 2008, 5, 1005–1010. [Google Scholar] [CrossRef] [PubMed]
  34. Reis-Filho, J.S. Next-generation sequencing. Breast Cancer Res. 2009, 11, S12. [Google Scholar] [CrossRef] [Green Version]
  35. Qin, N.; Li, D.; Yang, R. Next-generation sequencing technologies and the application in microbiology—A review. Acta Microbiol. Sin. 2011, 51, 445–457. [Google Scholar] [CrossRef]
  36. Song, P.; Ma, L.; Wang, Q.; Li, D.; Wei, Z. The advances of metagenome technology and its applications. Guizhou Agric. Sci. 2009, 37, 14–18. [Google Scholar]
  37. Zhao, Y.; Wu, J.; Yang, T.; Yao, M.; Pei, X.; Fu, L.; Liu, X. Advances in research on wildlife intestinal microbes based on metagenomics. Chin. J. Wildl. 2021, 42, 568–574. [Google Scholar] [CrossRef]
  38. Weng, F.C.H.; Yang, Y.J.; Wang, D. Functional analysis for gut microbes of the brown tree frog (Polypedates megacephalus) in artificial hibernation. BMC Genom. 2016, 17, 1024. [Google Scholar] [CrossRef]
  39. Xing, Y.; Guan, F.; Li, S.; Zhang, S.; Luo, Y. Comparative transcriptome analysis of salivary glands of Hirudo nipponia in response to starvation. J. Fish. China 2020, 44, 754–766. [Google Scholar] [CrossRef]
  40. Wu, Q.; Zhang, L.; Huang, Z.; Wang, D.; Hu, G. Transcription sequencing and its application on discovering the gene resources of wild soybean. Soybean Sci. 2013, 32, 845–851. [Google Scholar]
  41. Tang, H.; Huang, Y.; Lu, H.; Tian, D.; Zhang, Y. The application perspective of transcriptome sequencing on discovering the genes and variety breeding of bioenergy grass. Acta Agrestia Sin. 2016, 24, 731–737. [Google Scholar]
  42. Stark, R.; Grzelak, M.; Hadfield, J. RNA sequencing: The teenage years. Nat. Rev. Genet. 2019, 20, 631–656. [Google Scholar] [CrossRef]
  43. Babenko, V.V.; Podgorny, O.V.; Manuvera, V.A.; Kasianov, A.S.; Manolov, A.I.; Grafskaia, E.N.; Shirokov, D.A.; Kurdyumov, A.S.; Vinogradov, D.V.; Nikitina, A.S.; et al. Draft genome sequences of Hirudo medicinalis and salivary transcriptome of three closely related medicinal leeches. BMC Genom. 2020, 21, 331. [Google Scholar] [CrossRef]
  44. Zhang, S.; Lv, S.; Wang, J. The functional diversity of leech salivary gland secretions and its application. Chin. J. Biochem. Drugs 2017, 37, 316–319. [Google Scholar]
  45. Sears, C.L. A dynamic partnership: Celebrating our gut flora. Anaerobe 2005, 11, 247–251. [Google Scholar] [CrossRef]
  46. Wu, G.D.; Chen, J.; Hoffmann, C.; Bittinger, K.; Chen, Y.Y.; Keilbaugh, S.A.; Bewtra, M.; Knights, D.; Walters, W.A.; Knight, R.; et al. Linking Long-Term Dietary Patterns with Gut Microbial Enterotypes. Science 2011, 334, 105–108. [Google Scholar] [CrossRef] [PubMed]
  47. Scaldaferri, F.; Gerardi, V.; Lopetuso, L.R.; Zompo, F.D.; Mangiola, F.; Boškoski, I.; Bruno, G.; Petito, V.; Laterza, L.; Cammarota, G.; et al. Gut Microbial Flora, Prebiotics, and Probiotics in IBD: Their Current Usage and Utility. BioMed. Res. Int. 2013, 2013, 435268. [Google Scholar] [CrossRef] [PubMed]
  48. Shin, N.R.; Whon, T.W.; Bae, J.W. Proteobacteria: Microbial signature of dysbiosis in gut microbiota. Trends Biotechnol. 2015, 33, 496–503. [Google Scholar] [CrossRef]
  49. Shi, P.; Wei, J.; You, H.; Lu, Z.; Chen, S. Effects of acute temperature stress on intestinal microflora in Hirudo nipponia. Chin. J. Microecol. 2021, 33, 752–758. [Google Scholar] [CrossRef]
  50. Tran, N.T.; Xiong, F.; Hao, Y.T.; Zhang, J.; Wu, S.G.; Wang, G.T. Starvation influences the microbiota assembly and expression of immunity-related genes in the intestine of grass carp (Ctenopharyngodon idellus). Aquaculture 2018, 489, 121–129. [Google Scholar] [CrossRef]
  51. Kohl, K.D.; Amaya, J.; Passement, C.A.; Dearing, M.D.; McCue, M.D. Unique and shared responses of the gut microbiota to prolonged fasting: A comparative study across five classes of vertebrate hosts. FEMS Microbiol. Ecol. 2014, 90, 883–894. [Google Scholar] [CrossRef]
  52. Zhang, T.; Chen, Y.; Wang, Z.; Zhou, Y.; Zhang, S.; Wang, P.; Xie, S.; Jiang, B. Changes of fecal flora and its correlation with inflammatory indicators in patients with inflammatory bowel disease. J. South Med. Univ. 2013, 33, 1474–1477. [Google Scholar] [CrossRef]
  53. Ikeda, T.; Aida, M.; Yoshida, Y.; Matsumoto, S.; Tanaka, M.; Nakayama, J.; Nagao, Y.; Nakata, R.; Oki, E.; Akahoshi, T.; et al. Alteration in faecal bile acids, gut microbial composition and diversity after laparoscopic sleeve gastrectomy. Br. J. Surg. 2020, 107, 1673–1685. [Google Scholar] [CrossRef] [PubMed]
  54. Marden, J.N.; McClure, E.A.; Beka, L.; Graf, J. Host Matters: Medicinal Leech Digestive-Tract Symbionts and Their Pathogenic Potential. Front. Microbiol. 2016, 7, 1569. [Google Scholar] [CrossRef]
  55. Nelson, M.C.; Bomar, L.; Graf, J. Complete Genome Sequence of the Novel Leech Symbiont Mucinivorans hirudinis M3T. Genome Announc. 2015, 3, e01530-14. [Google Scholar] [CrossRef]
  56. Bomar, L.; Maltz, M.; Colston, S.; Graf, J. Directed Culturing of Microorganisms Using Metatranscriptomics. mBio 2011, 2, e00012-11. [Google Scholar] [CrossRef]
  57. Hubert, C.; Voordouw, G. Oil Field Souring Control by Nitrate-Reducing Sulfurospirillum spp. That Outcompete Sulfate-Reducing Bacteria for Organic Electron Donors. Appl. Environ. Microbiol. 2007, 73, 2644–2652. [Google Scholar] [CrossRef] [PubMed]
  58. Li, X.; Shen, D. Ecological characters and application of sulfate-reducing bacteria. Chin. J. Appl. Environ. Biol. 1999, S1, 10–13. [Google Scholar]
  59. Chen, K.; Zhao, Y.; Feng, Y.; Liu, C.; Li, X.; Zhao, L.; Pang, X. One improved growth medium for sulphate-reducing bacteria isolated from gut. Chin. J. Microecol. 2013, 25, 1241–1244. [Google Scholar] [CrossRef]
  60. Laufer, A.S.; Siddall, M.E.; Graf, J. Characterization of the Digestive-Tract Microbiota of Hirudo orientalis, a European Medicinal Leech. Appl. Environ. Microbiol. 2008, 74, 6151–6154. [Google Scholar] [CrossRef]
  61. Neupane, S.; Modry, D.; Pafčo, B.; Zurek, L. Bacterial Community of the Digestive Tract of the European Medicinal Leech (Hirudo verbana) from the Danube River. Microb Ecol. 2019, 77, 1082–1090. [Google Scholar] [CrossRef]
  62. Siddall, M.E.; Worthen, P.L.; Johnson, M.; Graf, J. Novel Role for Aeromonas jandaei as a Digestive Tract Symbiont of the North American Medicinal Leech. Appl. Environ. Microbiol. 2007, 73, 655–658. [Google Scholar] [CrossRef]
  63. Qi, X.Z.; Tu, X.; Zha, J.W.; Huang, A.G.; Wang, G.X.; Ling, F. Immunosuppression-induced alterations in fish gut microbiota may increase the susceptibility to pathogens. Fish Shellfish Immunol. 2019, 88, 540–545. [Google Scholar] [CrossRef] [PubMed]
  64. Zhu, T.; Yang, J.; Wang, L.; Duan, N.; Xiao, N. The Bacterial Pathogen Spectrum and Antibiotic Resistance of Infectious Diarrhea Outpatients in a Large Community in Beijing. Label. Immunoass. Clin. Med. 2019, 26, 777–780. [Google Scholar]
  65. Chopra, A.K.; Houston, C.W. Enterotoxins in Aeromonas-associated gastroenteritis. Microbes Infect. 1999, 1, 1129–1137. [Google Scholar] [CrossRef]
  66. Derrien, M.; Vaughan, E.E.; Plugge, C.M.; de Vos, W.M. Akkermansia muciniphila gen. nov.; sp. nov.; a human intestinal mucin-degrading bacterium. Int. J. Syst. Evol. Microbiol. 2004, 54, 1469–1476. [Google Scholar] [CrossRef]
  67. Kvist, S.; Manzano-Marín, A.; de Carle, D.; Trontelj, P.; Siddall, M.E. Draft genome of the European medicinal leech Hirudo medicinalis (Annelida, Clitellata, Hirudiniformes) with emphasis on anticoagulants. Sci. Rep. 2020, 10, 9885. [Google Scholar] [CrossRef] [PubMed]
  68. Min, G.S.; Sarkar, I.N.; Siddall, M.E. Salivary transcriptome of the North American medicinal leech, Macrobdella decora. J. Parasitol. 2010, 96, 1211–1221. [Google Scholar] [CrossRef] [PubMed]
  69. Roters, F.J.; Zebe, E. Proteinases of the medicinal leech, Hirudo medicinalis: Purification and partial characterization of three enzymes from the digestive tract. Comp. Biochem. Physiol. B. 1992, 102, 627–634. [Google Scholar] [CrossRef]
  70. Baskova, I.P.; Zavalova, L.L. Proteinase Inhibitors from the Medicinal Leech Hirudo medicinalis. Biochemistry 2001, 66, 703–714. [Google Scholar] [CrossRef]
  71. Junger, W.G.; Hallström, S.; Redl, H.; Schlag, G. Inhibition of Human, Ovine, and Baboon Neutrophil Elastase with Eglin c and Secretory Leukocyte Proteinase Inhibitor. Biol. Chem. Hoppe-Seyler 2009, 373, 119–122. [Google Scholar] [CrossRef]
  72. Roters, F.J.; Zebe, E. Protease inhibitors in the alimentary tract of the medicinal leech Hirudo medicinalis: In vivo and in vitro studies. J. Comp. Physiol. B. 1992, 162, 85–92. [Google Scholar] [CrossRef]
  73. Zaidi, S.M.; Jameel, S.S.; Zaman, F.; Jilani, S.; Sultana, A.; Khan, S.A. A systematic overview of the medicinal importance of sanguivorous leeches. Altern. Med. Rev. 2011, 16, 59–65. [Google Scholar]
  74. Mast, A.E.; Enghild, J.J.; Pizzo, S.V.; Salvesen, G. Analysis of the plasma elimination kinetics and conformational stabilities of native, proteinase-complexed, and reactive site cleaved serpins: Comparison of alpha 1-proteinase inhibitor, alpha 1-antichymotrypsin, antithrombin III, alpha 2-antiplasmin, angiotensinogen, and ovalbumin. Biochemistry 1991, 30, 1723–1730. [Google Scholar] [CrossRef]
  75. Lu, Z.; Shi, P.; You, H.; Liu, Y.; Chen, S. Transcriptomic analysis of the salivary gland of medicinal leech Hirudo nipponia. PLoS ONE. 2018, 13, e0205875. [Google Scholar] [CrossRef] [PubMed]
  76. Brankamp, R.G.; Sreekrishna, K.; Smith, P.L.; Blankenship, D.T.; Cardin, A.D. Expression of a Synthetic Gene Encoding the Anticoagulant-Antimetastatic Protein Ghilanten by the Methylotropic YeastPichia pastoris. Protein Expr. Purif. 1995, 6, 813–820. [Google Scholar] [CrossRef] [PubMed]
  77. Kim, H.; Chu, T.T.T.; Kim, D.Y.; Kim, D.R.; Nguyen, C.M.T.; Choi, J.; Lee, J.R.; Hahn, M.J.; Kim, K.K. The Crystal Structure of Guamerin in Complex with Chymotrypsin and the Development of an Elastase-specific Inhibitor. J. Mol Biol. 2008, 376, 184–192. [Google Scholar] [CrossRef] [PubMed]
  78. Kim, D.R.; Kang, K.W. Amino acid sequence of piguamerin, an antistasin-type protease inhibitor from the blood sucking leech Hirudo nipponia. Eur. J. Biochem. 1998, 254, 692–697. [Google Scholar] [CrossRef]
  79. Kvist, S.; Min, G.-S.; Siddall, M.E. Diversity and selective pressures of anticoagulants in three medicinal leeches (Hirudinida: Hirudinidae, Macrobdellidae). Ecol Evol. 2013, 3, 918–933. [Google Scholar] [CrossRef]
  80. Sobczak, N.; Kantyka, M. Hirudotherapy in veterinary medicine. Ann. Parasitol. 2014, 60, 89–92. [Google Scholar]
  81. Tasiemski, A.; Vandenbulcke, F.; Mitta, G.; Lemoine, J.; Lefebvre, C.; Sautière, P.E.; Salzet, M. Molecular Characterization of Two Novel Antibacterial Peptides Inducible upon Bacterial Challenge in an Annelid, the Leech Theromyzon tessulatum. J. Biol. Chem. 2004, 279, 30973–30982. [Google Scholar] [CrossRef]
  82. Chen, L.L.; Yudina, T.G.; Artamonova, I.I.; Baskova, I.P. Antibacterial Non-Glycosidase Activity of Invertebrate Destabilase-Lysozyme and of Its Helical Amphipathic Peptides. Chemotherapy 2006, 52, 158–160. [Google Scholar] [CrossRef] [Green Version]
  83. Chen, X.; Zhang, M.; Wang, J.; Lv, L.; Ning, S. Study progresses on hirudin. J. Jilin Med. Univ. 2021, 42, 135–137. [Google Scholar] [CrossRef]
  84. Worthen, P.L.; Gode, C.J.; Graf, J. Culture-Independent Characterization of the Digestive-Tract Microbiota of the Medicinal Leech Reveals a Tripartite Symbiosis. Appl. Environ. Microbiol. 2006, 72, 4775–4781. [Google Scholar] [CrossRef] [PubMed] [Green Version]
Figure 1. Compositional variation in microbial communities between FW leeches and SW leeches. (A) Alpha-diversity rarefaction plot of fecal microbiotas between FW leeches and SW leeches. The X- and Y-axes represent sample size and number of observed OTUs, respectively. (B) Venn diagram of OTU in FW leeches and SW leeches. Venn diagram summarizing the overlap of OTUs of leech fecal microbiota in FW leeches and SW leeches. (C) Principal Component Analysis (PCA) of bacterial diversity of FW leeches and SW leeches. (D) Principal co-ordinates analysis (PCoA) of bacterial diversity based on the Bray–Curtis distance of OTUs of FW leeches and SW leeches. (E) Non-metric Multidimensional Scaling (NMDS) ordination between microbial communities of FW leeches and SW leeches. Each point represents an individual leech sample.
Diversity 14 00768 g001
Figure 2. (A) Microbial community bar plot on the phylum level. Relative abundance of bacterial genera in each sample. (B) Microbial community barplot on the genus level. Relative abundance of bacterial genera in each sample.
Diversity 14 00768 g002
Figure 3. BugBase showing predicted relative abundance of Potentially_Pathogenic in FW leeches and SW leeches.
Diversity 14 00768 g003
Figure 4. Gene Ontology (GO) functional classification of differentially expressed genes (DEGs) in FW leeches and SW leeches. Distribution of all-unigenes and DEGs among GO terms in biological processes, cellular component, and molecular function.
Diversity 14 00768 g004
Figure 5. KEGG functional classification of differentially expressed genes (DEGs) in FW leeches and SW leeches.
Diversity 14 00768 g005
Figure 6. KEGG enrichment scatterplots of differentially expressed genes (DEGs) in FW leeches and SW leeches.
Diversity 14 00768 g006
Figure 7. Heat map of gene expression related to anticoagulation and antibacterial activities in FW leeches and SW leeches.
Diversity 14 00768 g007
Figure 8. Comparison of the expressions of RNA-Seq and qRT-PCR results.
Diversity 14 00768 g008
Table 1. Phylogenetic diversity indices of FW and SW. Sequence coverage bacterial diversity indices: Chao1, Ace, and Shannon index in leeches.
SampleChao1AceShannonCoverage
FW114.21 ± 6.83120.82 ± 6.141.75 ± 0.310.99 ± 0.00
SW105.86 ± 13.31105.98 ± 11.241.48 ± 0.160.99 ± 0.00
Values are means ± SD. Independent-sample t-test, n = 3 in each group.
Table 2. Relative abundance of dominant phyla in FW and SW.
OTUsFWSWFW vs. SW
Bacteroidetes59.52 ± 12.5334.92 ± 27.61Up
Firmicutes31.25 ± 11.4657.93 ± 22.70Down
Proteobacteria8.93 ± 1.786.78 ± 4.57Up
Hydrogenoanaerobacterium22.71 ± 8.0450.54 ± 18.69down
Mucinivorans14.90 ± 15.306.40 ± 9.26up
Bacteroides40.17 ± 24.615.25 ± 5.06up
Desulfovibrio3.96 ± 2.160.38 ± 0.46up
Aeromonas1.93 ± 0.450.84 ± 1.23up
unclassified_Porphyromonadaceae3.72 ± 0.8621.98 ± 24.95down
unclassified_Ruminococcaceae6.51 ± 3.135.87 ± 3.76up
Values are means ± SD, n = 3 in each group.
Table 3. PICRUSt showing predicted relative abundance of KEGG ortholog groups (Level 2 KOs).
CategoryL2FWSWtp
Membrane Transport11.6526 ± 1.147614.451 ± 0.8439−3.4030.027
Carbohydrate Metabolism10.6905 ± 0.133211.0392 ± 0.1289−3.2570.031
Amino Acid Metabolism9.6914 ± 0.30578.9745 ± 0.19363.4310.027
Poorly Characterized5.1011 ± 0.07334.9643 ± 0.02463.0630.038
Metabolism of Cofactors and Vitamins4.2304 ± 0.10633.8005 ± 0.09443.7040.021
Nucleotide Metabolism4.1021 ± 0.09563.8637 ± 0.10972.8380.047
Cellular Processes and Signaling4.1819 ± 0.06104.3046 ± 0.0391−2.940.042
Glycan Biosynthesis and Metabolism2.3785 ± 0.33981.4765 ± 0.26543.6240.022
Lipid Metabolism2.5681 ± 0.03942.4725 ± 0.00224.20.014
Folding, Sorting and Degradation2.5454 ± 0.17452.169 ± 0.09853.2530.031
Genetic Information Processing2.5558 ± 0.04492.432 ± 0.03663.7010.021
Transcription2.5205 ± 0.10042.7929 ± 0.1074−3.210.033
Cell Motility2.7142 ± 0.44253.6728 ± 0.2267−3.340.029
Metabolism of Terpenoids and Polyketides1.6484 ± 0.04251.5329 ± 0.02350.9140.043
Xenobiotics Biodegradation and Metabolism1.8792 ± 0.09652.2023 ± 0.1472−3.180.034
Metabolism of Other Amino Acids1.3821 ± 0.12691.0696 ± 0.05163.9490.017
Biosynthesis of Other Secondary Metabolites0.9477 ± 0.07190.7393 ± 0.14803.7470.02
Cell Growth and Death0.4773 ± 0.01800.4328 ± 0.01103.6560.022
Transport and Catabolism0.3407 ± 0.08350.1277 ± 0.05323.7290.02
Infectious Diseases0.3891 ± 0.01750.3525 ± 0.00723.3580.028
Signaling Molecules and Interaction0.2137 ± 0.04170.1411 ± 0.01552.830.047
Values are means ± SD. Independent-sample t-test, p < 0.05, n = 3 in each group.
Publisher’s Note: MDPI stays neutral with regard to jurisdictional claims in published maps and institutional affiliations.

