Article

Deep-Sea Epibenthic Megafaunal Assemblages of the Falkland Islands, Southwest Atlantic

1
South Atlantic Environmental Research Institute (SAERI), Stanley FIQQ 1ZZ, Falkland Islands
2
Shallow Marine Surveys Group, Stanley FIQQ 1ZZ, Falkland Islands
3
School of Biological Sciences (Zoology), University of Aberdeen, Tillydrone Avenue, Aberdeen AB24 2TZ, UK
*
Author to whom correspondence should be addressed.
Diversity 2022, 14(8), 637; https://doi.org/10.3390/d14080637
Submission received: 13 June 2022 / Revised: 1 August 2022 / Accepted: 4 August 2022 / Published: 10 August 2022
(This article belongs to the Special Issue Deep Atlantic Biodiversity)

Abstract

:
Deep-sea environments face increasing pressure from anthropogenic exploitation and climate change, but remain poorly studied. Hence, there is an urgent need to compile quantitative baseline data on faunal assemblages, and improve our understanding of the processes that drive faunal assemblage composition in deep-sea environments. The Southwest Atlantic deep sea is an undersampled region that hosts unique and globally important faunal assemblages. To date, our knowledge of these assemblages has been predominantly based on ex situ analysis of scientific trawl and fisheries bycatch specimens, limiting our ability to characterise faunal assemblages. Incidental sampling and fisheries bycatch data indicate that the Falkland Islands deep sea hosts a diversity of fauna, including vulnerable marine ecosystem (VME) indicator taxa. To increase our knowledge of Southwest Atlantic deep-sea epibenthic megafauna assemblages, benthic imagery, comprising 696 images collected along the upper slope (1070–1880 m) of the Falkland Islands conservation zones (FCZs) in 2014, was annotated, with epibenthic megafauna and substrata recorded. A suite of terrain derivatives were also calculated from GEBCO bathymetry and oceanographic variables extracted from global models. The environmental conditions coincident with annotated image locations were calculated, and multivariate analysis was undertaken using 288 ‘sample’ images to characterize faunal assemblages and discern their environmental drivers. Three main faunal assemblages representing two different sea pen and cup coral assemblages, and an assemblage characterised by sponges and Stylasteridae, were identified. Subvariants driven by varying dominance of sponges, Stylasteridae, and the stony coral, Bathelia candida, were also observed. The fauna observed are consistent with that recorded for the wider southern Patagonian Slope. Several faunal assemblages had attributes of VMEs. Faunal assemblages appear to be influenced by the interaction between topography and the Falkland Current, which, in turn, likely influences substrata and food availability. Our quantitative analyses provide a baseline for the southern Patagonian shelf/slope environment of the FCZs, against which to compare other assemblages and assess environmental drivers and anthropogenic impacts.

1. Introduction

Deep-sea environments (water depth > 200 m) are under increasing threat from anthropogenic pressure [1,2,3,4,5], including climate change [6,7,8,9]. As a result, improving the management and conservation of deep-sea environments is frequently identified as a priority action [1,6,10,11,12,13,14]. However, deep-sea environments are poorly understood [10,15,16], especially in the Southwest Atlantic, despite it being increasingly advocated as a biodiverse region [17,18,19,20,21] that supports endemic species [22,23] and globally important ecosystems [24].
To date, deep-sea faunal exploration of the Southwest Atlantic has predominately centred on the Brazilian shelf and slope [21,25,26,27,28]. In contrast, the faunal composition of the southern Atlantic Patagonian deep-sea is largely unknown [18,19,20,29], and our current knowledge of the epibenthos is predominately based on ex situ data—fisheries bycatch or scientific trawl/dredge data [17,30,31,32,33,34,35,36,37,38,39,40,41,42], with most records from Discovery Expeditions of the early twentieth century [43]. Only limited inference can be drawn from ex situ data, because sample bias prevents quantitative characterisation of faunal assemblages [44]. As a result, our knowledge of the epibenthos is restricted to species inventories, single-species descriptions [18,19,38,39,45,46,47,48], and qualitative/semiquantitative assemblage descriptions at the level of phyla [17,32,33,37,49]. Underwater imagery offers a non-invasive method to undertake in situ quantitative characterisation of epibenthic assemblages [44,50,51,52,53,54,55,56,57,58,59]. However, the few studies utilising benthic imagery of Southwest Atlantic deep-sea epibenthos have remained descriptive [29,42,49,60,61,62,63,64,65,66,67,68], and the one study that undertook quantitative analysis did so at the level of phyla, preventing detailed characterisation of assemblages [69]. The lack of quantitative studies leaves a gap in our understanding of whether observed assemblages are statistically robust entities, preventing comparisons with other deep-sea localities [70] and limiting our ability to identify environmental drivers of assemblage composition. This knowledge is necessary if we are to implement efficient management practices to safeguard deep-sea assemblages from anthropogenic impacts, including climate change [71,72].
Describing deep-sea epibenthic megafaunal assemblages is especially important because they predominantly comprise long-lived [73,74,75], fragile species that exhibit low resilience to environmental impacts [76,77] and slow recovery rates [77,78]. These attributes contribute to species and assemblage vulnerability, and therefore, many deep-sea species, assemblages and habitats are considered components of vulnerable marine ecosystems (VMEs) [12]. Vulnerable marine ecosystems are internationally recognised as ecologically important, and legislation to identify and map VMEs to avoid significant adverse impacts has been developed [11,12].
The Falkland Islands are an archipelago located at the southeast extremity of the Patagonian shelf in the Southwest Atlantic. The deep sea constitutes approximately 72% of the marine environment encompassed by the Falkland Islands conservation zones (FCZs; comprising of the Falklands Interim Conservation and Management Zone and the Falklands Outer Conservation Zone). However, little is known of the deep-sea faunal assemblages occurring within the FCZs. The few published studies report species records collected as part of wider Southwest Atlantic surveys and/or macroinfaunal analysis reported in the grey literature [60,61,62,63,64,65,66,67]. Published species records indicate that the deep-sea FCZs hosts diverse fauna, including VME indicator taxa [22,36]. However, to date, no quantitative analysis of epibenthic megafauna has been published. In light of the proposed Falkland Islands marine managed areas (MMAs) public consultation in 2022, there is a pressing need to improve our baseline knowledge of deep-sea assemblages, including VMEs occurring in the FCZs, so that appropriate management practices to safeguard VMEs can be developed.
To increase our bioecological knowledge of Southwest Atlantic deep-sea epibenthic megafaunal assemblages, including VMEs, we combined legacy image datasets previously collected for commercial purposes, with freely available environmental data constituting bathymetry and oceanography datasets to (1) characterise the composition of epibenthic megafauna assemblages and (2) investigate the environmental factors that might influence epibenthic megafauna community structure.

2. Materials and Methods
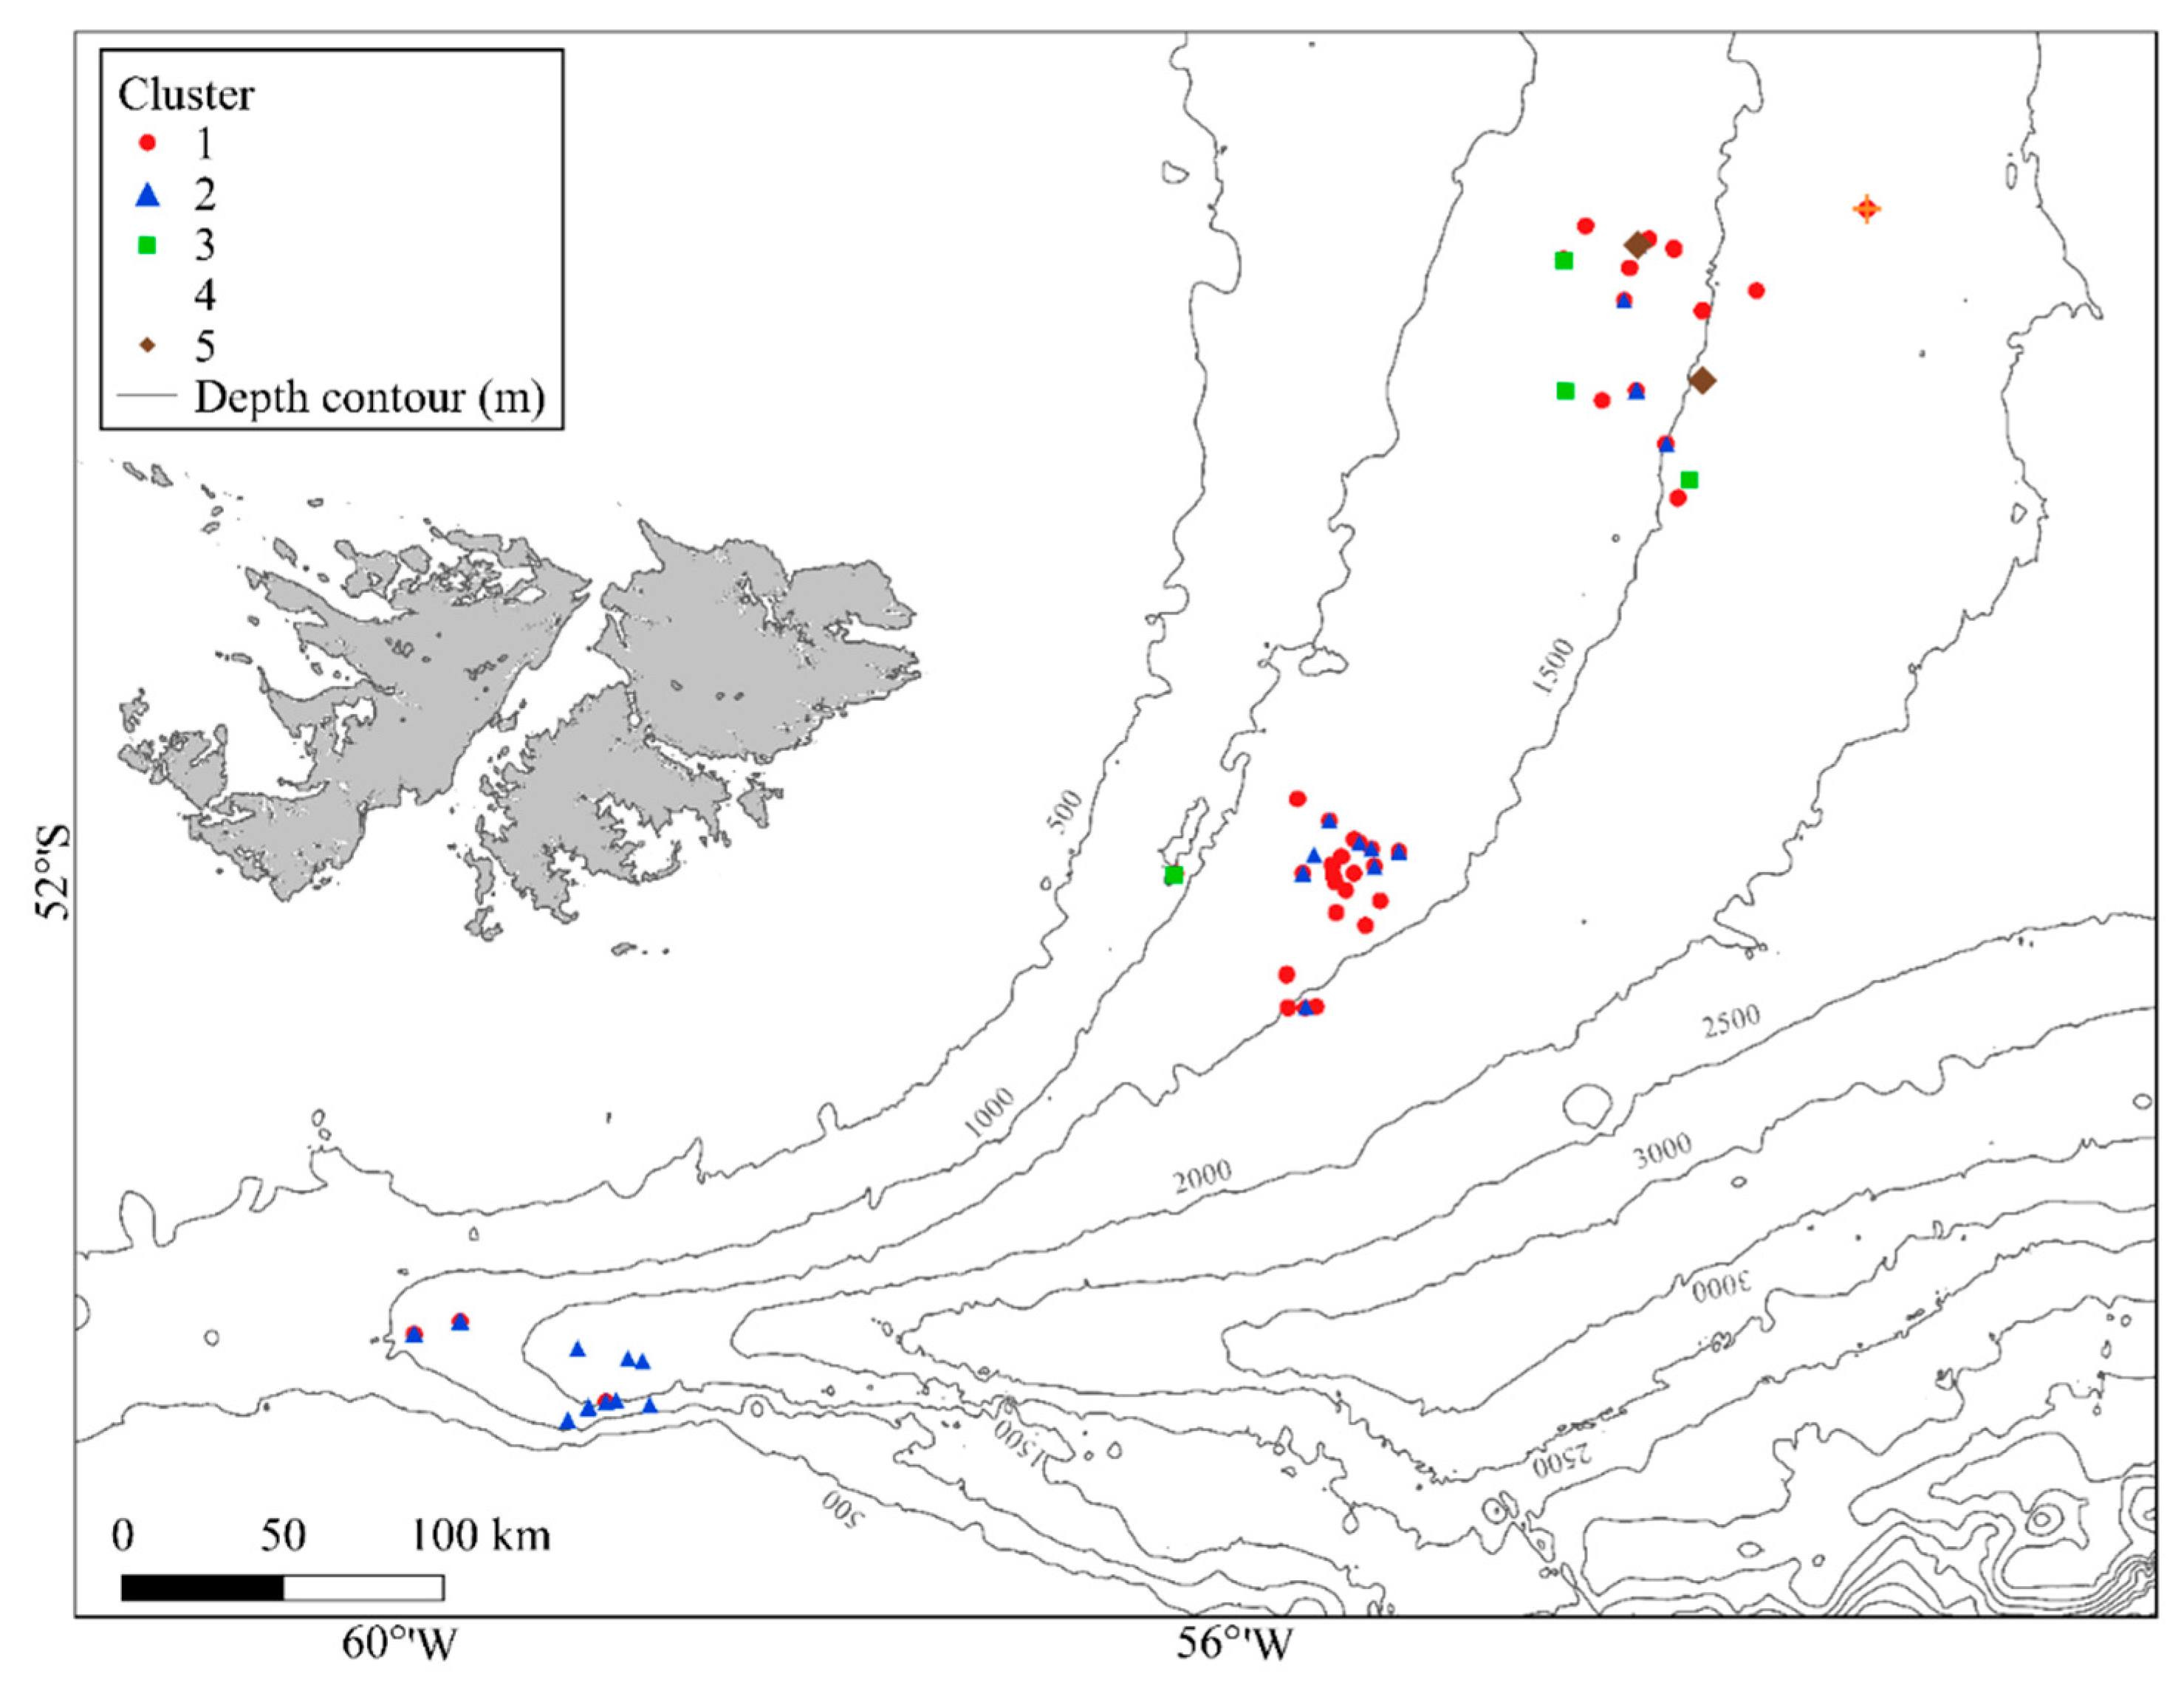
2.1. Study Area

The Falkland Islands are situated on an area known as the Falkland Plateau, an extension of the Patagonian shelf, reaching water depths of 2500 m. The Falkland Plateau is separated to the north from the Argentine Basin by the Falkland Escarpment, and to the south, the Falkland Trough separates the Falkland Plateau from the Burdwood Bank (Figure 1).
The Falkland Islands are considered part of the cold–temperate Atlantic Magellan Biogeographic Province [79,80,81], and the more recently assigned cold–temperate South American Biogeographic Region [82], within which it is proposed the islands form a subprovince with Southern Argentina [83]. Circulation in the region is characterised by a northeastward flow that extends from the tip of Tierra del Fuego to the subtropical shelf front near Uruguay, from where it veers southeast into the deep sea [84]. The Falkland Current extends along the Patagonian shelf break and upper slope until the subtropical shelf front. In the FCZs, the Falkland Current diverges around the Falkland Islands, forming an eastern and western stream [84]. The Falkland Current provides a constant influx of sub-Antarctic waters [84], and has a mean temperature range of 4–11 °C, salinity range of 33.8–33.4 psu, and is associated with high primary productivity, which, in turn, supports important fisheries [85]. The slope waters of the FCZs are characterised by the Antarctic Intermediate Water (AAIW) at water depths < 1000 m, and the Upper Circumpolar Deep Water (UCDW) between water depths of 1000–2200 m.
The substrata along the Patagonian shelf mainly consist of mud, muddy sands, sandy muds, and pebbly muds [42,86,87], with mid-water drifts on the slope composed of hemipelagic mud and ice-rafted debris [87]. The Falkland Islands are considered regionally unique in that they did not experience glaciation during the last glacial period, resulting in a benthic environment that has been permanently sustained. Still, the influence of past geological periods is evident in the presence of iceberg plough marks and ice-rafted debris [88].

2.2. Quantitative Image Analysis

Benthic imagery was obtained from 69 stations (Figure 1), collected during three environmental baseline surveys conducted by Noble in 2014 (see Supplementary Table S1; Falkland Islands Government Department of Mineral Resources, unpublished data) that covered water depths of 1070 m to 1880 m. Imagery data were collected using a “Sea Bug” drop-down camera system equipped with a standard definition stills camera (G10 Canon, five megapixels) and a laser scale with parallel beams positioned 30 cm apart. Positional data were derived from an ultra-short baseline navigation system (USBL) beacon attached to the cable above the camera frame. At each station, the drop-down camera system was towed for 100 m at approximately 0.5 knots.
A total of 862 georeferenced benthic still images were reviewed, and images of low visibility (due to sediment or lighting) or where laser points were not visible, were removed. To ensure overlapping images were not analysed, and to reduce the influence of spatial autocorrelation, “Sample” images were annotated at 60 s intervals. All epibenthic megafauna >10 mm were enumerated and identified to the lowest taxonomic level possible, and assigned to morphospecies (visually distinct taxa) in BIIGLE 2.0 platform [89]. The assignment of morphospecies when analysing image data is common practice in deep-sea settings where access to specimens and a good knowledge of taxonomy is absent [90,91]. The area of each image was calculated and used to convert counts to densities per m2. The area of each image was calculated using the pixel dimension of each image together with the pixel and actual distance between lasers [92]. The mean image area was 1.14 m2 ± 0.95.
To explore assemblage–environment relationships, a dominant substrata type (based upon EUNIS 2022 classifications [93] (see Supplementary Figure S1) was assigned to each annotated image. To capture the influence of geomorphology and oceanography acting at broad spatial scales, a suite of terrain derivatives were calculated from GEBCO bathymetry gridded at ~430 m (0.004°) using ArcGIS extension Benthic Terrain Modeler v. 3.0 (Table 1). Oceanography variables were extracted from global models and exported as rasters interpolated to a resolution of ~430 m (0.004°) by kriging using the Spatial Analyst toolbox in ArcGIS (Table 1).

2.3. Data Analysis

Multivariate analysis was used to identify faunal assemblages and environmental variables influencing assemblage composition. Prior to multivariate analysis, sample images with no or fewer than three taxa were removed to reduce the influence of rare taxa that may reflect sampling artifacts associated with deep-sea sampling rather than representing the whole community [97]. Of the 694 images annotated, 195 had no visible fauna and 213 images had less than three taxa, resulting in 288 sample images retained for multivariate analysis. Environmental data coincident with each sample image location were extracted from the environmental rasters and combined with the substratum annotation of that sample.
Epibenthic megafaunal assemblages were assessed by non-metric multidimensional scaling (nMDS) and hierarchal cluster analysis with group-averaged linkage, using a Hellinger dissimilarity matrix derived from the Hellinger-transformed data matrix. A Hellinger transformation was used to enable the use of linear ordination methods in the canonical redundancy analysis (RDA) [98,99]. The optimal number of interpretable clusters was determined with fusion level and mean silhouette widths [99]. Characteristic morphospecies contributing to similarity among clusters were identified using similarity percentage analysis (SIMPER) [100]. To explore the relationships between multivariate morphospecies data and different environmental variables, RDA was performed [99]. RDA combines the outputs of multiple regression with ordination. To obtain the most parsimonious model, forward selection was carried out on the standardised (i.e., transformed to zero mean and unit variance) environmental variables, and Pearson’s correlation and variance inflation factor (VIF) scores were used to exclude collinear environmental variables in the model (correlation coefficients >0.7) [101]. High collinearity in environmental variables during model selection resulted in a subset of variables being retained (fine bathymetric position index (FBPI), slope, depth, mean current velocity, and aspect—which was separated into eastness and northness) (Table 1). Depth per se does not influence fauna, but was retained as it is correlated with quantified and unquantified environmental variables (water mass properties, food availability) that have been shown to influence deep-sea faunal assemblage patterns [102,103,104].
All statistical analyses were conducted using the open source software R [105] packages “Packfor” “vegan”, “cluster”, “ape”, “ade4”, “gclus”, “AEM”, “spdep”, and “MASS”.

3. Results

In total, 7398 individuals belonging to 157 morphospecies from eight known phyla were annotated from the 694 sample images (see Supplementary Table S2). Many morphospecies were rare, being observed from a few images at low abundance, and only 17 morphospecies were observed from more than 10% of sample images (see Supplementary Table S2). The hydrocoral Stylasteridae sp. was the most abundant and commonly encountered morphospecies across samples, occurring across 56.2% of samples and representing 15.5% of total individuals observed (see Supplementary Table S2). Porifera were also commonly observed, with the morphospecies referred to as Massive Ball Porifera occurring cross 28.1% of the sample images and representing 4.3% of total individuals, and encrusting Porifera occurring cross 20.9% of the sample images and representing 3.8% of total individuals (see Supplementary Table S2).
Soft, muddy, and sandy substrata dominated samples from the slope of the Falkland Trough from which fields of sea pens, including Anthoptilum grandiflorum and solitary cup corals of the genus Flabellum, were observed (Figure 2E). The substrata from the Falkland Plateau were more varied, encompassing muddy and sandy substrata with varying degrees of pebbles, glacial dropstones, and hard substrata. Sea pens and cup corals also occurred in these soft substrata (Figure 2D,E). On the other hand, sponges (predominantly belonging to Hexactinellida and Demospongiae) and Stylasteridae occurred across coarse substrata (Figure 2C), interspersed with non-reef aggregations of the stony coral, Bathelia candida, soft corals of the Alcyonacea (including formally Gorgonacea), large Stylasteridae such as Stylaster densicalus and erect Porifera, including Phakellia sp. that occurred on coarser substrata and glacial dropstones (Figure 2B). Near escarpments B. candida also formed reef-like aggregations with their coral framework and rubble, colonised by encrusting Porifera, Stylasteridae, the soft coral Thouarella viridis, and the squat lobster Munida spinosa (Figure 2A).

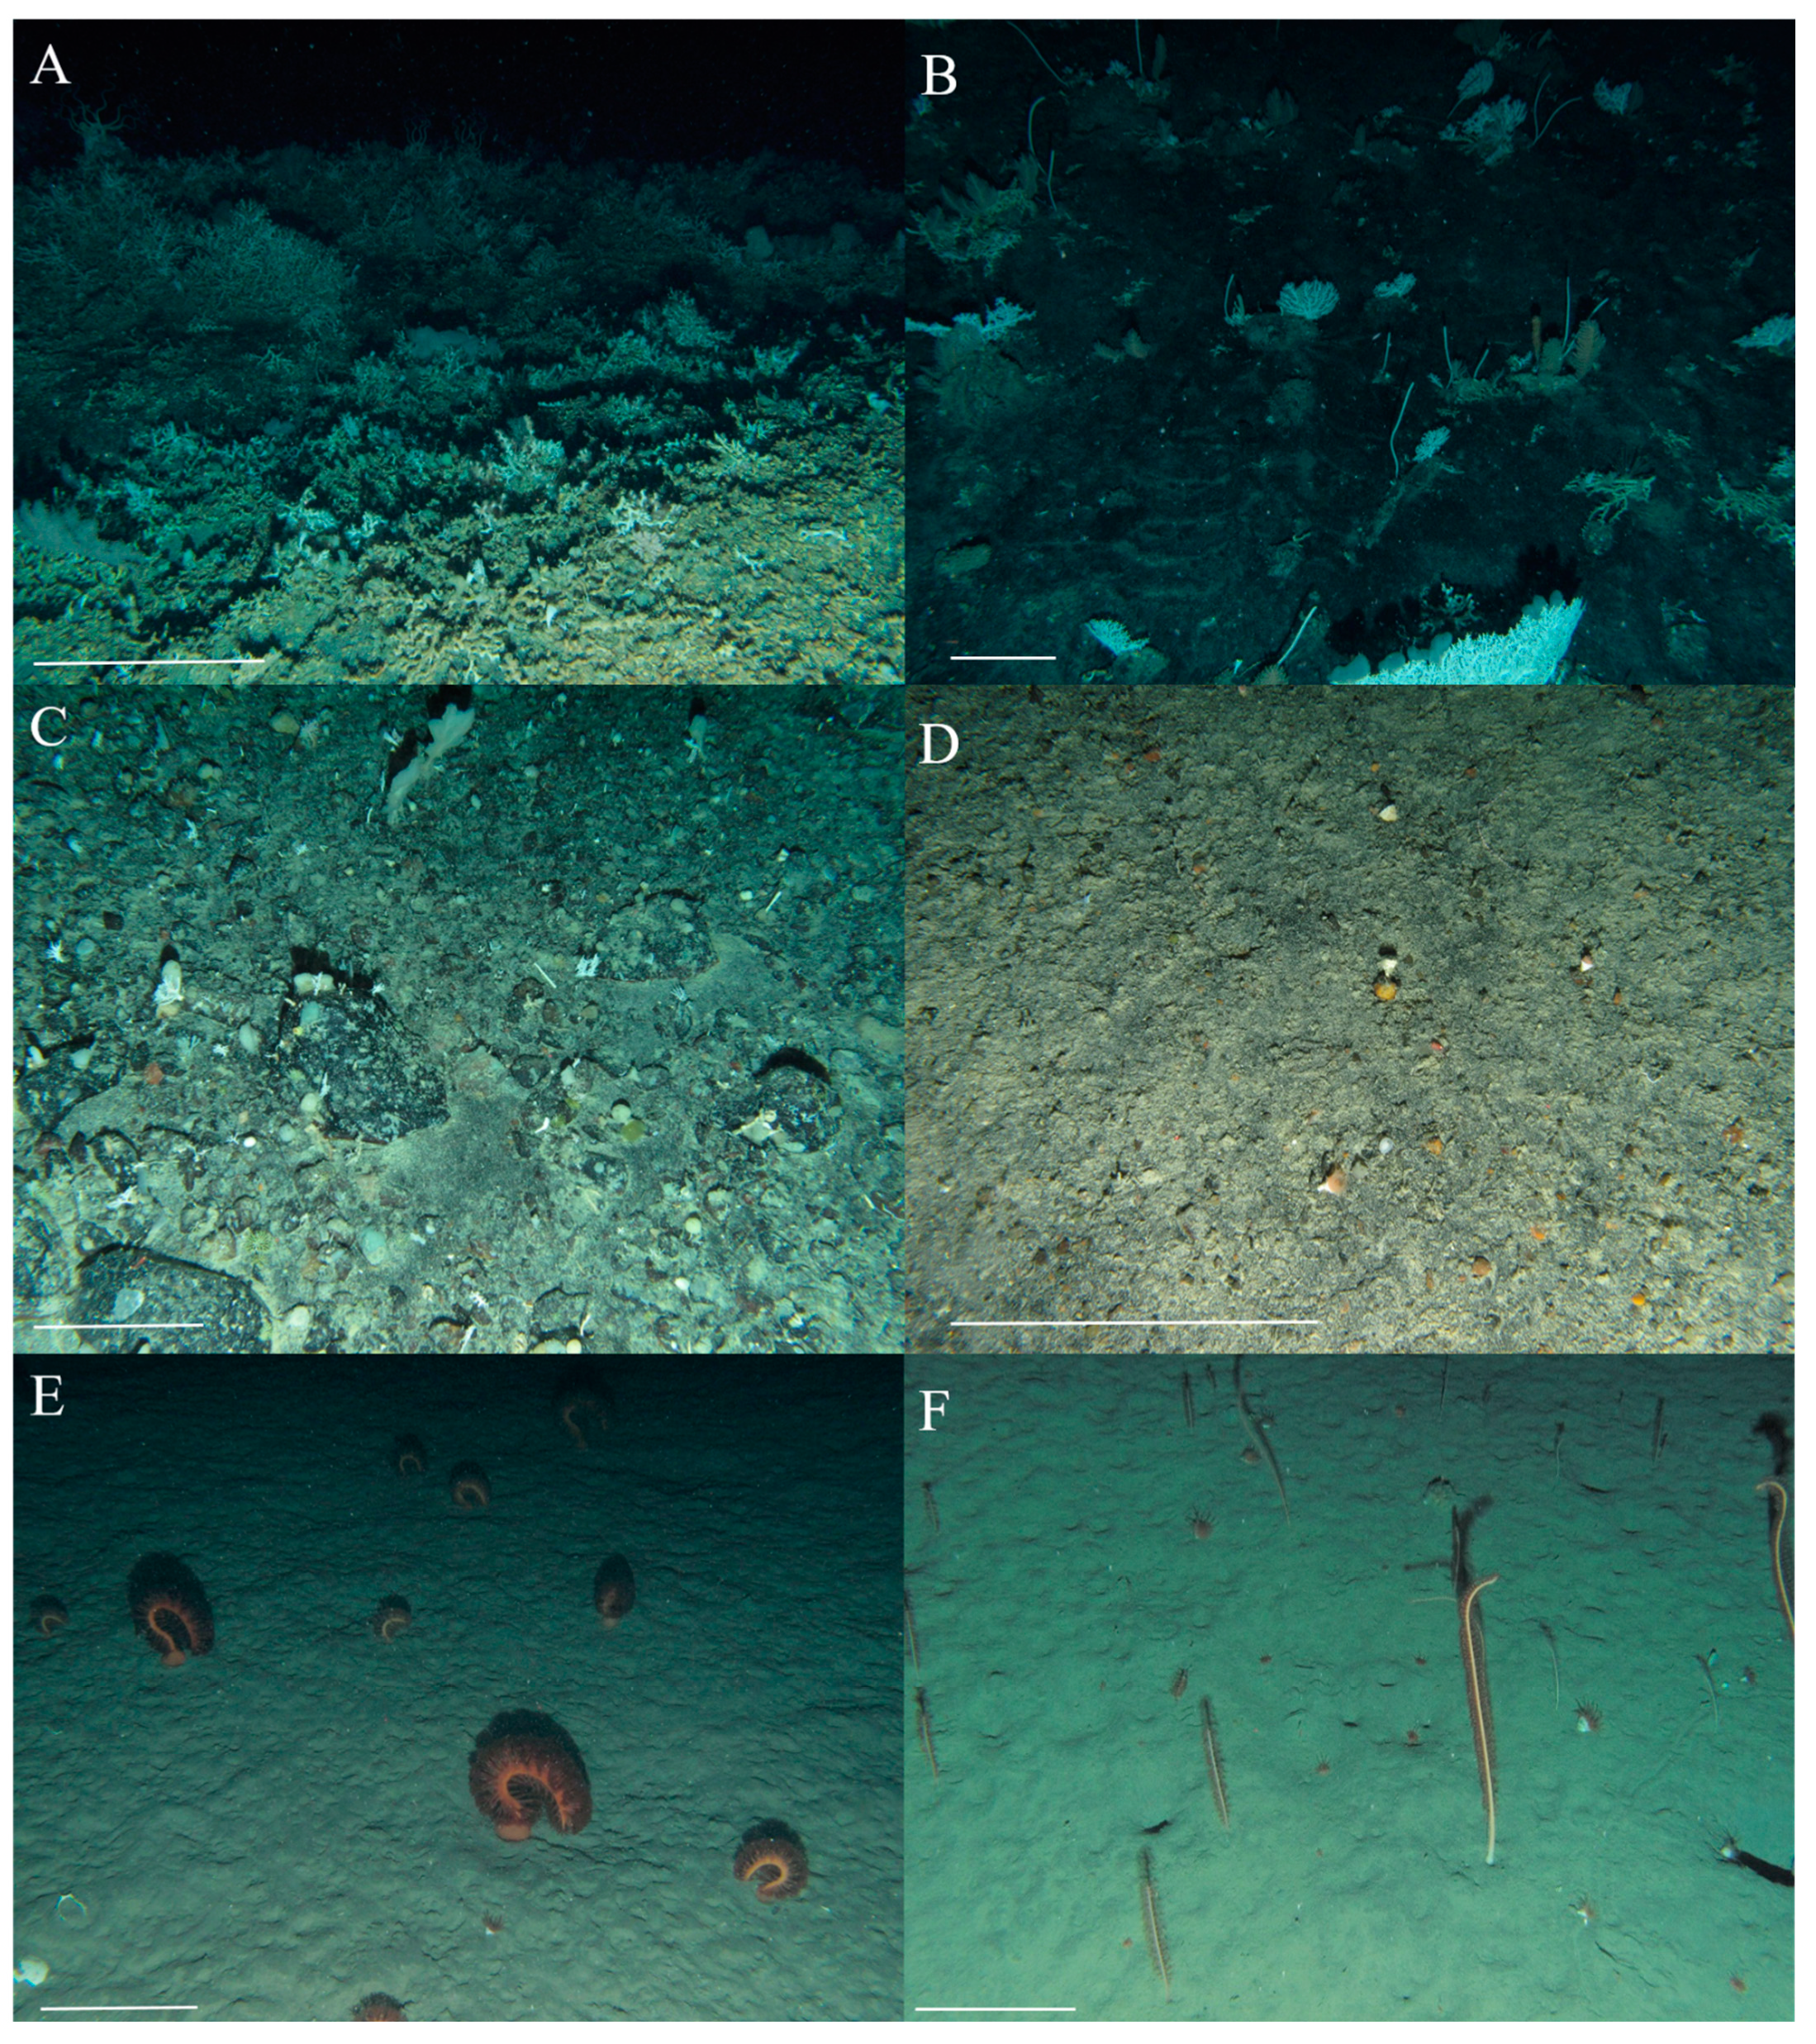
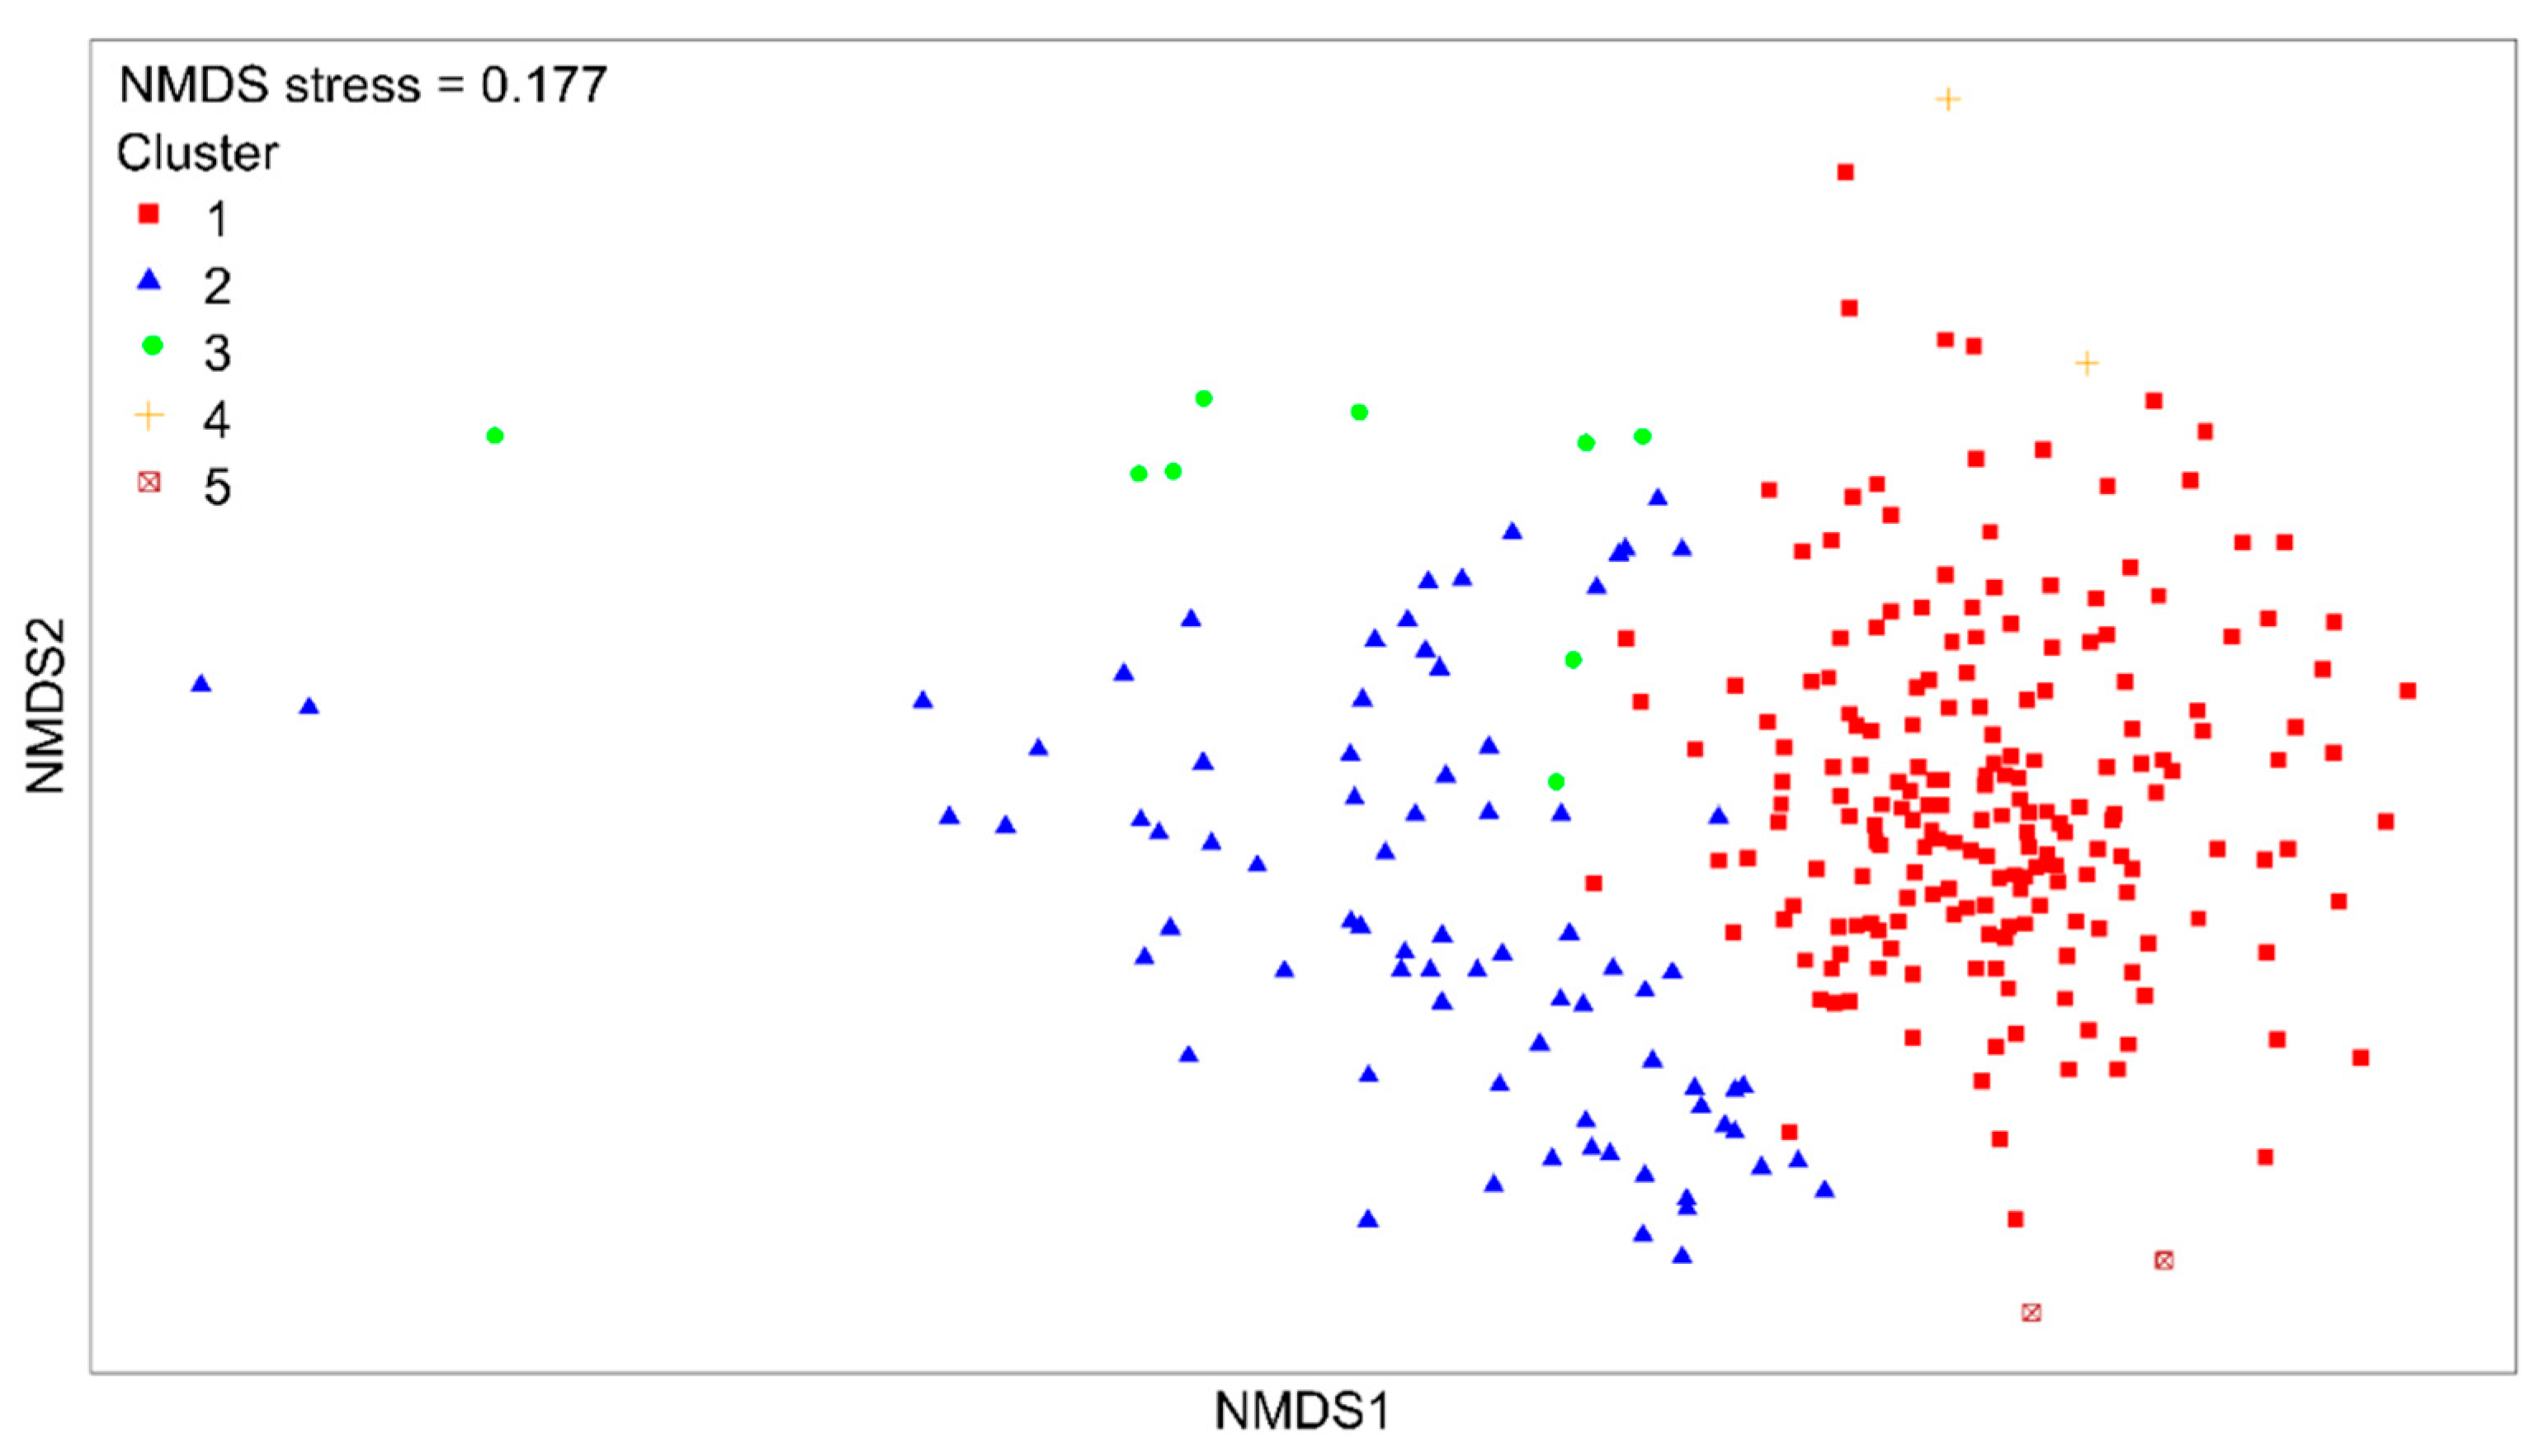
3.1. Quantitative Analysis of Epibenthic Megafaunal Assemblages

Fusion level and mean silhouette widths identified five clusters as optimal in representing faunal assemblages from the 288 sample images used in hierarchal clustering (see Supplementary Table S2 and Figures S2 and S3). The superimposed groupings from the hierarchal analysis onto the nMDS plot show a general agreement between the two methods (Figure 3), with assemblages distributed across the FCZ (Figure 4). On the other hand, the RDA analysis highlights further differentiation within cluster one (Figure 5). Cluster one represents the most commonly encountered assemblage type (Figure 3 and Figure 4) characterised by a predominance of Stylasteridae and sponges (Figure 2A–C and Figure 3 and Table 2). Cluster two and three represent variants of the sea pen and solitary cup coral assemblages. Cluster two is characterised by Anthoptilum grandiflorum and an attached solitary cup coral, Scleractinia sp. 5 (Figure 2D,E and Figure 3 and Table 2). In contrast, cluster three is characterised by, Pennatulacea sp. and a predominance of the unattached solitary cup coral, Flabellum sp. (Figure 2F and Figure 3 and Table 2). Alcyonacea sp. 19 and Hormathiidae sp. 2 characterised cluster four, and cluster five was characterised by the morphospecies cold-water whip coral (Figure 3 and Table 2). However, both these clusters were only represented by two sample images, limiting conclusions that can be drawn, and so are omitted from further discussion.
The RDA analysis shows that the vectors representing species scores (Figure 5) separate into three main subgroups. The upper right quadrant is characterised by the predominance of M. spinosa, encrusting Porifera, T. viridis, and B. candida. The lower right quadrant is represented by a predominance of Stylasteridae and Porifera morphospecies, and the lower left quadrant is represented by the predominance of A. grandiflorum, Pennatulacea sp., Scleractinia sp. 5, and Flabellum sp. morphospecies. Within the lower left quadrant, there was further differentiation between sea pen and cup coral predominance.
The RDA analysis, hierarchal clustering, and nMDS plot showed similar trends in that the main clusters separated into two regions, comprised of the same characterising morphospecies (Figure 3 and Figure 5). Cluster one relates to the right quadrants, and cluster two and three relate to the lower left quadrant, within which differentiation between cluster two and three, driven by relative abundance of Scleractinia sp. 5, could be seen (Figure 5). However, the RDA analysis indicated a further level of differentiation, within cluster one of the hierarchal clustering, separating the encrusting Porifera, B. candida, T. viridis, and M. spinosa assemblage from that dominated by Stylasteridae and Massive Ball Porifera (Figure 5). The inability of the hierarchal clustering to differentiate between these latter two assemblages likely arises from the commonality of Stylasteridae, which led to cluster cohesion (Table 2) and the observation that assemblages occur as continuums rather than distinct entities distributed next to one another, which reduces the discriminatory power of hierarchal clustering [101].

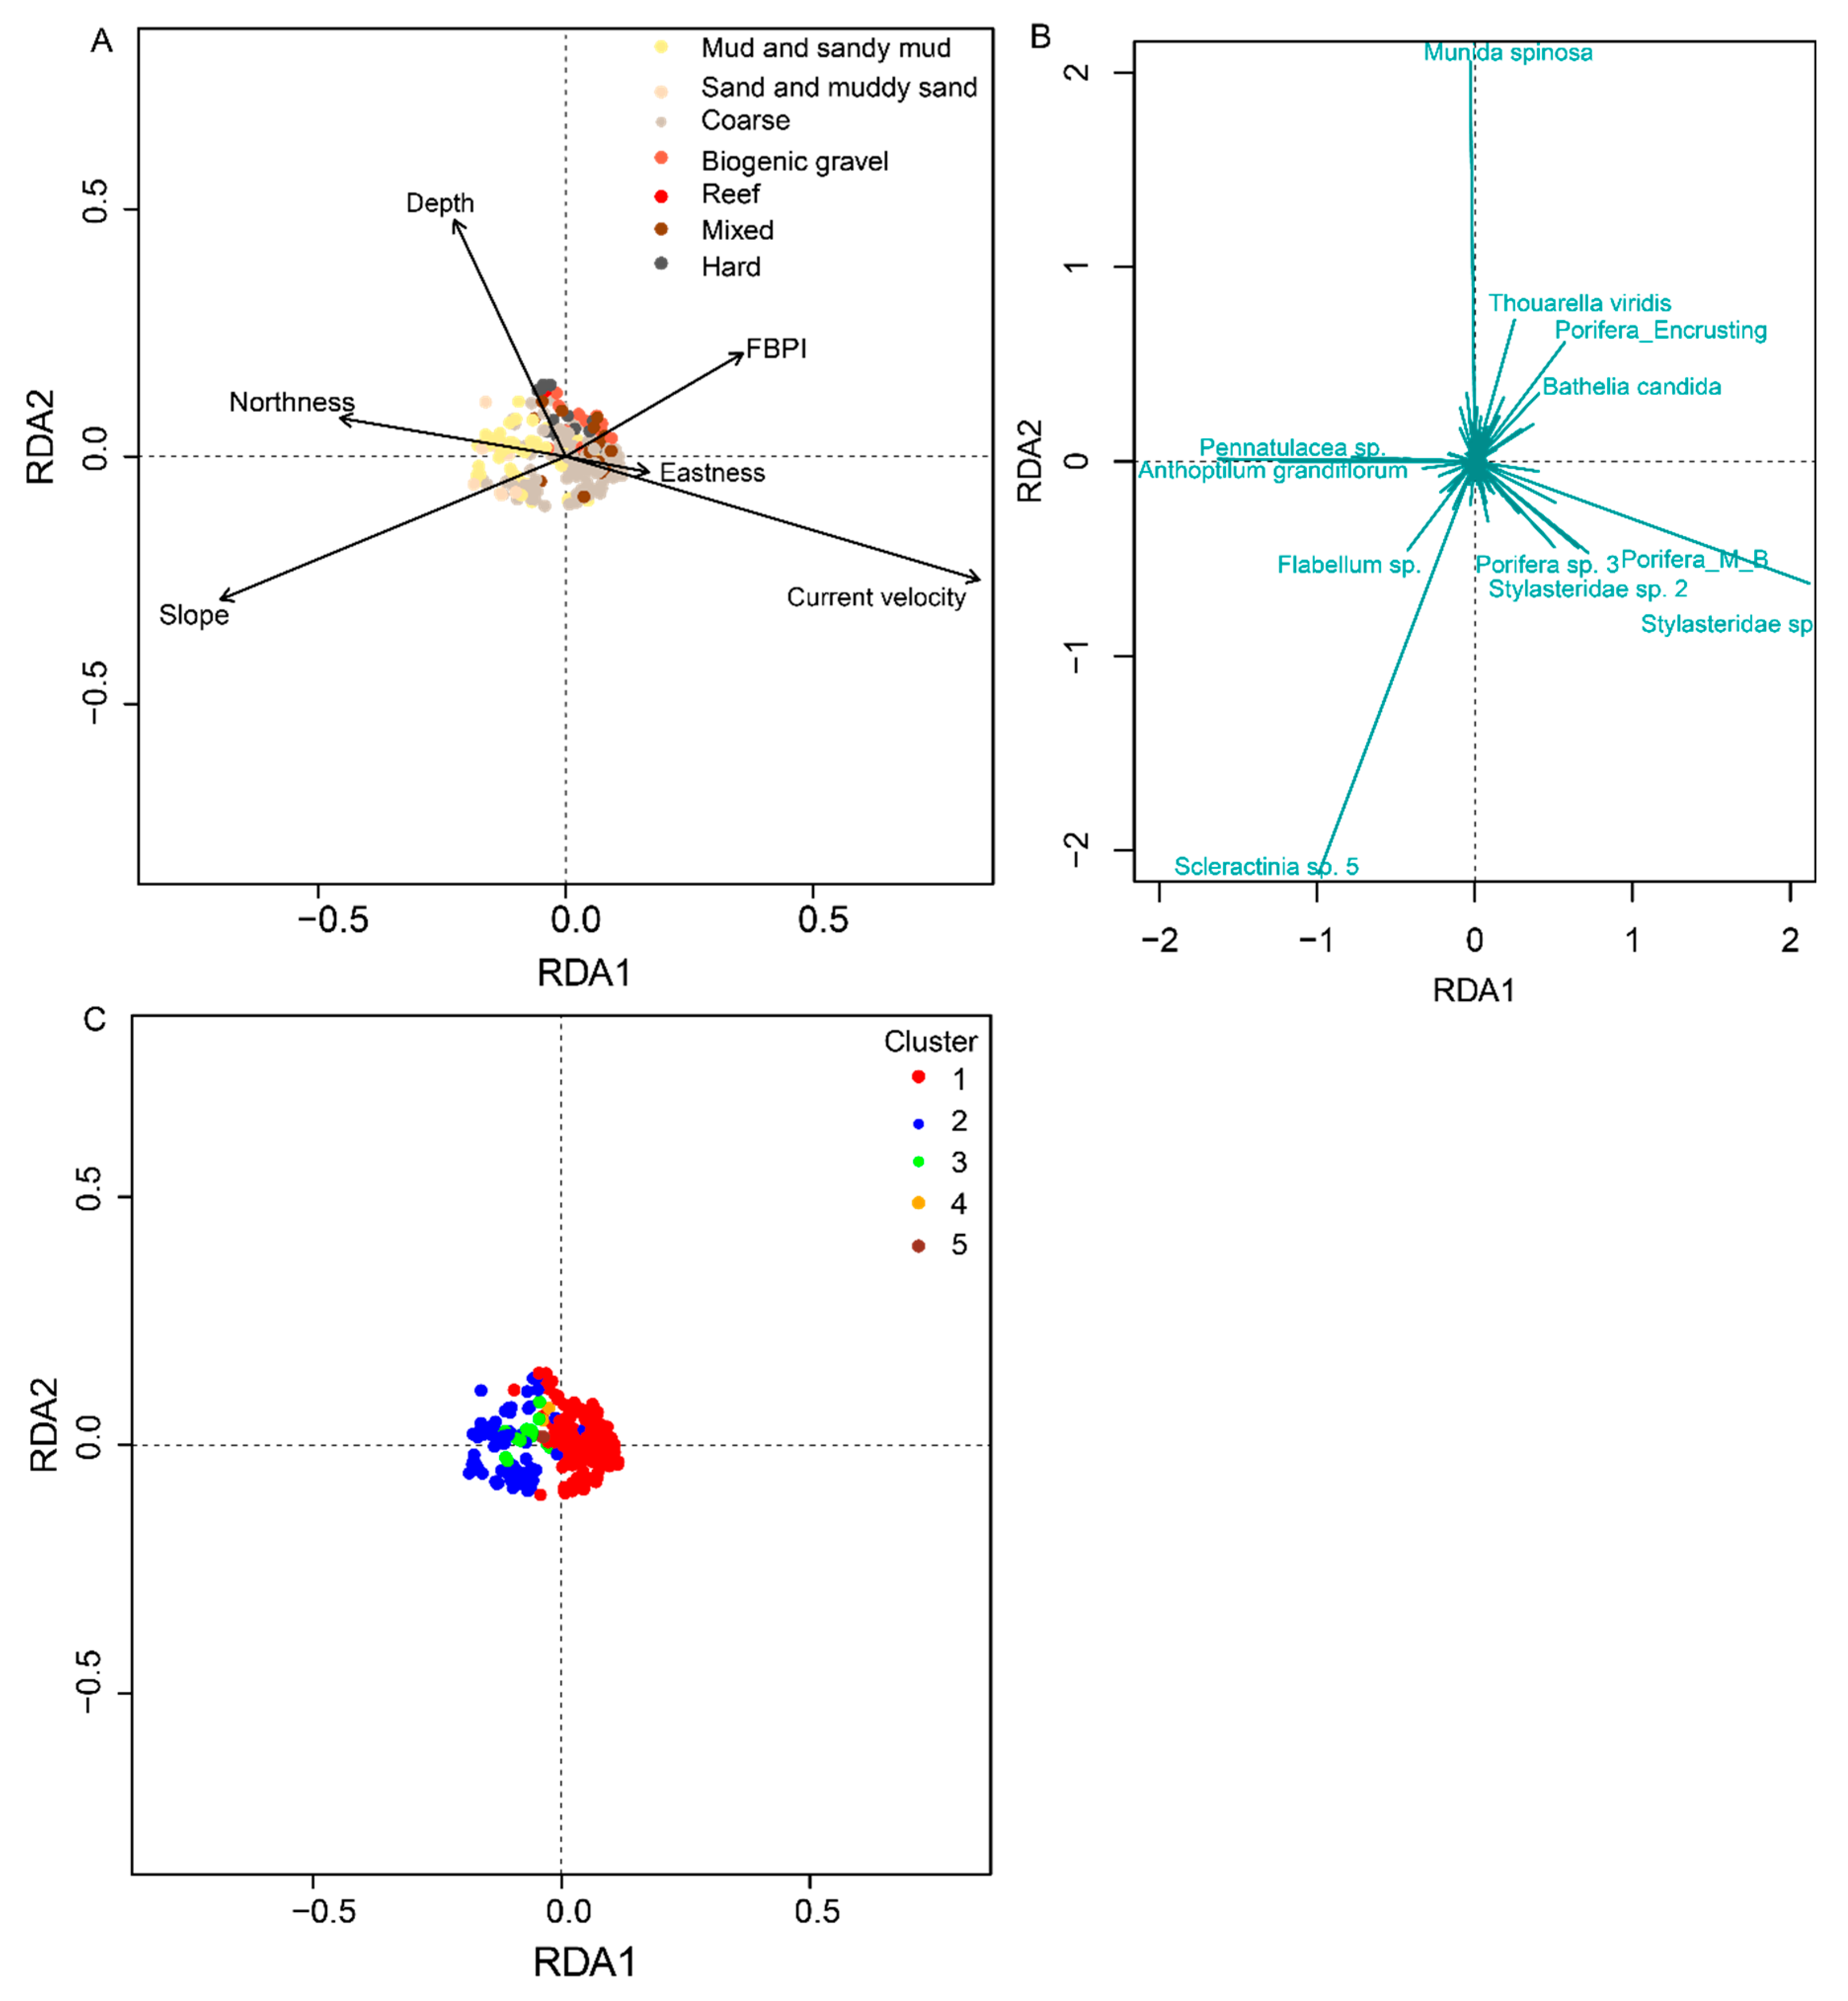
3.2. Environmental Drivers of Faunal Assemblages

The RDA analysis shows that current velocity, topography (depth, aspect, slope, and FBPI), and substrata influence faunal assemblages (adjusted R2 13%) (Figure 5 and Table 3). The first axis of the RDA plot (Figure 5) represents a gradient from sandy muds to coarse, and then hard (including reef) substrata, with increasing current velocity, and from relatively smooth broad-scale sloping topography to more rugged flatter topography. The second axis of the RDA plot represents a depth gradient.

4. Discussion

4.1. Deep-Sea Epibenthic Megafaunal Assemblages of the Falkland Islands

Our multivariate analysis has enabled the first quantitative characterisation of deep-sea epibenthic megafaunal assemblages within the FCZs, and contributes toward our understanding of environmental factors influencing southern Patagonian deep-sea assemblages.
Quantitative analysis identified three main assemblages that are composed of taxa with southern Patagonian shelf/slope distributions, and are characterised by fragile habitat-forming taxa considered indicators and/or components of VMEs [12,106].
Although B. candida was not identified as a characteristic species of cluster one, it was observed forming reef-like structures with an associated fauna of M. spinosa, T. viridis, and encrusting Porifera (Figure 2A), depicted as species vectors diverging from the rest of cluster one in the RDA plot (Figure 5). Bathelia candida is a framework-forming Scleractinian with a Southwest Atlantic distribution, occurring in the offshore waters of southern South America from Rio Grande to Southern Chile [22,23]. Bathelia candida is reported along the Patagonian shelf and slope [22,23,24,29,37], with recent discoveries of reefs described from the nearby Perito Moreno Terrase [29,31,40,42,49] and a coral mound province from Argentina (Northern Argentine Mound Province) [24]. In the FCZs, B. candida was observed as single discrete colonies and forming continuous framework reef structures (Figure 2A). Bathelia candida is a less-known framework-forming Scleractinian compared to Lophelia pertusa (recently synonymised to Desmophyllum pertusum [107]), Madrepora oculata, and Solenosmilia variabilis [97,108,109]; our observations add to the known distribution of this species and to our knowledge, also represent the most southerly record of reef habitat for B. candida in the Southwest Atlantic.
Bathelia candida was observed forming reef-like structures that are of ecological importance in the area. Cold-water coral reefs are generally regarded as long-lived [73], relatively slow growing [73,77,78], structurally complex [23,31,110,111], and functional significant habitats that, due to their life history characteristics, exhibit high fragility to fishing impacts [76], and as such, are recognised as VME habitats. Cold-water coral reefs increase structural complexity provided by living and dead coral frameworks, which provide a hard substrate that increases environmental heterogeneity, resulting in increased biodiversity of associated fauna [109,110]. Cold-water coral reefs are also nursery habitats for numerous species, including commercially important fish species [97,112,113,114,115,116]. In our study, corals, sponges and bryozoa were observed growing on B. candida frameworks and rubble (Figure 2A), while M. spinosa were seen beneath rubble. These observations are consistent with descriptions and bycatch records from the Patagonian shelf edge and slope [31,32,37,40,42,49]. Similarly, corals, sponges, and bryozoa have been observed on D. pertusum reefs [52,117] in the Northeast Atlantic, and Munida squat lobsters have been observed seeking refuge beneath D. pertusum coral rubble [54,118]. Little is known of the ecology of B. candida reefs, but our observations of similar faunal associations support the hypothesis that their functional role is analogous to that of D. pertusum reefs [29], and therefore, B. candida reefs represent important features within the FCZs.
Bathelia candida was also observed forming non-reef aggregations with Alcyonacea (including formally Gorgonacea), large Stylasteridae, and erect Porifera. These “hard-bottomed coral garden” VMEs were commonly observed on coarser substrata and glacial dropstones (Figure 2B). Coral gardens comprising similar taxa to those observed in our study have been described from the Patagonian shelf edge and slope [17,29,31,37,38,40,42,49], including the Burdwood Bank [17,37,38], indicating a continuous southern Patagonian distribution of this assemblage, for which the Burdwood Bank and FCZs likely act as source locations connected to northern populations via the northeastward flow of the Falkland Current.
There were certain areas where some characteristic species of cluster one exhibited higher dominance and abundances (Table 1 and Figure 5). Stylasteridae and sponges (predominantly belonging to Hexactinellida and Demospongiae) were observed across coarse substrata, and, in certain areas, exhibited higher dominance and abundances (Figure 2C and Table 1), depicted as species vectors diverging from the rest of cluster one in the RDA plot (Figure 5). Sponge aggregations have been recorded from the Patagonian shelf [31,37,40,42,49], and are generally a common component of epifaunal assemblages that often represent the dominant taxa by biomass [37,119,120]. “Deep-sea sponge aggregations” are considered VMEs [77,121] due to their functional role in benthic–pelagic coupling via carbon and nutrient cycling [122,123] and their structural complexity, which can enhance and create structurally complex habitats [91,124,125,126,127,128]. In turn, these habitats increase associated biodiversity, and provide nurseries and refuge [51,91,129]. On the other hand, sponge fragility, longevity [77,130,131], and other life history characteristics hinder their ability to recover [77], making them vulnerable to anthropogenic impacts. Sponge morphology has been shown to influence the composition, diversity, and abundance of associated fauna [91,126,132]. In our study, the most frequently annotated sponges were Massive Ball morphotypes, which have relatively low structural complexity. However, it is possible that at specific densities, these sponges may act together with sparser erect branching sponges to increase habitat structural complexity [51,91,128,132,133]. Sponge densities exceeding the OSPAR threshold for designating sponge aggregations (0.5–24 sponges/m2) [133] were recorded from the study area (Supplementary Table S2), and often coincided with increased sponge diversity. However, OSPAR criteria require that sponges represent the dominant characterising taxa within the assemblage [134], whereas in our study, Stylasteridae, which co-occurs with sponges, is also a characteristic taxa of the assemblage (Figure 5 and Table 2). Further research will be required to ascertain the functional significance of this assemblage in the FCZ, and whether it meets the criteria of a “Deep-sea sponge aggregation” VME.
The sea pen and solitary cup coral assemblages represented by clusters two and three (Figure 5 and Table 2) were observed from soft substrata (Figure 2D–F). Solitary cup corals predominantly occupy upper slope environments, and Flabellum-dominated “cup coral fields” have been recorded along the Patagonian slope [23,32,49], while other cup coral species exhibit southern Patagonian restricted ranges [23]. Cup coral fields are considered a type of “soft-bottomed coral garden” VME habitat [31,42,77]. Little is known of the ecology of Southwest Atlantic cup coral fields. However, it is likely that Southwest Atlantic “cup coral fields” support similar functional roles as “solitary Scleractinian fields” described from slope environments of the Northeast Atlantic [135].
In our study, the sea pen Pennatulacea sp. could not be discerned to species level from imagery, but resembled the genus Balticina (formally Halipteris). Anthoptilum grandiflorum and Balticina have circumglobal deep-sea distributions, and have been recorded along the Patagonian shelf and slope, including the northwest slope of the Burdwood Bank [17,39,42]. “Sea pen fields” have previously been described from the FCZs [36], and inferred from trawl bycatch off of the Argentine slope [32] and northwest slope of the Burdwood Bank [17,39]. Sea pen fields are considered VME habitats [31,42,77] because they are long-lived, slow growing, fragile taxa, and can form meadows that [136,137,138] act as nurseries [139] and increase local biodiversity [136] by providing structural complexity and habitat heterogeneity [110]. In the Northwest Atlantic, 14 species of sea pen were associated with A. grandiflorum and H. finmarchica [39,136], while in the Southwest Atlantic, the anemone Hormathia pectinata is found growing on A. grandiflorum [39]. Brewin et al., (2020) conducted a spatial analysis of predicted sea pen distributions in relation to fishing footprints, and suggested that sea pen assemblages have a restricted distribution within the FCZ, and as such, are most vulnerable to fishing. Their study modelled sea pen fields as a monospecific habitat, whereas our study has shown that there is variation between sea pen assemblages based on the dominant sea pen and cup coral species present (Figure 2, Figure 3, Figure 4 and Figure 5 and Table 2). The fact that sea pen fields of the FCZs are not comprised of a monospecific assemblage further increases their vulnerability, as the spatial extent of each variant is less than predicted when modelled as a single assemblage; therefore, our findings should be considered in future fishing impact assessments.
In addition to the main assemblages identified from our analysis, VME indicator taxa indicative of VMEs, namely “bryozoan patches”, “tube-dwelling anemone patches comprised of Cerianthidae”, and “chemosynthetic communities”, were also observed (see Supplementary Table S2). However, these assemblages were not differentiated from the broader assemblages (Figure 3 and Figure 5), probably because they did not form large aggregations or patches, and due to the commonality of Stylasteridae and Porifera morphospecies that maintained cluster similarity (see Supplementary Table S2 and Figure S3).
Our analysis of epibenthic megafauna is based upon the annotation of morphospecies. Morphospecies enable taxa to be differentiated beyond the level of taxonomic hierarchy achievable using traditional taxonomic features that cannot be discerned from imagery. Distinguishing morphologically distinct taxa (which are therefore likely to be taxonomically distinct) preserves important information on biodiversity [90]. However, there are limitations with using morphospecies as units because faunal groups with similar gross morphology, which rely upon microscopic features to distinguish species, can result in multiple species being annotated as a single morphospecies. In our study, the morphospecies that are most likely to have been susceptible to this bias are encrusting Porifera and Massive Ball Porifera because many sponge species have adopted this gross morphology. Despite the potential of “clumping” species together within a single morphospecies, our analysis discerned differences in megafauna assemblages that are characterised by taxa that differ at high taxonomic levels, where the chance of misidentification is lower (i.e., Pennatulacea versus Stylasteridae), and thus, still provides useful insight into megafaunal assemblages of the FCZ. To support further research, future efforts should look toward collaborative imagery databases that will enable consistency in annotation of morphospecies [90], and species identifications from imagery should be verified with specimens when possible.

4.2. Environmental Drivers of Faunal Assemblages

Knowledge of broad-scale environmental drivers of deep-sea faunal assemblages is relatively well established [103,140,141,142]. However, our understanding of how these environmental drivers interact and influence deep-sea faunal assemblages in the Southwest Atlantic is poorly understood. Our lack of knowledge is, in part, reflective of the scant available data that limits research. For example, in our study, the low variance explained in the RDA analysis (Table 3) likely reflects the broad resolution of environmental variables incorporated into the model, which inadequately discerned the fine-scale environmental variability influencing faunal assemblages [57] (i.e., patchy distribution of glacial dropstones and fine-scale geomorphological features). Despite this, our analysis still provides useful insight into the broad-scale drivers of deep-sea faunal assemblages on the FCZs slope, and suggests that topography, substrata, and current velocity interact to influence deep-sea faunal assemblages of the FCZ slope (Figure 5 and Table 3).
Our analysis also shows a clear distinction between soft- and hard-bottom epibenthic assemblages (Figure 5), which correlated with topography (captured by the terrain variables and depth). Topography and the distribution of substrata are intrinsically linked, and influence faunal distributions [57,102,143] by providing a variety of substratum for colonisation [144,145]. Soft sediments dominate the slope of the Falkland Trough, and the relationship between this large geomorphological feature (captured by increased slope) and the soft-bottom sea pen and cup coral assemblages is shown in the RDA plot as a positive relationship between slope and mud/sand substrata (Figure 5). The topography and substrata of the upper slope of the Falkland Plateau is more complex, with evidence of contour aligned escarpments, drifts, and ice-rafted debris [62,63,64,65,66,67]. The presence of contour-aligned geomorphology and substrata indicates the influence of contour currents [146]. The Falkland Current is associated with depositional contourites and erosive features that follow the bathymetric contours on the Argentine slope [147]. The Falkland Current also flows along the slope of the Falkland Plateau [29,84], and it is therefore likely that this area experiences a similar bottom-current-controlled environment. Coral mound distributions, including those within the Northern Argentine Mound Province [24] have been directly linked to the geomorphology and substrata of regional contourite depositional systems [24,148]. In our study, the coral reef assemblage also appears to be influenced by the geomorphology and substrata, as reefs were observed from biogenic, coarse, and hard substrate associated with erosive escarpment features, which was captured in the RDA as a positive relationship between FBPI and coarser substrata (Figure 5). Filter feeders, including cold-water corals, are preferential to complex terrain [104,149,150,151,152,153,154], colonising topographic highs to exploit local current regimes, and so increase food encounter rates [154,155].
Glacial dropstones also appear to be important structures that can support “hard-bottomed coral garden” assemblages (Figure 2B). In the Northeast Atlantic, glacial dropstones occurring within soft substrata are considered “keystone structures” [57], and in a study of East Antarctic shelf fauna, dropstones were attributed to increasing diversity by increasing habitat heterogeneity [156]. In the FCZ, dropstones are distributed independent of geomorphology, and often provide hard substrata in otherwise soft substratum environments, enabling epibenthos to exploit these environments and in doing so could also be considered keystone structures.
The characteristic taxa of the assemblages observed (Porifera, Cnidaria, Hydrozoa, Alcyonacea, Scleractinia, Pennatulacea, etc.) are predominately suspension/filter feeders.
Filter feeders consume plankton and particulate organic matter (POM) [157,158], while some groups, such as sponges and bivalves, are also able to uptake dissolved organic matter [122,123] and bacteria [159]. Surface-derived POM [113,160] is an important deep-sea food resource, which in the FCZs is enhanced by the nutrient-rich Falkland Current that provides a constant influx of nutrient-rich sub-Antarctic waters along the shelf break and upper slope [29,84]. On the Argentine margin, the Falkland Current is hypothesised to facilitate cold-water coral reef growth via upwelling at the shelf, and associated surface primary production that forms an important source of POM for the fauna below [29]. In the FCZs, the interaction between the Falkland Current and underlying topography generates mesoscale eddies that facilitate the exchange of heat, momentum, and nutrients between the deep and surface waters, thus promoting surface productivity [161,162]. In our analysis, the hard-bottom coral assemblages show a positive correlation, with increased FBPI and current speed (Figure 5), and occur beneath areas of eddy formation [161], suggesting that coral assemblages of the FCZ are sustained by topography-generated eddies of the Falkland Current. This observation further supports the role of the Falkland Current in sustaining coral assemblages by enhancing food supply along the Patagonian slope [29]. Similar scenarios, where cold-water corals flourish beneath topographically modified hydrodynamics that promote and source POM, have been recorded in the Northeast [102,153,155,163,164,165] and Southeast Atlantic [59,165]. Undertaking further research to understand more about the Falkland Current driven surface–benthic coupling would provide invaluable information for understanding the ecology of these assemblages.
In addition to hydrodynamics, water mass properties are a key determinant of faunal composition in the deep sea [26,33,53,69,142,166,167]. Auscavitch and Waller (2017) made a comparison of faunal assemblages across the Drake Passage, including samples from the Burdwood Bank, which highlighted the influence of deep Southern Ocean water masses on assemblage structure. In the Northern Argentine Mound Province, the AAIW has been linked to coral mound development [24], and the high level of Scleractinian endism (65% of recorded species) on the Patagonian upper slope (200–1000 m) correlates with cold–temperate water masses [23]. The fauna observed during our study occur within the AAIW, and are consistent with records reported elsewhere from the southern Patagonian shelf break and slope [17,29,32,37,38,49]. This observation further supports the hypothesis of deep-sea species having a continuous distribution along the southern Patagonian shelf and slope [37], facilitated by the northeastward flow of the Falkland Current [84] and the AAIW.

5. Conclusions

We have undertaken the first quantitative multivariate analysis of epibenthic megafauna in the FCZs, and identified several cold-water coral and sponge assemblages, with attributes of VMEs. Our results further support the argument for a continuous southern Patagonian deep-sea fauna. We have shown that broad-scale changes in topography, substrata, and current velocity contribute to assemblage structure, and hypothesise that the Falkland Current is a key phenomenon influencing faunal assemblages on the FCZs slope. The Falkland Current promotes surface productivity and bentho–pelagic coupling, which likely sustains the observed filter and suspension feeder-dominated assemblages. Over a larger temporal scale, the Falkland Current has also acted to shape the topography and distribution of substrata, in turn, influencing faunal assemblages on the slope. To gain a greater understanding of fine-scale drivers of faunal assemblage, the collection and incorporation of higher resolution environmental data is required, and species and habitat distribution maps should be compiled. Despite the limitations of data resolution, our results still provide much needed bioecological knowledge to underpin spatial management within the FCZs, and adds to our knowledge of the biogeography of this region, which will facilitate further comparative studies of epibenthic megafauna, and support the implementation of fisheries benthic impact assessments for the Southwest Atlantic deep-sea.

Supplementary Materials

The following supporting information can be downloaded at: https://www.mdpi.com/article/10.3390/d14080637/s1, Figure S1: Example images of substratum type based on the EUNIS Marine Habitat Classification (https://www.eea.europa.eu/data-and-maps/data/eunis-habitat-classification-1, accessed on 10 November 2020). (A) Mixed substratum EUNIS code A6.2 observed from location N-2-GEO-ENV. (B) Hard substratum EUNIS code A6.1 observed from location N-6-GEO-ENV. (C) Coarse substratum EUNIS code A5.15 observed from location N-4-ENV-GEO. (D) Biogenic gravel (annotated as a subtype of mixed substratum) EUNIS code A6.2 observed from location N-4-ENV-GEO. (E) Muddy sand EUNIS code A6.4 observed from location N-3-ENV. (F) Mud EUNIS code A6.5 observed from location T-003-ENV. (G) Biogenic reef (adapted from EUNIS Communities of deep-sea corals that refers to reefs of Desmophyllum pertusum) code A6.61 observed at location A-1008-ENV; Figure S2. Hierarchal cluster analysis of Hellinger distance matrix of transformed morphospecies density data. Cluster membership is shown by the coloured rectangles. Cluster 1 = red, 2 = blue, 3 = green, 4 = orange, 5 = brown; Figure S3. Contribution (percent of total) toward total abundance of morphospecies belonging to each of the five clusters after hierarchal cluster analysis; Figure S4. Examples of morphospecies that characterise epibenthic megafaunal assemblages in the Falkland Islands Conservation Zones. Scale bar = 30 cm. Table S1: Proposed drop-down camera station in decimal degrees (°) from three environmental baseline surveys conducted by Nobel Energy in 2014. (Falkland Islands Government Department of Mineral Resources, unpublished data); Table S2: Annotated morphopecies belonging to each cluster after hierarchal cluster analysis of 288 sample images. Mean density (m2) of each morphospecies within each cluster, total annotated and percent occurrence across images is provided for each morphospecies.

Author Contributions

Conceptualization of paper, T.R.R.P.; methodology, T.R.R.P. and P.B.; formal analysis, T.R.R.P.; data curation, T.R.R.P. and P.B.; writing—original draft preparation, T.R.R.P.; writing—review and editing, A.M.M.B., P.E.B. and P.B. All authors have read and agreed to the published version of the manuscript.

Funding

The research was undertaken as part of a project funded by Consolidated Fisheries Ltd., Stanley, Falkland Islands.

Institutional Review Board Statement

Not applicable.

Informed Consent Statement

Not applicable.

Data Availability Statement

Oceanographic data used in this study are accessible from http://marine.copernicus.eu and https://www.glodap.info/, accessed on 10 November 2020. Bathymetry is available at https://www.gebco.net/, accessed on 10 November 2020. Images are available upon request from the Falkland Islands Government Department of Mineral Resources.

Acknowledgments

The authors gratefully acknowledge Consolidated Fisheries Ltd. for support of this research. We thank the staff of the Falkland Islands Government Fisheries Department and Department of Mineral Resources for their support and helpful assistance in gathering various data. We thank the crews that collected the imagery data during the Noble surveys. We thank S. Cairns, N. Bax, C. Laguionie Marchais, M. Taylor, C. Goodwin and D. Morrissey for epifaunal identification help. The manuscript benefitted greatly from anonymous reviewer comments.

Conflicts of Interest

The authors declare no conflict of interest.

References

  1. Davies, A.; Roberts, M.; Hall-Spencer, J. Preserving Deep-Sea Natural Heritage: Emerging Issues in Offshore Conservation and Management. Biol. Conserv. 2007, 138, 229–312. [Google Scholar] [CrossRef]
  2. Puig, P.; Canals, M.; Company, J.; Martin, J.; Amblas, A.; Lastras, G.; Palanques, A.; Calafat, A. Ploughing the Deep Sea Floor. Nature 2012, 489, 286–289. [Google Scholar] [CrossRef] [PubMed] [Green Version]
  3. Van Dover, C.L.; Aronson, J.; Pendleton, L.; Smith, S.; Arnaud-Haond, S.; Moreno-Mateos, D.; Barbier, E.; Billett, D.; Bowers, K.; Danovaro, R.; et al. Ecological Restoration in the Deep Sea: Desiderata. Mar. Policy 2014, 44, 98–106. [Google Scholar] [CrossRef]
  4. Clark, M.R.; Althaus, F.; Schlacher, T.A.; Williams, A.; Bowden, D.A.; Rowden, A.A. The Impacts of Deep-Sea Fisheries on Benthic Communities: A Review. ICES J. Mar. Sci. 2016, 73, i51–i69. [Google Scholar] [CrossRef]
  5. Miller, K.A.; Thompson, K.F.; Johnston, P.; Santillo, D. An Overview of Seabed Mining Including the Current State of Development, Environmental Impacts, and Knowledge Gaps. Front. Mar. Sci. 2018, 4, 418. [Google Scholar] [CrossRef]
  6. Danovaro, R.; Dell’Anno, A.; Fabiano, M.; Pusceddu, A.; Tselepides, A. Deep-Sea Ecosystem Response to Climate Changes: The Eastern Mediterranean Case Study. Trends Ecol. Evol. 2001, 16, 505–510. [Google Scholar] [CrossRef]
  7. Ramirez-Llodra, E.; Tyler, P.A.; Baker, M.C.; Bergstad, O.A.; Clark, M.R.; Escobar, E.; Levin, L.A.; Menot, L.; Rowden, A.A.; Smith, C.R.; et al. Man and the Last Great Wilderness: Human Impact on the Deep Sea. PLoS ONE 2011, 6, e22588. [Google Scholar] [CrossRef] [Green Version]
  8. Sweetman, A.K.; Thurber, A.R.; Smith, C.R.; Levin, L.A.; Mora, C.; Wei, C.; Gooday, A.J.; Jones, D.O.B.; Rex, M.; Yasuhara, M.; et al. Major Impacts of Climate Change on Deep-Sea Benthic Ecosystems. Elem. Sci. Anthr. 2017, 5, 4. [Google Scholar] [CrossRef]
  9. Levin, L.A.; Wei, C.L.; Dunn, D.C.; Amon, D.J.; Ashford, O.S.; Cheung, W.W.L.L.; Colaço, A.; Dominguez-Carrió, C.; Escobar, E.G.; Harden-Davies, H.R.; et al. Climate Change Considerations Are Fundamental to Management of Deep-Sea Resource Extraction. Glob. Chang. Biol. 2020, 26, 4664–4678. [Google Scholar] [CrossRef]
  10. Danovaro, R.; Fanelli, E.; Canals, M.; Ciuffardi, T.; Marie-claire, F.; Taviani, M. Archimer Towards a Marine Strategy for the Deep Mediterranean Sea: Analysis of Current Ecological Status. Mar. Policy 2020, 112, 103781. [Google Scholar] [CrossRef]
  11. UNGA United Nations General Assembly. Sustainable Fisheries, Including through the 1995 Agreement for the Implementation of the Provisions of the United Nations Convention on the Law of the Sea of 10 December 1982 Relating to the Conservation and Management of Straddling Fish Stocks and Highly Migratory Fish Stocks, and Related Instruments; General Assembly Resolution 64/72, A/RES/64/72; UNGA: New York, NY, USA, 2009. [Google Scholar]
  12. FAO. International Guidelines for the Management of Deep-Sea Fisheries in the High Seas; FAO: Rome, Italy, 2009; 73p. [Google Scholar]
  13. Doxa, A.; Almpanidou, V.; Katsanevakis, S.; Queiros, A.M.; Kaschner, K.; Garilao, C.; Kesner-Reyes, K.; Mazaris, A.D. 4D Marine Conservation Networks: Combining 3D Prioritization of Present and Future Biodiversity with Climatic Refugia. Glob. Chang. Biol. 2022, 28, 4577–4588. [Google Scholar] [CrossRef] [PubMed]
  14. Combes, M.; Vaz, S.; Grehan, A.; Morato, T. Systematic Conservation Planning at an Ocean Basin Scale: Identifying a Viable Network of Deep-Sea Protected Areas in the North Atlantic and the Systematic Conservation Planning at an Ocean Basin Scale: Identifying a Viable Network of Deep-Sea Protected. Front. Mar. Sci. 2021, 8, 611358. [Google Scholar] [CrossRef]
  15. Danovaro, R.; Company, J.B.; Corinaldesi, C.; Onghia, G.D.; Galil, B.; Gambi, C.; Gooday, A.J.; Lampadariou, N.; Luna, G.M.; Morigi, C.; et al. Deep-Sea Biodiversity in the Mediterranean Sea: The Known, the Unknown, and the Unknowable. PLoS ONE 2010, 5, e11832. [Google Scholar] [CrossRef] [PubMed] [Green Version]
  16. Ramirez-Llodra, E.; Brandt, A.; Danovaro, R.; De Mol, B.; Escobar, E.; German, C.R.; Levin, L.A.; Martinez Arbizu, P.; Menot, L.; Buhl-Mortensen, P.; et al. Deep, Diverse and Definitely Different: Unique Attributes of the World’s Largest Ecosystem. Biogeosciences 2010, 7, 2851–2899. [Google Scholar] [CrossRef] [Green Version]
  17. Schejter, L.; Bremec, C.; Genzano, G.; Gaitán, E.; Perez, C. Benthic Communities in the Southwest Atlantic Ocean: Conservation Value of Animal Forests at the Burdwood Bank Slope. Aquat. Conserv. Mar. Freshw. Ecosyst. 2020, 30, 426–439. [Google Scholar] [CrossRef]
  18. Bernal, M.C.; Cairns, S.D.; Penchaszadeh, P.E.; Lauretta, D. Stylasterids (Hydrozoa: Stylasteridae) from Mar Del Plata Submarine Canyon and Adjacent Area (Southwestern Atlantic), with a Key to the Species off Argentina. Zootaxa 2021, 4969, 401–452. [Google Scholar] [CrossRef]
  19. Lauretta, D.; Martinez, M.I. Corallimorpharians (Anthozoa: Corallimorpharia) from the Argentinean Sea. Zootaxa 2019, 4688, 249–263. [Google Scholar] [CrossRef]
  20. Fernandez, M.O.; Collins, A.G.; Marques, A.C. Gradual and Rapid Shifts in the Composition of Assemblages of Hydroids (Cnidaria) along Depth and Latitude in the Deep Atlantic Ocean. J. Biogeogr. 2020, 47, 1541–1551. [Google Scholar] [CrossRef]
  21. Cordeiro, R.T.; Neves, B.M.; Kitahara, M.V.; Arantes, R.C.; Perez, C.D. First Assessment on Southwestern Atlantic Equatorial Deep-Sea Coral Communities. Deep. Res. Part I Oceanogr. Res. Pap. 2020, 163, 103344. [Google Scholar] [CrossRef]
  22. Cairns, S.D. Antarctic and Subantarctic Scleractinia. Antarct. Res. Ser. 1983, 34, 1–74. [Google Scholar] [CrossRef]
  23. Cairns, S.D.; Polonio, V. New Records of Deep-Water Scleractinia off Argentina and the Falkland Islands. Zootaxa 2013, 3691, 58–86. [Google Scholar] [CrossRef] [PubMed] [Green Version]
  24. Steinmann, L.; Baques, M.; Wenau, S.; Schwenk, T.; Spiess, V.; Piola, A.R.; Bozzano, G. Discovery of a Giant Cold-Water Coral Mound Province along the Northern Argentine Margin and Its Link to the Regional Contourite Depositional System and Oceanographic Setting. Mar. Geol. 2020, 427, 106223. [Google Scholar] [CrossRef]
  25. Sumida, G.; Yukio, M.; Antonio, L.; Madureira, S.; Hovland, M.; Sumida, P.Y.G.; Yoshinaga, M.Y.; Madureira, S.; Hovland, M. Seabed Pockmarks Associated with Deepwater Corals off SE Brazilian Continental Slope, Santos Basin. Mar. Geol. 2004, 207, 159–167. [Google Scholar] [CrossRef]
  26. Arantes, R.C.M.; Castro, C.B.; Pires, D.O.; Seoane, J.C.S. Depth and Water Mass Zonation and Species Associations of Cold-Water Octocoral and Stony Coral Communities in the Southwestern Atlantic. Mar. Ecol. Prog. Ser. 2009, 397, 71–79. [Google Scholar] [CrossRef] [Green Version]
  27. Sumida, P.Y.G.; Bernardino, A.F.; Léo De, F.C. Brazilian Deep-Sea Biodiversity; Springer: Cham, Switzerland, 2020; ISBN 2520-1077. [Google Scholar]
  28. Saeedi, H.; Bernardino, A.F.; Shimabukuro, M.; Falchetto, G.; Sumida, P.Y. Macrofaunal Community Structure and Biodiversity Patterns Based on a Wood-Fall Experiment in the Deep South-West Atlantic. Deep Sea Res. Part I Oceanogr. Res. Pap. 2019, 145, 73–82. [Google Scholar] [CrossRef]
  29. Muñoz, A.; Cristobo, J.; Rios, P.; Druet, M.; Polonio, V.; Uchupi, E.; Acosta, J.; Group, A. Sediment Drifts and Cold-Water Coral Reefs in the Patagonian Upper and Middle Continental Slope. Mar. Pet. Geol. 2012, 36, 70–82. [Google Scholar] [CrossRef] [Green Version]
  30. Bremec, C.; Scientific, N.; Schejter, L.; Giberto, D. Benthic Invertebrates By-Catch of Demersal Fisheries: A Comparison between Subantactic and Antarctic Shelf Waters (45° S–57° S). Ber. Polar-Meeresforsch. 2005, 507, 179–181. [Google Scholar]
  31. Oliver, M. Informe de la Campana de Investigacion Pesquera Atlantis 2009; Vigo Oceanographic Center, Spanish Institute of Oceanography: Madrid, Spain, 2009. [Google Scholar]
  32. Brewin, P.E.; Farrugia, T.J.; Jenkins, C.; Brickle, P. Straddling the Line: High Potential Impact on Vulnerable Marine Ecosystems by Bottom-Set Longline Fishing in Unregulated Areas beyond National Jurisdiction. ICES J. Mar. Sci. 2020, 78, 2132–2145. [Google Scholar] [CrossRef]
  33. Schejter, L.; Albano, M. Benthic Communities at the Marine Protected Area Namuncurá/Burdwood Bank, SW Atlantic Ocean: Detection of Vulnerable Marine Ecosystems and Contributions to the Assessment of the Rezoning Process. Polar Biol. 2021, 44, 2023–2037. [Google Scholar] [CrossRef]
  34. Gabriel, E.; Tatia, M.; Lo, J.; Perez, C.D.; Cordeiro, R.T.; Bremec, C.S.; Schejter, L.; Rimondino, C.; Chiesa, I.; Díaz de Astarloa, J.M.; et al. Namuncurá Marine Protected Area: An Oceanic Hot Spot of Benthic Biodiversity at Burdwood Bank, Argentina. Polar Biol. 2016, 39, 2373–2386. [Google Scholar] [CrossRef] [Green Version]
  35. Schejter, L.; Acuña, F.H.; Garese, A.; Cordeiro, R.T.S.; Pérez, C.D. Sea Pens (Cnidaria: Pennatulacea) from Argentine Waters: New Distributional Records and First Report of Associated Anemones. Pan-Am. J. Aquat. Sci. 2018, 13, 292–301. [Google Scholar]
  36. Cristobo, J.; Portela, J.R.; Acosta, J.; Ríos, P.; Luis, J.; Yepes, J.A. La Investigación de Los Ecosistemas Marinos Vulnerables En Aguas Internacionales Del Atlántico Suroccidental y de Las Posibles Interacciones Con Las Actividades Pesqueras: El Proyecto ATLANTIS. In Proceedings of the XVI Simposio Ibérico de Estudios de Biología Marina, Alicante, Spain, 6–10 September 2010. [Google Scholar]
  37. Downie, A.L.; Vieira, R.P.; Hogg, O.T.; Darby, C. Distribution of Vulnerable Marine Ecosystems at the South Sandwich Islands: Results from the Blue Belt Discovery Expedition 99 Deep-Water Camera Surveys. Front. Mar. Sci. 2021, 8, 652. [Google Scholar] [CrossRef]
  38. Portela, J.; Acosta, J.; Cristobo, J.; Muoz, A.; Parra, S.; Ibarrola, T.; Del Ro, J.L.; Vilela, R.; Ros, P.; Blanco, R.; et al. Management Strategies to Limit the Impact of Bottom Trawling on VMEs in the High Seas of the SW Atlantic. In Marine Ecosystems; IntECH: Rijeka, Croatia, 2012; pp. 199–228. [Google Scholar]
  39. Portela, J.; Cristobo, J.; Ríos, P.; Acosta, J.; Parra, S. A First Approach to Assess the Impact of Bottom Trawling over Vulnerable Marine Ecosystems on the High Seas of the Southwest Atlantic. In Biodiversity in Ecosystems: Linking Structure and Function; IntECH: Rijeka, Croatia, 2015; pp. 271–298. [Google Scholar] [CrossRef] [Green Version]
  40. del Rio, J.; Acosta, J.; Cristobo, J.; Portela, J.; Al, E. Estudio de Los Ecosistemas Marinos Vulnerables en Aguas Internacionales del Atlántico Sudoccidental; Instituto Español de Oceanografía: Madrid, Spain, 2012. [Google Scholar]
  41. Teso, V.; Urteaga, D.; Pastorino, G. Assemblages of Certain Benthic Molluscs along the Southwestern Atlantic: From Subtidal to Deep Sea. BMC Ecol. 2019, 19, 49. [Google Scholar] [CrossRef] [Green Version]
  42. Schejter, L.; Bremec, C.S.; Cairns, S.D. Scleractinian corals recorded in the Argentinean Antarctic expeditions between 2012 and 2014, with comments on Flabellum (Flabellum) areum Cairns, 1982. Polar Res. 2016, 35, 29762. [Google Scholar] [CrossRef] [Green Version]
  43. OBIS. Available online: http://www.iobis.org/ (accessed on 14 July 2021).
  44. Williams, A.; Althaus, F.; Schlacher, T.A. Towed Camera Imagery and Benthic Sled Catches Provide Different Views of Seamount Benthic Diversity. Limnol. Oceanogr.-Methods 2015, 13, 62–73. [Google Scholar] [CrossRef] [Green Version]
  45. Schejter, L.; Bremec, C.S.; Ocean, S.W.A.; Schejter, L.; Bremec, C.S. Stony Corals (Anthozoa:Scleractinia) of Burdwood Bank and Neighbouring Stony Corals (Anthozoa:Scleractinia) of Burdwood Bank and Neighbouring Areas, SW Atlantic Ocean. Sci. Mar. 2019, 83, 247–260. [Google Scholar] [CrossRef]
  46. Neal, L.; Paterson, G.L.J.J.; Blockley, D.; Scott, B.; Sherlock, E.; Huque, C.; Glover, A.G. Biodiversity Data and New Species Descriptions of Polychaetes from Offshore Waters of the Falkland Islands, an Area Undergoing Hydrocarbon Exploration. Zookeys 2020, 938, 1–86. [Google Scholar] [CrossRef]
  47. Perez, C.D.; Zamponi, M.O. New Records of Octocorals (Cnidaria, Anthozoa) from the South Western Atlantic Ocean, with Zoogeographic Considerations. Zootaxa 2004, 630, 1–12. [Google Scholar] [CrossRef]
  48. Kitahara, M.V. Species Richness and Distribution of Azooxanthellate Scleractinia in Brazil Species Richness and Distribution of Azooxanthellate Scleractinia in Brazil. Bull. Mar. Sci. 2015, 81, 497–518. [Google Scholar]
  49. Portela, J.; Acosta, J.; Parra-Descalzo, S.; Cristobo, J.; Tel, E.; Río-Iglesias, J.L.; Pereiro-Muñoz, J.A.; Elvira, E.; Patrocinio, T.; Ríos, P.; et al. Proyecto ATLANTIS: Informe Preliminar Sobre Ecosistemas Marinos Vulnerables en Aguas Internacionales del Atlántico Sudoccidental y de las Posibles Interacciones con la Actividad Pesqueras; Programa Pesquerías Lejanas: Madrid, Spain, 2009. [Google Scholar]
  50. Durden, J.; Schoening, T.; Althaus, F.; Friedman, A.; Garcia, R.; Glover, A.; Greinert, J.; Stout, N.; Jones, D.; Jordt, A.; et al. Perspectives in Visual Imaging for Marine Biology and Ecology: From Acquisition to Understanding. Oceanogr. Mar. Biol. 2016, 54, 510. [Google Scholar]
  51. Price, D.M.; Robert, K.; Callaway, A.; Lo Lacono, C.; Hall, R.A.; Huvenne, V.A.I. Using 3D Photogrammetry from ROV Video to Quantify Cold-Water Coral Reef Structural Complexity and Investigate Its Influence on Biodiversity and Community Assemblage. Coral Reefs 2019, 38, 1007–1021. [Google Scholar] [CrossRef] [Green Version]
  52. Bridges, A.E.H.; Barnes, D.K.A.; Bell, J.B.; Ross, R.E.; Howell, K.L. Benthic Assemblage Composition of South Atlantic Seamounts. Front. Mar. Sci. 2021, 8, 1530. [Google Scholar] [CrossRef]
  53. Davies, J.S.; Howell, K.L.; Stewart, H.A.; Guinan, J.; Golding, N. Defining Biological Assemblages (Biotopes) of Conservation Interest in the Submarine Canyons of the South West Approaches (Offshore United Kingdom) for Use in Marine Habitat Mapping. Deep. Res. Part II Top. Stud. Oceanogr. 2014, 104, 208–229. [Google Scholar] [CrossRef] [Green Version]
  54. Almond, P.M.; Linse, K.; Dreutter, S.; Grant, S.M.; Griffiths, H.J.; Whittle, R.J.; Mackenzie, M.; Reid, W.D.K.K. In-Situ Image Analysis of Habitat Heterogeneity and Benthic Biodiversity in the Prince Gustav Channel, Eastern Antarctic Peninsula. Front. Mar. Sci. 2021, 8, 614496. [Google Scholar] [CrossRef]
  55. Van Audenhaege, L.; Broad, E.; Hendry, K.R.; Huvenne, V.A.I. High-Resolution Vertical Habitat Mapping of a Deep-Sea Cliff Offshore Greenland. Front. Mar. Sci. 2021, 8, 621. [Google Scholar] [CrossRef]
  56. Robert, K.; Jones, D.O.B.; Huvenne, V.A.I. Megafaunal Distribution and Biodiversity in a Heterogeneous Landscape: The Megafaunal Distribution and Biodiversity in a Heterogeneous Landscape: The Iceberg-Scoured Rockall Bank, NE Atlantic. Mar. Ecol. Prog. Ser. 2014, 501, 67–88. [Google Scholar] [CrossRef] [Green Version]
  57. Orejas, C.; Gori, A.; Lo Iacono, C.; Puig, P.; Gili, J.M.; Dale, M.R.T.; Lo Iacono, C.; Puig, P. Cold-Water Corals in the Cap de Creus Canyon, Northwestern Mediterranean: Spatial Distribution, Density and Anthropogenic Impact. Mar. Ecol. Prog. Ser. 2009, 397, 37–51. [Google Scholar] [CrossRef]
  58. Orejas, C.; Wienberg, C.; Titschack, J.; Tamborrino, L. Madrepora Oculata Forms Large Frameworks in Hypoxic Waters off Angola (SE Atlantic). Sci. Rep. 2021, 11, 15170. [Google Scholar] [CrossRef]
  59. Beazley, L.; Kenchington, E.; Yashayaev, I.; Murillo, F.J. Drivers of epibenthic megafaunal composition in the sponge grounds of the Sackville Spur, northwest Atlantic. Deep Sea Res. Part I Oceanogr. Res. Pap. 2017, 98, 102–114. [Google Scholar] [CrossRef]
  60. NOBLE. Noble Energy. South Falklands Basin Environmental and Geochemical Program 2014—FIST Environmental Baseline and Habitat Survey Report; NOBLE: London, UK, 2014. [Google Scholar]
  61. NOBLE. Noble Energy. South Falklands Basin Environmental and Geochemical Program 2014—FISA Environmental Baseline and Habitat Survey Report; NOBLE: London, UK, 2014. [Google Scholar]
  62. NOBLE. Noble Energy. South Falklands Basin Environmental and Geochemical Program 2014—FINA Environmental Baseline and Habitat Survey Report; NOBLE: London, UK, 2014. [Google Scholar]
  63. FOGL Falkland Oil and Gas Ltd. Scotia East Site Survey March 2011 Survey Report 8668; FOGL Falkland Oil and Gas Ltd.: London, UK, 2011. [Google Scholar]
  64. FOGL Falkland Oil and Gas Ltd. Loligo Northwest Site Survey March 2011 Survey Report 8751; FOGL Falkland Oil and Gas Ltd.: London, UK, 2011. [Google Scholar]
  65. FOGL Falkland Oil and Gas Ltd. Hero Site Survey March 2011 Survey Report 8667; FOGL Falkland Oil and Gas Ltd.: London, UK, 2011. [Google Scholar]
  66. Schejter, L. Unveiling the Submarine Landscape of the Namuncurá Marine Protected Area, Burdwood Bank, SW Atlantic Ocean; P248-253 Instituto Nacional de Investigación y Desarrollo Pesquero: Mar del Plata, Argentina, 2017; Available online: http://hdl.handle.net/1834/17235 (accessed on 10 November 2020).
  67. Rockhopper Exploration PLC. Sea Lion Field Development Environmental Baseline Survey Report; Rockhopper Exploration PLC: Salisbury, UK, 2012. [Google Scholar]
  68. Rockhopper Exploration PLC. Sea Lion Post Drill Environmental Survey Environmental Report; Rockhopper Exploration PLC: Salisbury, UK, 2012. [Google Scholar]
  69. Auscavitch, S.R.; Waller, R.G. Biogeographical Patterns among Deep Sea Megabenthic Communities across the Drake Passage. Antarct. Sci. 2017, 29, 531–543. [Google Scholar] [CrossRef]
  70. Costello, M.J. Distinguishing Marine Habitat Classification Concepts for Ecological Data Management. Mar. Ecol. Prog. Ser. 2009, 397, 253–268. [Google Scholar] [CrossRef] [Green Version]
  71. Howell, K.L.; Davies, J.S.; Narayanaswamy, B.E. Identifying Deep-Sea Megafaunal Epibenthic Assemblages for Use in Habitat Mapping and Marine Protected Area Network Design. J. Mar. Biol. Assoc. U. K. 2010, 90, 33–68. [Google Scholar] [CrossRef]
  72. Danovaro, R.; Fanelli, E.; Aguzzi, J.; Billett, D.; Carugati, L.; Corinaldesi, C.; Anno, A.D.; Gjerde, K.; Jamieson, A.J.; Kark, S.; et al. Ecological Variables for Developing a Global Deep-Ocean Monitoring and Conservation Strategy. Nat. Ecol. Evol. 2020, 4, 181–192. [Google Scholar] [CrossRef] [PubMed]
  73. Fallon, S.; Thresher, R.; Adkins, J. Age and Growth of the Cold-Water Scleractinian Solenosmilia Variabilis and Its Reef on SW Pacific Seamounts. Coral Reefs 2014, 33, 31–38. [Google Scholar] [CrossRef]
  74. Risk, M.J.; Heikoop, J.M.; Snow, N.; Beukens, R. Lifespans and Growth Patterns of Two Deep-Sea Corals: Primnoa resedaeformis and Desmophyllum cristagalli. Hydrobiologia 2002, 471, 125–131. [Google Scholar] [CrossRef]
  75. Adkins, J.; Henderson, G.; Wang, S.-L.; O’Shea, S.; Mokadem, F. Growth Rates of the Deep-Sea Scleractinia Desmophyllum cristagalli and Enallopsammia rostrata. Earth Planet. Sci. Lett. 2004, 227, 481–490. [Google Scholar] [CrossRef]
  76. Althaus, F.; Williams, A.; Schlacher, T.A.; Kloser, R.J.; Green, M.A.; Barker, B.A.; Bax, N.J.; Brodie, P. Impacts of Bottom Trawling on Deep-Coral Ecosystems of Seamounts Are Long-Lasting. Mar. Ecol. Prog. Ser. 2009, 397, 279–294. [Google Scholar] [CrossRef]
  77. Parker, S.J.; Bowden, D.A. Identifying Taxonomic Groups Vulnerable to Bottom Longline Fishing Gear in the Ross Sea Region. CCAMLR Sci. 2010, 17, 105–127. [Google Scholar]
  78. Williams, A.; Schlacher, T.A.; Rowden, A.A.; Althaus, F.; Clark, M.R.; Bowden, D.A.; Stewart, R.; Bax, N.J.; Consalvey, M.; Kloser, R.J. Seamount Megabenthic Assemblages Fail to Recover from Trawling Impacts. Mar. Ecol. 2010, 31, 183–199. [Google Scholar] [CrossRef]
  79. Leese, F.; Kop, A.; Wägele, J.; Held, C. Cryptic Speciation in a Benthic Isopod from Patagonian and Falkland Island Waters and the Impact of Glaciations on Its Population Structure. Front. Zool. 2008, 15, 19. [Google Scholar] [CrossRef] [Green Version]
  80. Hedgpeth, J.W. Introduction to Antarctic Zoogeography. Antarct. Map Folio Ser. 1969, 11, 1–9. [Google Scholar]
  81. De Broyer, C.; Koubbi, P. The Biogeography of the Southern Ocean. In Biogeographic Atlas of the Southern Ocean; Scientific Committee on Antarctic Research: Cambridge, UK, 2014; pp. 2–9. [Google Scholar]
  82. Briggs, J.; Bowen, B. A Realignment of Marine Biogeographic Provinces with Particular Reference to Fish Distributions. J. Biogeogr. 2012, 39, 12–30. [Google Scholar] [CrossRef]
  83. Lagger, A.T.C.; Reyna, T.M.P.; Tatián, G.L.M. Ascidian Distribution Provides New Insights to Help Define the Biogeographic Provinces in the South American Region. Polar Biol. 2018, 41, 1123–1131. [Google Scholar] [CrossRef] [Green Version]
  84. Combes, V.; Matano, R.P. Progress in Oceanography the Patagonian Shelf Circulation: Drivers and Variability. Prog. Oceanogr. 2018, 167, 24–43. [Google Scholar] [CrossRef]
  85. Bastida, R.; Roux, A.; Martinez, D.E.; Brook, S. Benthic Communities of the Argentine Continental Shelf. Oceanol. Acta 1992, 15, 687–698. [Google Scholar]
  86. Ewing, M.; Lonardi, A.G. Sediment Transport and Distribution in the Argentine Basin. 5. Sediment Structure of the Argentina Margin, Basin, and Related Provinces. In Physics and Chemistry of the Earth 8; Pergamon Press: New York, NY, USA, 1971; pp. 123–251. [Google Scholar]
  87. Muñoz, A.; Acosta, J.; Cristobo, J.; Druet, M.; Uchupi, E.; Group, A. Geomorphology and Shallow Structure of a Segment of the Atlantic Patagonian Margin Earth-Science Reviews Geomorphology and Shallow Structure of a Segment of the Atlantic Patagonian Margin. Earth Sci. Rev. 2013, 121, 73–95. [Google Scholar] [CrossRef]
  88. Brown, C.S.; Newton, A.M.W.; Huuse, M.; Buckley, F. Iceberg Scours, Pits, and Pockmarks in the North Falkland Basin. Mar. Geol. 2017, 386, 140–152. [Google Scholar] [CrossRef]
  89. Langenkämper, D.; Zurowietz, M.; Schoening, T.; Nattkemper, T.W. BIIGLE 2.0—Browsing and Annotating Large Marine Image Collections. Front. Mar. Sci. 2017, 4, 83. [Google Scholar] [CrossRef] [Green Version]
  90. Howell, K.; Davies, J.; Allcock, A.L.; Braga-Henriques, A.; Buhl-Mortensen, P.; Carreiro-Silva, M.; Dominguez-Carrió, C.; Durden, J.; Foster, N.; Game, C.; et al. A Framework for the Development of a Global Standardised Marine Taxon Reference Image Database (SMarTaR-ID) to Support Image-Based Analyses. PLoS ONE 2019, 14, e0218904. [Google Scholar] [CrossRef] [Green Version]
  91. Beazley, L.; Kenchington, E.L.; Murillo, F.J. Deep-Sea Sponge Grounds Enhance Diversity and Abundance of Epibenthic Megafauna in the Northwest Atlantic. ICES J. Mar. Sci. 2013, 70, 1471–1490. [Google Scholar] [CrossRef]
  92. Turner, J.A.; Hitchin, R.; Verling, E.; Van Rein, H. Epibiota Remote Monitoring from Digital Imagery: Interpretation Guidelines; JNCC Report; Joint Nature Conservation Committee (JNCC)/NMBAQCS: Peterborough, UK, 2006; 42p. [Google Scholar]
  93. EUNIS. EUNIS Habitat Classifications. Available online: https://www.eea.europa.eu/data-and-maps/data/eunis-habitat-classification-1 (accessed on 12 July 2021).
  94. Wright, D.J. Survey Data Analysis for Hemptons Turbot Bank: An Investigation into the Categorization of Survey Data Sets for Mapping a Sand Wave Seafloor System; MESH Report; MESH: Berkhamsted, UK, 2005. [Google Scholar]
  95. Wilson, M.F.J.; O’Connel, B.; Brown, C.; Guinan, J.C.; Grehan, A.J. Multiscale Terrain Analysis of Multibeam Bathymetry Data for Habitat Mapping on the Continental Slope. Mar. Geol. 2007, 30, 3–35. [Google Scholar] [CrossRef] [Green Version]
  96. Lauvset, S.; Key, R.; Olsen, A.; van Heuven, S.; Velo, A.; Lin, X.; Schirnick, C. A New Global Interior Ocean Mapped Climatology: The 1 × 1 GLODAP Version 2. Earth Syst. Sci. Data 2016, 8, 325–340. [Google Scholar] [CrossRef] [Green Version]
  97. Roberts, M.J.; Wheeler, A.J.; Freiwald, A.; Cairns, S.D. Cold-Water Corals: The Biology and Geology of Deep-Sea Coral Habitats; Cambridge University Press: Cambridge, UK, 2009; pp. 1–350. [Google Scholar] [CrossRef]
  98. Legendre, P.; Gallagher, E. Ecologically Meaningful Transformations for Ordination of Species Data. Oecologia 2011, 129, 271–280. [Google Scholar] [CrossRef]
  99. Legendre, P.; Legendre, L. Numerical Ecology; Elsevier: Amsterdam, The Netherlands, 2012. [Google Scholar]
  100. Clarke, R. Non Parametrc Multivariate Analysis of Change. Aust. J. Ecol. 1993, 18, 117–143. [Google Scholar] [CrossRef]
  101. Bocard, D.; Gillet, F.; Legendre, P. Numerical Ecology with R; Springer: New York, NY, USA, 2011. [Google Scholar]
  102. Pearman, T.; Robert, K.; Callaway, A.; Hall, R.; Lo Iacono, C.; Huvenne, V.A.I. Improving the Predictive Capability of Benthic Species Distribution Models by Incorporating Oceanographic Data—Towards Holistic Ecological modelling of a Submarine Canyon. Prog. Oceanogr. 2020, 184, 102338. [Google Scholar] [CrossRef]
  103. Levin, L.A.; Jetter, R.; Rex, M.; Goodday, R.; Smith, C.; Pineda, J.; Stuart, C.; Robert, R.; Hessler, R.; Pawson, D. Enviornemntal Influences on Regional Deep-Sea Species Diversity. Annu. Rev. Ecol. Syst. 2001, 32, 51–93. [Google Scholar] [CrossRef] [Green Version]
  104. Robert, K.; Jones, D.O.B.B.; Tyler, P.A.; Van Rooij, D.; Huvenne, V.A.I.; Van Tooij, D.; Huvenne, V.A.I. Finding the Hotspots within a Biodiversity Hotspot: Fine-Scale Biological Predictions within a Submarine Canyon Using High-Resolution Acoustic Mapping Techniques. Mar. Ecol. 2015, 36, 1256–1276. [Google Scholar] [CrossRef]
  105. R_Core_Team. R: A Language and Environment for Statistical Computing; R Foundation for Statistical Computing: Vienna, Austria, 2014. [Google Scholar]
  106. Auster, P.J.; Gjerde, K.; Heupel, E.; Watling, L.; Grehan, A.; Rogers, A.D. Definition and Detection of Vulnerable Marine Ecosystems on the High Seas: Problems with the ‘Move-on’ Rule. ICES J. Mar. Sci. 2011, 68, 254–264. [Google Scholar] [CrossRef] [Green Version]
  107. Addamo, A.M.; Vertino, A.; Stolarski, J.; García-Jiménez, R.; Taviani, M.; Machordom, A. Merging Scleractinian Genera: The Overwhelming Genetic Similarity between Solitary Desmophyllum and Colonial Lophelia. BMC Evol. Biol. 2016, 16, 108. [Google Scholar] [CrossRef] [Green Version]
  108. Davies, A.J.; Guinotte, J.M. Global Habitat Suitability for Framework-Forming Cold-Water Corals. PLoS ONE 2011, 6, e18483. [Google Scholar] [CrossRef]
  109. Rowden, A.; Pearman, T.; Bowden, D.; Anderson, O.; Clark, M. Determining Coral Density Thresholds for Identifying Structurally Complex Vulnerable Marine Ecosystems in the Deep Sea. Front. Mar. Sci. 2020, 7, 95. [Google Scholar] [CrossRef] [Green Version]
  110. Buhl-mortensen, L.; Vanreusel, A.; Gooday, A.J.; Levin, L.A.; Priede, I.G.; Gheerardyn, H.; King, N.J.; Raes, M. Biological Structures as a Source of Habitat Heterogeneity and Biodiversity on the Deep Ocean Margins. Mar. Ecol. 2010, 31, 21–50. [Google Scholar] [CrossRef]
  111. Vad, J.; Orejas, C.; Moreno-navas, J.; Findlay, H.S.; Roberts, J.M. Assessing the Living and Dead Proportions of Cold-Water Coral Colonies: Implications for Deep-Water Marine Protected Area Monitoring in a Changing Ocean. PeerJ 2017, 5, e3705. [Google Scholar] [CrossRef] [PubMed]
  112. Auster, P.J. Are Deep-Water Corals Important Habitats for Fishes. In Cold-Water Corals and Ecosystems; Erlangen Earth Conference Series; Springer: Berlin/Heidelberg, Germany, 2014; pp. 747–760. [Google Scholar] [CrossRef]
  113. Miller, R.J.; Hocevar, J.; Stone, R.P.; Fedorov, D.V. Structure-Forming Corals and Sponges and Their Use as Fish Habitat in Bering Sea Submarine Canyons. PLoS ONE 2012, 7, e33885. [Google Scholar] [CrossRef] [PubMed] [Green Version]
  114. Kutti, T.; Bergstad, O.A.; Fosså, J.H.; Helle, K. Cold-Water Coral Mounds and Sponge-Beds as Habitats for Demersal Fish on the Norwegian Shelf. Deep. Res. Part II Top. Stud. Oceanogr. 2014, 99, 122–133. [Google Scholar] [CrossRef]
  115. D’Onghia, G.; Calculli, C.; Capezzuto, F.; Carlucci, R.; Carluccio, A.; Maiorano, P.; Pollice, A.; Ricci, P.; Sion, L.; Tursi, A. New Records of Cold-Water Coral Sites and Fish Fauna Characterization of a Potential Network Existing in the Mediterranean Sea. Mar. Ecol. 2016, 37, 1398–1422. [Google Scholar] [CrossRef]
  116. D’Onghia, G. Cold-Water Corals as Shelter, Feeding and Life-History Critical Habitats for Fish Species: Ecological Interactions and Fishing Impact. In Mediterranean Cold-Water Corals: Past, Present and Future; Springer: Cham, Switzerland, 2019; pp. 335–356. [Google Scholar]
  117. Robert, K.; Huvenne, V.A.I.; Georgiopoulou, A.; Jones, D.O.B.; Marsh, L.; Carter, D.O.G.; Chaumillon, L. New Approaches to High-Resolution Mapping of Marine Vertical Structures. Sci. Rep. 2017, 7, 9005. [Google Scholar] [CrossRef] [Green Version]
  118. Mortensen, P.; Hovland, M.; Brattegard, T.; Farestveit, R. Deep Water Bioherms of the Scleractinian Coral Lophelia pertusa (L.) at 641N on Thet Heegian Shelf: Structure and Associated Megafauna. Sarsia 1995, 80, 145–158. [Google Scholar] [CrossRef]
  119. Forraz Corrêa, P.; Jovane, L.; Murton, B.J.; Sumida, P.Y. Benthic Megafauna Habitats, Community Structure and Environmental Drivers at Rio Grande Rise (SW Atlantic). Deep. Res. Part I Oceanogr. Res. Pap. 2022, 186, 103811. [Google Scholar] [CrossRef]
  120. Ward, T.; Sorokin, S.J.; Currie, D.; Rogers, P.; Mcleay, L. Epifaunal Assemblages of the Eastern Great Australian Bight: Effectiveness of a Benthic Protection Zone in Representing Regional Biodiversity. Cont. Shelf Res. 2006, 26, 25–40. [Google Scholar] [CrossRef]
  121. Burgos, J.M.; Buhl-mortensen, L.; Buhl-mortensen, P.; Ólafsdóttir, S.H.; Tuck, I.D. Predicting the Distribution of Indicator Taxa of Vulnerable Marine Ecosystems in the Arctic and Sub-Arctic Waters of the Nordic Seas. Front. Mar. Sci. 2020, 7, 131. [Google Scholar] [CrossRef] [Green Version]
  122. Hanz, U.; Riekenberg, P.; De Kluijver, A.; Van Der Meer, M.; Middelburg, J.J.; De Goeij, J.M.; Bart, M.C.; Wurz, E.; Colaço, A.; Duineveld, G.C.A.; et al. The Important Role of Sponges in Carbon and Nitrogen Cycling in a Deep-Sea Biological Hotspot. Funct. Ecol. 2022. [Google Scholar] [CrossRef]
  123. Bart, M.C.; Hudspith, M.; Rapp, H.T.; Verdonschot, P.F.M.; De Goeij, J.M.; Xavier, J.R. A Deep-Sea Sponge Loop? Sponges Transfer Dissolved and Particulate Organic Carbon and Nitrogen to Associated Fauna. Front. Mar. Sci. 2021, 8, 604879. [Google Scholar] [CrossRef]
  124. Beaulieu, S.E. Life on Glass Houses: Sponge Stalk Communities in the Deep Sea. Mar. Biol. 2001, 138, 803–817. [Google Scholar] [CrossRef]
  125. Tissot, B.N.; Yoklavich, M.M.; Love, M.S.; York, K.; Amend, M. Benthic Invertebrates That Form Habitat on Deep Banks off Southern California, with Species Reference to Deep Sea Coral. Fish. Bull. 2006, 104, 167–181. [Google Scholar]
  126. Hawkes, N.; Korabik, M.; Beazley, L.; Rapp, H.T.; Xavier, J.R.; Kenchington, E.; Pen, O.; Hawkes, N.; Korabik, M.; Beazley, L.; et al. Glass Sponge Grounds on the Scotian Shelf and Their Associated Biodiversity. Mar. Ecol. Prog. Ser. 2019, 614, 91–109. [Google Scholar] [CrossRef] [Green Version]
  127. Pirtle, J. Habitat-Based Assessment of Structure-Forming Megafaubnal Invertebrates and Fishes on Cordell Bank, California. Master’s Thesis, Washington State University, Pullman, WA, USA, 2005. [Google Scholar]
  128. Bo, M.; Bertolino, M.; Canese, S.; Giusti, M.; Angiolillo, M.; Pansini, M.; Taviani, M. Role of Deep Sponge Grounds in the Mediterranean Sea: A Case Study in Southern Italy. Hydrobiologia 2011, 687, 163–177. [Google Scholar] [CrossRef] [Green Version]
  129. Maldonado, M.; Aguilar, R.; Bannister, R.J.; James, J.; Conway, K.W.; Dayton, P.K.; Cristina, D.; Gutt, J.; Kelly, M.; Kenchington, E.L.R.; et al. Sponge Grounds as Key Marine Habitats: A Synthetic Review of Types, Structure , Functional Roles , and Conservation Concerns. In Marine Animal Forests; Rossi, S., Bramanti, L., Gori, A., Orejas Saco del Valle, C., Eds.; Springer: Cham, Switzerland, 2016; ISBN 9783319170015. [Google Scholar] [CrossRef]
  130. Leys, S. Hexactinellid Sponge Ecology: Growth Rates and Seasonality in Deep Water Sponges. J. Exp. Mar. Biol. Ecol. 1998, 230, 111–129. [Google Scholar] [CrossRef]
  131. Peter, K.; Wang, X.; Vennemann, T.W.; Sinha, B.; Müller, W.E.G. Siliceous Deep-Sea Sponge Monorhaphis Chuni : A Potential Paleoclimate Archive in Ancient Animals. Chem. Geol. 2012, 301, 143–151. [Google Scholar] [CrossRef]
  132. Klitgaard, A.B. The Fauna Associated with Outer Shelf and Upper Slope Sponges (Porifera, Demospongiae) at the Faroe Islands, Northeastern Atlantic. Sarsia 1995, 80, 1–22. [Google Scholar] [CrossRef] [Green Version]
  133. OSPAR. Background Document for Deep-Sea Sponge Aggregations; OSPAR Commission: London UK, 2010; ISBN 978-1-907390-26-5. [Google Scholar]
  134. Henry, L.A.; Roberts, J.M. Applying the OSPAR Habitat Definition of Deep-Sea Sponge Aggregations to Verify Suspected Records of the Habitat in UK Waters. JNCC Rep. 2014, 5, 508. [Google Scholar]
  135. Parry, M.; Howell, K.L.; Narayanaswamy, B.; Bett, B.J.; Jones, D.O.B.; Hughes, J.; Piechaud, N.; Nickell, T.; Ellwood, H.; Askew, N.; et al. A Deep-Sea Section for the Marine Habitat Classification of Britain and Ireland (v 15.03); JNCC Rep 530; JNCC: Peterborough, UK, 2015; ISSN 0963-8091. [Google Scholar]
  136. Baillon, S. Diversity, Distribution and Nature of Faunal Associations with Deep-Sea Pennatulacean Corals in the Northwest Atlantic. PLoS ONE 2014, 9, 14–16. [Google Scholar] [CrossRef] [Green Version]
  137. Baillon, S.; Sciences, O. Characterization and Role of Major Deep-Sea Pennatulacean Corals in the Bathyal Zone of Eastern Canada. Ph.D. Thesis, Memorial University of Newfoundland, St. John’s, NL, Canada, 2014. [Google Scholar]
  138. Williams, G.C. Living Genera of Sea Pens (Coelenterata: Octocorallia: Pennatulacea): Illustrated Key and Synopses. Zool. J. Linn. Soc. 1995, 113, 93–140. [Google Scholar] [CrossRef]
  139. Baillon, S.; Hamel, J.; Wareham, V.E.; Mercier, A. Deep Cold-Water Corals as Nurseries for Fish Larvae. Front. Ecol. Environ. 2012, 10, 351–356. [Google Scholar] [CrossRef] [Green Version]
  140. Levin, L.; Sibeut, M.; Smith, A.; Vanreaisel, A. The Roles of Habitat Heterogeneity in Generating and Maintaining Biodiversity on Continental Margins: An Introduction. Mar. Ecol. 2010, 31, 1–5. [Google Scholar] [CrossRef]
  141. Rex, M.; Etter, J. Deep-Sea Biodiversity: Pattern and Scale; Harvard University Press: Cambridge, MA, USA, 2010. [Google Scholar]
  142. Puerta, P.; Johnson, C.; Carreiro-silva, M.; Henry, L.; Kenchington, E.; Morato, T.; Kazanidis, G.; Rueda, J.L.; Urra, J.; Ross, S.; et al. Influence of Water Masses on the Biodiversity and Biogeography of Deep-Sea Benthic Ecosystems in the North Atlantic. Front. Mar. Sci. 2020, 7, 239. [Google Scholar] [CrossRef] [Green Version]
  143. Buhl-Mortensen, L.; Dolan, M.F.J.; Holte, B.; Dannheim, J.; Buhl-mortensen, P.; Bellec, V. Habitat Complexity and Bottom Fauna Composition at Different Scales on the Continental Shelf and Slope of Northern Norway. Hydrobiologia 2012, 685, 191–219. [Google Scholar] [CrossRef] [Green Version]
  144. Baker, K.D.; Wareham, V.; Snelgrove, P.V.R.; Haedrich, R.; Fifield, D.; Edinger, E.; Gilkinson, K. Distributional Patterns of Deep-Sea Coral Assemblages in Three Submarine Canyons off Newfoundland, Canada. Mar. Ecol. Prog. Ser. 2012, 445, 235–249. [Google Scholar] [CrossRef] [Green Version]
  145. Lacharité, M.; Metaxas, A. Hard Substrate in the Deep Ocean: How Sediment Features Influence Epibenthic Megafauna on the Eastern Canadian Margin. Deep Sea Res. Part I Oceanogr. Res. Pap. 2017, 126, 50–61. [Google Scholar] [CrossRef]
  146. Isola, J.I.; Bravo, M.E.; Bozzano, G.; Palma, F.I.; Ormazabal, J.P.; Principi, S. The Late-Quaternary Deposits of the Piedra Buena Terrace (Patagonian Continental Slope, SW Atlantic): An Example of Interaction between Bottom Currents and Seafloor Morphology. Mar. Geol. 2021, 435, 106459. [Google Scholar] [CrossRef]
  147. Hernández-molina, F.J.; Paterlini, M.; Violante, R.; Marshall, P.; De Isasi, M.; Somoza, L. Contourite Depositional System on the Argentine Slope: An Exceptional Record Contourite Depositional System on the Argentine Slope: An Exceptional Record of the Influence of Antarctic Water Masses. Geology 2009, 37, 507–510. [Google Scholar] [CrossRef]
  148. Hebbeln, D.; Van Rooij, D.; Wienberg, C. Good Neighbours Shaped by Vigorous Currents: Cold-Water Coral Mounds and Contourites in the North Atlantic. Mar. Geol. 2016, 378, 171–185. [Google Scholar] [CrossRef]
  149. De Mol, L.; Van Rooij, D.; Pirlet, H.; Greinert, J.; Frank, N.; Quemmerais, F.; Henriet, J. Cold-Water Coral Habitats in the Penmarc’h and Guilvinec Canyons (Bay of Biscay): Deep-Water versus Shallow-Water Settings. Mar. Geol. 2011, 282, 40–52. [Google Scholar] [CrossRef] [Green Version]
  150. Howell, K.L.; Holt, R.; Pulido, I.; Stewart, H.; Endrino, I.P.; Stewart, H. When the Species Is Also a Habitat: Comparing the Predictively Modelled Distributions of Lophelia Pertusa and the Reef Habitat It Forms. Biol. Conserv. 2011, 144, 2656–2665. [Google Scholar] [CrossRef] [Green Version]
  151. Huvenne, V.; Tyler, P.; Fisher, D.; Hauton, C.; Huhnerbach, V.; Le Bas, T.; Wolff, G. A Picture on the Wall: Innovative Mapping Reveals Cold-Water Coral Refuge in Submarine Canyon. PLoS ONE 2011, 6, e28755. [Google Scholar] [CrossRef] [PubMed] [Green Version]
  152. Gori, A.; Orejas, C.; Madurell, T.; Bramanti, L.; Martins, M.; Quintanilla, E.; Marti-Puig, P.; Lo Iacono, C.; Puig, P.; Requena, S.; et al. Bathymetrical Distribution and Size Structure of Cold-Water Coral Populations in the Cap de Creus and Lacaze-Duthiers Canyons (Northwestern Mediterranean). Biogeosciences 2013, 10, 2049–2060. [Google Scholar] [CrossRef] [Green Version]
  153. Rengstorf, A.; Yesson, C.; Brown, C.; Grehan, A.J.; Crame, A. High-Resolution Habitat Suitability Modelling Can Improve Conservation of Vulnerable Marine Ecosystems in the Deep Sea. J. Biogeogr. 2013, 40, 1702–1714. [Google Scholar] [CrossRef]
  154. Fabri, M.; Bargain, A.; Pairaud, I.; Pedel, L.; Taupier-Letage, I. Cold-Water Coral Ecosystems in Cassidaigne Canyon: An Assessment of Their Environmental Living Conditions. Deep Sea Res. Part II Top. Stud. Oceanogr. 2017, 137, 436–453. [Google Scholar] [CrossRef] [Green Version]
  155. Mohn, C.; Rengstorf, A.; White, M.; Duineveld, G.; Mienis, F.; Soetaert, K.; Grehan, A. Linking Benthic Hydrodynamics and Cold-Water Coral Occurrences: A High-Resolution Model Study at Three Cold-Water Coral Provinces in the NE Atlantic. Prog. Oceanogr. 2014, 122, 92–101. [Google Scholar] [CrossRef]
  156. Post, A.; Lavoie, C.; Domack, E.; Leventer, A.; Shevenell, A.; Fraser, A. Environmental Drivers of Benthic Communities and Habitat Heterogeneity on an East Antarctic Shelf. Antarct. Sci. 2016, 29, 17–32. [Google Scholar] [CrossRef]
  157. Pile, A.J.; Young, C.M. The Natural Diet of a Hexactinellid Sponge: Benthic—Pelagic Coupling in a Deep-Sea Microbial Food Web. Deep Sea Res. Part I Oceanogr. Res. Pap. 2006, 53, 1148–1156. [Google Scholar] [CrossRef]
  158. Gori, A.; Rossi, S.; Linares, C. Reproductive Cycle and Trophic Ecology in Deep versus Shallow Populations of the Mediterranean Gorgonian Eunicella singularis (Cap de Creus, Size and Spatial Structure in Deep versus Shallow Populations of the Mediterranean Gorgonian Eunicella singulari). Coral Reefs 2012, 31, 823–837. [Google Scholar] [CrossRef]
  159. Maier, S.R.; Kutti, T.; Bannister, R.J.; Fang, J.K.; Van, P.; Van Rijswijk, P.; Oevelen, D. Van Recycling Pathways in Cold- Water Coral Reefs: Use of Dissolved Organic Matter and Bacteria by Key Suspension Feeding Taxa. Sci. Rep. 2020, 10, 9942. [Google Scholar] [CrossRef]
  160. Cunha, M.; Paterson, G.; Amaro, T.; Blackbird, S.; De Stiger, H.; Ferreira, C.; Glover, A.; Hilario, A.; Kiriakoulakis, K.; Neal, L.; et al. Biodiversity of Macrofaunal Assemblages from Three Portuguese Submarine Canyons (NE Atlantic). Deep Sea Res. Part II Top. Stud. Oceanogr. 2011, 58, 2433–2447. [Google Scholar] [CrossRef] [Green Version]
  161. Glorioso, P.D.; Piola, A.R.; Leben, R.R. Mesoscale Eddies in the Subantarctic Front—Southwest Atlantic. Sci. Mar. 2005, 69, 7–15. [Google Scholar] [CrossRef] [Green Version]
  162. Tomczak, M. A Multiparameter Extension of Temperature/Salinity Diagram Techniques for the Analysis of Non-Isopycnal Mixing. Prog. Oceanogr. 1981, 10, 147–171. [Google Scholar] [CrossRef]
  163. Roberts, J.M.; Davies, A.J.; Henry, L.A.; Dodds, L.A.; Duineveld, G.C.A.; Lavaleye, M.S.S.; Maier, C.; Van Soest, R.W.M.; Bergman, M.J.N.; Hühnerbach, V.; et al. Mingulay Reef Complex: An Interdisciplinary Study of Cold-Water Coral Habitat, Hydrography and Biodiversity. Mar. Ecol. Prog. Ser. 2009, 397, 139–151. [Google Scholar] [CrossRef] [Green Version]
  164. Davies, A.J.; Duienveld, G.; Lavaleye, M.S.S.; Bergman, M.J.N.; Van Haren, H.; Roberts, J.M. Downwelling and Deep-Water Currents as Food Supply Mechanisms to the Cold-Water Coral Lophelia pertusa (Scleractinia) at the Mingulay Reef Complex. Limnol. Oceanogr. 2009, 54, 620–629. [Google Scholar] [CrossRef] [Green Version]
  165. Dullo, W.; Juva, K.; Flögel, S.; Karstensen, J.; Linke, P.; Dullo, W. Tidal Dynamics Control on Cold-Water Coral Growth: A High-Resolution Multivariable Study on Eastern Atlantic Cold-Water Coral Sites. Front. Mar. Sci. 2020, 7, 132. [Google Scholar] [CrossRef]
  166. Bett, B. UK Atlantic Margin Environmental Survey: Introduction and Overview of Bathyal Benthic Ecology. Cont. Shelf Res. 2001, 21, 917–956. [Google Scholar] [CrossRef]
  167. Howell, K.; Billett, D.; Tyler, P. Depth-Related Distribution and Abundance of Seastars (Echinodermata:Asteroidea) in the Porcupine Seabight and Porcupine Abyssal Plain, N.E. Atlantic. Deep. Res. Part II Top. Stud. Oceanogr. 2002, 49, 1901–1902. [Google Scholar] [CrossRef]
Figure 1. Location map of the Falkland Islands and (AC) zoomed insets of drop-down camera locations (indicated as black circles). The Falklands conservation zones encompass the Falklands Interim Conservation and Management Zone (FICZ) and the Falklands Outer Conservation Zone (FOCZ). (See supplementary Table S1 for full station list and locations).
Diversity 14 00637 g001
Figure 2. Example images of fauna and substrata. (A) Bathelia candida reef observed at 1280 m water depth. (B) Mixed cold-water corals, including Stylaster densicaulis and Primnoidae, Stylasteridae, and Porifera morphospecies observed at 1280 m water depth. (C) Stylasteridae and Massive Ball Porifera morphospecies were observed from mixed substratum at 1595 m water depth. (D) Solitary cup corals, including Flabellum sp. and Scleractinia sp. 5, were observed from coarse substratum at 1406 m water depth. (E) Anthoptilum grandiflorum and Flabellum sp. observed from sandy mud at 1225 m water depth. (F) Pennatulacea sp. and Flabellum sp. observed from sandy mud at 1330 m water depth. Scale bar = 30 cm.
Diversity 14 00637 g002
Figure 3. nMDS plot of multivariate Hellinger distance matrix of transformed morphospecies density data. Samples are coloured to represent the five clusters identified by hierarchal clustering analysis.
Diversity 14 00637 g003
Figure 4. Spatial distribution of clusters identified from hierarchal clustering of Hellinger distance matrix of transformed morphospecies density data.
Diversity 14 00637 g004
Figure 5. Canonical redundancy analysis of a Hellinger distance matrix of transformed morphospecies density data and selected environmental variables. For clarity, the triplot is displayed in three separate plots with varying axis limits. (A) Environmental variables and sites colour coded by substratum type. (B) Morphospecies data, only fauna with the strongest effect are labelled. (C) Sites colour coded to represent hierarchal clustering. The vector arrowheads represent high, the origin averages, and the tail (when extended through the origin) low values of the selected environmental variables. Sites are represented by circles. Sites close to one another tend to have similar faunal composition that those further apart.
Diversity 14 00637 g005
Table 1. Environmental variables used in modelling. † Environmental variable retained in final model.
Environmental VariablesDescriptionUnitNative Resolution
Seabed terrain
Depth †Bathymetry extracted from GEBCO. https://www.gebco.net/ (accessed on 10 November 2020)m0.004°
Terrain derivatives
Slope †A first derivative of bathymetry measuring the change in elevation from one pixel to its neighbour derived from a neighbourhood size of 3 × 3°0.004°
Eastness †A first derivative of bathymetry measuring the easterly orientation of maximum change along the slope on a continuous scale (−1 to +1)-0.004°
Northness †A first derivative of bathymetry measuring the northerly orientation of maximum change along the slope on a continuous scale (−1 to +1)-0.004°
CurvatureA second derivative of bathymetry measuring the shape of the slope, with values indicating whether a slope is convex or concave-0.004°
Fine bathymetric position index (FBPI) †A derived metric of a cell’s position and elevation relative to its surrounding landscape/cells within a user defined area [94]-
Broad bathymetric position index (BBPI)A derived metric of a cell’s position and elevation relative to its surrounding landscape/cells within a user defined area [94]-
RugosityA measure of the ratio of the surface area to the planar area calculated with a neighbourhood size of 3 × 3 pixels [95]-
Oceanography variables
Surface chlorophyllExtracted from GLOBAL_REANALYSIS_BIO_001_029 http://marine.copernicus.eu (accessed on 10 November 2020)mg m−30.08°
Seabed temperatureExtracted from GLOBAL_ANALYSIS_FORECAST_PHY_001_024 http://marine.copernicus.eu (accessed on 10 November 2020)°C0.08°
Mean seabed current velocity UExtracted from GLOBAL_ANALYSIS_FORECAST_PHY_001_024 http://marine.copernicus.eu (accessed on 10 November 2020)m/s0.08°
Seabed PhExtracted from GLOBAL_REANALYSIS_BIO_001_029 http://marine.copernicus.eu (accessed on 10 November 2020)-0.08°
Surface PhExtracted from GLOBAL_REANALYSIS_BIO_001_029 http://marine.copernicus.eu (accessed on 10 November 2020)-0.08°
Seabed phosphateExtracted from GLOBAL_REANALYSIS_BIO_001_029 http://marine.copernicus.eu (accessed on 10 November 2020)μmol kg−10.08°
Surface phosphateExtracted from GLOBAL_REANALYSIS_BIO_001_029 http://marine.copernicus.eu (accessed on 10 November 2020)μmol kg−10.08°
Surface dissolved oxygenExtracted from GLOBAL_REANALYSIS_BIO_001_029 http://marine.copernicus.eu (accessed on 10 November 2020)μmol kg−10.08°
Seabed silicateExtracted from GLOBAL_REANALYSIS_BIO_001_029 http://marine.copernicus.eu (accessed on 10 November 2020)μmol kg−10.08°
Aragonite saturation stateExtracted from GLODAPv.2.2016b
[96] (accessed on 22 March 2018)
μmol kg−1
Dissolved inorganic carbonExtracted from GLODAPv.2.2016b
[96] (accessed on 22 March 2018)
μmol kg−1
Calcite saturation stateExtracted from GLODAPv.2.2016b
[96] (accessed on 22 March 2018)
μmol kg−1
NitrateExtracted from GLODAPv.2.2016b
[96] (accessed on 22 March 2018)
μmol kg−1
Total alkalinityExtracted from GLODAPv.2.2016b
[96] (accessed on 22 March 2018)
μmol kg−1
Substrata variables
Substrata †Substrate type annotated from imagery based
upon EUNIS 2022 classifications [93]
Table 2. Clusters identified from multivariate hierarchal clustering analysis with associated environmental parameters, number of samples represented by each cluster (N), and SIMPER results identifying the morphospecies that characterise the clusters (70% accumulative contribution cut-off).
ClusterCharacterising MorphospeciesWater Depth (m)SubstratumN
1Stylasteridae sp., Massive Ball Porifera1070–1840Coarse, biogenic gravel, reef, mixed197
2Scleractinia sp. 5,
Anthoptilum grandiflorum
1070–1880Coarse, mud, sandy mud Sand, muddy sand78
3Flabellum sp., Pennatulacea sp.1120–1327Mud, sandy mud9
4Alcyonacea sp. 19, Hormathiidae sp. 21840Hard2
5Cold-water whip coral 1390–1540Mud, sandy mud, coarse2
Table 3. Results from canonical redundancy analysis (RDA) of Hellinger-transformed species data and selected environmental variables. Significance of individual terms determined by analysis of variance (ANOVA) on RDA. *** p ≤ 0.001.
Environmental Variables—Significance of Individual Terms by ANOVAAdjusted R2Significance of RDA Plot by ANOVA
F-Valuep-Value
Depth ***, Slope ***, FBPI ***, Substrate ***, Eastness ***, Northness ***, Current Velocity ***134.51, df = 12,2750.001
Publisher’s Note: MDPI stays neutral with regard to jurisdictional claims in published maps and institutional affiliations.

