Article

Fish Diversity along the Mekong River and Delta Inferred by Environmental-DNA in a Period of Dam Building and Downstream Salinization

1
IRD, MARBEC (University Montpellier, Ifremer, CNRS, IRD), Bat. 24 cc 093 Place E. Bataillon, 34095 Montpellier, France
2
IRD, MARBEC (University Montpellier, Ifremer, CNRS, IRD), Avenue Jean Monnet-CS 30171, 34203 Sète, France
3
Department of Ecology and Evolutionary Biology, University of Science, Ho Chi Minh City 70000, Vietnam
4
Vietnam National University-Ho Chi Minh City, Linh Trung Ward, Thu Duc City, Ho Chi Minh City 70000, Vietnam
5
Department of Fishery, Faculty of Agriculture, Ubon Ratchathani University, Ubon Ratchathani 34190, Thailand
6
Wonders of the Mekong Project, c/o Faculty of Fisheries, Royal University of Agriculture, Khan Dangkor, P.O. Box 2696, Phnom Penh 12501, Cambodia
7
Faculty of Agriculture, Svay Rieng University, National Road No 1, Svay Rieng 20306, Cambodia
*
Author to whom correspondence should be addressed.
Diversity 2022, 14(8), 634; https://doi.org/10.3390/d14080634
Submission received: 6 July 2022 / Revised: 5 August 2022 / Accepted: 5 August 2022 / Published: 9 August 2022

Abstract

:
The Mekong River is one of the largest rivers in the world and hosts the second greatest fish diversity in the world after the Amazon. However, despite the importance of this diversity and its associated biomass for human food security and the economy, different anthropogenic pressures threaten the sustainability of the Mekong River and fish diversity, including the intense damming of the main river. Both the increase in salt-water penetration into the Mekong Delta and the disrupted connectivity of the river may have serious impacts on the numerous freshwater and migratory species. To evaluate the potential of an eDNA approach for monitoring fish diversity, water was sampled at 15 sites along the salinity gradient in the Mekong Delta and along 1500 km of the main stream, from Vietnam to Thailand and Laos. A total of 287 OTUs were recovered, of which 158 were identified to the species level using both reference sequences available in GenBank and references obtained locally. Agglomerative hierarchical clustering and PCA identified up to three main species assemblages in our samples. If the transition from brackish to freshwater conditions represents the main barrier between two of these assemblages, more surprisingly, the two other assemblages were observed in the freshwater Mekong, with a spatial disjunction that did not match any biogeographic ecoregion or the Khone falls, the latter thought to be an important fish dispersion barrier. Between 60% and 95% of the freshwater species were potamodromous. This pioneer eDNA study in the Mekong River at this geographical and ecological scale clearly confirmed the potential of this approach for ecological and diversity monitoring. It also demonstrated the need to rapidly build an exhaustive Mekong fish barcode library to enable more accurate species’ assignment. More eDNA surveys can now be expected to better describe the ecological niche of different species, which is crucial for any models aimed at predicting the impact of future damming of the Mekong.

1. Introduction

Understanding the mechanisms that determine the distribution of species is crucial for the management of resources, the conservation of species and habitats, and to maintain ecosystem services [1]. Fish are among the most diversified group of the vertebrates, with more than 36,000 species described to date, and fish play a major role in the functioning of aquatic ecosystems as well as in human food security. However, identifying their distribution remains a challenge, because it is difficult to observe them in aquatic environments and due to their mobility. The spatial distribution of a species and its abundance are the results of its evolutionary history, its physiological performances and their biotic interactions, as well as its life history traits. This distribution, and that of communities, is likely to change because of the impact of global changes on aquatic environments, where environmental gradients can be strong, for example, in rivers and estuarine zones [2,3,4]. The environmental pressures will lead to a recomposition of communities and, beyond, to changes in the ecosystem functioning [5].
The Mekong River is the main river in South East Asia, one of the longest rivers in the world, flowing around 4400 km from the Tibetan plateau in China to Vietnam where, after crossing Myanmar, Laos, Thailand and Cambodia, it forms a large delta [6]. With a catchment area of 795,000 km2, the Mekong River hosts the second highest inland fish diversity in the world, with more than 1100 species [7,8,9]. It also supports one of the most productive inland fisheries [10], with about 2.6 million tons of fish landed per year, i.e., 25% of the freshwater catches worldwide. Among the major river systems, the Mekong River and Delta are the most affected by climate change and human activities [9,11,12]. The main threat to the river as a whole is the existing dams, plus numerous dam-building projects that will have major impacts, especially on the fisheries [12]. The Mekong Delta is threatened by saline intrusions originating from the current sea level rise due to climate change [13,14]. The numerous dams on the mainstream have a negative impact on the migratory behavior of many of the fish species and hence on the associated fisheries [9,12,15]. The significant impact of the dams on fish behavior is because they disrupt habitat connectivity and water flow, stop possible migration pathways and influence both the physiology and genetic backgrounds [16]. In that sense, an overview of the fish communities is indispensable before planning any modification of the Mekong catchment to manage and monitor the possible threats to fish populations and communities. Similarly, the limitation of the flow of the Mekong, due to the construction of dams in China and Laos, increases the salinization of the waters in the delta during periods of drought. This was the case in 2016, when the lower Mekong Delta faced serious drought and saline intrusions that damaged agriculture as well as fisheries, and threatened the livelihoods of local people [17,18]. In addition, it is likely that salinity will increasingly affect the freshwater aquaculture in this coastal area, because the duration of the period with increased salinity during the dry season is tending to lengthen from year to year [19]. In 2016, around 14,500 ha of freshwater aquaculture were at risk [17,18]. The building of more dams will inevitably amplify the phenomenon of the salinization of the delta, while at the same time block the migration of many migratory fish species. Understanding the consequences of saline intrusion for fish diversity is thus important to improve the risk assessment for communities, as well as their responses and resilience in changing environmental conditions.
According to simulations [20], or if one extrapolates case studies [16], the impact of the dams on migratory species is predicted to be catastrophic, whereas the impact of water salinization on fish communities in the Mekong Delta is more difficult to assess. One of the reasons is our limited knowledge of fish communities and their spatial distribution in this region. Given the size of the system and the historical events that have affected the region, relatively few studies are available on fish diversity in the Mekong River and Delta and its distribution in relation to the environmental parameters. Ironically, it is dam building that led to the most recent discoveries concerning Mekong fish taxonomy [21]. A longer time ago, in the same context, Kottelat [22] described 64 new species in Laos alone. Ultimately, the hydroelectric projects will probably continue to fund taxonomic surveys in the years to come, since most of the countries involved in the Mekong River Commission (MRC) do not have the necessary human or financial resources to pay for this type of research, which is considered redundant [23]. For example, such investigations clearly do not concern the Mekong Delta, where no hydroelectric dam is planned. More surprisingly, there is no fishery agency in Vietnam, nor a survey network to monitor the impact of changes in catches on the exploited fish diversity [10]. Thus, assessing the consequences of current or future anthropogenic pressures on the Mekong biodiversity requires a rapid increase in our knowledge of the ichthyofauna in the Mekong catchment.
In this context, metabarcoding of environmental DNA (eDNA) would be an appropriate noninvasive approach [24] to describe both the distribution range of the fish species and the fish communities present along the Mekong River and in the Delta. It would also be useful to assess the impact of the salinity gradient in the Delta on fish diversity. So far, this approach has been successfully used to monitor the effect of a dam on the fish community in a reservoir in Laos [25], and to track the presence of emblematic fish species, such as the Mekong giant catfish, Pangasianodon gigas [26] or the clown featherback, Chitala ornate [27]. However, the ability of an eDNA approach to describe the fish communities and diversity in such a large and complex river system has not been demonstrated to date. Beyond the issues concerning the taxonomical coverage of available DNA barcode reference libraries in this environment [28], questions remain about the ability of eDNA to detect a species when it is present, or to confirm the real physical presence of a species when detected. The aim of the present study was thus to answer these two main questions by analyzing the fish diversity along the Mekong River and Delta, using an eDNA approach to provide a snapshot of the fish diversity in the context of dam building and of the increased salinity in the Mekong Delta. The study used the existing reference DNA barcode libraries, completed by a new one built specifically for the purpose (Nguyen et al. in prep.). Jerde et al. [28] tried to evaluate the GenBank taxonomic coverage of Mekong fishes using GAPeDNA [29], but their estimation was inaccurate due to the presence of a large cryptic diversity in the Mekong river, or to the presence of mislabeled DNA sequences (i.e., species misidentification) in GenBank (Nguyen et al. in prep.). Furthermore, it is not clear how the interactions between physico-chemical conditions (temperature, salinity, pH, etc.) and the flow of water in the Mekong River impact on local fish diversity. The eDNA approach was also used to depict the biodiversity observed along the salinity gradient in the Mekong Delta, coupled with a larger geographic scale along the Lower Mekong River up to the Thai river bank near Vientiane, the capital of Laos. The operational taxonomic units (OTU) recovered in the eDNA sampling were assigned to a species obtained from GenBank and from a local Mekong fish library. The benefits of adding local DNA barcoding resources were then evaluated. The question of the eDNA dispersion along the catchment was carefully addressed by inspecting the distribution of the recovered fish species with respect to the general conditions of the water in the Mekong, particularly salinity, and the main biological characteristics of the species in terms of the environment, their position in the water column and known migratory behavior. The overall goal of the study was to test the ability of the eDNA tool to provide an overview of the fish diversity along the Mekong River under dam building pressure and global changes.

2. Materials and Methods
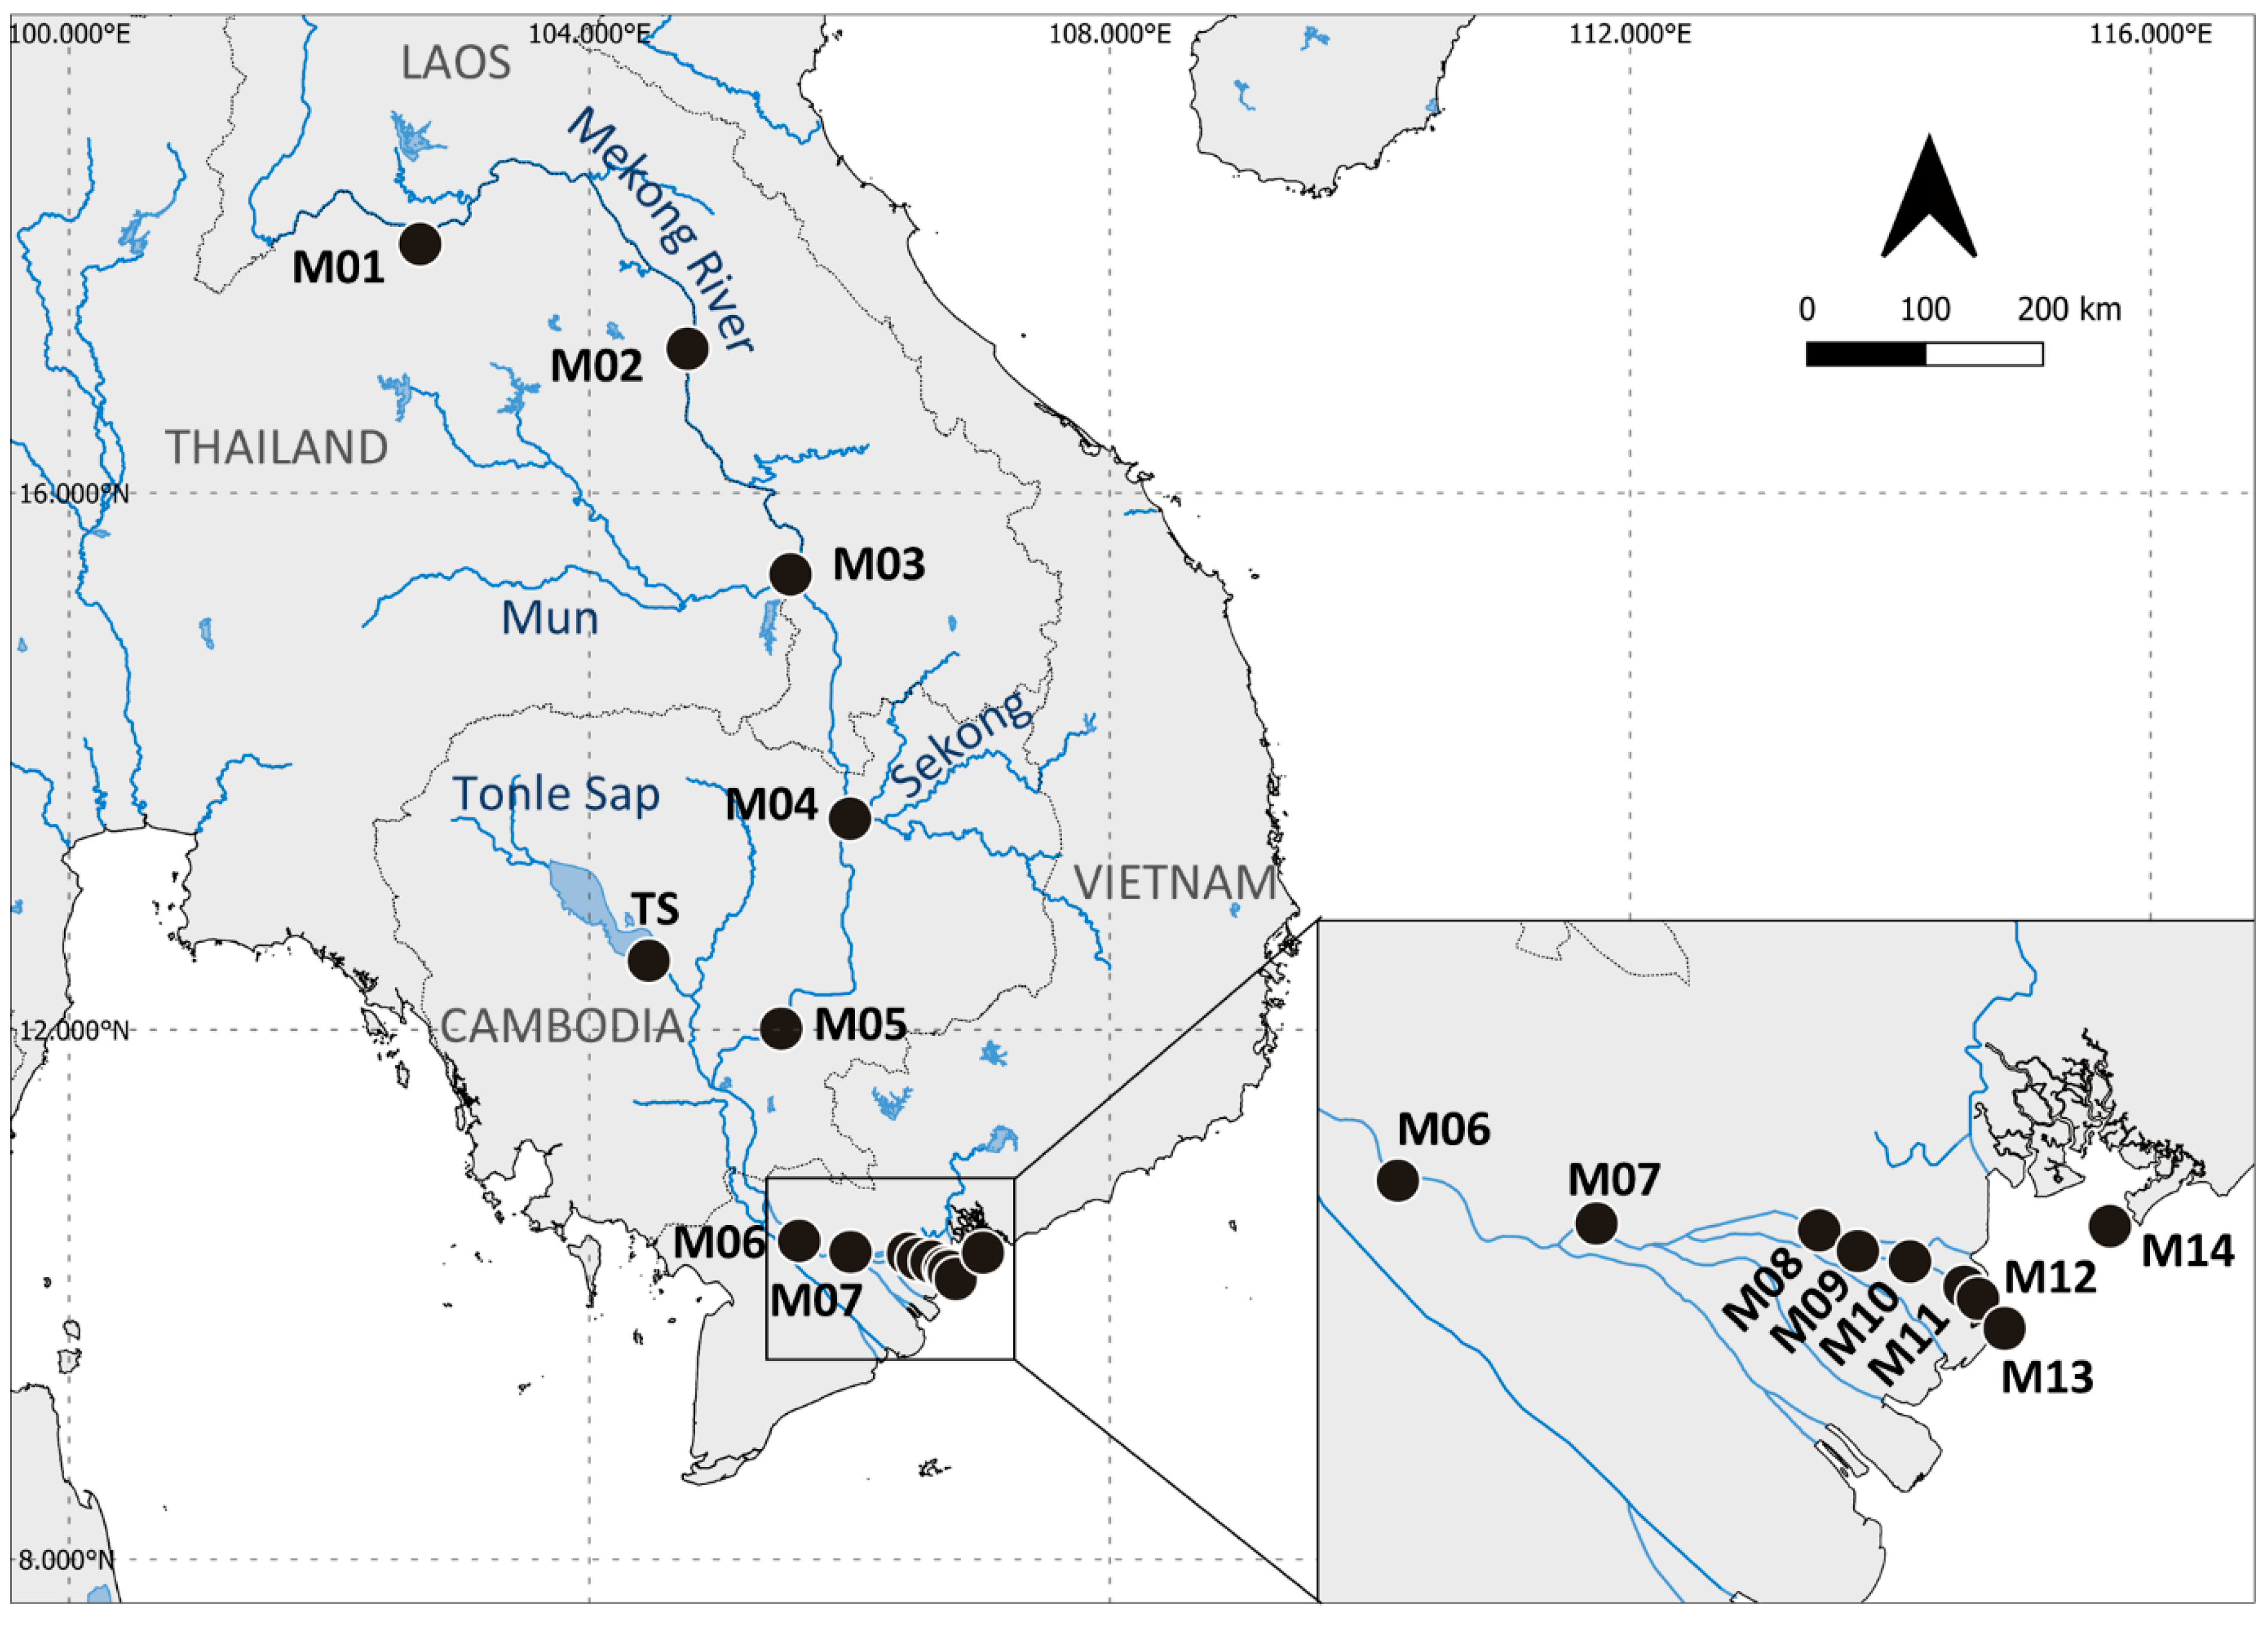
2.1. Study Area

The study was conducted along the lower Mekong River which crosses four countries (Laos, Thailand, Cambodia and Vietnam, Figure 1) and in the Mekong Delta. Between April 2018 and September 2019, 14 sites were sampled along the Thai bank of the river to Cambodia, down to the delta and the river mouth in Vietnam (M01 to M14), and one site was sampled in the Tonle Sap lake tributary in Cambodia (TS). The downstream sites close to the Mekong Delta were representative of the salinity gradient, separated by an increase of salinity of around five (Table 1). The distance from the sea to the sampling site on the river was used as a variable.

2.2. Water Sampling for Environmental-DNA (eDNA) Analysis of Fishes

The environmental-DNA sampling was authorized in Vietnam by the Fisheries Department (Ben Tre Province) for the restricted areas. In Cambodia and Thailand, the local authors were directly involved in the study, which precluded the need to apply for permission. At each sampling site, two replicate water samples were filtered through Sterivex filters, using a Vampire pump. At each site, the sampling protocol comprised of five steps: (1) the pump and tube were cleaned with diluted bleach for 20 s then rinsed with the environmental water to be filtered for 30 s; (2) the sampling bucket was cleaned with diluted bleach for 20 s and then rinsed with environmental water; (3) samples of the environmental water were collected in the bucket at a depth of 2 m, and around 5 L were filtered through 0.22 μm Sterivex filters; generally two to five filters were required per sample, depending on turbidity; (4) the Sterivex filters were dried by pumping air; and (5) the Sterivex filters were filled with RNAlater, both ends were closed with special caps, and finally, the samples were labelled. A total of 30 samples of filtered environmental water were collected at the 15 sites. The salinity was measured in the field, using a Castaway® CTD probe at the same time as the sampling. All of the Sterivex filters were sent to the NatureMetrics Company (UK) for DNA extraction and metabarcoding analysis. The DNA from each Sterivex filter was extracted, using a commercial DNA extraction kit with the protocol modified to increase the DNA yields. The DNA was purified to remove the PCR inhibitors, using a commercial purification kit. The DNAs were subsequently pooled as required. The purified DNAs were amplified with 12 replicate PCRs for a hypervariable region of the 12S rRNA gene to target the fish as part of the eDNA survey [30]. All of the PCRs were performed in the presence of both a negative and a positive control sample (a mock community of known composition). The amplicons were purified and checked by gel electrophoresis, and then quantified using a Qubit high sensitivity kit, according to the manufacturer’s protocol. The high-quality vertebrate sequence data were obtained for 28 of the 30 eDNA samples (one replicate of M05 and one of M11 showed poor quality sequences). For the two replicates for which the PCR reactions were inconsistent and did not pass the quality control tests, an alternative more broad-spectrum assay targeting vertebrates was used (12S V5) [31]. The PCR reactions for the negative control (NC25) were consistently negative. The purified index PCRs were sequenced across three MiSeq runs: 3555–3563 (nine samples) were sequenced using an Illumina MiSeq V2 kit at 15 pM with a 10% PhiX spike; 6554–6575 (seven samples) were sequenced using an Illumina MiSeq V2 kit at 12 pM with a 10% PhiX spike; and 7240–7280 (fourteen samples) were sequenced using an Illumina MiSeq V2 kit at 12 pM with a 10% PhiX spike. The sequence data were processed using a customized bioinformatics pipeline for quality filtering, OTU delimitation and taxonomic assignment. The eDNA metabarcoding was performed using either MiFish [30] or 12S V5 [31]. After filtering, the consensus taxonomic assignments were made for each OTU by means of: (i) sequence similarity searches against the curated Mekong fish reference database; (ii) sequence similarity searches against the NCBI nt database (GenBank); (iii) PROTAX, a probabilistic method for taxonomic classification (species, genus, family, order). Identifications from any source were accepted and in all of the cases, these were consistent at the level at which they were made. The species- and genus-level assignments were automatically retained if supported by unambiguous matches to reference sequences at ≥99% or ≥95% accuracy, respectively. In the cases where there were equally good matches with multiple species, the GBIF public records were used to assess which were most likely to be present in the Mekong. This allowed several ambiguous assignments to be resolved to species level. The OTU table was then filtered to remove low abundance OTUs from each sample (<0.02% or <10 reads, whichever was the greater threshold for the sample). Common contaminant sequences e.g., from human, known feed fish or livestock, were then removed. Unidentified or misidentified taxa can result from incomplete or incorrect reference databases, and taxa may be missed due to low quality DNA, environmental contaminants or the dominance of other species in the sample. The OTUs that could not be assigned to the species level were assigned to the genus, family or order. The non-target (including human and domestic animals) DNA levels were generally low in the samples amplified with MiFish (range 0% to 22.0%; average 2.67%), whereas the samples amplified with 12S V5 had significant levels of non-target DNA (range 83.4% to 99.8%; average 89.2%).
After an OTU assignment to a taxonomic level (n = 287, species or genus or family or order), the main biological characteristics of each species were recorded from Fishbase [32], using three variables (environment, zone, migratory type). The variable “environment” encompassed three categories (marine, brackish, freshwater) or a combination of them. The variable “zone” encompassed three categories: pelagic; benthopelagic and demersal (including benthic). The variable “migratory type” encompassed five categories: sedentary; catadromous; anadromous; amphidromous and potamodromous. If it was not possible to assign a taxonomic level to an environment, a zone or a migratory type, a missing value was assigned.

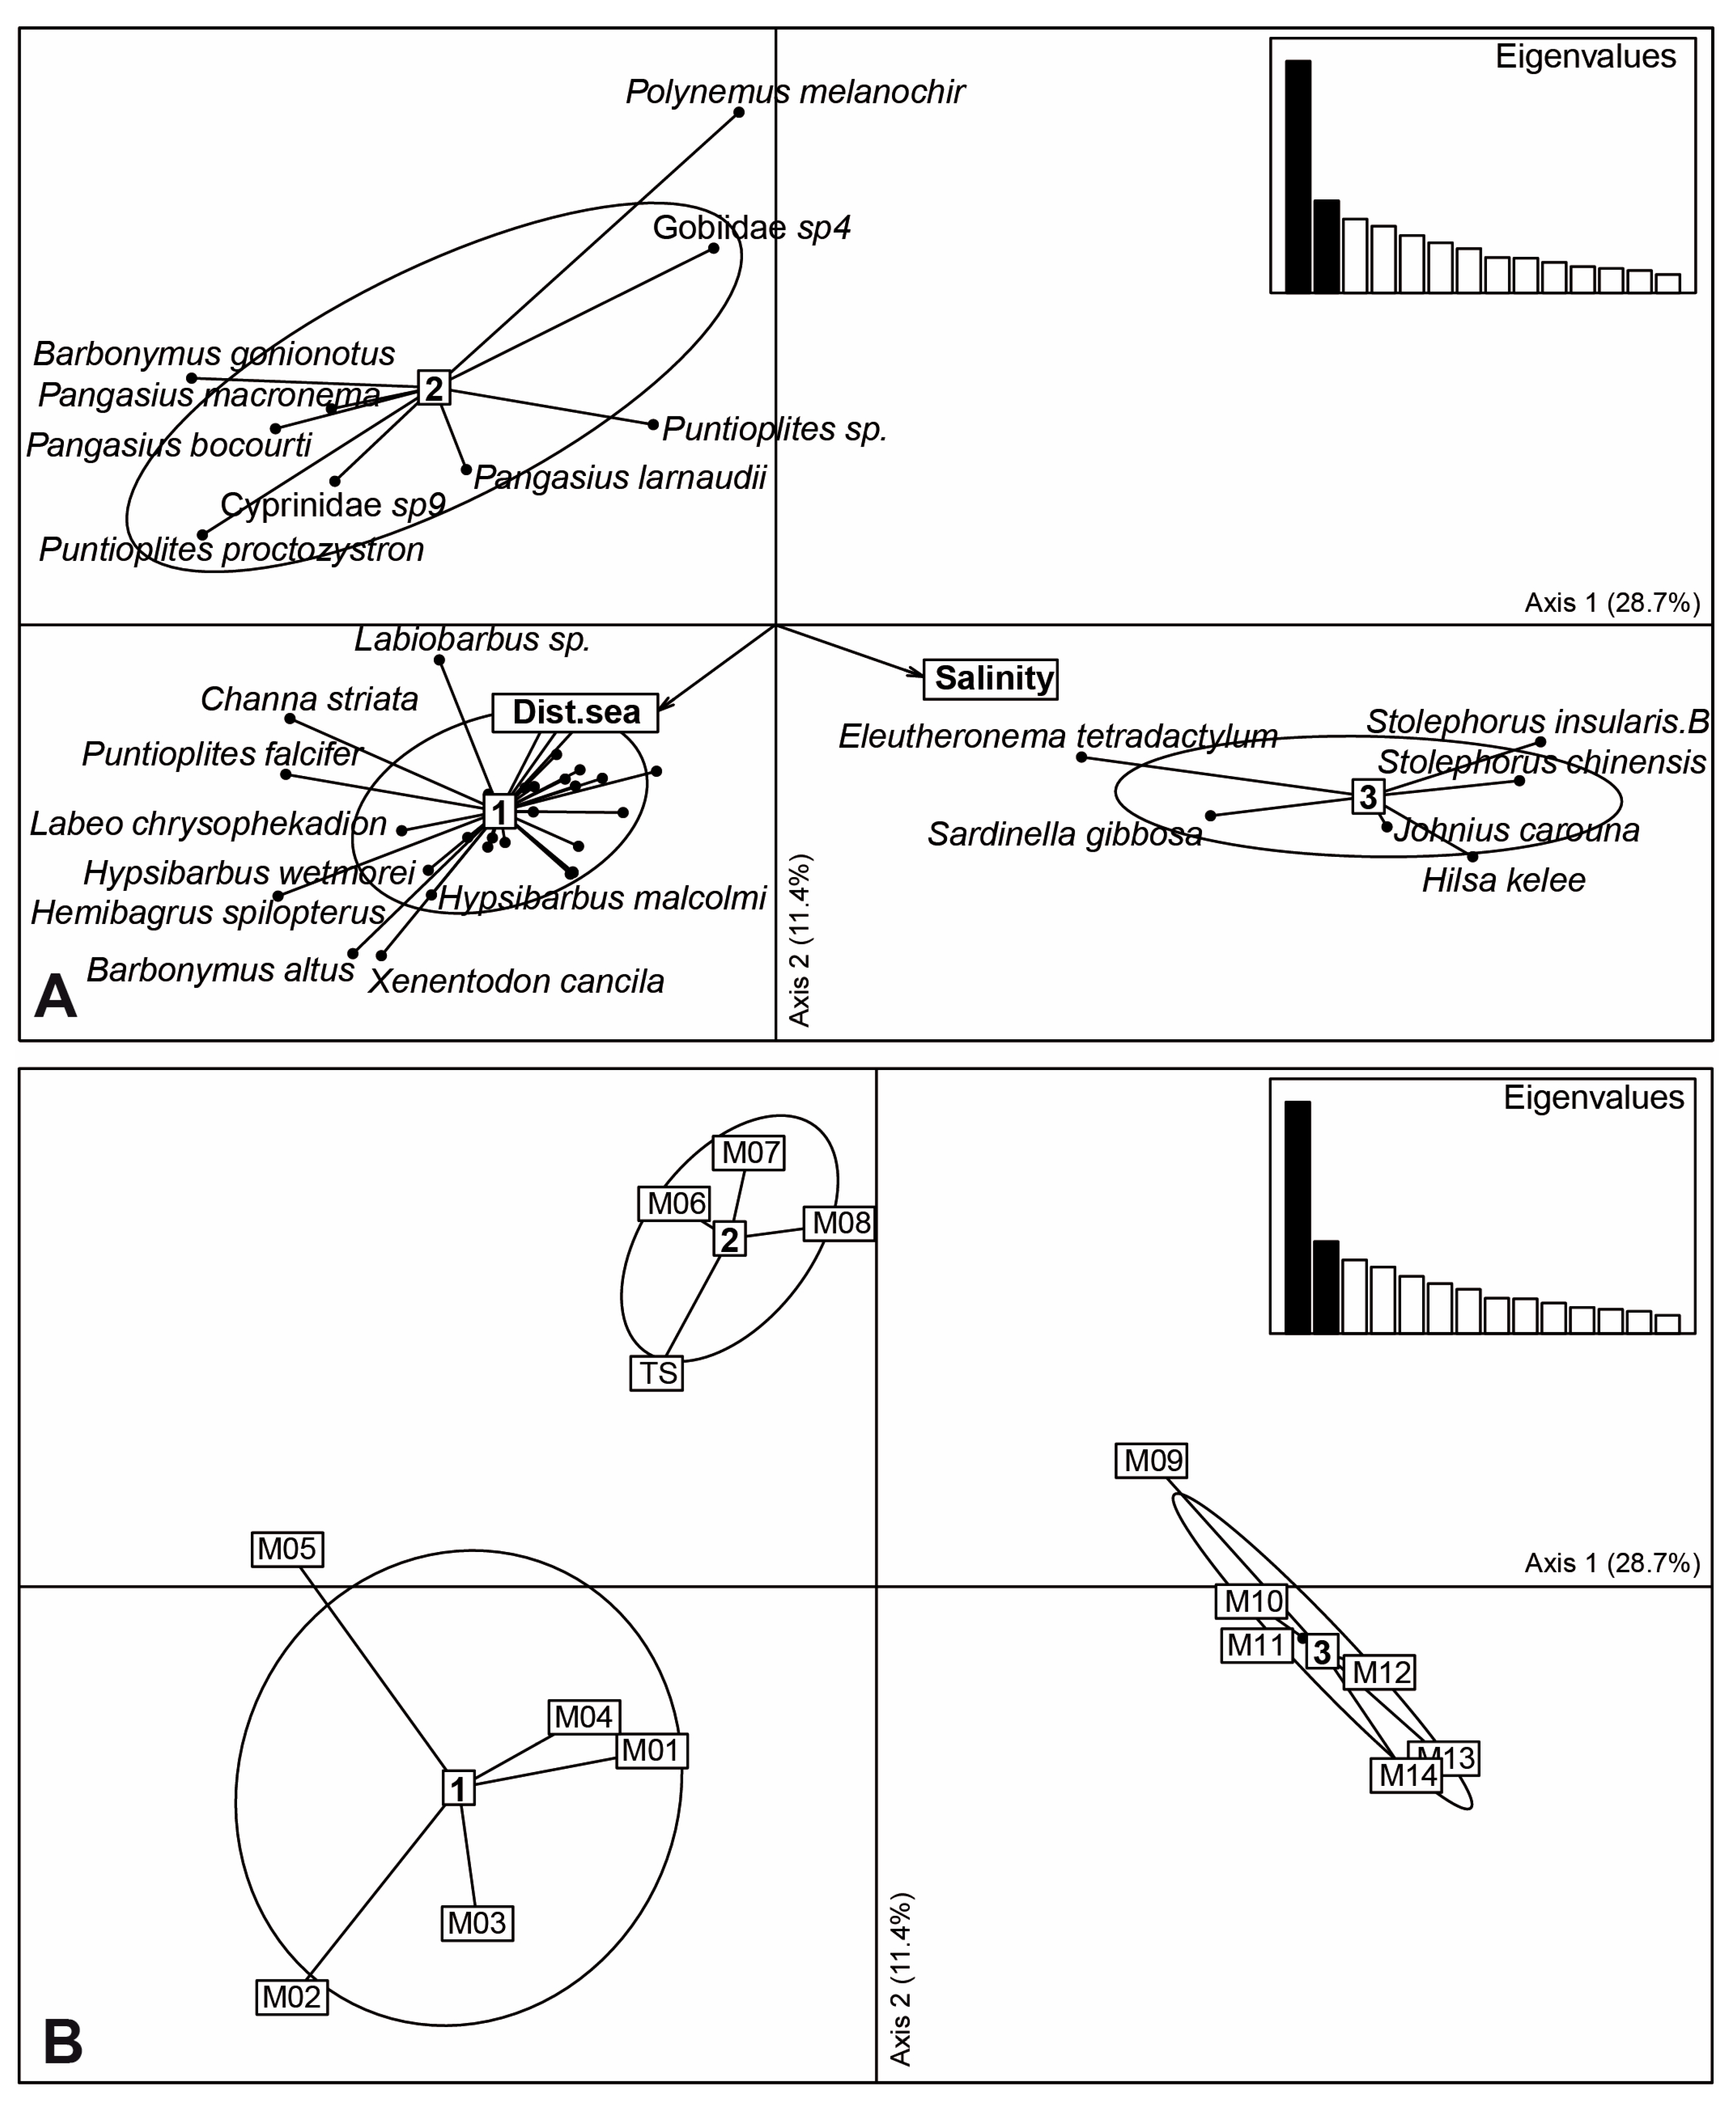
2.3. Statistical Analyses

All of the statistical analyses were performed using R software [33]. The average number of reads (i.e., the concentration of species-specific eDNA particles) was calculated for each site and each OTU (species) as a mean of the two replicates and was used as a proxy of abundance per species and per site. The utility of eDNA for quantifying the species abundance and/or biomass is largely debated since it has been demonstrated that a number of species-specific biotic factors or abiotic factors may impact its concentration and biased abundance/biomass estimates (for a review, see [34]). However, Rourke et al. [34], by reviewing 63 published studies that investigated relationships between eDNA and fish abundance, found 90% of positive relationships. Similarly, a mixed-effects meta-analysis of data, from studies that examined in the laboratory or in the natural environments the same relationship between eDNA concentration and species abundance, also concluded that, even if weaker in the natural environments, the eDNA concentration often still explained a substantial variation in abundance [35]. The alpha taxonomic diversity, i.e., the diversity measured in a uniform habitat of fixed size at a given time, was estimated for each site using three indices: S, species richness (total number of species); H′, the Shannon diversity index and J, Pielou’s evenness index. The Shannon index (H′), which accounts for the specific richness and the abundance of individuals of each species, was calculated according to the formula:
H = i = 1 S p i   ln p i
where pi is the relative abundance of the species i. H′ is associated with Pielou’s index (J) measuring the evenness of the species:
J = H L n S
J = 0 when only one species is present, and J = 1 when the abundance of all of the species is the same. The abundance and the alpha taxonomic diversity indices were plotted on a map at each site along the Mekong River and Delta.
The percentages of the species with the same biological characteristics (environment, zone, migratory type) were calculated for each site. The species with missing information concerning the environment (n = 18) or zone (n = 1) and OTU assigned only to the Order Characiform level were removed before the calculation, whereas for the migratory type, they were kept as “unknown”, as this information is missing or difficult to find for some of the species.
To reveal the community structure along the Mekong River and Delta, a centered Principal Component Analysis (PCA) was carried out on the table of abundance of the species per site. The species and sites were projected along the first two axes of the PCA. To improve the readability, only the species for which more than 50% of the inertia was represented by the first two axes are shown. The environmental data, i.e., salinity and distance from the sea, were then projected as supplementary variables on the PCA axes. Additionally, hierarchical clustering was performed for the species and sites, based on their coordinates on the two main axes of the PCA, using Euclidean distances and Ward’s minimum variance method [36]. In both of the cases, the dendrogram was cut based on Ward’s criterion to identify the homogeneous groups of species/sites. The abundance per species for each group of sites highlighted by the PCA analysis is shown in bar plots for the first 15 most abundant species per group. The PCA was performed using the “ade4” package [37].
The indicator species for the groups of sites resulting from the clustering, or the combinations between the groups of sites, were then identified using the Indicator Value (IndVal) method from the “indicspecies” package [38,39,40,41]. A species is considered to be an indicator of a given group of sites if it is faithful to it (i.e., absent or relatively less frequent in the other groups), and if it is present in all of the sites of that group (constant). As the Delta was oversampled, the group-equalized version of the abundance-based indicator value ( IndVal ind g ) was used, so that the number of sites per group was not considered proportional to the ecological variability of the group. The index for each species and each group of sites was calculated as the product of a quantity A, defined as the average abundance of the species in the group of sites divided by the sum of the average abundance values over all of the groups of sites, and a quantity B, defined as the relative frequency of the occurrence of the species within the group of sites. The significance of the group–indicator species relationship was assessed by calculating the IndVal ind g index on 9999 random abundance matrices.

2.4. Reconstruction of the Species Distribution Range
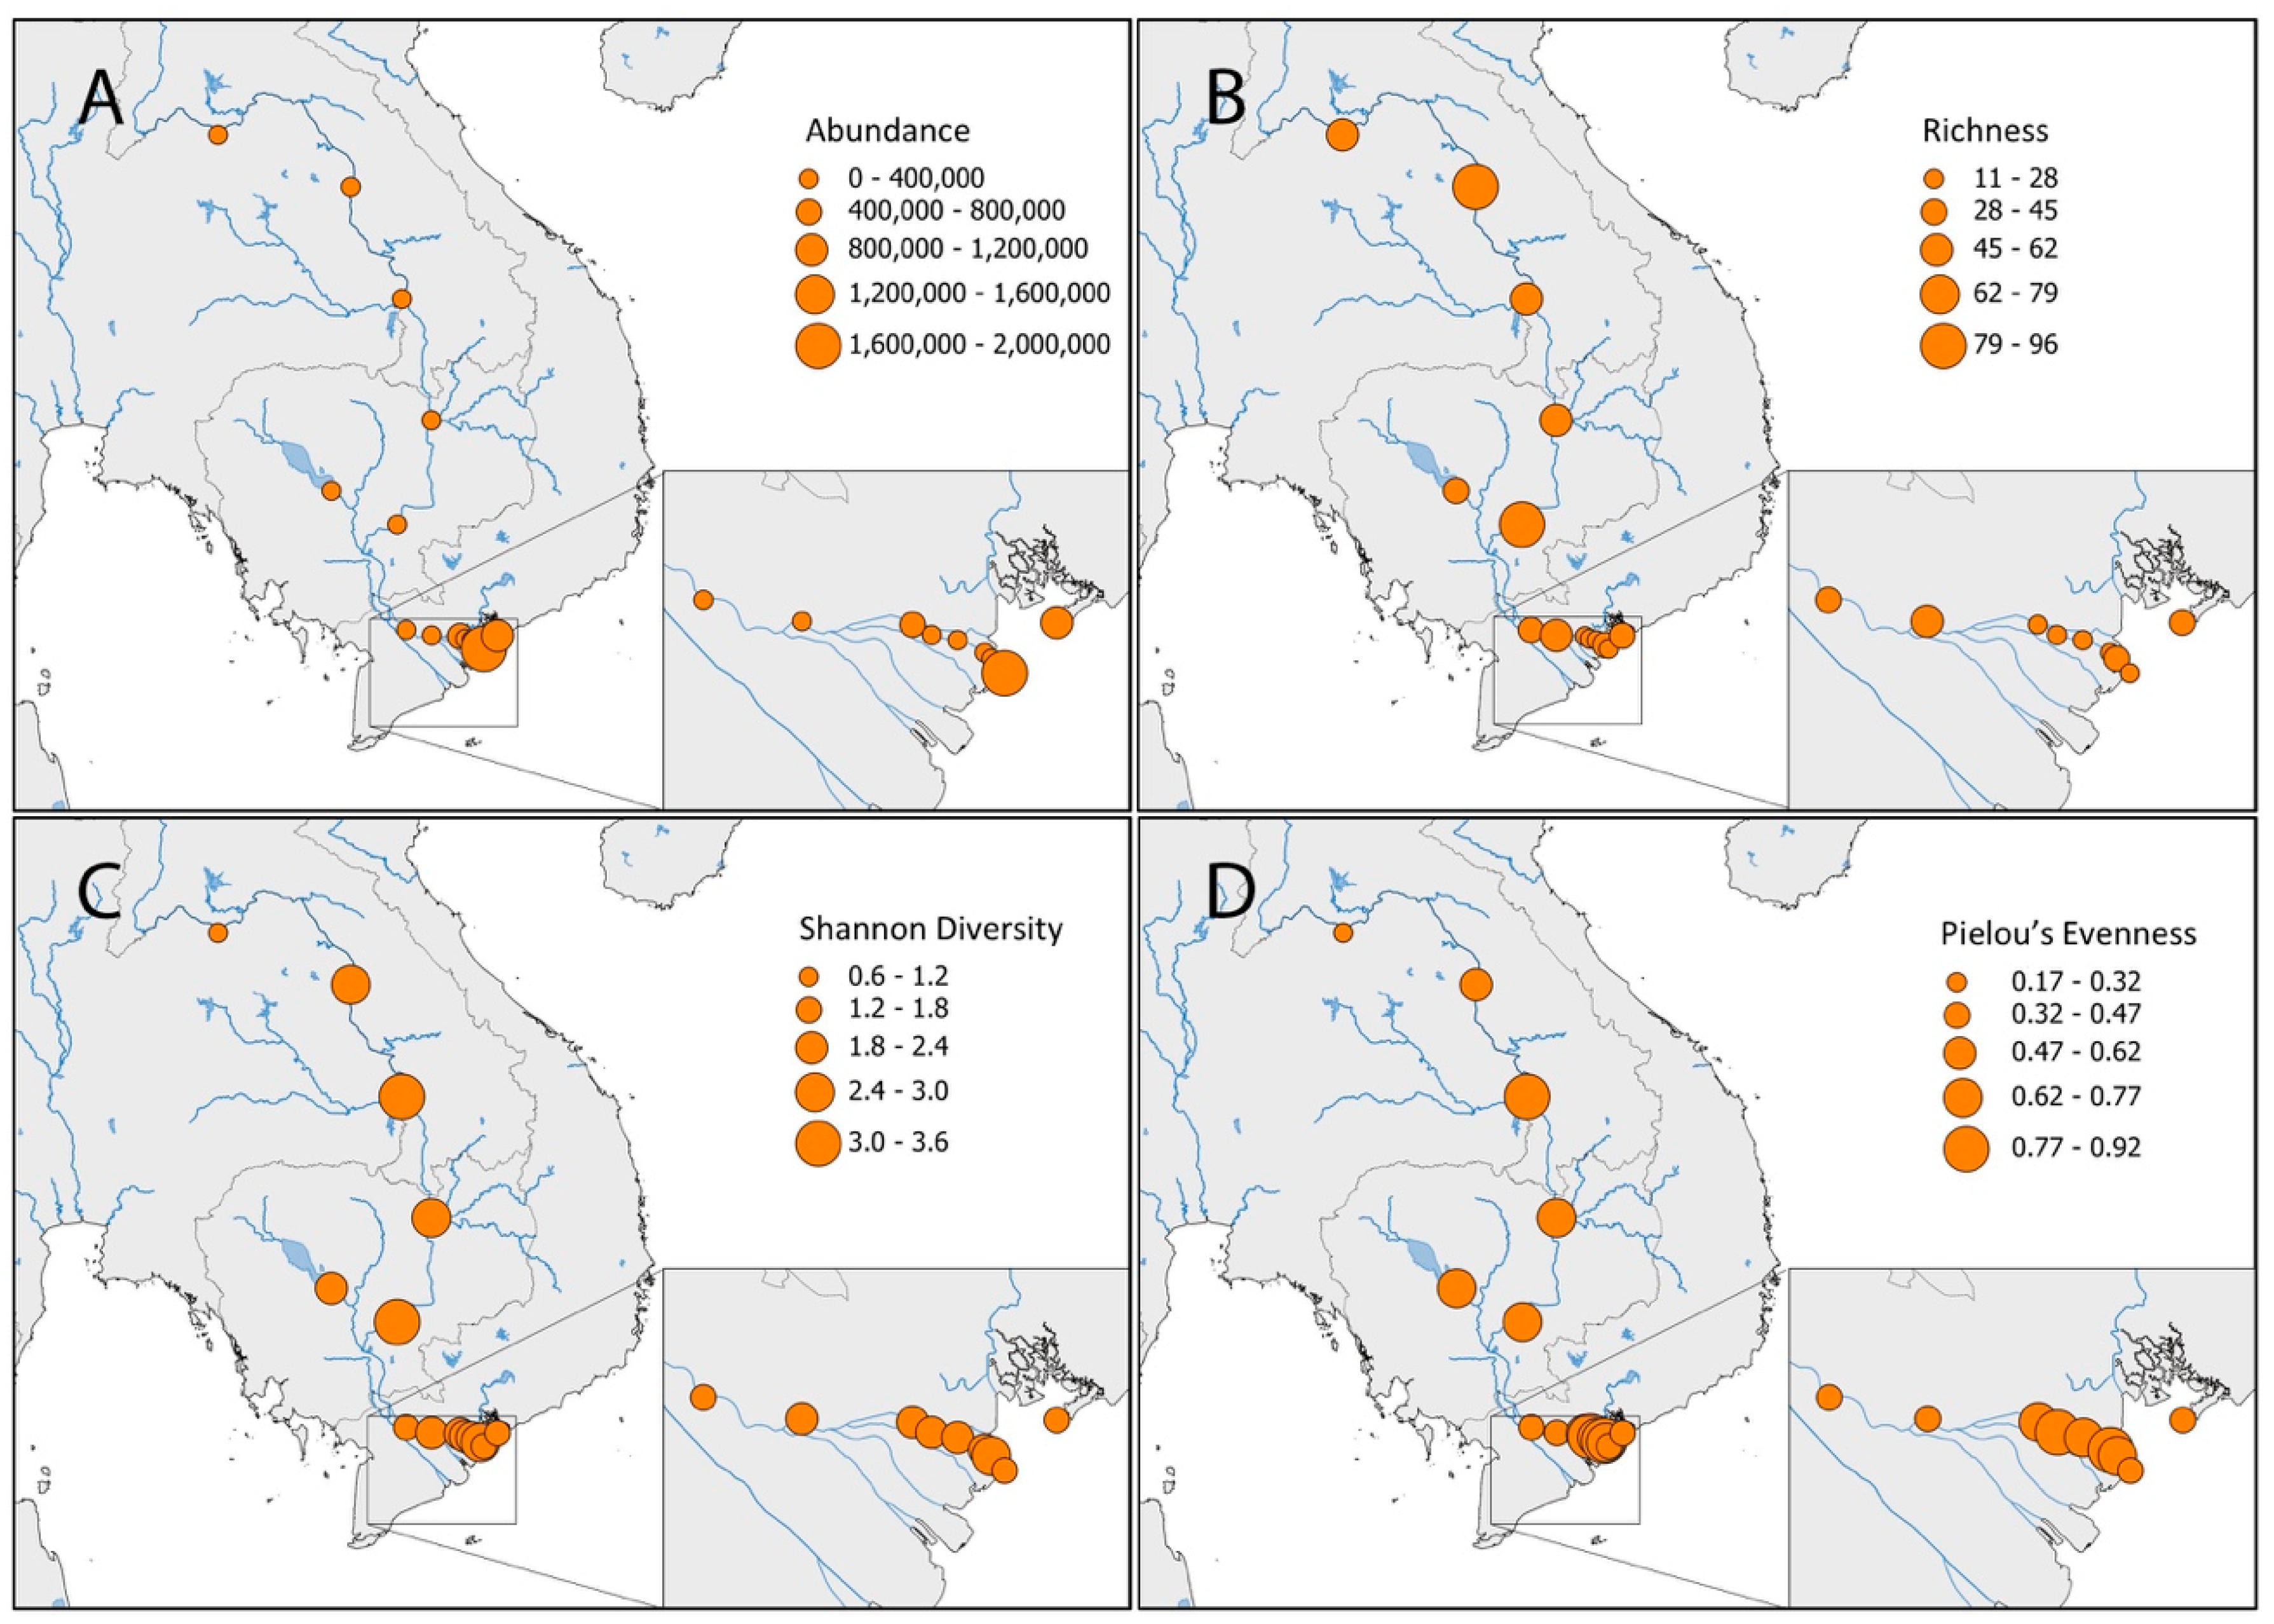
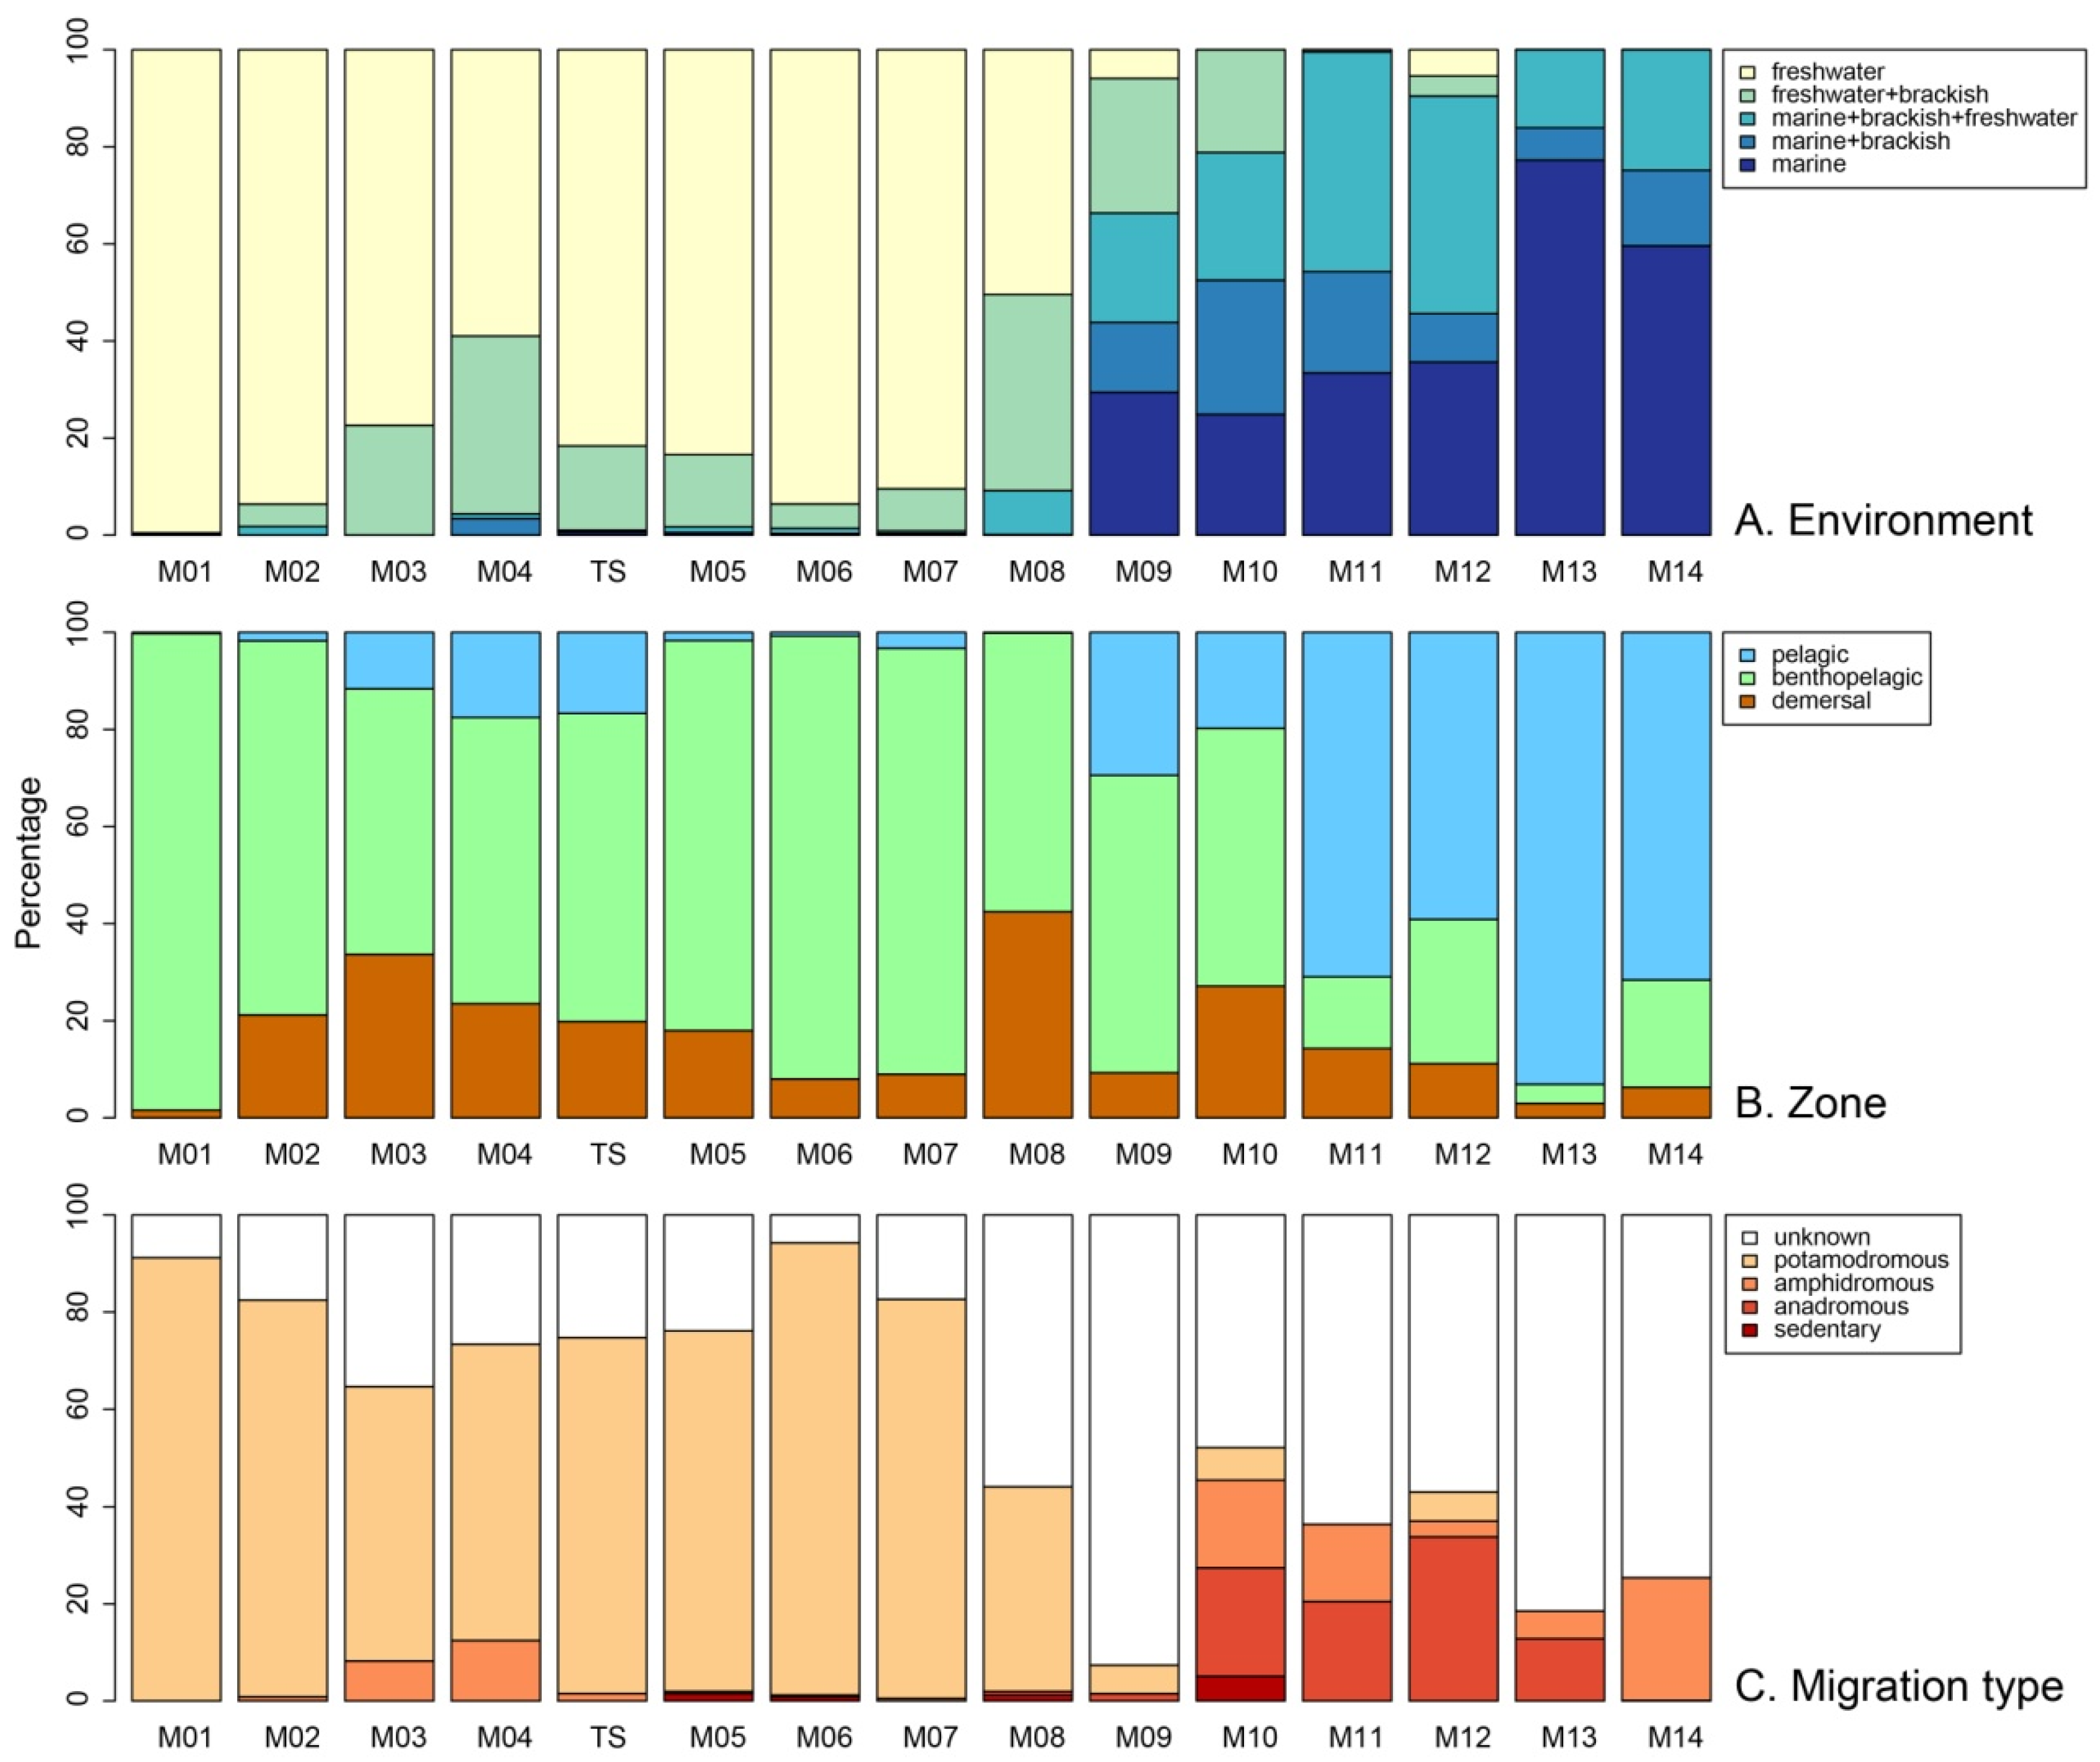
To determine if the species distribution range recovered from the metabarcoding of the eDNA is consistent with the current knowledge, for a subset of species, i.e., those representative of the different species assemblages and also observed at more than one sampling site, their distribution range in the Mekong and neighboring province was reconstructed using GBIF.org records (last consulted in 15 June 2022).

3. Results

A total of 287 OTUs corresponding to the putative fish species belonging to 140 genuses and 62 families, were recorded by eDNA among the 15 sampling sites along the Mekong River and Delta. A total of 150 OTUs were assigned to the species level, 76 to the genus, 51 to the family and 10 only to the order level. The proxy of species abundance revealed homogeneous values along the main Mekong River, with a total mean of 338,000 (±491,000 SD) reads, and an increase towards the sea where the highest abundances were found (Figure 2A). The species richness was more heterogeneous and increased along the river upstream, with a mean of 40.7 (±24.7 SD) species per site. The highest values were recorded in the main stream around Nakhon Phanom (M02, Thailand) and Kampong Cham (M05, Cambodia), with 95 and 87 species, respectively (Figure 2B). The species richness was lower and more homogeneous (12–29 species) in the Delta, and higher at sea with 39 species. The Shannon diversity index was also higher along the river upstream (Figure 2C), with a mean of 2.2 (±0.7 SD) for the total Mekong. Finally, evenness, referred to as the Pielou’s index, was homogeneous all along the Mekong (Figure 2D), with a mean of 0.6 (±0.2 SD).
The main biological characteristics of the species recorded along the Mekong River showed a clear gradient in the type of environment to which the species belong (Figure 3A). The freshwater native species were found upstream (60–99%) and included a proportion able to live in both freshwater and brackish water, whereas downstream, the majority of the species were native of the marine environment (60–70%) and others able to live in brackish water. At the Khone Falls site in Cambodia (M04), 40% of the species were linked to fresh- and brackish-water environments. A significant proportion (20 to 45%) of the downstream species was able to live in all three types of environment. These ubiquitous species were much less represented upstream, but were nevertheless present (1–3%). Based on the zone in the water column in which they live, there was a clear separation of the upstream and downstream fish communities; the upstream species were generally benthopelagic whereas the downstream species were more pelagic (Figure 3B). The demersal species (including benthic ones) were found in almost all of the sites along the Mekong (10–30%), with higher values in Thailand and in the middle Delta. The separation of the communities, using environment and zone variables, followed the same tendency upstream (Figure 3A,B); the demersal type being able to live in both fresh and brackish waters. The proportion of the species among the communities that were able to migrate was very high in the freshwater environments (70–90%), but tended to decrease downstream (Figure 3C); the migratory type was not found among a large proportion of the downstream species (163 species). The anadromous species were significantly present downstream (10–30%), together with the amphidromous species. The presence of the migratory type made it possible to separate the two fish communities; those that live in freshwater being largely potamodromous, and those that live in saline environments being amphidromous or catadromous.
The first two axes of the principal component analysis explained 40.1% of the total inertia of the species-sites abundance table, 28.7% for axis 1, and 11.4% for axis 2, respectively. The species whose cumulated relative contribution to these two axes was above 50% were projected together with salinity and distance to the sea as supplementary variables (Figure 4A). Three main groups of species were identified by clustering their coordinates on axes 1 and 2 (Figure S1, Supplementary Materials): (1) a large batch of species associated with low salinities and located far from the sea (such as Hemibagrus spilopterus, Barbonymus altus, Xenentodon cancila, Sikukia gudgeri, Clupeichthys aesarnensis); (2) a group of species comprising Polynemus melanochir, Barbonymus gonionotus, and several Pangasiidae species (P. macronema, P. larnaudii, P. bocourti), species mainly observed in the sites with low salinity but located relatively close to the sea and (3) a group of marine pelagic species (such as Stolephorus insularis, S. chinensis, Hilsa kelee, Sardinella gibbosa) linked with the highest salinity values and the shortest distance to the sea on the right side of Axis 1 (Figure 4A). The clustering of the sites on the first two axes of the PCA based on their coordinates (Figure S2, Supplementary Materials), clearly identified three groups of sites (Group 1: M01-M05; Group 2: M06-M08+TS and Group 3: M09-M14), projected on the PCA axes (Figure 4B). These groups reflected a well-ordered distribution of the sites along the Mekong, with no spatial overlap. The mean proportions of species abundance in each group revealed different community assemblages (Figure 5). Group 1 was dominated by one third of Oreochromis niloticus (35.6%), whereas other species accounted for less than 10% (Channa striata, Xenentodon cancila, Puntioplites proctozystron), and generally for less than 3%. In Group 2, Polynemus melanochir and O. niloticus together accounted for more than 40%, followed by two species around 9% (Channa micropeltes and Pangasius bocourti). Group 3 was dominated by strictly pelagic marine species (Stolephorus insularis and S. chinensis) which accounted for 56.2%, whereas the third species (Hilsa kelee) accounted for 10.1%. Among the 15 most abundant species per group, no species common to the three groups was identified. Six species were common to Groups 1 and 2. Forty-eight species were identified as indicator species, of which 41 were associated with only one group, and seven with two groups. Thirty-one species were associated with Group 1, four with Group 2 and six with Group 3; seven species were associated with groups 1 + 2 together; no species was an indicator of a combination of groups that included group 3 (Table 2).

4. Discussion

4.1. Limits and Advantages of the eDNA Approach in the Mekong River and Delta

This study is the first large-scale characterization of fish diversity in the Mekong using an eDNA approach. The previous eDNA studies in the Mekong River were usually geographically limited to one dam reservoir, for example in Laos [25], or targeted specific species, such as the giant catfish Pangasianodon gigas [26], or both, such as in Thailand on the clown featherback Chitala ornata [27] or the giant catfish [41]. The overall diversity recorded in this study, with 287 identified OTUs, largely exceeds the diversity recorded in the study by Gillet et al. [25] in which 122 species were characterized. It should also be noted that Gillet et al. [25] used a lower similarity threshold to identify the species (97%) than the one used in the present study (99% of sequence similarity). Using a higher similarity threshold could artificially generate more species than actually present in the river, but in the present case, the only notable impact was that it limited our ability to assign a species name to an OTU, which remains a limited impact, as most of the OTUs presented either a sequence similarity of between 100% and 99%, and when this was not the case, the similarity dropped below 97% in most of the cases. In contrast, using a lower similarity threshold may lead to mixing sister species or species that diverged recently. Using our new local library, we estimated that a threshold of 97% would lead to 52 pairs of species (52 OTUs with between 97% and 99% similarity out of a total of 287 OTUs). Anyway, even when we corrected our dataset using a similar threshold as Gillet et al. [25], our study still characterized more fish diversity, which is not surprising, considering the geographical and ecological scope of our study, which included marine, brackish and freshwater habitats, whereas Gillet et al. [25] limited their study to freshwater.
The fish diversity we recorded almost completely matched the species recorded by Rainboth et al. [42] in the Mekong River and Delta; among the 158 OTUs identified at the species level, only 10 were not listed (Table S1). Two out of the 10 corresponded to the species described too recently to be reported by these authors: Acantopsis ioa was described in the Mekong River in 2017 [43]; and Decapterus smithvanizi was described in 2013 from specimens collected in Indonesia and Thailand but also presumed to be present in the South China Sea [44]. All of the other species were not necessarily new records, as according to GBIF (consulted in April 2022), only two were not previously described in the Mekong or were probably introduced for the purpose of aquaculture, such as the West African Cichlid, Sarotherodon melanotheron or the cyprinid Cirrhinus cirrhosus. The two species that could be new to the Mekong are Nemipterus bipunctatus (Nemipteridae) and Gobiopterus lacustris (Gobiidae). The first species is a marine species with a large distribution range in the Indian Ocean stretching from the Red Sea to the Straits of Malacca [45] but with only two records in the Gulf of Thailand (GBIF.org 2022). The presence of this species in the Mekong Delta (at site M10) can be considered as probable, and should be considered as a new record for the Mekong, thereby extending a little the known distribution range of this species. In contrast, the presence of Gobiopterus lacustris in the Mekong at site M2 in Thailand is more doubtful, since this freshwater species is endemic of Luzon, in the Philippines (Fishbase consulted in April 2022) [32]. However, the two GenBank sequences labelled Gobiopterus lacustris (NC_040003 and MG581362) that presented 100% identity with our 12S sequence eOTU164 were probably misidentified, since the specimens used to establish the DNA barcodes were collected in China. These specimens have been confused with Gobiopterus chuno, a species on the list compiled by Rainboth et al. [42], and for which 12S sequences presented 99% identity (LC049793) with eOTU164. This last result underlines the need for a curated reference barcode library for the eDNA analyses. Recently, Pham et al. [46] used a DNA barcoding approach to identify juveniles or small crypto-benthic species collected in Con Dao (Vietnam) and estimated that up to 30% of the OTUs recovered in the samples could not be identified precisely due to species misidentification or mislabeled sequences in BOLD (the international DNA barcode library of the iBOL consortium). The taxonomic uncertainty concerning the DNA barcodes used for species identification is well-known and has already been flagged in numerous barcoding studies [46]. In this context, BOLD proposes an interim taxonomic nomenclature to circumvent these taxonomical issues, by assigning all of the DNA barcodes available in the BOLD library with a barcoding index number (BIN) that correspond to an OTU [47]. However, the barcoding marker used for the fish species identification in BOLD, and hence the assignment of a barcode to a BIN, differs from the markers used in the eDNA investigations. While the DNA barcoding studies use the sequence polymorphisms of 652 base pairs of the cytochrome oxidase 1 (COI) fragment, for technical reasons, the markers used in the eDNA metabarcoding studies are shorter and mainly target other mitochondrial genes, such as the 12S RNA. Thus, in BOLD, it is not possible to link an OTU identified on a 12S marker to a BIN, unless the specimens used to establish a local DNA barcode include both the 12S and the COI sequences. This process has started (Nguyen et al. in prep), and was used in the present study. This first attempt to build a bridge between the BOLD library and the local library used for eDNA now needs further promotion. The investigations of fish diversity based on eDNA could be greatly improved if all of the taxonomical knowledge generated by BOLD was taken into consideration. In fact, the disconnection between the “DNA barcoding” and “eDNA metabarcoding” communities is striking, and despite all of the experience gained from barcoding surveys, the people who use metabarcoding for species identification largely underestimate the problems involved in a DNA based species identification. While Marques et al. [29] noted that the main limitation of the eDNA inventories was the incompleteness of the species sequences available in public genetic databases, there was no reference in the literature to the mislabeled sequences in these databases or the high frequency of cryptic species among the species with a large distribution range [48,49,50,51]. To our knowledge, this issue has never been addressed in the eDNA studies, even though species misidentification or the presence of cryptic species may have a serious impact on the ability of the method to depict the global diversity. This is especially true for the use of a checklist of local species to determine the species distribution range at a larger geographic scale. The DNA barcoding studies deeply modified our perception of diversity by demonstrating that the morphometric characters usually used to delimit species largely underestimate species diversity, but overestimate the distribution range of numerous species. Using an uncurated library to assign a sequence to a species or using metabarcodes that are unable to distinguish between the phylogenetically close species, represent a step backward in our understanding of species diversity and distribution. For this reason, all of the species assigned using OTUs were particularly carefully checked in the present study.
The second much more widely debated issue in the eDNA investigations is the taxonomic gap in the reference libraries used to assign a DNA sequence to a species [29]. According to Jerde et al. [28], depending on the pairs of primers and the mitochondrial portion (i.e., the metabarcode), less than 50% of the total basin-wide fish species richness would be represented in GenBank. However, this estimation is most probably overestimated, since Jerde et al. [28] used the GAPeDNA interface to assess the global genetic database completeness for Mekong fish and for the metabarcodes used so far in eDNA investigations. As mentioned earlier, the approach used by Marques et al. [29] overestimated the DNA barcode availability of libraries such as GenBank. Using our more local DNA library, we were able to improve the species identification by up to 22%. Nevertheless, 55% of the eOTU remains un-identified at the lowest taxonomic rank, which calls for more barcoding effort and at least the identification for the same specimen of both 12S and the COI sequences.

4.2. Mekong Aquatic Environment and Fish Distributions

Among the main results of this eDNA investigation of the Mekong fish diversity, there was a clear spatial delimitation between the brackish and marine species distributions vs. the freshwater species. If the freshwater species clearly dominated over the marine and brackish species at the freshwater sites (M1 to M8), the pattern was inverted as soon as the salinity reached five (at site M9) and higher levels (M10 to M14). The sharp partition of the freshwater and marine species along a salinity gradient is common to estuaries worldwide. Although some physiological explanations have been put forward for the absence of freshwater species in the brackish and marine waters, such as their inability to develop chloride cells in gill filament epithelia, Whitfield [51] suggested that other factors, such as predation and competition, may also prevent the penetration of these species in mesohaline (M9 to M11 with salinity 5 to 17) or even more saline waters (M12 to M14 with salinity 21 to 30). Beyond the ecological reasons for such differences in the species assemblage, this finding clearly demonstrates that the potential persistence of the eDNA associated with the Mekong river flux that is able to artificially extend the spatial presence of a species [52] did not bias our detection of fish assemblage with respect to the salinity gradient. Various abiotic and biotic factors influence the aqueous eDNA decay rates [53], the most frequently mentioned in the literature being temperature [54], pH [55], sediment load [56], the species biomass [54] and the microbial abundance and composition [55,57,58]. Numerous studies using experimental approaches or meta-analyses of different eDNA datasets have tried to evaluate the relationships between these factors and the rate of eDNA decay, but obtained contrasting results, probably due to interactions between complex factors (for a review, see [58]). Furthermore, the river dynamics add complexity due to stream eDNA advection and dilution [52]. By evaluating the longitudinal variation of carp eDNA along a river downstream from a farm, the latter authors demonstrated that after 900 m the eDNA concentration decreased drastically, but was still detectable 3 km farther on. However, for all of the above-mentioned reasons, no generalizations can be made and the simulations performed by Nukazawa et al. [52] did not match the field observations. In the present context, considering the chemistry of the Mekong River water, the eDNA dilution due to the numerous tributaries connecting to the main channel and the distance between our samples sites (10 km between sites M8 and M9), it is probable that the picture of fish species assemblage recovered through the eDNA metabarcoding was not affected. In conclusion, the global spatial fish distribution along the Mekong River showed a clear and expected pattern for the different groups of species in the presence of abiotic factors, the saline environments being clear barriers, with no outliers in the eDNA results, i.e., no marine species found in the freshwaters or the reverse.
More surprisingly, the present study highlighted two spatially structured species assemblages in the freshwater Mekong River that do not correspond to any biogeographic pattern described to date [9,59]. While the Tonle Sap diversity showed a clear proximity with the neighboring, downstream Mekong sites (M6, M7 and M8) until the water became more saline, in contrast, the upstream locations (M1 to M5) shared statistically similar species assemblage (Figure 5). The most amazing result is certainly the proximity of the Khone Falls site to more upstream sites. In contrast, the most recent study on fish biogeography along the Mekong River revealed nine biogeographical regions (from upstream to downstream: two successive Headwater Regions in China—the Upper Region corresponding to the Mekong part flowing in the Yunnan province and the Middle Region encompassing the Chinese border and the North of Laos; the Middle Region corresponding to the south of Laos; the Nam Chi-Nam Mun Region; the Se San-Se Kong Sre Pok Region; the Tonle Sap Region; the Estuary Region in Vietnam). Based on the information concerning distribution, each of the regions hosted a unique fauna with different dominance or endemism at the genus level, and seven regions based on the “fish migration system” and hierarchical cluster analysis [9]. This study was only based on a list of species taken from a literature survey. In the middle Mekong and Delta, these regions tend to overlap and correspond, even if the lower system extends until the Khone Falls in Cambodia [9]. The Tonle Sap acts as a unique entity, separate from the other upstream or downstream regions. Our study, only based on the eDNA distribution, provides more detailed information on the distribution, for example, with a link between more downstream sites. Upstream, the fish communities were more linked and were homogeneously distributed, the Khone Falls not representing a real barrier to distribution. The results of an overview of the ecosystem connectivity in the Mekong River Basin based on a combination of hydrological river types, ecological regions and the extent of the floodplain and carbonate outcrop data [60], tended to match our results, as in our study the Khone Falls did not act as a barrier to connectivity either. The two ecoregions highlighted by Abell et al. [59], namely the Mekong Delta and the Khorat Plateau, also matched our hypothesis concerning the fish distribution. Nevertheless, these patterns need to be confirmed through more eDNA sampling along the Mekong.
The comparison of some species distribution in the Mekong based on GBIF records and eDNA metabarcoding was largely congruent (Figure 6). Using eDNA data, species such as Ilisha melnostoma (Figure 6A), Hilsa kelee (Figure 6B), Polynemus melanochir (Figure 6C) and Johnius borneensis (Figure 6D), that are known to have little affinity for freshwater conditions, had a clear distribution range limited to the Mekong estuary. On the other hand, the species not yet recorded in the Mekong Delta, such as Mystacoleucus marginatus (Figure 6L), Cosmochilus harmandi (Figure 6M), Hypsibarbus malcolmi (Figure 6N) and Sikukia gudgeri (Figure 6O), remained absent from this part of the Mekong. Interestingly, using the eDNA showed the distribution range of some of the species to be limited to the Mekong Delta, whereas the GBIF records demonstrated a much larger distribution range in the Mekong for Labeo chrysophekadion (Figure 6E) or Pangasius krempfi (Figure 6G). However, these species are known to undertake seasonal migration for feeding or reproduction [61], which could mean that a time-limited eDNA sampling campaign may artificially restrict the spatial range of distribution of a species. Using the ratio otolith 87Sr/86Sr and Sr/Ca in Pangasius krempfi, Tran et al. [62] demonstrated that this species is an anadromous fish that breeds in the freshwater regions in the Mekong mainstream along the Laos–Thailand border or in Cambodia, and then at early stages, migrates to the Mekong Delta, and spends most of its lifetime in the brackish and marine environments. Concerning Labeo chrysophekadion, Sokheng et al. [61] assumed the presence of several populations with different behavior in the Mekong River. While the populations present in Laos and Thailand were hypothesized to migrate into tributaries and small streams to feed when the water starts to rise, in Vietnam, its abundance throughout the flood plain would limit its migration and facilitate its detection using the eDNA approach.
The metabarcoding of the eDNA thus appears to be a very powerful tool to rapidly identify the fish communities and their distribution along the Mekong River and Delta. Our study provides a snapshot taken at the time of sampling and could be used as a reference for future studies. The power of the technique was revealed when sorting the sites as a function of saline environments (marine, brackish delta, freshwater delta, freshwater sites, etc.) to obtain an accurate description of both the biodiversity and community distribution. The salinity acted as the main driver of the fish distribution. The pelagic species were more present in the more saline waters and in the Delta, whereas the benthopelagic species were more present upstream in the freshwater conditions. The more demersal species were encountered in all of the environmental conditions along the Mekong. Both the environmental conditions and the life zones of the species were able to clearly distinguish the distributions of the fish communities along the Mekong when the eDNA was used. Although our survey remains preliminary with respect to the spatial and temporal distribution or ecological niches of the fish species, the data acquired should encourage additional sampling to target more locations/habitats in the Mekong, and contrasting migratory behavior makes the temporal/seasonal sampling highly desirable.

4.3. Migratory Fishes in the Mekong and Their Conservation

The main issues with fish biogeography along the Mekong River and Delta are the migratory behavior of the different fish species and the impact of dam building [9,12]. The present study showed that migratory species were present all along the Mekong, with high percentages upstream (70 to 95%). The eDNA survey reinforces the concerns about the building of more dams along the main river. Only the amphidromous and anadromous species would have a chance of surviving, as more of these species were found in the Delta and estuarine area, where no dams are planned. The future life cycles of all of the potamodromous species in the Mekong are at risk. In their review, Kang and Huang [9] concluded that there were seven separate but not independent migratory systems. Many of the species are able to cross the different systems. Large projects, such as cascade dams with an amplification effect, could have irreversible ecological consequences, mainly by obstructing the fishes’ migration pathways [9]. Around 90% of the fish species in the Mekong River are migratory and 50% of the fisheries include long-distance migrants [63]. It goes without saying that our results reinforce the issue of migratory fish species in this area, and that substantial conservation measures are required as soon as possible.

5. Conclusions

This is the first environmental DNA survey along the Mekong River and Delta that could be used as a benchmark in the region for future measures to guarantee the conservation of this complex ecosystem. Our results concerning the fish distribution with their potential adaptive strategies towards salinity, and the zone in the water column in which they live are consistent, and match expected and precise patterns. The distribution of the communities was more homogeneous than expected, and showed three main regions linked to salinity or to the Tonle Sap lake environment. The freshwater area above the Tonle Sap was also more homogeneous than previously thought. The impact of future dam building along the Mekong will then be very different regarding these regions. First, the region including the Delta and its biodiversity will be less impacted, as no dam construction is scheduled in the near future, and only around 20% of fish species are amphidromous. The fish diversity of the second region, including the Tonle Sap and sites downstream up to the Delta, could have a more serious effect, even if dam building is not scheduled in this area, but because 70 to 90% of species are potamodromous. Finally, the most threatened area is located upstream, from Vientiane, in Laos and Thailand, to Kampong Cham in Cambodia, because the numerous dams will be constructed in the main Mekong River, and more than 60% of the fishes are migratory, reinforcing the warning of Nuon et al. [64]. This study reinforced existing concerns and raises a red flag about future dam construction along the main river, as many of the species encountered were potamodromous. The message here is that the conservation of migratory fish species in this large freshwater environment must become a priority, otherwise they are doomed.

Supplementary Materials

The following are available online at https://www.mdpi.com/article/10.3390/d14080634/s1, Figure S1: Agglomerative hierarchical clustering according to the Euclidean distances of species identified by the PCA (Ward’s method). Figure S2: Agglomerative hierarchical clustering of species PCA Euclidean distances of sites (Ward method), Table S1: Fish species recorded in the Mekong River and Delta by Rainboth et al. [42] and in the present study.

Author Contributions

J.-D.D. and J.P. designed the study; J.-D.D., J.P., H.D.H., N.T.T., C.G., B.N.L.N. and B.C. collected the samples; statistical analyses were performed by J.-D.D., M.S. and J.P.; J.-D.D. and J.P. wrote the manuscript. All authors have read and agreed to the published version of the manuscript.

Funding

The molecular analysis was funded by IRD, France and CNRS INSU EC2CO.

Institutional Review Board Statement

Not applicable.

Informed Consent Statement

Not applicable.

Data Availability Statement

The dataset generated/or analyzed during the current study are available from the corresponding author on reasonable request.

Acknowledgments

This study was supported by the CNRS INSU EC2CO (French National Grant EC2CO-Biohefect/Ecodyn//Dril/MicrobiEn-MODIM Mapping the natal origin and diversity of Mekong fishes for conservation purposes), the Joint Research Unit MARBEC Marine Biodiversity, Exploitation and Conservation (University of Montpellier, Ifremer, CNRS, IRD) (MARBEC “Projets Sud” and “Specific Action”), and the International IRD-SEDES Joint Laboratory (Ho Chi Minh City, Vietnam). The funders had no role in the study design, data collection and analysis, decision to publish, or preparation of the manuscript. The authors would like to thank the Department of Fisheries and Manager of Binh Thang Fishery Port in Ben Tre Province for their permission and assistance during sampling in the Mekong Delta. We are also grateful to Claire Golliet and Phong Hoai Trinh for their assistance with field and laboratory work.

Conflicts of Interest

The authors declare that they have no conflicts of interest.

References

  1. Pörtner, H.O.; Peck, M.A. Climate change effects on fishes and fisheries: Towards a cause-and-effect understanding. J. Fish Biol. 2010, 77, 1745–1779. [Google Scholar] [CrossRef] [PubMed]
  2. Cheung, W.W.L.; Lam, V.W.Y.; Sarmiento, J.L.; Kearney, K.; Watson, R.; Pauly, D. Projecting global marine biodiversity impacts under climate change scenarios. Fish Fish 2009, 10, 235–251. [Google Scholar] [CrossRef]
  3. Daufresne, M.; Boet, P. Climate change impacts on structure and diversity of fish communities in rivers. Glob. Change Biol. 2007, 13, 2467–2478. [Google Scholar] [CrossRef]
  4. Lejeusne, C.; Chevaldonné, P.; Pergent-Martini, C.; Boudouresque, C.F.; Pérez, T. Climate change effects on a miniature ocean: The highly diverse, highly impacted Mediterranean Sea. Trends Ecol. Evol. 2010, 25, 250–260. [Google Scholar] [CrossRef] [PubMed]
  5. Pörtner, H.O.; Farrell, A.P. Physiology and climate change. Science 2008, 322, 690–692. [Google Scholar] [CrossRef]
  6. Liu, S.; Lu, P.; Liu, D.; Jin, P. Pinpointing source of Mekong and measuring its length through analysis of satellite imagery and field investigations. Geo-Spat. Inf. Sci. 2007, 10, 51–56. [Google Scholar] [CrossRef]
  7. Baran, E.; Baird, I.G.; Cans, G. Fisheries Bioecology at the Khone Falls (Mekong River, Southern Laos); WorldFish Center: Penang, Malaysia, 2005. [Google Scholar]
  8. Coates, D.; Poeu, O.; Suntornratana, U.; Tung, N.T.; Viravong, S. Biodiversity and fisheries in the Lower Mekong Basin; Phnom Penh: Mekong development series, 2, 30; Mekong River Commission: Phnom Penh, Cambodia, 2003. [Google Scholar]
  9. Kang, B.; Huang, X. Mekong fishes: Biogeography, migration, resources, threats, and conservation. Rev. Fish. Sci. Aquac. 2022, 30, 170–194. [Google Scholar] [CrossRef]
  10. Hortle, K.G. Chapter 9—Fisheries of the Mekong River Basin. In The Mekong; Campbell, I.C., Ed.; Elsevier Publishers: Amsterdam, The Netherlands, 2009; pp. 197–249. [Google Scholar]
  11. Kano, Y.; Dudgeon, D.; Nam, S.; Samejima, H.; Watanabe, K.; Grudpan, C.; Grudpan, J.; Magtoon, W.; Musikasinthorn, P.; Nguyen, P.T.; et al. Impacts of dams and global warming on fish biodiversity in the Indo-Burma hotspot. PLoS ONE 2016, 11, e0160151. [Google Scholar] [CrossRef]
  12. Stone, R. Dam-building threatens Mekong fisheries. Science 2016, 354, 1084–1085. [Google Scholar] [CrossRef]
  13. Ficke, A.D.; Myrick, C.A.; Hansen, L.J. Potential impacts of global climate change on freshwater fisheries. Rev. Fish Biol. Fish. 2007, 17, 581–613. [Google Scholar] [CrossRef]
  14. Lauri, H.; de Moel, H.; Ward, P.J.; Räsänen, T.A.; Keskinen, M.; Kummu, M. Future changes in Mekong River hydrology: Impact of climate change and reservoir operation on discharge. Hydrol. Earth Syst. Sci. 2012, 16, 4603–4619. [Google Scholar] [CrossRef]
  15. Fukushima, M.; Jutagate, T.; Grudpan, C.; Phomikong, P.; Nohara, S. Potential effects of hydroelectric dam development in the Mekong River basin on the migration of Siamese Mud Carp (Henicorhynchus siamensis and H. lobatus) elucidated by otolith microchemistry. PLoS ONE 2014, 9, e103722. [Google Scholar] [CrossRef] [PubMed]
  16. Ferguson, J.W.; Healey, M.; Dugan, P.; Barlow, C. Potential effects of dams on migratory fish in the Mekong River: Lessons from salmon in the Fraser and Columbia Rivers. Environ. Manag. 2011, 47, 141–159. [Google Scholar] [CrossRef]
  17. Le, S.T.; Vo, C.D. The livelihood adaptability of households under the impact of climate change in the Mekong Delta. J. Agribus. Dev. Emerg. Econ. 2020, 11, 7–26. [Google Scholar] [CrossRef]
  18. Sebastian, L.S.; Sander, B.O.; Simelton, E.; Ngo, D.M. The Drought and Salinity Intrusion in the Mekong River Delta of Vietnam; Assessment Report; CGIAR Research Centers in Southeast Asia: Wageningen, The Netherlands, 2016. [Google Scholar]
  19. Nguyen, A.L.; Dang, V.H.; Bosma, R.H.; Verreth, J.A.J.; Leemans, R.; De Silva, S.S. Simulated impacts of climate change on current farming locations of striped catfish (Pangasianodon hypophthalmus; Sauvage) in the Mekong Delta, Vietnam. AMBIO 2014, 43, 1059–1068. [Google Scholar] [CrossRef] [PubMed]
  20. Ziv, G.; Baran, E.; Nam, S.; Rodríguez-Iturbe, I.; Levin, S.A. Trading-off fish biodiversity, food security, and hydropower in the Mekong River Basin. Proc. Natl. Acad. Sci. USA 2012, 109, 5609–5614. [Google Scholar] [CrossRef]
  21. Valbo-Jørgensen, J.; Coates, D.; Hortle, K. Chapter 8—Fish Diversity in the Mekong River Basin. In The Mekong; Campbell, I.C., Ed.; Elsevier Publishers: Amsterdam, The Netherlands, 2009; pp. 161–196. [Google Scholar]
  22. Kottelat, M. Diagnoses of a new genus and 64 new species of fishes from Laos (Teleostei: Cyprinidae, Balitoridae, Bagridae, Syngnathidae, Chaudhuriidae and Tetraodontidae). J. South Asian Nat. Hist. 2000, 5, 37–82. [Google Scholar]
  23. Campbell, I.C. The Mekong: Biophysical Environment of an International River Basin; Elsevier Publishers: Amsterdam, The Netherlands, 2009. [Google Scholar]
  24. Herder, J.E.; Valentini, A.; Bellemain, E.; Dejean, T.; van Delft, J.J.C.W.; Thomsen, P.F.; Taberlet, P. Environmental DNA—A Review of the Possible Applications for the Detection of (Invasive) Species; Stichting RAVON: Nijmegen, The Netherlands, 2014. [Google Scholar]
  25. Gillet, B.; Cottet, M.; Destanque, T.; Kue, K.; Descloux, S.; Chanudet, V.; Hughes, S. Direct fishing and eDNA metabarcoding for biomonitoring during a 3-year survey significantly improves number of fish detected around a South East Asian reservoir. PLoS ONE 2018, 13, e0208592. [Google Scholar] [CrossRef]
  26. Bellemain, E.; Patricio, H.; Gray, T.; Guegan, F.; Valentini, A.; Miaud, C.; Dejean, T. Trails of river monsters: Detecting critically endangered Mekong giant catfish Pangasianodon gigas using environmental DNA. Glob. Ecol. Conserv. 2016, 7, 148–156. [Google Scholar] [CrossRef]
  27. Osathanunkul, M.; Minamoto, T. A molecular survey based on eDNA to assess the presence of a clown featherback (Chitala ornata) in a confined environment. PeerJ 2020, 8, e10338. [Google Scholar] [CrossRef]
  28. Jerde, C.L.; Mahon, A.R.; Campbell, T.; McElroy, M.E.; Pin, K.; Childress, J.N.; Armstrong, M.N.; Zehnpfennig, J.R.; Kelson, S.J.; Koning, A.A.; et al. Are genetic reference libraries sufficient for environmental DNA metabarcoding of Mekong River basin fish? Water 2021, 13, 1767. [Google Scholar] [CrossRef]
  29. Marques, V.; Milhau, T.; Albouy, C.; Dejean, T.; Manel, S.; Mouillot, D.; Juhel, J.-B. GAPeDNA: Assessing and mapping global species gaps in genetic databases for eDNA metabarcoding. Divers. Distrib. 2021, 27, 1880–1892. [Google Scholar] [CrossRef]
  30. Miya, M.; Sato, Y.; Fukunaga, T.; Sado, T.; Poulsen, J.Y.; Sato, K.; Minamoto, T.; Yamamoto, S.; Yamanaka, H.; Araki, H.; et al. MiFish, a set of universal PCR primers for metabarcoding environmental DNA from fishes: Detection of more than 230 subtropical marine species. R. Soc. Open Sci. 2015, 2, 150088. [Google Scholar] [CrossRef] [PubMed]
  31. Riaz, T.; Shehzad, W.; Viari, A.; Pompanon, F.; Taberlet, P.; Coissac, E. ecoPrimers: Inference of new DNA barcode markers from whole genome sequence analysis. Nucleic Acids Res. 2011, 39, e145. [Google Scholar] [CrossRef] [PubMed]
  32. Froese, R.; Pauly, D. FishBase. World Wide Web Electronic Publication. 2022. Available online: www.fishbase.org (accessed on 15 February 2022).
  33. R Core Team. R: A Language and Environment for Statistical Computing; R Foundation for Statistical Computing: Vienna, Austria, 2021; Available online: https://www.r-project.org (accessed on 15 June 2022).
  34. Rourke, M.L.; Fowler, A.M.; Hughes, J.M.; Broadhurst, M.K.; DiBattista, J.D.; Fielder, S.; Wilkes Walburn, J.; Furlan, E.M. Environmental DNA (eDNA) as a tool for assessing fish biomass: A review of approaches and future considerations for resource surveys. Environ. DNA 2022, 4, 9–33. [Google Scholar] [CrossRef]
  35. Yates, M.C.; Fraser, D.J.; Derry, A.M. Meta-analysis supports further refinement of eDNA for monitoring aquatic species-specific abundance in nature. Environ. DNA 2019, 1, 5–13. [Google Scholar] [CrossRef]
  36. Murtagh, F.; Legendre, P. Ward’s hierarchical agglomerative clustering method: Which algorithms implement Ward’s criterion? J. Classif. 2014, 31, 274–295. [Google Scholar] [CrossRef]
  37. Thioulouse, J.; Dray, S.; Dufour, A.; Siberchicot, A.; Jombart, T.; Pavoine, S. Multivariate Analysis of Ecological Data with ade4; Springer: New York, NY, USA, 2018. [Google Scholar] [CrossRef]
  38. De Cáceres, M.; Legendre, P. Associations between species and groups of sites: Indices and statistical inference. Ecology 2009, 90, 3566–3574. [Google Scholar] [CrossRef]
  39. De Cáceres, M.; Legendre, P.; Moretti, M. Improving indicator species analysis by combining groups of sites. Oikos 2010, 119, 1674–1684. [Google Scholar] [CrossRef]
  40. Dufrêne, M.; Legendre, P. Species assemblages and indicator species: The need for a flexible asymmetrical approach. Ecol. Monogr. 1997, 67, 345–366. [Google Scholar] [CrossRef]
  41. Osathanunkul, M. An eDNA detection of captive-bred Mekong Giant Catfish in the Chao Phraya River basin for further environmental impacts assessment. Aquaculture 2022, 546, 737328. [Google Scholar] [CrossRef]
  42. Rainboth, W.J.; Vidthayanon, C.; Yen, M.D. Fishes of the Greater Mekong Ecosystem with Species List and Photographic Atlas; Museum of Zoology, University of Michigan: Ann Arbor, MI, USA, 2010. [Google Scholar]
  43. Boyd, D.A.; Nithirojpakdee, P.; Deein, G.; Vidthayanon, C.; Grudpan, C.; Tangjitjaroen, W.; Pfeiffer, J.M.; Randall, Z.S.; Srisombat, T.; Page, L.M. Revision of the horseface loaches (Cobitidae, Acantopsis), with descriptions of three new species from Southeast Asia. Zootaxa 2017, 4341, 151–192. [Google Scholar] [CrossRef] [PubMed]
  44. Kimura, S.; Katahira, K.; Kuriiwa, K. The red-fin Decapterus group (Perciformes: Carangidae) with the description of a new species, Decapterus smithvanizi. Ichthyol. Res. 2013, 60, 363–379. [Google Scholar] [CrossRef]
  45. Fricke, R.; Eschmeyer, W.N.; van der Laan, R. (Eds.) Eschmeyer’s Catalog of Fishes: Genera, Species, References. 2022. Available online: http://researcharchive.calacademy.org/research/ichthyology/catalog/fishcatmain.asp (accessed on 15 April 2022).
  46. Pham, M.H.; Hoang, D.H.; Panfili, J.; Ponton, D.; Durand, J.-D. Diversity of fishes collected with light traps in the oldest marine protected area in Vietnam revealed by DNA barcoding. Mar. Biodivers. 2022, 52, 30. [Google Scholar] [CrossRef]
  47. Ratnasingham, S.; Hebert, P.D.N. A DNA-based registry for all animal species: The barcode index number (BIN) system. PLoS ONE 2013, 8, e66213. [Google Scholar] [CrossRef]
  48. Durand, J.-D.; Borsa, P. Mitochondrial phylogeny of grey mullets (Acanthopterygii: Mugilidae) suggests high proportion of cryptic species. Comptes Rendus Biol. 2015, 338, 266–277. [Google Scholar] [CrossRef]
  49. Hubert, N.; Meyer, C.P.; Bruggemann, H.J.; Guérin, F.; Komeno, R.J.L.; Espiau, B.; Causse, R.; Williams, J.T.; Planes, S. Cryptic diversity in Indo-Pacific coral-reef fishes revealed by DNA-barcoding provides new support to the centre-of-overlap hypothesis. PLoS ONE 2012, 7, e28987. [Google Scholar] [CrossRef]
  50. Zemlak, T.S.; Ward, R.D.; Connell, A.D.; Holmes, B.H.; Hebert, P.D.N. DNA barcoding reveals overlooked marine fishes. Mol. Ecol. Resour. 2009, 9, 237–242. [Google Scholar] [CrossRef]
  51. Whitfield, A.K. Why are there so few freshwater fish species in most estuaries? J. Fish Biol. 2015, 86, 1227–1250. [Google Scholar] [CrossRef]
  52. Nukazawa, K.; Hamasuna, Y.; Suzuki, Y. Simulating the advection and degradation of the environmental DNA of common carp along a river. Environ. Sci. Technol. 2018, 52, 10562–10570. [Google Scholar] [CrossRef]
  53. Barnes, M.A.; Turner, C.R.; Jerde, C.L.; Renshaw, M.A.; Chadderton, W.L.; Lodge, D.M. Environmental conditions influence eDNA persistence in aquatic systems. Environ. Sci. Technol. 2014, 48, 1819–1827. [Google Scholar] [CrossRef] [PubMed]
  54. Jo, T.; Murakami, H.; Yamamoto, S.; Masuda, R.; Minamoto, T. Effect of water temperature and fish biomass on environmental DNA shedding, degradation, and size distribution. Ecol. Evol. 2019, 9, 1135–1146. [Google Scholar] [CrossRef] [PubMed]
  55. Lance, R.F.; Klymus, K.E.; Richter, C.A.; Guan, X.; Farrington, H.L.; Carr, M.R.; Thompson, N.; Chapman, D.C.; Baerwaldt, K.L. Experimental observations on the decay of environmental DNA from bighead and silver carps. Manag. Biol. Invasions 2017, 8, 343. [Google Scholar] [CrossRef]
  56. Stoeckle, B.C.; Beggel, S.; Cerwenka, A.F.; Motivans, E.; Kuehn, R.; Geist, J. A systematic approach to evaluate the influence of environmental conditions on eDNA detection success in aquatic ecosystems. PLoS ONE 2017, 12, e0189119. [Google Scholar] [CrossRef]
  57. Strickler, K.M.; Fremier, A.K.; Goldberg, C.S. Quantifying effects of UV-B, temperature, and pH on eDNA degradation in aquatic microcosms. Biol. Conserv. 2015, 183, 85–92. [Google Scholar] [CrossRef]
  58. Jo, T.; Minamoto, T. Complex interactions between environmental DNA (eDNA) state and water chemistries on eDNA persistence suggested by meta-analyses. Mol. Ecol. Resour. 2021, 21, 1490–1503. [Google Scholar] [CrossRef]
  59. Abell, R.; Thie0me, M.L.; Revenga, C.; Bryer, M.; Kottelat, M.; Bogutskaya, N.; Coad, B.; Mandrak, N.; Balderas, S.C.; Bussing, W.; et al. Freshwater ecoregions of the world: A new map of biogeographic units for freshwater biodiversity conservation. BioScience 2008, 58, 403–414. [Google Scholar] [CrossRef]
  60. Grill, G.; Ouellet Dallaire, C.; Fluet Chouinard, E.; Sindorf, N.; Lehner, B. Development of new indicators to evaluate river fragmentation and flow regulation at large scales: A case study for the Mekong River Basin. Ecol. Indic. 2014, 45, 148–159. [Google Scholar] [CrossRef]
  61. Sokheng, C.; Chhea, C.K.; Viravong, S.; Bouakhamvongsa, K.; Suntornratana, U.; Yoorong, N.; Tung, N.T.; Bao, T.Q.; Poulsen, A.F.; Jorgensen, J.V. Fish migrations and spawning habits in the Mekong mainstream: A survey using local knowledge (basin-wide). In Assessment of Mekong Fisheries: Fish Migrations and Spawning and the Impact of Water Management Project (AMFC); AMFP Report, 2, 99; Mekong River Commission: Vientiane, Laos, 1999. [Google Scholar]
  62. Tran, N.T.; Labonne, M.; Chung, M.-T.; Wang, C.-W.; Huang, K.-F.; Durand, J.-D.; Chaiwut, G.; Chan, B.; Hoang, H.D.; Panfili, J. Natal origin and migration pathways of Mekong catfish (Pangasius krempfi) using strontium isotops and trace element concentrations in environmental water and otoliths. PLoS ONE 2021, 16, e0252769. [Google Scholar] [CrossRef]
  63. Poulsen, A.F.; Poeu, O.; Viravong, S.; Suntornratana, U.; Nguyen, T.T. Fish Migrations of the Lower Mekong River Basin: Implications for Development, Planning and Environmental Management; MRC Technical Paper No. 8; Mekong River Commission: Phnom Penh, Cambodia, 2002. [Google Scholar]
  64. Nuon, V.; Lek, S.; Ngor, P.B.; So, N.; Grenouillet, G. Fish community responses to human-induced stresses in the Lower Mekong Basin. Water 2020, 12, 3522. [Google Scholar] [CrossRef]
Figure 1. Sampling sites along the Mekong River; (bottom right) detailed map in the Mekong Delta.
Diversity 14 00634 g001
Figure 2. Abundance (A) and fish diversity indices: species richness (B); Shannon diversity (C); and Pielou’s evenness (D) indices at each site along the Mekong River and Delta.
Diversity 14 00634 g002
Figure 3. Proportion (% of abundances) of biological characteristics of fish species recorded with eDNA at each site along the Mekong River and Delta including three main categories: (A). environment; (B). life zone in the water column; and (C). type of migration.
Diversity 14 00634 g003
Figure 4. Centered principal component analysis (PCA) of the species-site abundance table: (A). species with relative contribution of more than 50% to axes 1 and 2, and groups of species identified by clustering. Environmental variables (salinity and distance to the sea) are projected as supplementary variables; (B). Sites and groups of sites identified by clustering. Additional species from group 1 are: Amblyrhynchichthys micracatus; Bangana sp.; Barbonymus sp1; Barbonymus sp2; Chitala ornate; Clupeichthys aesarnensis; Cyprinidae sp5; Cyprinidae sp12; Cyprinidae sp13; Cyprinidae sp16; Cyprinidae sp17; Hemibagrus sp2; Mastacembelus sp.; Mystus bocourti; Pangasius sp2; Paralaubuca sp2; Paralaubuca sp3; Parambassis sp.; Rasbora dusonensis; Probarbus jullieni; Sikukia gudgeri. C; Siluriformes sp1; Syncrossus helodes.
Diversity 14 00634 g004
Figure 5. Mean abundance percentages for the first 15 species of the groups highlighted by the PCA of the species.
Diversity 14 00634 g005
Figure 6. Species distribution range in the Mekong River and Delta (in blue) of some fishes inferred from records stored in the GBIF.org database (most recent consultation 20 June 2022) (black dots) and obtained from analyses of eDNA (red dots). (A): Ilisha melastoma; (B): Hilsa kelee; (C): Polynemus melanochir; (D): Johnius borneensis; (E): Labeo chrysophekadion; (F): Clupeoides borneensis; (G): Pangasius krempfi; (H): Puntioplites falcifer; (I): Barbonymus altus; (J): Hemibagrus spilopterus; (K): Xenentodon cancila; (L): Mystacoleucus marginatus; (M): Cosmochilus harmandi; (N): Hypsibarbus malcolmi; (O): Sikukia gudgeri.
Diversity 14 00634 g006
Table 1. Information on sampling sites along the Mekong River and Delta. Sites are classified based on their distance from the sea.
Site CodeLocationCoordinatesSampling DateSalinityDistance from the Sea (km)
LatitudeLongitude
M01Nong Khai, Thailand17°49.740′ N102°41.878′ ESept. 20190.01529
M02Nakhon Phanom, Thailand17°3.735′ N104°45.268′ ESept. 20190.01158
M03Ubon Ratchathani, Thailand15°23.823′ N105°32.737′ ESept. 20190.0903
M04Khone Falls, Stung Treng, Cambodia13°34.815′ N106°0.178′ EAug. 20190.0646
TSTonle Sap, Kampong Thom, Cambodia12°31.099′ N104°27.334′ EJune 20190.0443
M05Kampong Cham, Cambodia12°0.442′ N105°28.461′ EJune 20190.0417
M06Dong Thap, Vietnam10°24.514′ N105°36.764′ EMay 20190.0143
M07Tien Giang, Vietnam10°19.488′ N106°0.396′ EMay 20180.190
M08Chau Thanh, Ben Tre, Vietnam10°18.699′ N106°26.909′ EApr. 20181.039
M09Binh Dai, Ben Tre, Vietnam10°16.266′ N106°31.494′ EApr. 20185.929
M10Binh Dai, Ben Tre, Vietnam10°15.048′ N106°37.698′ EApr. 201810.718
M11Binh Dai, Ben Tre, Vietnam10°12.114′ N106°44.166′ EApr. 201816.65
M12Binh Dai, Ben Tre, Vietnam10°10.703′ N106°45.793′ EApr. 201821.32
M13Binh Dai, Ben Tre, Vietnam10°7.254′ N106°48.948′ EApr. 201826.70
M14Vung Tau, Vietnam10°19.188′ N107°1.494′ EApr. 201830.00
Table 2. Indicator species for each group of sites. *** p < 0.001, ** p < 0.01, * p < 0.05.
OrderGroupp
  Familly
  Species
Osteoglossiformes
 Notopteridae
   Chitala ornata10.0286 *
Clupeiformes
 Engraulidae
   Stolephorus chinensis30.0005 ***
   Stolephorus insularis B30.0012 **
   Coilia rebentischii30.0245 *
 Clupeidae
   Clupeichthys aesarnensis10.0308 *
   Clupeoides borneensis20.0108 *
   Hilsa kelee30.0045 **
Gonorynchiformes
 Chanidae
   Channa striata10.0170 *
Cypriniformes
 Botiidae
   Syncrossus helodes10.0304 *
 Cyprinidae
   Amblyrhynchichthys micracanthus10.0304 *
  Bangana sp.10.0041 **
   Barbonymus altus10.0006 ***
   Barbonymus gonionotus1 + 20.0005 ***
  Barbonymus sp110.0049 **
  Barbonymus sp210.0006 ***
   Cosmochilus harmandi10.0320 *
  Cosmochilus sp210.0320 *
  Cyprinidae sp1210.0308 *
  Cyprinidae sp1310.0308 *
  Cyprinidae sp1610.0055 **
  Cyprinidae sp2010.0294 *
  Cyprinidae sp91 + 20.0399 *
   Hypsibarbus malcolmi10. 0055 *
   Hypsibarbus wetmorei10. 0049 **
   Labeo chrysophekadion10.0163 *
   Mystacoleucus marginatus10.0311 *
  Paralaubuca sp210.0165 *
  Paralaubuca sp310.0311 *
   Probarbus jullieni10.0311 *
   Puntioplites falcifer10.0014 **
   Puntioplites proctozystron1 + 20.0088 **
  Puntioplites sp.20.0328 *
   Sikukia gudgeri C10. 0047 **
  Sikukia sp210.0294 *
Siluriformes
  Siluriformes sp110.0308 *
 Bagridae
   Hemibagrus spilopterus10.0048 **
   Mystus bocourti10.0308 *
 Pangasiidae
   Pangasius bocourti1 + 20.0005 ***
   Pangasius larnaudii1 + 20.0440 *
   Pangasius macronema1 + 20.0111 *
 Siluridae
Belodontichthys truncatus10.0304 *
Gobiiformes
 Gobiidae
  Gobiidae sp420.0077 **
Synbranchiformes
 Mastacembelidae
  Mastacembelus sp.10.0047 **
Cichliformes
 Cichlidae
   Oreochromis niloticus1 + 20.0408 *
Beloniformes
 Belonidae
   Xenentodon cancila10.0006 ***
Perciformes
 Polynemidae
   Polynemus melanochir20.0081 **
Acanthuriformes
 Sciaenidae
   Johnius carouna30.0042 **
   Johnius borneensis30.0246 *
Publisher’s Note: MDPI stays neutral with regard to jurisdictional claims in published maps and institutional affiliations.

