
Turnover of Plant Species on an Ecological Gradient in Karst Dolines Is Reflected in Plant Traits: Chorotypes, Life Forms, Plant Architecture and Strategies


Abstract
:1. Introduction
2. Materials and Methods
2.1. Study Area
2.2. Vegetation Sampling
2.3. Analyzing Plant Composition
3. Results
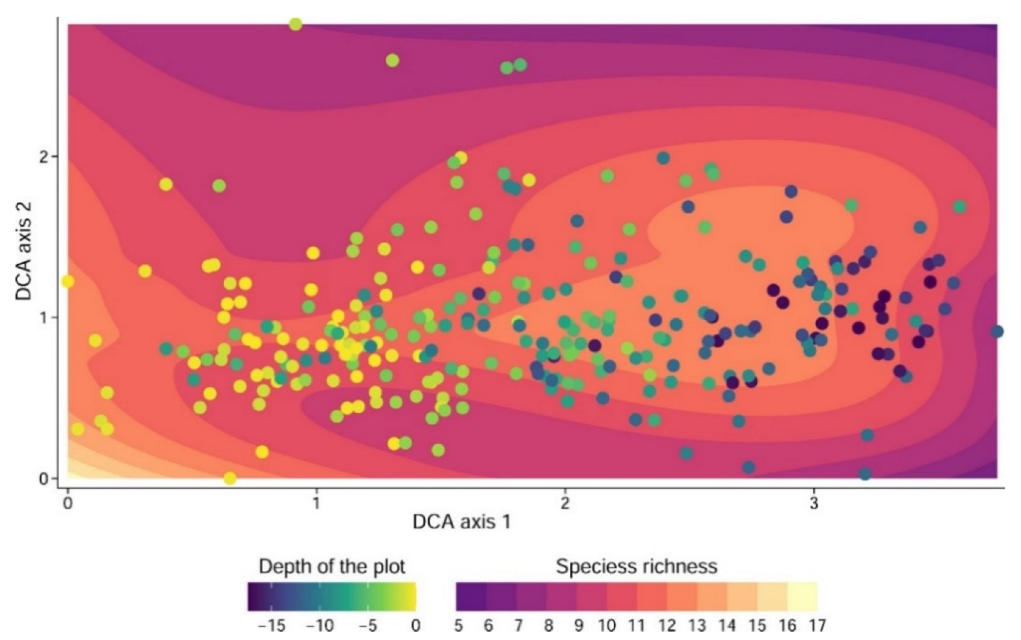
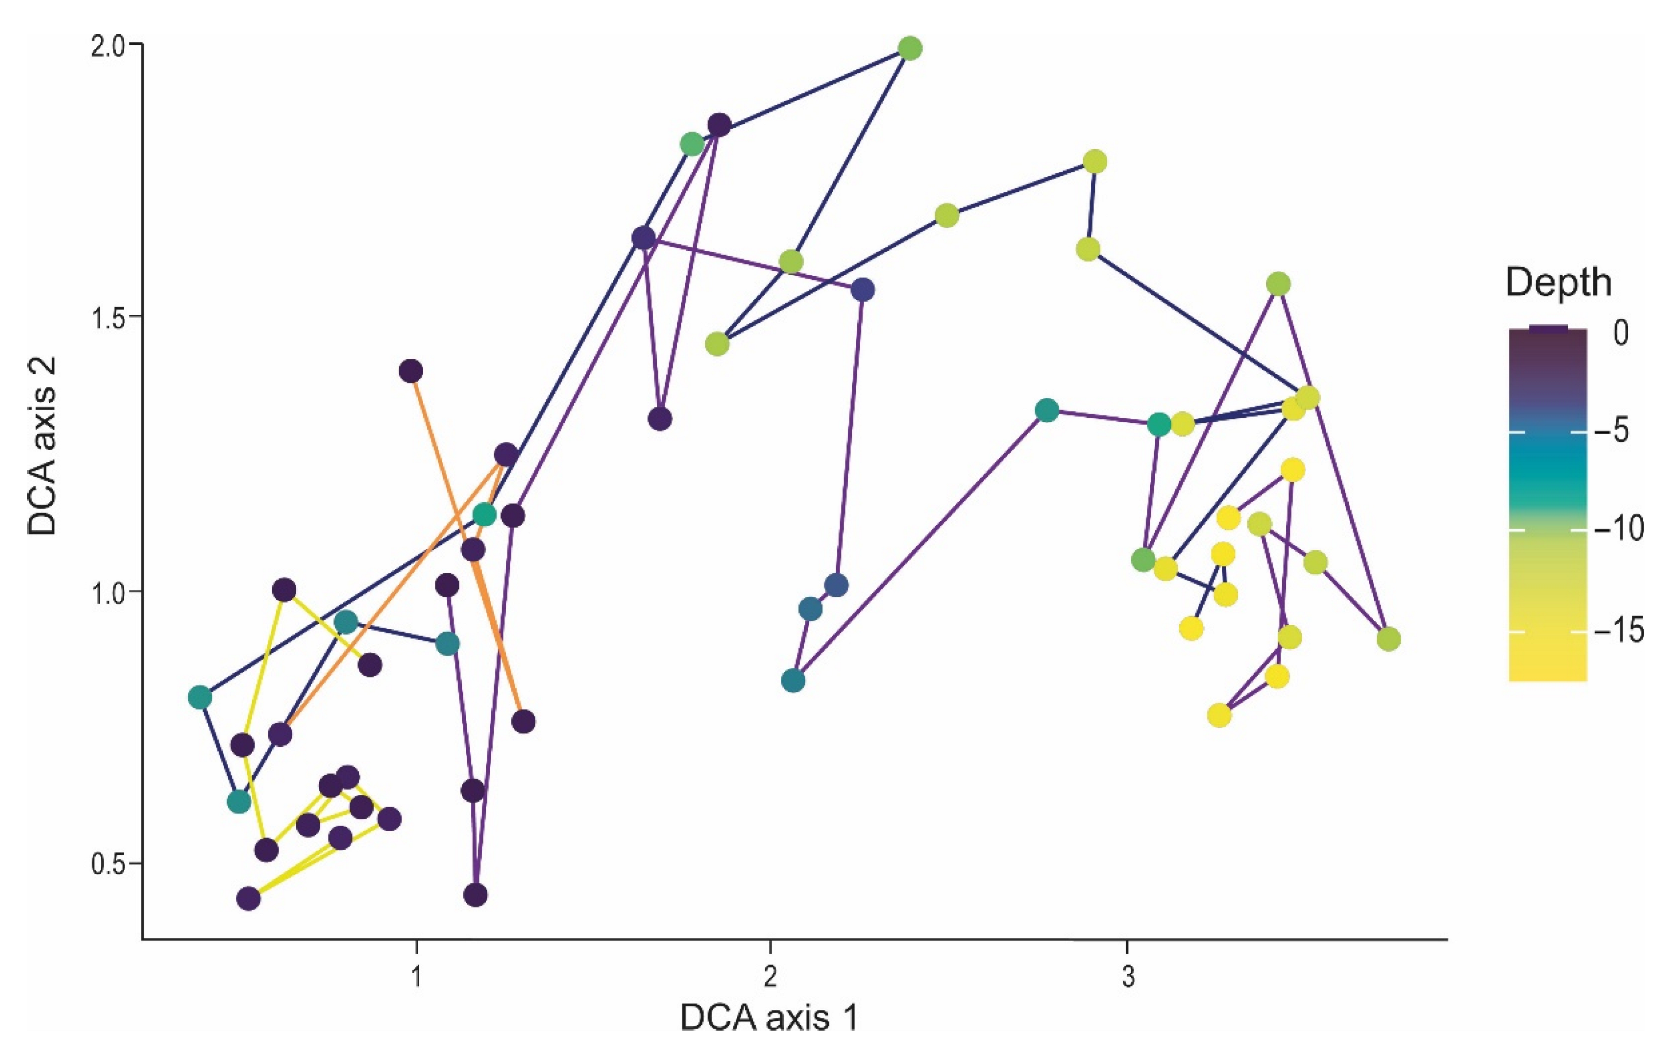
3.1. Ordination
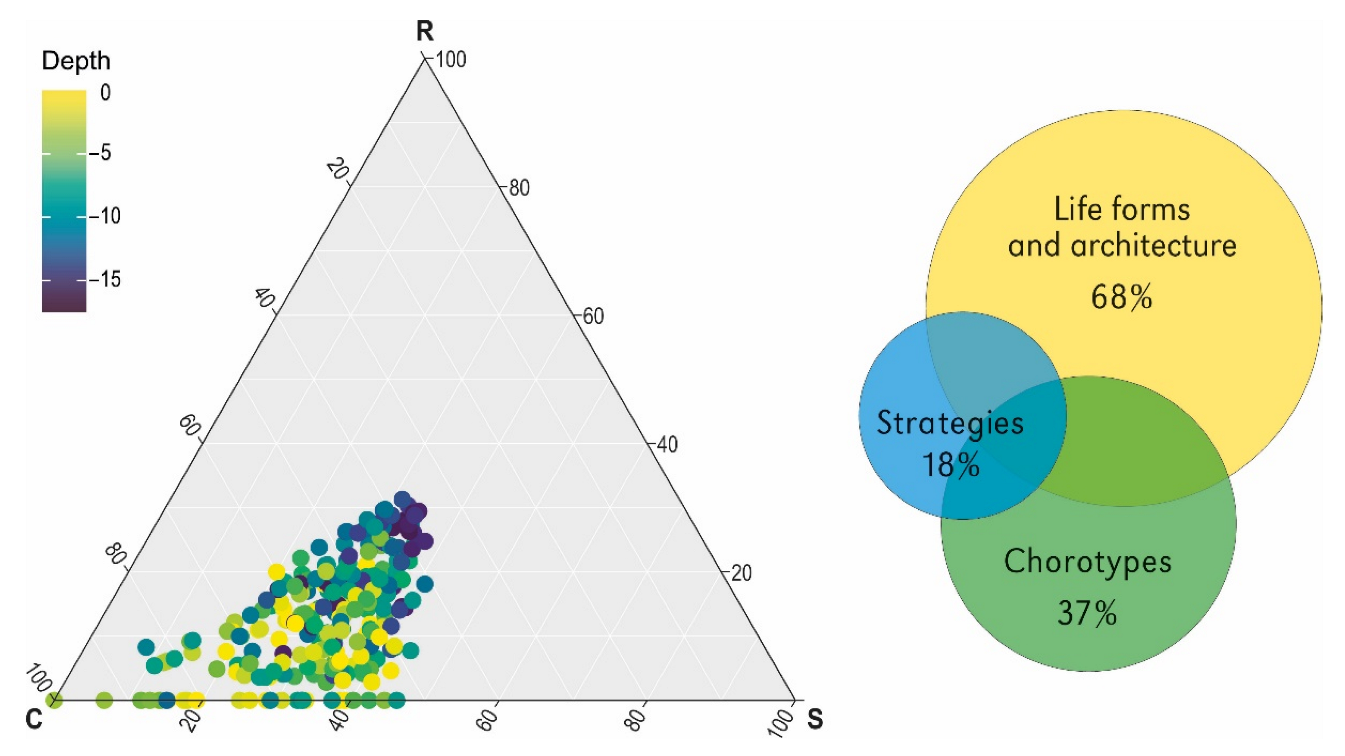
3.2. Explanatory Power of Chorotypes, Functional Traits and Strategies
4. Discussion
4.1. High Species Richness in Dolines
4.2. Plant Changes along the Ecological Gradient in Dolines
4.3. High Explanatory Power of Functional Traits (Life Forms, Plant Architecture) in Relation to Functional Strategies
5. Conclusions
Supplementary Materials
Author Contributions
Funding
Institutional Review Board Statement
Data Availability Statement
Acknowledgments
Conflicts of Interest
References
- Beck-Mannagetta, G. Die Vegetationsverhältnisse der Illyrischen Länder, Begreifend Südkroatien, die Quarnero-Inseln, Dalmatien, Bosnien und die Hercegovina, Montenegro, Nordalbanien, den Sandžak Novipazar und Serbien; Verlag von Wilhelm Engelmann: Leipzig, Germany, 1901. [Google Scholar]
- Horvat, I. Vegetacija ponikava. Geogr. Glas. 1953, 14, 1–15. [Google Scholar]
- Bátori, Z.; Erdős, L.; Morschhauser, T.; Török, P.; Körmöczi, L. Vegetation of the dolines in Mecsek mountains (South Hungary) in relation to the local plant communities. Acta Carsologica 2009, 38, 237–252. [Google Scholar] [CrossRef] [Green Version]
- Bátori, Z.; Gallé, R.; Erdos, L.; Körmöczi, L. Ecological conditions, flora and vegetation of a large doline in the Mecsek mountains (South Hungary). Acta Bot. Croat. 2011, 70, 147–155. [Google Scholar] [CrossRef]
- Bátori, Z.; Lengyel, A.; Maróti, M.; Körmöczi, L.; Tölgyesi, C.; Bíró, A.; Tóth, M.; Kincses, Z.; Cseh, V.; Erdős, L. Microclimate-vegetation relationships in natural habitat islands: Species preservation and conservation perspectives. Időjárás 2014, 118, 257–281. [Google Scholar]
- Bátori, Z.; Vojtkó, A.; Farkas, T.; Szabó, A.; Havadtői, K.; Vojtkó, A.E.; Tölgyesi, C.; Cseh, V.; Erdős, L.; Maák, I.E.; et al. Large- and small-scale environmental factors drive distributions of cool-adapted plants in karstic microrefugia. Ann. Bot. 2017, 119, 301–309. [Google Scholar] [CrossRef]
- Bátori, Z.; Vojtkó, A.; Maák, I.E.; Lőrinczi, G.; Farkas, T.; Kántor, N.; Tanács, E.; Kiss, P.J.; Juhász, O.; Módra, G.; et al. Karst dolines provide diverse microhabitats for different functional groups in multiple phyla. Sci. Rep. 2019, 9, 7176. [Google Scholar] [CrossRef]
- Bátori, Z.; Lőrinczi, G.; Tölgyesi, C.; Módra, G.; Juhász, O.; Aguilon, D.J.; Vojtkó, A.; Valkó, O.; Deák, B.; Erdős, L.; et al. Karstic microrefugia host functionally specific ant assemblages. Front. Ecol. Evol. 2020, 8, 613738. [Google Scholar] [CrossRef]
- Aguilon, D.J.; Vojtkó, A.; Tölgyesi, C.; Erdős, L.; Kiss, P.J.; Lőrinczi, G.; Juhász, O.; Frei, K.; Bátori, Z. Karst environments and disturbance: Evaluation of the effects of human activity on grassland and forest naturalness in dolines. Biologia 2020, 75, 1529–1535. [Google Scholar] [CrossRef]
- Kiss, P.J.; Tölgyesi, C.; Bóni, I.; Erdős, L.; Vojtkó, A.; Maák, I.E.; Bátori, Z. The effects on intensive logging on the capacity of karst dolines to provide potential microrefugia for cool-adapted plants. Acta Geogr. Slov. 2020, 60, 37–48. [Google Scholar] [CrossRef]
- Kermavnar, J.; Eler, K.; Marinšek, A.; Kutnar, L. Initial understory vegetation responses following different forest management intensities in Illyrian beech forests. Appl. Veg. Sci. 2019, 22, 48–60. [Google Scholar] [CrossRef] [Green Version]
- Kermavnar, J.; Marinšek, A.; Eler, K.; Kutnar, L. Evaluating short-term impacts of forest management and microsite conditions on understory vegetation in temperate fir-beech forests: Floristic, ecological, and trait-based perspective. Forests 2019, 10, 909. [Google Scholar] [CrossRef] [Green Version]
- Kermavnar, J.; Ferlan, M.; Marinšek, A.; Eler, K.; Kobler, A.; Kutnar, L. Effects of various cutting treatments and topographic factors on microclimatic conditions in Dinaric fir-beech forests. Agric. For. Meteorol. 2020, 295, 108186. [Google Scholar] [CrossRef]
- Kermavnar, J.; Eler, K.; Marinšek, A.; Kutnar, L. Post-harvest forest herb layer demography: General patterns are driven by pre-disturbance conditions. For. Ecol. Manag. 2021, 491, 119121. [Google Scholar] [CrossRef]
- Ford, D.C.; Williams, P. Karst Hydrogeology and Geomorphology; John Wiley & Sons: Chichester, UK, 2007. [Google Scholar]
- Kranjc, A. Classification of closed depressions in carbonate Karst. Treatise Geomorphol. 2013, 6, 104–114. [Google Scholar] [CrossRef]
- Cernatič Gregorič, A. Typical doline and surface landforms of Kras (Slovenia): Karst landscape features and possibilities for their conservation. Geoheritage 2021, 13, 26. [Google Scholar] [CrossRef]
- Vilović, T.; Buzjak, S.; Buzjak, N. Floristic and microclimatic features of the Sovljak doline (Mt. Velika Kapela, Croatia). Šumarski List 2019, 143, 35–43. [Google Scholar] [CrossRef]
- Roa García, C.; Brown, S.; Krzic, M.; Lavkulich, L.; Roa-García, M.C. Relationship of soil water retention characteristics and soil properties: A case study from the Colombian Andes. Can. J. Soil Sci. 2021, 101, 147–156. [Google Scholar] [CrossRef]
- Li, X.Y.; Contreras, S.; Solé-Benet, A. Unsaturated hydraulic conductivity in limestone dolines: Influence of vegetation and rock fragments. Geoderma 2008, 145, 288–294. [Google Scholar] [CrossRef]
- Dala-Corte, R.B.; Melo, A.S.; Siqueira, T.; Bini, L.M.; Martins, R.T.; Cunico, A.M.; Pes, A.M.; Magalhães, A.L.B.; Godoy, B.S.; Leal, C.G.; et al. Thresholds of freshwater biodiversity in response to riparian vegetation loss in the Neotropical region. J. Appl. Ecol. 2020, 57, 1391–1402. [Google Scholar] [CrossRef]
- Brunbjerg, A.K.; Bruun, H.H.; Dalby, L.; Fløjgaard, C.; Frøslev, T.G.; Høye, T.T.; Goldberg, I.; Læssøe, T.; Hansen, M.D.D.; Brøndum, L.; et al. Vascular plant species richness and bioindication predict multi-taxon species richness. Methods Ecol. Evol. 2018, 9, 2372–2382. [Google Scholar] [CrossRef]
- Breg Valjavec, M.; Zorn, M.; Čarni, A. Bioindication of human-induced soil degradation in enclosed karst depressions (dolines) using Ellenberg indicator values (Classical Karst, Slovenia). Sci. Total Environ. 2018, 640–641, 117–126. [Google Scholar] [CrossRef] [PubMed]
- Fattorini, S. On the concept of chorotype. J. Biogeogr. 2015, 42, 2246–2251. [Google Scholar] [CrossRef]
- Pignatti, S. Flora d’Italia; Edagricole: Bologna, Italy, 1982; Volume 1–3. [Google Scholar]
- Poldini, L. La Vegetazione del Carso Isontino e Triestino; Edizioni Lint: Trieste, Italy, 1989. [Google Scholar]
- Šercelj, A. Začetki in razvoj gozdov v Sloveniji; Slovenska akademija znanosti in umetnosti: Ljubljana, Slovenia, 1996; Volume 50. [Google Scholar]
- Herben, T.; Klimešová, J.; Chytrý, M. Effects of disturbance frequency and severity on plant traits: An assessment across a temperate flora. Funct. Ecol. 2018, 32, 799–808. [Google Scholar] [CrossRef]
- Stupar, V.; Čarni, A. Ecological, floristic and functional analysis of zonal forest vegetation in Bosnia and Herzegovina. Acta Bot. Croat. 2017, 76, 15–26. [Google Scholar] [CrossRef] [Green Version]
- Bruelheide, H.; Dengler, J.; Purschke, O.; Lenoir, J.; Jiménez-Alfaro, B.; Hennekens, S.M.; Botta-Dukát, Z.; Chytrý, M.; Field, R.; Jansen, F.; et al. Global trait–environment relationships of plant communities. Nat. Ecol. Evol. 2018, 2, 1906–1917. [Google Scholar] [CrossRef]
- Breg Valjavec, M.; Ribeiro, D.; Čarni, A. Vegetation as the bioindicator of human-induced degradation in karst landscape: Case study of waste-filled dolines. Acta Carsologica 2017, 46, 95–110. [Google Scholar] [CrossRef]
- Čarni, A.; Čonč, Š.; Breg Valjavec, M. Landform-vegetation units in karstic depressions (dolines) evaluated by indicator plant species and Ellenberg indicator values. Ecol. Indic. 2022, 135, 108572. [Google Scholar] [CrossRef]
- Raunkiaer, C. The Life Forms of Plants and Statistical Plant Geography, Being the Collected Papers of C. Raunkiaer; Oxford University Press: Oxford, UK, 1934. [Google Scholar]
- Paušič, A.; Čarni, A. Functional response traits and plant community strategy indicate the stage of secondary succession. Hacquetia 2012, 11, 209–225. [Google Scholar] [CrossRef] [Green Version]
- Grime, J.P. Plant Strategies, Vegetation Processes, and Ecosystem Properties, 2nd ed.; Wiley: New York, NY, USA, 2001. [Google Scholar]
- Pierce, S.; Negreiros, D.; Cerabolini, B.E.L.; Kattge, J.; Iaz, S.D.; Kleyer, M.; Shipley, B.; Wright, S.J.; Soudzilovskaia, N.A.; Onipchenko, V.G.; et al. A global method for calculating plant CSR ecological strategies applied across biomes world-wide. Funct. Ecol. 2017, 31, 444–457. [Google Scholar] [CrossRef]
- Ravnjak, B.; Bavcon, J.; Čarni, A. Plant species turnover on forest gaps after natural disturbances in the Dinaric fir beech forests. Diversity 2022, 14, 209. [Google Scholar] [CrossRef]
- Breg Valjavec, M.; Zorn, M.; Ribeiro, D. Mapping war geoheritage: Recognising geomorphological traces of war. Open Geosci. 2018, 10, 385–394. [Google Scholar] [CrossRef]
- Kaligarič, M.; Ivanjšič, D. Vanishing landscape of the “classic” Karst: Changed landscape identity and projections for the future. Landsc. Urban Plan. 2014, 132, 148–158. [Google Scholar] [CrossRef]
- Kaligarič, M.; Čuš, J.; Škornik, S.; Ivajnšič, D. The failure of agri-environment measures to promote and conserve grassland biodiversity in Slovenia. Land Use Policy 2019, 80, 127–134. [Google Scholar] [CrossRef]
- Mihevc, A.; Prelovšek, M.; Zupan Hajna, N. Introduction to the Dinaric Karst. J. Chem. Inf. Model. 2010, 53, 71. [Google Scholar]
- Ogrin, D. Podnebje Slovenske Istre (The Climate of Slovenian Istria); Zgodovinsko društvo za Južno Primorsko: Znanstveno-raziskovalno središče Republike Slovenije: Koper, Slovenia, 1995. [Google Scholar]
- Vrščaj, B.; Repe, B.; Simončič, P. The Soils of Slovenia; Springer Netherlands: Dordrecht, The Netherlands, 2017. [Google Scholar]
- Cervellini, M.; Zannini, P.; Di Musciano, M.; Fattorini, S.; Jiménez-Alfaro, B.; Rocchini, D.; Field, R.; Vetaas, O.R.; Irl, S.D.H.; Beierkuhnlein, C.; et al. A grid-based map for the biogeographical regions of Europe. Biodivers. Data J. 2020, 8, e53720. [Google Scholar] [CrossRef]
- Breg Valjavec, M.; Zorn, M.; Čarni, A. Human-induced land degradation and biodiversity of Classical Karst landscape: On the example of enclosed karst depressions (dolines). Land Degrad. Dev. 2018, 29, 3823–3835. [Google Scholar] [CrossRef] [Green Version]
- Dakskobler, I. Prispevek k poznavanju gozdne vegetacije Krasa (jugozahodne Slovenija). Ann.-Ser. Hist. Nat. 2006, 16, 57–76. [Google Scholar]
- Dakskobler, I.; Sadar, Z.; Čarni, A. Phytosociological analysis of Quercus cerris woods in the sub-mediterranen phytogeographical region of Slovenia. Folia Biol. Geol. 2017, 58, 5–34. [Google Scholar]
- Dakskobler, I.; Poldini, L. Phytosociological analysis of noble hardwood forests (Ostryo-Tilienion platyphylli) in the Karst and its neighbouring regions (SW Slovenia). Hacquetia 2021, 20, 327–372. [Google Scholar] [CrossRef]
- Bátori, Z.; Erdős, L.; Gajdács, M.; Barta, K.; Tobak, Z.; Frei, K.; Tölgyesi, C. Managing climate change microrefugia for vascular plants in forested karst landscapes. For. Ecol. Manag. 2021, 496, 119446. [Google Scholar] [CrossRef]
- Kermavnar, J.; Marinšek, A.; Kuntnar, L. Variation in floristic and trait composition along environmental gradients in the herb layer of temperate forests in the transition zone between Central and SE Europe. Plant Ecol. 2022, 223, 229–242. [Google Scholar] [CrossRef]
- Braun-Blanquet, J. Pflanzensoziologie, Grundzüge der Vegetationskunde, 3rd ed.; Springer: Wien, Austria, 1964. [Google Scholar]
- Hennekens, S.; Schaminée, J. TURBOVEG, a comprehensive data base management system for vegetation data. J. Veg. Sci. 2001, 12, 589–591. [Google Scholar] [CrossRef]
- Tichý, L. JUICE, software for vegetation classification. J. Veg. Sci. 2002, 13, 451–453. [Google Scholar] [CrossRef]
- Oksanen, J.; Blanchet, F.G.; Friendly, M.; Kindt, R.; Legendre, P.; McGlinn, D.; Minchin, P.R.; O’Hara, R.B.; Simpson, G.L.; Solymos, P.; et al. CRAN Vegan 2.5-5, community ecology package. Available online: http://packages.renjin.org/package/org.renjin.cran/vegan (accessed on 15 December 2021).
- Ellenberg, H.; Weber, H.E.; Düll, R.; Wirth, V.; Werner, W.; Paulißen, D. Zeigerwerte von Pflanzen in Mitteleuropa. Scr. Geobot. 1991, 18, 1–248. [Google Scholar]
- Tölgyesi, C.; Bátori, Z.; Erdos, L. Using statistical tests on relative ecological indicator values to compare vegetation units—Different approaches and weighting methods. Ecol. Indic. 2014, 36, 441–446. [Google Scholar] [CrossRef]
- Pignatti, S.; Menegoni, P.; Pietrosanti, S. Valori di bioindicazione delle piante vascolari della flora d’Italia. Braun-Blanquetia 2005, 39, 1–97. [Google Scholar]
- Hodgson, J.G.; Wilson, P.J.; Hunt, R.; Grime, J.P.; Thompson, K. Allocating C-S-R plant functional type: A soft approach to hard problem. Oikos 1999, 85, 282–294. [Google Scholar] [CrossRef]
- Hunt, R.; Hodgson, J.; Thompson, K.; Bungener, P.; Dunnett, N.; Askwe, A. A new practical tool for deriving a functional signature for herbaceous vegetation. Appl. Veg. Sci. 2004, 7, 163–170. [Google Scholar] [CrossRef]
- Klotz, S.; Kühn, I.; Durka, W. BIOLFLOR—Eine Datenbank zu Biologisch-Ökologischen Merkmalen der Gefäßpflanzen in Deutschland; Schriftenreihe für Vegetationskunde 38 Bundesamt für Naturschutz (BfN): Bonn, Germany, 2002. [Google Scholar]
- Ter Braak, C.J.F.; Šmilauer, P. CANOCO Reference Manual and User’s Guide: Software for Ordination (Version 5.0); Microcomputer Power: Ithaca, NY, USA, 2012. [Google Scholar]
- Šmilauer, P.; Lepš, J. Multivariate Analysis of Ecological Data Using CANOCO 5; Cambridge University Press: Cambridge, UK, 2014; ISBN 9781139627061. [Google Scholar]
- Čonč, Š.; Oliviera, T.; Portas, R.; Černe, R.; Breg Valjavec, M.; Krofel, M. Dolines and cats: Remote detection of karst depressions and their application to study wild felid ecology. Remote Sens. 2022, 14, 656. [Google Scholar] [CrossRef]
- Poldini, L. L’Asaro-Carpinetum betuli Lausi 64 del Carso nordadriatico. Stud. Geobot. 1985, 5, 31–38. [Google Scholar]
- Stajić, S.; Čokeša, V.; Miletić, Z.; Eremija, S.; Ćirković-Mitrović, T.; Marković, M.; Jovanović, F. Phytosociological characteristics of sessile oak and hornbeam forests (Querco petraeae-Carpinetum betuli Rudski 1949. s.l.) in the area of Kosmaj. Sustain. For. 2020, 81–82, 41–51. [Google Scholar]
- Koljanin, D.; Milanović, Đ.; Stupar, V. New data on the distribution and threat status of three rare spring geophytes from Bosnia and Herzegovina. Phytol. Balc. 2021, 27, 107–114. [Google Scholar]
- Lubbe, F.C.; Klimešová, J.; Henry, H.A. Winter belowground: Changing winters and the perennating organs of herbaceous plants. Funct. Ecol. 2021, 35, 1627–1639. [Google Scholar] [CrossRef]
- Mori, E.; Lazzeri, L. Does wild boar rooting affect spatial distribution of active burrows of meadow-dwelling voles? Biologia 2021, 76, 981–986. [Google Scholar] [CrossRef]
- Košir, P.; Čarni, A.; Di Pietro, R. Classification and phytogeographical differentiation of broad-leaved ravine forests in southeastern Europe. J. Veg. Sci. 2008, 19, 331–342. [Google Scholar] [CrossRef]
- Sekulić, D.; Karadžić, B.; Kuzmanović, N.; Jarić, S.; Mitrović, M.; Pavlović, P. Diversity of Ostrya carpinifolia forests in ravine habitats of Serbia (S-E Europe). Diversity 2021, 13, 59. [Google Scholar] [CrossRef]
- Kontopanou, A.; Panitsa, M. Habitat islands on the Aegean Islands (Greece): Elevational gradient of chasmophytic diversity, endemism, phytogeographical patterns and need for monitoring and conservation. Diversity 2020, 12, 33. [Google Scholar] [CrossRef] [Green Version]
- Panitsa, M.; Kokkoris, I.P.; Kougioumoutzis, K.; Kontopanou, A.; Bazos, I.; Strid, A.; Dimopoulos, P. Linking taxonomic, phylogenetic and functional plant diversity with ecosystem services of cliffs and screes in Greece. Plants 2021, 10, 992. [Google Scholar] [CrossRef]
- Stupar, V.; Brujić, J.; Škvorc, Ž.; Čarni, A. Vegetation types of thermophilous deciduous forests (Quercetea pubescentis) in the Western Balkans. Phytocoenologia 2016, 46, 49–68. [Google Scholar] [CrossRef]
- Trajkov, P.; Dubravac, T.; Tanovski, V.; Nestorovski, L.; Sotirovski, K.; Trajanov, Z. Coppice forest management planning and the regeneration potential of pure and mixed oak coppice forests in North Macedonia. South-East Eur. For. 2019, 10, 165–172. [Google Scholar] [CrossRef] [Green Version]
- Török, P.; Neuffer, B.; Heilmeier, H.; Bernhardt, K.G.; Wesche, K. Climate, landscape history and management drive Eurasian steppe biodiversity. Flora 2020, 271, 151685. [Google Scholar] [CrossRef]


| Doline | Depth (m) | Transect Length (m) North | Transect Length (m) South |
|---|---|---|---|
| A1 | 2.41 | 10 | 22 |
| A2 | 5.98 | 14 | 20 |
| A3 | 7.51 | 14 | 24 |
| A4 | 8.17 | 18 | 34 |
| A5 | 8.71 | 22 | 18 |
| A6 | 13.38 | 32 | 36 |
| A7 | 13.55 | 30 | 30 |
| A8 | 15.4 | 40 | 34 |
| A9 | 18.84 | 34 | 54 |
| A0 | 21.74 | 38 | 48 |
Publisher’s Note: MDPI stays neutral with regard to jurisdictional claims in published maps and institutional affiliations. |
© 2022 by the authors. Licensee MDPI, Basel, Switzerland. This article is an open access article distributed under the terms and conditions of the Creative Commons Attribution (CC BY) license (https://creativecommons.org/licenses/by/4.0/).
Share and Cite
Jakob, A.; Breg Valjavec, M.; Čarni, A. Turnover of Plant Species on an Ecological Gradient in Karst Dolines Is Reflected in Plant Traits: Chorotypes, Life Forms, Plant Architecture and Strategies. Diversity 2022, 14, 597. https://doi.org/10.3390/d14080597
Jakob A, Breg Valjavec M, Čarni A. Turnover of Plant Species on an Ecological Gradient in Karst Dolines Is Reflected in Plant Traits: Chorotypes, Life Forms, Plant Architecture and Strategies. Diversity. 2022; 14(8):597. https://doi.org/10.3390/d14080597
Chicago/Turabian StyleJakob, Aljaž, Mateja Breg Valjavec, and Andraž Čarni. 2022. "Turnover of Plant Species on an Ecological Gradient in Karst Dolines Is Reflected in Plant Traits: Chorotypes, Life Forms, Plant Architecture and Strategies" Diversity 14, no. 8: 597. https://doi.org/10.3390/d14080597