Article

Microcrustacean (Cladocera and Copepoda) Assemblages of a Tropical Karst Lake District

Grupo de Investigación en Limnología Tropical, Facultad de Estudios Superiores Iztacala, Universidad Nacional Autónoma de México, Av. de los Barrios No.1, Los Reyes Iztacala, Tlalnepantla de Baz 54090, Mexico
*
Author to whom correspondence should be addressed.
Diversity 2022, 14(7), 564; https://doi.org/10.3390/d14070564
Submission received: 10 May 2022 / Revised: 10 July 2022 / Accepted: 12 July 2022 / Published: 14 July 2022
(This article belongs to the Special Issue Biodiversity in Karst Landscapes)

Abstract

:
The taxonomic richness, composition, abundance, and biomass of pelagic microcrustaceans (Cladocera and Copepoda) were determined in 17 lakes of the “Lagunas de Montebello” National Park, a karst lake district in Chiapas State, southeast Mexico. The selected aquatic bodies exemplify the lake diversity in the area, which displays an anthropic impact gradient from impacted/eutrophic lakes on the NW to non-impacted/oligotrophic lakes on the SE. Sampling was conducted in two contrasting climatic periods: warm-rainy and cold-dry seasons. There were 32 taxa, five calanoid copepods, 16 cyclopoid copepods, and 11 cladocerans. The highest taxonomic richness, abundance, and biomass were found in the impacted/eutrophic lakes and the lowest in the non-impacted/oligotrophic lakes. Nauplii and copepods were the most abundant, while the copepods provided the largest biomass. Small-sized individuals composed the most significant abundance and biomass in impacted/eutrophic lakes, while large-sized individuals in the non-impacted/oligotrophic lakes. Even though the studied lakes belong to the same lake district, they showed low taxonomic similarity. Not a single taxon was found in all lakes; the most distributed taxa (13–14 lakes) were Mastigodiaptomus nesus and Leptodiaptomus cuauhtemoci, while 15 taxa (47%) were found in only 1–3 lakes. This karst lake district showed a great regional microcrustacean taxonomic richness but a great singularity level in each lake.

1. Introduction

Mexico is considered a “megadiverse” country since it is part of the select group of nations that together possesses the greatest diversity of animals and plants, almost 70% of the world’s diversity of species (considering the best-known groups: amphibians, reptiles, birds and mammals and vascular plants). Within this group of 17 “megadiverse countries,” Mexico is ranked number 5, after Brazil, Colombia, China, and Indonesia. According to estimates, these countries cover 10% of the earth’s surface and are home to 70% of the planet’s biodiversity, of which our country is home to around 12% [1].
However, the megadiversity has yet to be confirmed for the aquatic biota of Mexican epicontinental waters. Among the better-known biological groups of fauna, freshwater fishes reach 536 species [2], while freshwater decapods comprise 172 species [3]; both groups with a large percentage of endemism. Unfortunately, the lack of information prevents counting from an actual picture of most biological groups inhabiting epicontinental waters, particularly those of small size.
Various attempts have been made to summarize the aquatic biological diversity (e.g., [4,5,6]). These exercises resulted in the designation of 110 Priority Hydrological Regions based on their biodiversity [7]. Finally, there was an analysis of gaps and omissions in Mexico’s conservation of epicontinental aquatic biodiversity [8].
Chiapas State, southern Mexico, has a karst lake district surrounded by tropical rainforests, the “Lagunas de Montebello” National Park (LMNP), and the Priority Hydrological Region number 88. A priority assessment of freshwater ecosystems in Mexico [9] revealed that the LMNP situates in a Mexican region with the most significant number of irreplaceable aquatic sites. This unicity justifies its designation as a natural protected area by presidential decree in 1959, RAMSAR Site in 2003, and Biosphere Reserve MAB-UNESCO in 2009. Previous studies [10,11] suggested a great regional (i.e., the whole lake district) aquatic biodiversity but a large individual singularity (i.e., very few taxa present in more than a lake), stressing the fragility of these aquatic ecosystems [12]. Belonging to the same lake district and located close to each other, sharing the same climate, and with similar physical and chemical characteristics, it is unusual that these lakes share a small number of common species of the few biological communities investigated so far (rotifers, benthic macroinvertebrates). The question remains whether this unicity or rarity is a common pattern shown by all biological communities or just a few of them.
The assemblage of planktonic microcrustaceans, similar to any other assemblage, is the result of the interaction of different biotic and abiotic factors [13,14], for example, seasonality) [15,16], the size of the water body [17,18], the presence of influent lotic ecosystems [19], primary productivity [20,21,22], vertical environmental gradients (light, temperature, oxygen, food, and predation) [13], and water transparency [23] among others that interact to different degrees modifying the distribution and abundance of organisms.
Since 2003, this originally pristine lake district has displayed signs of eutrophication on some lakes of the NW (e.g., Laguna Vuelta de Agua), changing from crystal clear blue to turbid green waters, with the occurrence of a yellowish-green supernatant, fetid odors, and fish mortality [24]. Moreover, [25] revealed paleolimnological evidence of deforestation and wastewater input from the Río Grande de Comitán since the 1950s, with particular intense anthropic disturbance from the 1980s until the 2000s. As a result of anthropic activities, lakes on the NW plateau are eutrophic, while the SE mountain lakes remain oligotrophic. This impact/trophic gradient provides a unique natural experimental site for seeking the effects of anthropic activities on the planktonic microcrustacean assemblages.
The microcrustacean assemblage has been used to define and monitor the aquatic body trophic state [26] through, for example, the cyclopoids:calanoids biomass ratio [14], the increase in the abundance and biomass of cyclopoids [19], or the species distribution that may be restricted to a specific trophic status of the water body [27] or wide distribution in lake districts [28].
To extend the knowledge of the aquatic biodiversity of this karst lake district, this study aimed to describe the pelagic microcrustacean assemblages (Cladocera and Copepoda) in a set of 17 lakes and their structure (abundance, biomass) and to identify the changes imposed on these microcrustacean assemblages by the local anthropic activities, including impacted/eutrophic and non-impacted/oligotrophic lakes of the same lake district. Previous studies on the biological communities in these lakes (e.g., [10,11]) allowed us to hypothesize a large regional —lake district —but low individual —per lake— biodiversity while displaying high unicity of microcrustacean assemblage composition. Furthermore, lower microcrustacean biodiversity but higher abundance and biomass in the impacted/eutrophic compared to the non-impacted/oligotrophic lakes.

2. Study Site

The “Lagunas de Montebello” National Park (Figure 1) is on a Lower Cretaceous limestone basement in the SE Chiapas State, Mexico (16°04′ to 16°10′ N, 91°37′ to 91°47′ W, at 1500 m a.s.l.). Hydrologically the LMNP belongs to the endorheic sub-basin of the Río Grande de Comitán-Lagos de Montebello. Climate is temperate and rainy, with mean annual temperature, precipitation, and evaporation of 17.3 °C, 2279 mm, and 948 mm, respectively (Comisión Nacional de Áreas Naturales Protegidas -CONANP- Automatic Meteorological Weather Station No. N15DA7496).
One hundred and thirty-nine solution water bodies (dolines, uvalas, poljes) comprise this karst lake district (Dr. Roberto Bonifaz 2022, com. pers.), displaying diverse morphometries [29]. The lakes are distributed along a regional fault and fracture system NW-SE oriented. The region’s topography changes from a vast plateau in the NW to a mountainous in the SE. The plateau area is highly transformed into agriculture and urban development, while the mountains display well-preserved rainforests. The plateau lakes are superficially fed by the Río Grande de Comitán and are groundwater-fed and interconnected through artificial channels. Mountain lakes are groundwater-fed and surface isolated [30]. Consequently, there is an impact and trophic gradient, ranging from impacted and eutrophic lakes on the NW plateau to non-impacted and oligotrophic lakes on the SE mountains [24].
Seventeen lakes were selected (Figure 1) to represent better the impact/trophic gradient and the morphometric heterogeneity (large, small, deep, and shallow). The lakes were, from NW to SE: (a) the impacted/eutrophic Balantetic, Chajchaj, San Lorenzo, Bosque Azul and La Encantada, and (b) the non-impacted/oligotrophic San José, Esmeralda, Ensueño, Agua Tinta, Montebello, Cinco Lagos, Pojoj, Kichail, Tziscao, Patianú, Yalalush, and Dos Lagos (Table 1).

3. Methods

We conducted two sampling campaigns according to tropical seasonality: February 2015, characterizing the cold/dry period, and October 2015, the warm/rainy period. Tropical seasonality expresses in the thermal mixing regime of the lakes. The deep lakes are warm monomictic, while the shallow lakes are warm polymictic. The water column mixing occurs during the cold/dry season, while the water column thermal stratification in the warm/rainy season. In tropical lakes [31,32], the expected trade-offs between seasons were low light, high nutrients, and high phytoplankton biomass during the dry season, and high light, nutrient limitation, and low phytoplankton biomass in the rainy season.
At the central and deepest zone of each lake, vertical profiles of temperature (T), dissolved oxygen concentration (DO), the potential of hydrogen (pH), and electrical conductivity (K25) were recorded (1 m vertical resolution) with a Hydrolab DS5 (OTT Hydromet, Loveland, CO, USA) multiparameter water quality sonde. The euphotic zone (ZEU) was calculated as 0.1% of the photosynthetically active radiation (PAR) at the surface (SPAR) measured with a Biospherical PNF-300 (San Diego, CA, USA) profiling natural fluorometer. To measure chlorophyll-a (Chl-a) concentration, 5-L water samples were obtained from between 1 and 5 water depths according to the maximum depth of the lakes with an Uwitec GmbH (Mondsee, Austria) water-sampling bottle. Chl-a concentrations were analyzed in a Turner Designs 10-AU (San Jose, CA, USA) fluorometer following the EPA method 445.0 [33].
A 30-L water-column integrated sample was taken from each lake. The water samples were acquired with a 5-L Uwitec GmbH (Mondsee, Austria) water-sampling bottle in the pelagic zone at the central and deepest zone of the lakes. The 30-L water sample was filtered in situ through a 54 µm mesh size net, and the retained organisms were concentrated in 50 mL vials and fixed with 4% formaldehyde. We analyzed (identified and counted) the whole individual concentrated in the 50-mL vials of each of the 17 lakes with a total of 34 samples (17 from the cold and dry season and 17 from the warm and rainy season). We counted the entire 50 mL samples; no sub-sampling (i.e., aliquot) method was used.
We first quantified the total microcrustaceans abundance using a Sedgwick Rafter chamber under an optical microscope. We used specialized taxonomic keys to identify cladocerans and copepods [34,35,36,37,38,39]. The microcrustacean biomass was evaluated according to [40] and expressed as dry weight (DW). The biomass of cyclopoid copepods was calculated by size range (L: 1000–1400 µm, M: 750–950 µm, S: 400–740 µm) and not per species. In the case of Daphnia spp., the biomass of juveniles and adults with and without eggs was averaged. The number of taxa or taxonomic richness (S) was expressed for the total microcrustacean assemblage (SMC), the calanoid copepods (SCAL), the cyclopoid copepods (SCYC), and the cladocerans (CCLAD).
A discriminant function analysis (LDA) was performed to explore the formation of groups according to environmental variables. The classification of lakes was tested by trophic state and season.
We applied the singularity index [41], including the complete dataset as S = (e/E) − 100, where S is the index of singularity for one lake, e is the number of species found in one lake and not found in other, and E is the total number of species found in the lake district. Finally, SIMPER tests in PAST were applied to assess the individual (per taxon) contribution to dissimilarity in each season (cold/dry, warm/rainy).
Two Heatmaps (HMA) were made to classify the lakes of the Lagunas de Montebello” National Park according to the abundance and biomass values of all microcrustaceans taxa. HMAs were performed using the Ward method with Hellinger distances [42]. A similarity percentage analysis (SIMPER) was performed with microcrustaceans’ abundance and biomass data to identify the species responsible for forming lake groups. Taxa were listed in decreasing order by their average contribution to the total average dissimilarity [43].
Canonical correspondence analyses (CCA) were carried out to explore which physicochemical variables best explain the distribution of microcrustaceans in the lakes. The microcrustaceans species abundance or biomass were used as the dependent variables. Abundance and biomass were ln-transformed to reduce skew distributions before multivariate analyses. The analysis considered T, DO, pH, K25, and Chl-a concentration as independent variables. To determine if there was autocorrelation among the environmental variables, their variance inflation factors (VIF) were calculated, eliminating those variables with values greater than 10 [44]. Abundance and biomass were ln-transformed to reduce skew distributions before multivariate analyses. The physicochemical variables were Z-transformed to avoid high values that would bias the results and maintain the values within an acceptable scale for comparison. Statistical analyses were performed using the R Core Team [45], LDA (package ‘MASS’ version 7.3-54), HMA (package ‘pheatmap’ version 1.0.12), SIMPER, and CCA (package ‘vegan’ version 2.6-2).

4. Results

The LDA, based on the environmental variables, separated the lakes into eutrophic and oligotrophic, but not seasonally. The physicochemical variables (Table 2) showed similarities between impacted/eutrophic and non-impacted/oligotrophic lakes in T, DO, and pH. Contrarily, both types differed in ZEU, higher in non-impacted/oligotrophic lakes, and K25 and Chl-a, higher in the impacted/eutrophic lakes. In the stratification season, all lakes displayed higher T and lower DO and pH. ZEU was similar in both seasons in the impacted/eutrophic, while there was an increase in stratification in the non-impacted/oligotrophic lakes. K25 was similar in both seasons in the non-impacted/oligotrophic lakes while decreased in stratification in the impacted/eutrophic lakes. Finally, Chl-a remained similar in both seasons in the non-impacted/oligotrophic lakes while decreasing in stratification in the impacted/eutrophic lakes.

4.1. Composition and Taxonomic Richness

We identified 32 taxa, 29 to the species, and three to the genus level (Table 3). There were five calanoid copepods (15.6%), all from the Diaptomidae family, 16 cyclopoid copepods (50%) from the Cyclopidae family, and 11 cladocerans (34.4%) belonging to four families Sididae, Daphniidae, Moinidae, and Bosminidae.
Of the 32 taxa, seven (21.9%) taxa (one calanoid copepod, five cyclopoid copepods, and one cladoceran) were restricted to a single lake, and 10 (31.6%) taxa (one calanoid copepod, five cyclopoid copepods, and four cladocerans) were limited to two-three lakes. On the other side, the widely distributed microcrustaceans were the calanoid copepods Mastigodiaptomus nesus, Leptodiaptomus cuauhtemoci, and Mastigodiaptomus maya; they were found in 14 (82.4%), 13 (76.5%), and 10 (58.8%) lakes, respectively, while the cyclopoid copepods Thermocyclops inversus Mesocyclops edax, and Microcyclops ceibaencis were found in 10 (58.8%), eight (47.1%), and eight (47.1%) lakes, correspondingly. Finally, the cladocerans Eubosmina tubicen, Ceriodaphnia dubia, and Diaphanosoma sp. were found in 12 (70.6%), 11 (64.7%), and 11 (64.7%) lakes, respectively.
The microcrustacean taxonomic richness (SMC) ranged from six to thirteen taxa with an average ± standard deviation of 9.4 ± 2.0 taxa per lake. The lake with the highest taxonomic richness was Bosque Azul (13 taxa, 40.6%) and Esmeralda and Yalalush had the lowest richness (six taxa, 18.8%). The impact/eutrophic lakes hold slightly higher SMC with 12.8 ± 3.3 taxa while 11.3 ± 2.3 taxa in the non-impacted/oligotrophic lakes.
The calanoid copepods’ taxonomic richness (SCAL) ranged from one to four taxa with an average of 2.4 ± 1.0 taxa per lake. The lake with the highest taxonomic richness was La Encantada (four taxa), and the lakes with the lowest richness (only one taxon) were Chajchaj and Esmeralda. The impact/eutrophic lakes hold similar SCAL with 2.4 ± 1.1 taxa than the non-impacted/oligotrophic lakes with 2.4 ± 0.7 taxa.
The cyclopoid copepods taxonomic richness varied from two to seven taxa (SCYC), with an average of 3.3 ± 1.3 taxa per lake. The lake with the highest cyclopoid copepods taxonomic richness was Bosque Azul (seven taxa), and the lowest richness (two taxa) was found in lakes Balantetic, Esmeralda, Pojoj, and Yalalush. The impact/eutrophic lakes hold higher SCYC with 4.4 ± 1.8 taxa while 2.8 ± 0.6 taxa in the non-impacted/oligotrophic lakes. The cladoceran taxonomic richness (SCLAD) ranged from one to six taxa per lake with an average of 3.6 ± 1.2 taxa per lake. The lake with the highest taxonomic richness of cladoceran was San José (six taxa), and Chajchaj had the lowest richness (one taxon). The impact/eutrophic lakes hold similar SCLAD with 3.6 ± 1.5 taxa than the non-impacted/oligotrophic lakes with 3.7 ± 1.2 taxa. The SCAL:SCYC:SCLAD ratio was 2:3:4 for oligotrophic lakes, 2:4:4 for eutrophic lakes, 3:3:4 for deep lakes, and 2:3:3 for shallow lakes.
Figure 2 shows the percentages of singularity, the highest values corresponded to the non-impacted/oligotrophic lakes, particularly in the Cladocera taxa (SCLAD) with up to 50% singularity.
SIMPER tests showed average dissimilarities of 70.33% for Copepoda and 78.41% for Cladocera in the mixing (cold/dry) season. Five copepod and three cladoceran taxa contributed to most dissimilarity (~50%), and most of them were found in the impacted/eutrophic San Lorenzo, Bosque Azul, and La Encantada (Table 4). In the stratification (warm/rainy) season, the average dissimilarities were lower, with 67.22% for Copepoda and 65.96% for Cladocera. Once again, five copepod and three cladoceran taxa contributed to most dissimilarity (~50%), most of which were found in the impacted/eutrophic Bosque Azul and La Encantada, and the non-impacted/oligotrophic Montebello, Cinco Lagos and Pojoj (Table 4).

4.2. Abundance and Biomass

The anthropogenic impact on the lakes is mostly mirrored in their eutrophication. There is a clear trophic gradient with eutrophic lakes towards the NW and oligotrophic lakes towards the SE. The phytoplankton biomass expressed as Chl-a concentration (Table 2) divided the impacted/eutrophic lakes from the non-impacted/oligotrophic lakes (Figure 3). Chl-a concentration in impacted/eutrophic lakes averaged 70.8 ± 52.7 µg L−1 (6.1–148.4 µg L−1), while in the non-impacted/oligotrophic lakes averaged 0.7 ± 0.3 µg L−1 (0.2–1.7 µg L−1). There were no differences in the Chl-a concentration between both seasons in the impacted/eutrophic lakes, with averages of 79.0 ± 48.3 µg L−1 (38.9–148.4 µg L−1) in the cold/dry season and 62.6 ± 61.2 µg L−1 (6.1–143.7 µg L−1) in the warm/rainy season nor in the non-impacted/oligotrophic lakes with averages of 0.6 ± 0.3 µg L−1 (0.2 1.1 µg L−1) in the cold/dry season and 0.7 ± 0.4 µg L−1 (0.3–1.7 µg L−1) in the warm/rainy season.
Microcrustacean abundance (Figure 3) mirrored the Chl-a distribution in the lakes, with higher abundances in the impacted/eutrophic lakes with 114.1 ± 74.7 ind L−1 (47–290 ind L−1) and lower in the non-impacted/oligotrophic lakes with 14.7 ± 12.6 ind L−1 (3–52 ind L−1). Microcrustacean abundance was higher in the warm/rainy season with an average of 49.3 ± 70.4 ind L−1 (3–290 ind L−1) than in the cold/dry season with 38.7 ± 53.1 ind L−1 (3–168 ind L−1). In the impacted/eutrophic lakes, nauplii comprised higher abundance percentages (41.3 ± 20.2%) in the cold/dry season, and nauplii (31.3 ± 11.5%) and adult copepods (24.8 ± 11.8%) in the warm/rainy season. Adult copepods composed the higher abundance percentages (47.0 ± 17.4% in the cold/dry season and 45.0 ± 16.4% in the warm/rainy season) in the non-impacted/oligotrophic lakes. Eutrophication seems to lower the calanoid copepods to cyclopoid copepods (CCAL:CCYC) ratio [14,46,47,48,49,50,51]. In taxonomic richness, CCAL:CCYC is 0.85 in non-impacted/oligotrophic lakes and 0.55 in impacted/eutrophic lakes. Per lake, CCAL:CCYC ranges from 0.5 to 1.5 in non-impacted/oligotrophic lakes and from 0.2 to 1.0 in impacted/eutrophic lakes. In abundance, the CCAL:CCYC are 0.89 in non-impacted/oligotrophic lakes and 0.36 in impacted/eutrophic lakes; finally, in biomass, the CCAL:CCYC are 2.31 in non-impacted/oligotrophic lakes and 0.42 in impacted/eutrophic lakes.
Microcrustacean biomass (Figure 3) also paralleled the Chl-a distribution in the lakes with higher biomasses in the impacted/eutrophic lakes with 238.7 ± 143.7 µg DW L−1 (98.8–572.1 µg DW L−1) and lower in the non-impacted/oligotrophic lakes with 67.8 ± 59.8 µg DW L−1 (13.6–221.2 µg DW L−1). Microcrustaceans biomass was higher in the warm/rainy season with an average of 129.4 ± 139.2 µg DW L−1 (22.2–572.1 µg DW L−1) than in the cold/dry season with 106.7 ± 100.1 µg DW L−1 (13.6–355.6 µg DW L−1). Differently from abundance, the adult copepods’ biomass percentages were the most important in the impacted/eutrophic (49.5 ± 19.5% and 47.0 ± 16.9%) and in the non-impacted/oligotrophic (68.2 ± 11.6% and 66.6 ± 14.8%) lakes in both seasons.
Copepods in impacted/eutrophic lakes were more numerous than in non-impacted/oligotrophic lakes, with 48.8 ± 37.8 ind L−1 versus 8.9 ± 7.7 ind L−1 (cold/dry season) and 52.0 ± 35.5 ind L−1 versus 10.3 ± 7.9 ind L−1 (warm/rainy season). Cladocerans in impacted/eutrophic lakes were also more numerous than in non-impacted/oligotrophic lakes, with 23.1 ± 22.6 ind L−1 versus 2.0 ± 1.7 ind L−1 (cold/dry season) and 28.4 ± 24.2 ind L−1 versus 5.6 ± 7.2 ind L−1 (warm/rainy season). The copepods biomass in impacted/eutrophic lakes was higher than in non-impacted/oligotrophic lakes with 129.7 ± 66.2 µg DW L−1 versus 50.8 ± 51.3 µg DW L−1 (cold/dry season) and 154.9 ± 113.4 µg DW L−1 versus 50.0 ± 35.2 µg DW L−1 (warm/rainy season). The cladoceran biomass in impacted/eutrophic lakes was also higher than in non-impacted/oligotrophic lakes with 63.1 ± 61.1 µg DW L−1 versus 11.5 ± 13.8 µg DW L−1 (cold/dry season) and 59.6 ± 53.8 µg DW L−1 versus 20.0 ± 23.6 µg DW L−1 (warm/rainy season).
Zooplankton abundance and biomass are not necessarily related because zooplankton is composed of a large diversity of organisms displaying large differences in size [15,52]. The microcrustacean abundance in impacted/eutrophic lakes was cyclopoid copepods > cladocerans > calanoid copepods (47.6, 35.3 and 17.2%), while in non-impacted/oligotrophic lakes it was cyclopoid copepods > calanoid copepods > cladocerans 39.8, 35.6 and 24.5%). Regarding biomass, the dominance in impacted/eutrophic lakes was cyclopoid copepods > calanoid copepods > cladocerans (55.1, 23.2 and 21.7%) and calanoid copepods > cyclopoid copepods > cladocerans in non-impacted/oligotrophic (56.7, 24.5 and 18.7%).
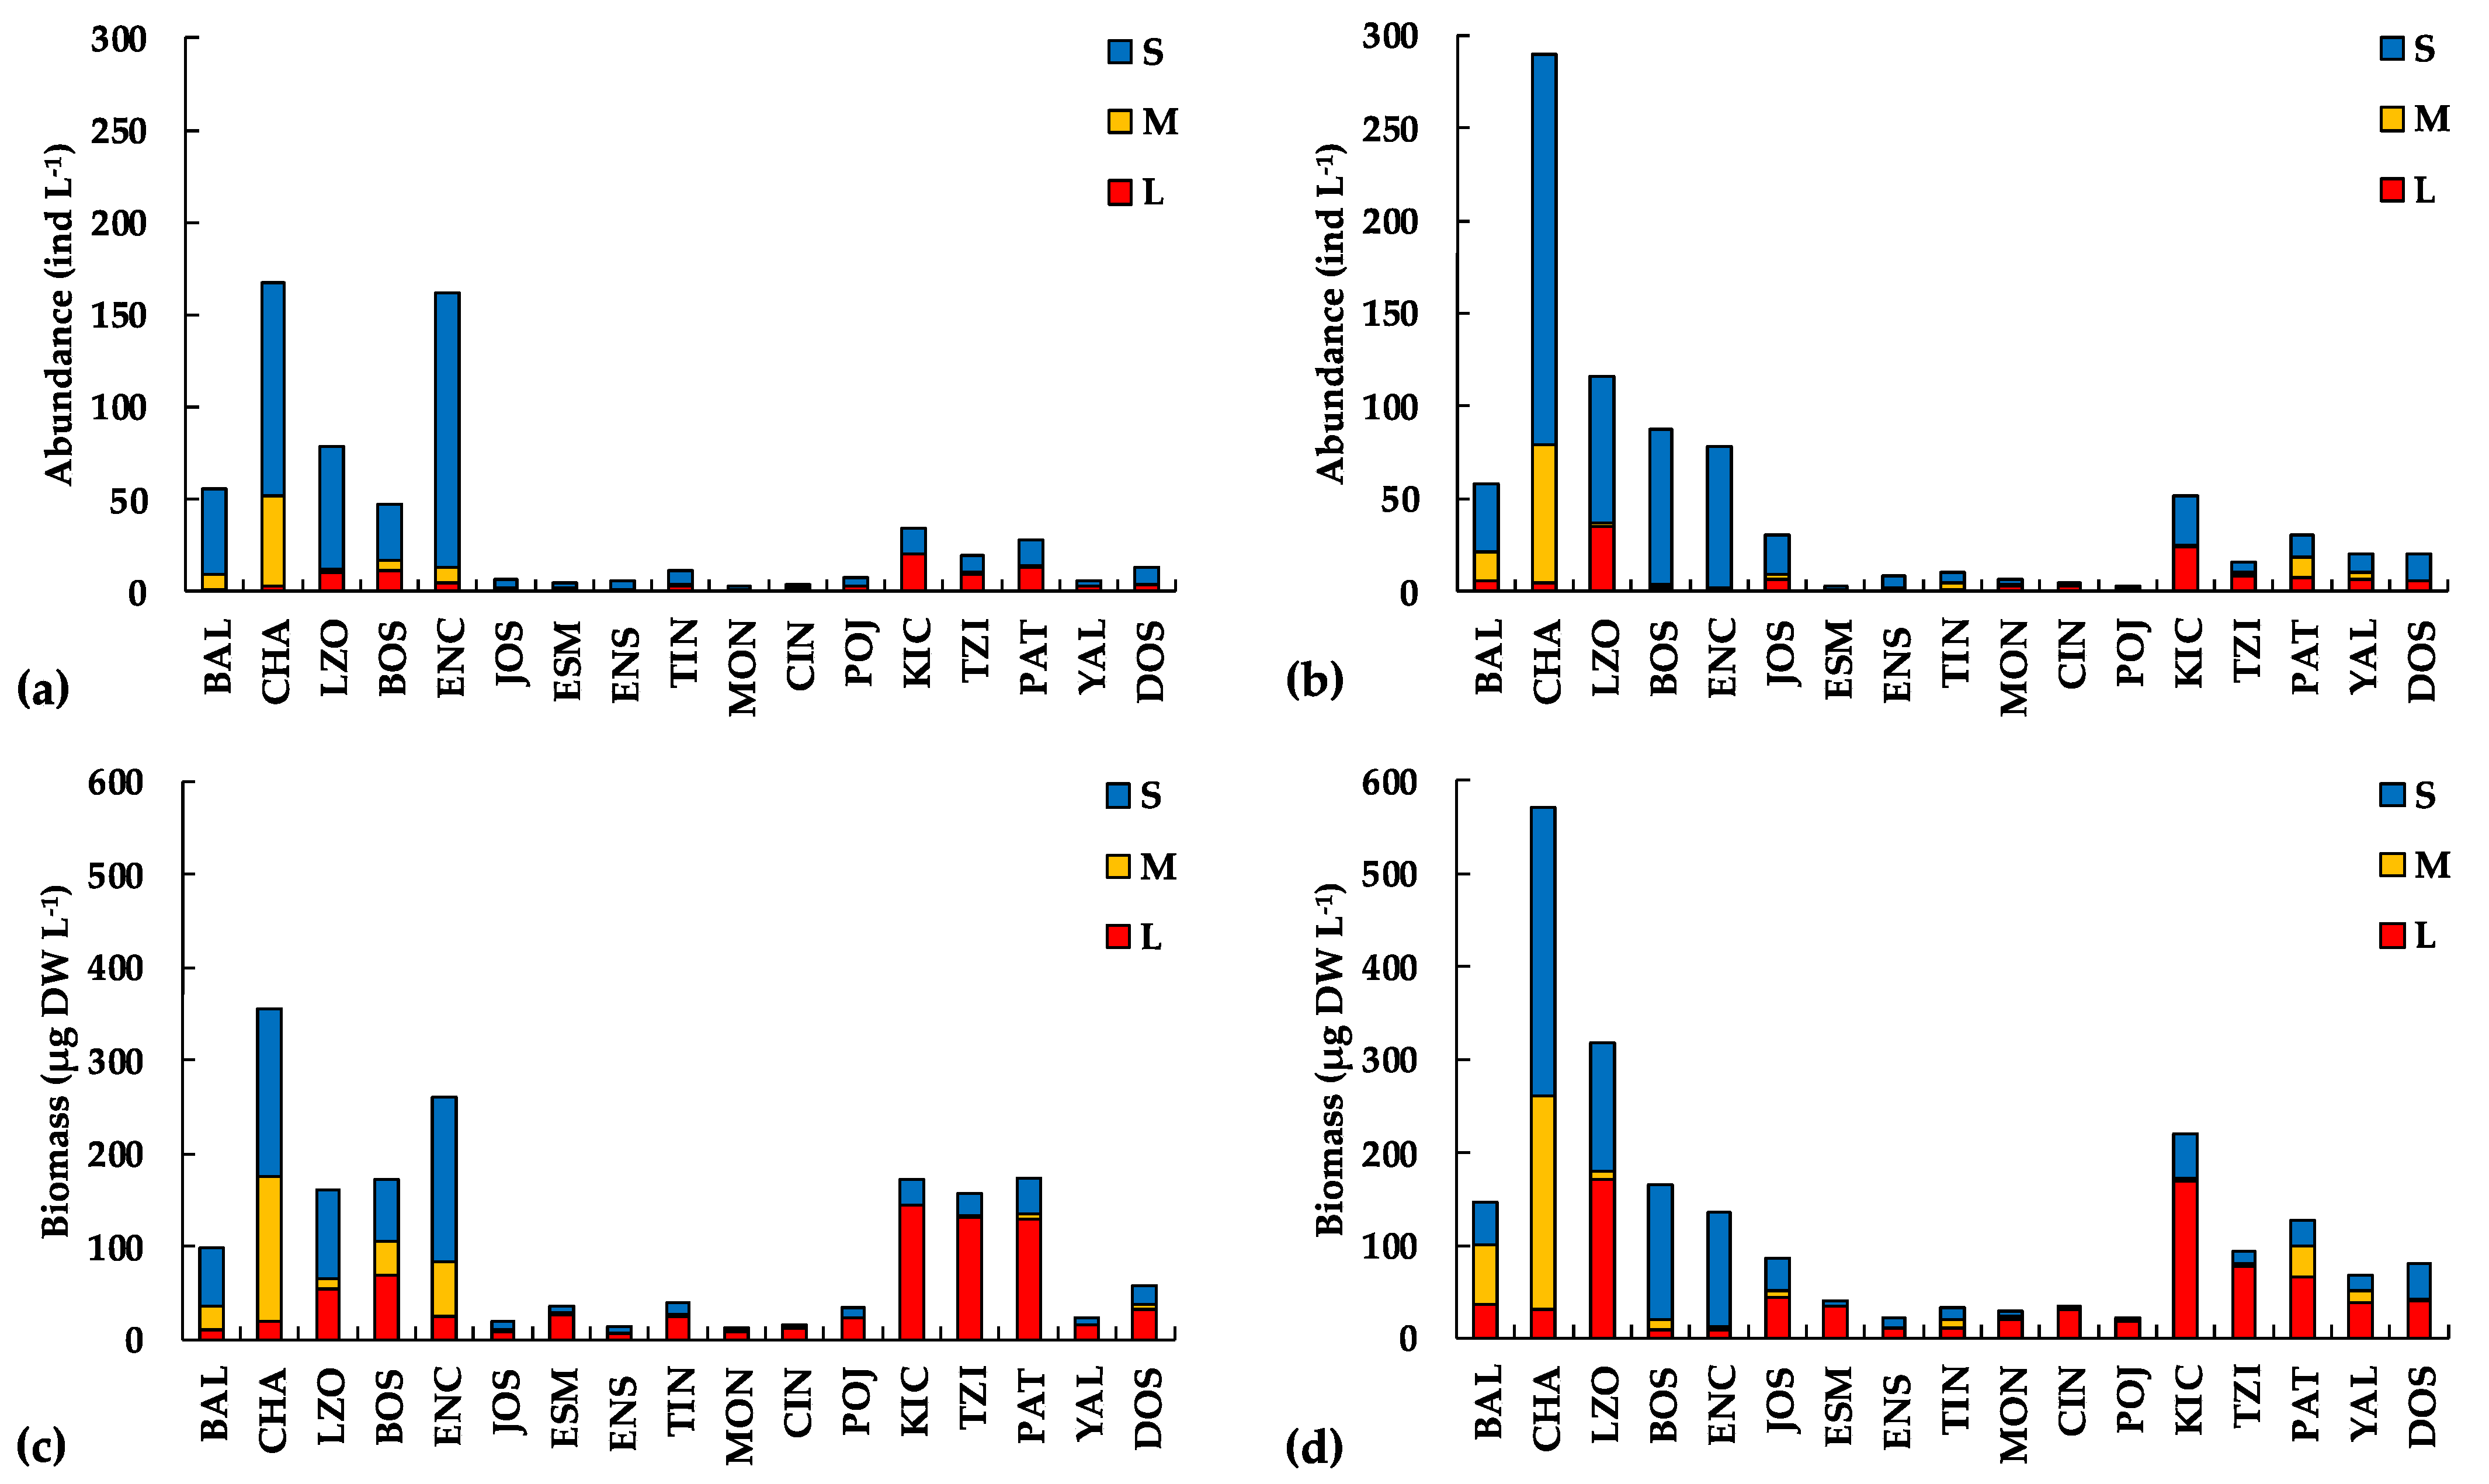
Regarding the microcrustacean taxa contribution to abundance per size classes (Table 5, Figure 4), the small size dominated in the impacted/eutrophic lakes in the cold/dry season with 78.6 ± 11.5% (64.3–91.6%), similar to the warm/rainy season with 79.2 ± 15.8% (63.2–97.3%). Although the small size also dominated the non-impacted/oligotrophic lakes, the contribution of the large size increased, differing from the impacted/eutrophic lakes. The small size contributed with 58.1 ± 10.6% (39.1–75.6%) and the large size with 35.3 ± 14.3% (15.7–60.9%) in the cold/dry season. The contribution percentages were similar in the warm/rainy season, with 51.2 ± 16.8% (25.4–73.1%) for the small size and 36.4 ± 16.5% (12.1–65.2%) for the large size.
Concerning the microcrustacean taxa contribution to biomass per size-classes (Table 5, Figure 4), in the impacted/eutrophic lakes in the cold/dry season, the small size composed of around one-half (55.7 ± 11.5%, 38.5–67.9%) while the other half was equally comprised by the medium (24.1 ± 13.4%, 6.8–44.1%) and the large (20.2 ± 15.9%, 5.6–40.6%) size-classes. In the warm/rainy season, the small size contribution increased to 61.5 ± 26.1% (32.2–90.3%), and the rest divided similarly between the medium (19.3 ± 20.5%, 2.8–43.1%) and the large (29.2 ± 21.0%, 5.1–53.7%) size-classes. Differently, the large size dominated in the non-impacted/oligotrophic lakes with 66.4 ± 13.2% (43.3–84.1%) and 64.9 ± 18.6% (31.4–88.7%) in the cold/dry and warm/rainy seasons, respectively. Eutrophication has also been mentioned as the cause of favoring the small size over the large size in cladocerans [20,21,22]. In both the impacted/eutrophic and non-impacted/oligotrophic lakes, the medium size cladocerans dominated (69.9% and 40.3%, respectively), followed by the small-size cladocerans (27.6% and 36.6%, respectively). However, the large-size cladocerans were scarcer in impacted/eutrophic lakes (2.5%) than in non-impacted/oligotrophic lakes (23.1%). In biomass, the difference was more marked with a small (8.4%) contribution of the large cladocerans in impacted/eutrophic lakes than a larger contribution (48.9%) in the non-impacted/oligotrophic lakes.

4.3. Multivariate Analysis

The abundance of HMA separated the lakes into two groups. The first group included 12 oligotrophic lakes (Montebello, Yalalush, Agua Tinta, Ensueño, Kichail, Cinco Lagos, Pojoj, Dos Lagos, Patianú, Tziscao, San José, Esmeralda), and the second group five eutrophic lakes (Balantetic, Chajchaj, San Lorenzo, Bosque Azul, La Encantada,). The abundance of nauplii, followed by Diaphanosoma sp., M. micrura, Moinodaphnia sp., M. montezumae, and medium-sized cyclopoids, explained these groups’ separation (Figure 5a). The biomass HMA also produced two groups. The first comprises five eutrophic lakes (San Lorenzo, Bosque Azul, Balantetic, Chajchaj, La Encantada), while the second comprises 12 oligotrophic lakes (Cinco Lagos, Pojoj, Agua Tinta, Patianú, Montebello, San José, Yalalush, Kichail, Dos Lagos, Tziscao, Esmeralda, Ensueño). The separation of the groups is explained by the biomass of M. montezumae and L. cuauhtemoci, followed by large and medium-sized cyclopoids (Figure 5b).
The SIMPER carried out for the abundance of the microcrustaceans showed that the nauplii (26.5%) were those that explained the maximum dissimilarity between the groups formed in the HMA, followed by Cyclopoid copepodite, Small Cyclopoids, M. nesus, C. dubia, Calanoid copepodite, and Moina micrura to explain 75%. The biomass of the nauplii (15.2%) contributed the most to the dissimilarity between the formed groups. The 75% contribution was explained by the Small Cyclopoid, Medium Cyclopoid, M. nesus, L. cuauhtemoci, M. maya, Moina micrura, Cyclopoid copepodite, and Large Cyclopoid (Appendix A).
For the two CCAs, p < 0.05 (Monte Carlo permutation test) was observed between environmental variables and abundance and biomass of microcrustacean. The first two components of the abundance CCA explained 66.25% of the total variance; in the biomass CCA, the first component explained 44.94% of the total variance (Appendix B). In both cases, the VIF values were less than 10, so it was not necessary to eliminate variables. Both CCAs showed similar results (Figure 6); the first axis was positively and significantly correlated with K25 and Chl-a concentration and negatively with ZEU. The second axis was positively correlated with DO and pH. The lakes were clustered in two groups according to the Chl-a concentration and the ZEU. Lakes with higher Chl-a concentration and lower ZEU are on the right side of the component, while lakes with lower Chl-a concentration and higher ZEU are on the left side of the component. Daphnia species and Diaphanosoma sp. were associated with lakes with lower Chl-a concentrations and ZEU.

5. Discussion

The T and DO vertical profiles during the stratification season showed major differences between non-impacted/oligotrophic and impacted/eutrophic lakes despite similar average values. [53] reported shallower (5.3 ± 1.5 m) thermoclines with stronger (0.8 ± 0.2 °C m−1) thermal gradients in impacted/eutrophic lakes, comparing with deeper (14.0 ± 7.1 m) and weaker (0.5 ± 0.1 °C m−1) thermal gradients in non-impacted/oligotrophic. All lakes’ hypolimnia became anoxic and uninhabitable for aerobic organisms during the stratification. The narrow aerobic epilimnia of impacted/eutrophic lakes restrain the habitable layer to a few meters, while the wider epilimnia of non-impacted/oligotrophic provide a larger habitable stratum. The ZEU was different between both lake types, which is mainly associated with the large concentration of phytoplankton (confirmed by the large Chl-a concentration) in impacted/eutrophic lakes; this is biogenic turbidity.
The anthropogenic impacts supplying agricultural fertilizers and urban wastewater to the lakes since the early 1950s drove the lakes’ eutrophication [25,54]. Some authors [24,53] reported high nutrient, Chl-a, seston, and particulate organic carbon concentrations in the impacted/eutrophic lakes. The nuisance cyanobacterial scums in some of the PNLM lakes ratified the advanced state of eutrophication, which negatively impacts tourism and the general economic development of the area [55]. Anthropogenic impacts have altered the water column and the sediments of the lakes [54]. There is an NW to SE trophic gradient of the “Lagunas de Montebello” National Park lakes with eutrophic lakes towards the NW and oligotrophic lakes towards the SE.
The pelagic microcrustacean assemblage in the “Lagunas de Montebello” National Park lakes is heterogeneous; out of the 32 reported taxa, only seven (~22%) were distributed in 10–14 lakes, while most of the species (53.5%) were found in only one to three lakes (~6–18%).
The regional microcrustacean diversity in the “Lagunas de Montebello” National Park lakes was within the range reported for other neotropical regions (9.4 ± 2 microcrustacean taxa per lake). [56] report 41 cladocerans in the Yucatan Peninsula (15 lakes), 36 cladocerans in Belize (three lakes), and 25 cladocerans in Guatemala (19 lakes), with an average of 9.6 ± 6 species per lake. Only four species of calanoid copepods were found for the three regions mentioned, with an average of 1 ± 0.5 species per lake. In Brazil, [57] reported 46 cladocerans and 17 copepods for the Atlantic Forest region (49 lakes and reservoirs) and 53 cladocerans and 22 copepods for the Caatinga region (107 lakes and reservoirs), with an average of 5 ± 9 cladoceran species and 2.1 ± 9 copepod species for both regions. The high species richness of cladocerans in the five regions is higher compared to the present study, with only 11 taxa of cladocerans. However, all of the five studies refereed included littoral and pelagic taxa, while ours comprised only the pelagic zone.
The high regional diversity of pelagic microcrustaceans is probably associated with biogeographic patterns. The studied area is in the concurrence of the Nearctic and Neotropical biogeographic provinces, most likely playing a key role in the high diversity of the aquatic communities of epicontinental waters [6]. Most copepods belong to the genera Mastigodiaptomus, Leptodiaptomus, Mesocyclops, and Thermocyclops, all with greater diversity in tropical areas [28,58,59]. Recently, [12] explained that the closeness between lakes and the high environmental heterogeneity promoted species turnover, resulting in the large regional diversity but great singularity level among the benthic macroinvertebrates of the “Lagunas de Montebello” National Park lakes. The same large regional diversity but great singularity in these lakes have been reported for the zooplankton and benthic macroinvertebrates communities [10,11,60].
The trophic state indicated by the Chl-a concentration was related to the microcrustacean abundance and biomass (Figure 6), both higher in eutrophic (114.1 ± 74.7 ind L−1, 238.7 ± 143.7 µg DW L−1) than in oligotrophic (14.8 ± 12.6 ind L−1, 67.8 ± 59.8 µg DW L−1) lakes. Nonetheless, there were variations between the lakes in each trophic state, with the [20,21] maximum to minimum rates of 6× in eutrophic and 16× in oligotrophic lakes in both abundance and biomass. The abundance in eutrophic lakes ranged between 47 and 290 ind L−1 and in the oligotrophic lakes between 3 and 52 ind L−1. The biomass in eutrophic lakes ranged between 98.8 and 572.1 µg DW L−1 and in the oligotrophic lakes between 13.6 and 221.2 µg DW L−1.
The Chl-a concentrations in the lakes located in the central portion corresponded to ultraoligotrophic (<0.5 µg L−1), while those on the SE to oligotrophic (>0.5 to~1.0 µg L−1). This marginal difference explains the microcrustacean abundance and biomass increase on the lakes towards the extreme SE while lower at the central portion.
The decrease in size of zooplanktonic organisms has been explained by several factors, among them the most mentioned are predation by fish that select large over small sizes organisms [61,62,63], the cyanobacteria dominance in eutrophic lakes with low nutritional quality, toxic, and potentially could inhibit the cladocerans filtration mechanism [20,21,64,65]. From the abovementioned causes, [55] reported high dominance (>90%) and large densities of cyanobacteria in the phytoplankton but also the presence of microcystins (2.0 to 5.3 µg L−1) in the eutrophic lakes of the “Lagunas de Montebello” National Park. On the other hand, the CCA showed a positive relationship between the Daphnia spp. and the euphotic zone, which may be related to the fact that large-sized species are better filter feeders than small ones, particularly in aquatic ecosystems where food is limited, and the large size can result useful becoming better competitors [61,66,67].
Numerous studies use the zooplankton community to identify anthropic effects on water bodies such as eutrophication and climate change (e.g., [14,15,16,19,39,44,54,55,56,68]). Paleolimnological studies in the area indicate the anthropic impacts on the lakes began 60 years ago, and the resilience of the lakes allowed the eutrophication process to go unnoticed until 2003 [23,24].
The zooplankton community differs between the impacted/eutrophic and non-impacted/oligotrophic lakes of the LMNP. The copepod Leptodiaptomus cuauhtemoci and the cladocerans Eubosmina tubicen and Ceriodaphnia dubia dominated abundance and biomass in the impacted/eutrophic lakes. In contrast, the copepods Mastigodiaptomus maya, Mastigodiaptomus nesus, and the cladoceran Diaphanosoma sp. dominated in non-impacted/oligotrophic lakes. Moreover, species restricted to impacted/eutrophic lakes were observed, such as the copepods Mastigodeaptomus montezumae, Mesocyclops aspericornis, and the cladoceran Moina micrura. Differently, the cladoceran Daphnia gessneri was restricted to non-impacted/oligotrophic lakes.
Although climate change could modify air temperature and rainfall patterns [16,68], eutrophication, erosion, and wastewater pollution are already impacting these lakes. The short- and long-term changes in the lakes of the “Lagunas de Montebello” National Park could be detected by monitoring the zooplankton community.
The regional diversity of the microcrustacean assemblages of the lakes of the “Lagunas de Montebello” National Park is high since each lake’s taxonomic composition shows a great level of singularity, which points to a considerable fragility of the ecosystem’s biodiversity. If the increasing human activities in the area lead to the loss of just a single lake’s biodiversity, the result is a reduction in the regional biodiversity. Similar high regional diversities on the pelagic rotifer [11] and benthic macroinvertebrate [10] assemblages suggest this is a characteristic diversity pattern of the “Lagunas de Montebello” National Park Lake District.

6. Conclusions

The karst lake district of “Lagunas de Montebello” National Park embraces a great regional microcrustacean biodiversity composed of 32 taxa (five calanoid copepods, 16 cyclopoid copepods, and 11 cladocerans). Nonetheless, regional microcrustacean biodiversity is composed of accumulating each lake’s contribution that displays a great level of singularity. Fifteen taxa (≈47%) were found in only one to three lakes (≈18%), while only two taxa (≈6%) were widely distributed in 13–14 lakes (≈80%). The increasing anthropic activities developing in the area have modified the microcrustacean assemblages of the lakes. The impacted/eutrophic lakes displayed higher taxonomic richness, abundance, and biomass values than the non-impacted/oligotrophic lakes. Nauplii and copepods were the most abundant, while the copepods provided the largest biomass. Small-size taxa dominated the abundance and biomass in impacted/eutrophic lakes, and large taxa in non-impacted/oligotrophic lakes were dominant.

Author Contributions

Conceptualization, R.F. and J.A.; Data curation, R.F.; Formal analysis, R.F., J.A. and L.A.O.; Funding acquisition, J.A.; Investigation, R.F., J.A. and L.A.O.; Methodology, R.F. and L.A.O.; Project administration, J.A. and L.A.O.; Resources, J.A.; Software, R.F. and L.A.O.; Supervision, J.A.; Validation, R.F., J.A. and L.A.O.; Visualization, R.F., J.A. and L.A.O.; Writing—original draft, R.F., J.A. and L.A.O.; Writing—review & editing, R.F., J.A. and L.A.O. All authors have read and agreed to the published version of the manuscript.

Funding

This research was funded by the Fondo Sectorial de Investigación y Desarrollo Sobre el Agua CONAGUA-CONACYT through project 167603 and by DGAPA/UNAM through Projects PAPIIT-IN219215, PAPIIT-IV200319 and PAPIIT- IV200122.

Institutional Review Board Statement

Not applicable.

Data Availability Statement

Data are available from the authors upon reasonable request.

Acknowledgments

We thank René Morales Hernández and collaborators for support during the fieldwork. We also thank the Parque Nacional Lagunas de Montebello, Comisión Nacional de Áreas Naturales Protegidas (CONANP) (Jesús A. León and Roberto Castellanos), the local community, and the Comisariados Ejidales from Antelá, Cárdenas, Miguel Hidalgo, Ojo de Agua, and Tziscao for facilitating access to the lakes. We also thank the Comité de Administración de Tziscao (Sergio Marcos and Miguel A. Tomas), Presidente del Comité de Turismo de Tziscao (Armando Hernández), Comisario Ejidal de Tziscao (Enrique M. Hernández), and personnel of the Villas Tziscao Hotel (Rosemberg F. Jorge, Juan G. Espinoza, and Gemuel P. Hernández) for offering their support and facilities for this study. We thank Mariana Vargas for drawing Figure 1 and Daniela Cortés for statistical advice.

Conflicts of Interest

The authors declare no conflict of interest.

Appendix A

Table A1. Results of SIMPER (similarity percentage) analysis demonstrating taxa that contributed most to the dissimilarity between groups. (Av. Abund. = average abundance, Av. Biom. = average biomass, Av. Diss. = average dissimilarity, Diss- = dissimilarity, Contrib. = contribution to dissimilarity, Cum. = cumulative contribution to dissimilarity).
Abundance
SpeciesAv. Abund.Av. Abund.Av. Diss.Diss./SDContrib.%Cum.%
Av. Dissimilarity: 82.2%EutrophicOligotrophic
Nauplii27.7121.2670.2051.38826.526.5
Cyclopoid copepodite12.3630.4780.1101.11714.140.6
Small Cyclopoids9.8872.2780.0931.47312.052.6
M. nesus1.6003.2110.0560.9297.359.9
C. dubia3.7251.2440.0480.7266.266.1
Calanoid copepodite3.5871.6440.0400.8575.271.3
Moina micrura6.8500.0000.0340.4964.475.7
Medium Cyclopoids3.6500.1000.0320.9954.179.8
Diaphanosoma sp. 1.0620.7780.0290.7023.883.6
L. cuauhtemoci1.7620.9670.0280.7793.687.2
C. dubia1.7500.2670.0250.8093.290.4
D. gessneri0.3880.6330.0160.6422.192.5
M. montezumae1.4130.0000.0140.5571.794.2
Large Cyclopoids1.2750.0110.0130.8971.795.9
M. maya0.2500.1330.0110.5441.497.3
Moinodaphnia sp. 0.3620.0000.0060.4410.898.1
D. galeata0.0250.2330.0050.4950.698.7
A. clavipes0.0000.1890.0030.2770.499.1
D. obtusa0.2250.0670.0030.7950.499.5
D. hyalina0.0000.1890.0020.3110.299.7
D. ambigua0.0000.0780.0020.3260.3100.0
D. cheraphila0.0000.0110.0000.2270.0100.0
Biomass
SpeciesAv. Biom.Av. Biom.Av. Diss.Diss./SDContrib.%Cum.%
Av. Dissimilarity: 75.7%EutrophicOligotrophic
Nauplii42.651.5680.125771.710915.215.2
Small Cyclopoids35.078.9540.101541.527312.327.5
Medium Cyclopoids29.120.8060.095731.43711.639.1
M. nesus4.4421.4170.076981.11419.348.4
L. cuauhtemoci11.653.6070.047180.69475.754.1
M. maya0.579.3550.047110.59685.759.8
Moina micrura21.0100.0460.57245.565.3
Cyclopoid copepodite12.080.6920.04070.93535.070.3
Large Cyclopoids10.640.4070.03541.01334.374.6
C. dubia7.271.6290.031610.80143.878.4
Calanoid copepodite9.293.0490.029990.86043.682
M. montezumae8.3600.029750.69413.685.6
C. dubia5.830.9680.025390.82663.188.7
D. gessneri06.460.024090.70612.991.6
A. clavipes05.2880.019250.28422.393.9
Diaphanosoma sp. 0.53.9440.017750.74452.296.1
D. obtusa2.30.4690.010540.99451.297.3
D. galeata01.7250.007660.50331.098.3
Moinodaphnia sp. 1.260.0160.006930.43680.899.1
D. hyalina01.2360.003470.29550.499.5
D. ambigua00.5340.003410.31610.499.9
D. cheraphila00.0820.00060.27810.1100

Appendix B

Table A2. Summary of CCA analysis among abundance and biomass of microcrustacean and environmental variables. Bold numbers reflect the significant related variables for each axis.
AbundanceBiomass
CCA 1CCA 2CCA 3CCA 1CCA 2CCA 3
Axis summary statistics
Eigenvalue0.2150.1450.0910.3090.2030.150
p-value0.0010.0160.2000.0050.2640.718
% of variance explained45.8220.4314.0944.9422.0011.47
Cumulative % explained45.8266.2580.3444.9466.9478.41
Correlations of environmental variables and canonical axes (Intraset correlations of terBraak, 1986)
Temperature−0.574-0.2160.3545−0.3130.278−0.734
K250.8830.1930.25060.8250.2670.282
DO.0.2120.6120.23700.3160.801−0.490
pH0.4530.5690.51430.4550.631−0.309
Chlorophyll a0.8280.3600.27240.8680.473−0.115
ZEU0.8470.301−0.16240.8670.2360.146

References

  1. CONANP México Megadiverso. Available online: https://www.gob.mx/conanp/articulos/mexico-megadiverso-173682 (accessed on 10 May 2022).
  2. Lyons, T.J.; Máiz-Tomé, L.; Tognelli, M.; Daniels, A.; Meredith, C.; Bullock, R.; Harrison, I. (Eds.) The Status and Distribution of Freshwater Fishes in Mexico; IUCN and ABQ BioPark: Cambridge, UK; Albuquerque, NM, USA, 2020. [Google Scholar]
  3. Alvarez, F.; Villalobos, J.L. Freshwater decapod diversity and conservation in Mexico. In A global Overview of the Conservation of Freshwater Decapod Crustaceans; Kawai, T., Cumberlidge, N., Eds.; Springer: Berlin/Heidelberg, Germany, 2016; pp. 237–266. [Google Scholar]
  4. Arriaga Cabrera, L.; Aguilar Sierra, V.; Alcocer, J. Aguas continentales y diversidad biológica de México. Available online: http://www.conabio.gob.mx/conocimiento/regionalizacion/doctos/hidrologicas.html (accessed on 10 May 2022).
  5. Aguilar, V. Aguas continentales y diversidad biológica de México: Un recuento actual. Biodiversitas 2003, 8, 1–15. [Google Scholar]
  6. Alcocer, J.; Aguilar Sierra, V. Biodiversity in inland waters. In Mexican Aquatic Environments. A General View from Hydrobiology to Fisheries; Ibañez, A.L., Ed.; Springer Nature: Cham, Switzerland, 2019; pp. 43–75. [Google Scholar]
  7. Arriaga Cabrera, L.; Aguilar Sierra, V.; Alcocer, J. Aguas Continentales y Diversidad Biológica de México; CONABIO: Mexico City, México, 2002; p. 327 + 1 mapa. ISBN 970-9000-15-2. [Google Scholar]
  8. CONABIO; CONANP. Vacíos y omisiones en la conservación de la biodiversidad acuática epicontinental de México: Cuerpos de agua, ríos y humedales; Escala: 1:1 000 000; Comisión Nacional para el Conocimiento y Uso de la Biodiversidad, Comisión Nacional de Áreas Naturales Protegidas: Mexico City, Mexico, 2010. [Google Scholar]
  9. Lira-Noriega, A.; Aguilar, V.; Alarcón, J.; Kolb, M.; Urquiza-Haas, T.; González-Ramírez, L.; Tobón, W.; Koleff, P. Conservation planning for freshwater ecosystems in Mexico. Biol. Conserv. 2015, 191, 357–366. [Google Scholar] [CrossRef]
  10. Cortés-Guzmán, D.; Alcocer, J.; Oseguera, L.A. Benthic macroinvertebrate community diversity of Montebello Lakes, Chiapas. Rev. Mex. Biodivers. 2019, 90, 1–11. [Google Scholar] [CrossRef]
  11. Fernández, R.; Alcocer, J.; Oseguera, L.A. Regional pelagic rotifer biodiversity in a tropical Karst Lake District. Diversity 2020, 12, 454. [Google Scholar] [CrossRef]
  12. Cortés-Guzmán, D.; Alcocer, J. Turnover Drives High Benthic Macroinvertebrates’ Beta Diversity in a Tropical Karstic Lake District. Diversity 2022, 14, 259. [Google Scholar] [CrossRef]
  13. Karpowicz, M.; Ejsmont-Karabin, J.; Więcko, A.; Górniak, A.; Cudowski, A. A place in space—The horizontal vs vertical factors that influence zooplankton (Rotifera, Crustacea) communities in a mesotrophic lake. J. Limnol. 2019, 78, 243–258. [Google Scholar] [CrossRef]
  14. Min, C.; Johansson, L.S.; Søndergaard, M.; Lauridsen, T.L.; Chen, F.; Sh, T.; Jeppesen, E. Copepods as environmental indicator in lakes: Special focus on changes in the proportion of calanoids along nutrient and pH gradients. Aquat. Ecol. 2021, 55, 1241–1252. [Google Scholar] [CrossRef]
  15. Sendacz, S.; Caleffi, S.; Santos-Soares, J. Zooplankton biomass of reservoirs in different trophic conditions in the State of São Paulo, Brazil. Brazilian J. Biol. 2006, 66, 337–350. [Google Scholar] [CrossRef] [Green Version]
  16. Gilbert, J.D.; de Vicente, I.; Ortega, F.; Guerrero, F. Zooplankton Community Dynamics in Temporary Mediterranean Wetlands: Which Drivers Are Controlling the Seasonal Species Replacement? Water 2021, 13, 1447. [Google Scholar] [CrossRef]
  17. Patalas, K. Crustacean Plankton Communities in Forty-Five Lakes in the Experimental Lakes Area, Northwestern Ontario. J. Fish. Res. Board Canada 1971, 28, 231–244. [Google Scholar] [CrossRef]
  18. Gooriah, L.D.; Chase, J.M. Sampling effects drive the species–area relationship in lake zooplankton. Oikos 2020, 129, 124–132. [Google Scholar] [CrossRef] [Green Version]
  19. Perbiche-Neves, G.; Nogueira, M.G. Reservoir design and operation: Effects on aquatic biota—A case study of planktonic copepods. Hydrobiologia 2013, 707, 187–198. [Google Scholar] [CrossRef]
  20. Sampaio, E.V.; Rocha, O.; Matsumura-Tundisi, T.; Tundisi, J.G. Composition and abundance of zooplankton in the limnetic zone of seven reservoirs of the Paranapanema River, Brazil. Brazilian J. Biol. 2002, 62, 525–545. [Google Scholar] [CrossRef]
  21. Leonard, J.A.; Paerl, H.W. Zooplankton community structure, micro-zooplankton grazing impact, and seston energy content in the St. Johns river system, Florida as influenced by the toxic cyanobacterium Cylindrospermopsis raciborskii. Hydrobiologia 2005, 537, 89–97. [Google Scholar] [CrossRef]
  22. Wang, L.; Chen, J.; Su, H.; Ma, X.; Wu, Z.; Shen, H.; Yu, J.; Liu, J.; Wu, Y.; Ding, G.; et al. Is Zooplankton Body Size an Indicator of Water Quality in (Sub)tropical Reservoirs in China? Ecosystems 2022, 25, 308–319. [Google Scholar] [CrossRef]
  23. Williamson, C.E.; Fischer, J.M.; Bollens, S.M.; Overholt, E.P.; Breckenridge, J.K. Toward a more comprehensive theory of zooplankton diel vertical migration: Integrating ultraviolet radiation and water transparency into the biotic paradigm. Limnol. Oceanogr. 2011, 56, 1603–1623. [Google Scholar] [CrossRef] [Green Version]
  24. Alcocer, J.; Merino-Ibarra, M.; Oseguera, L.A.; Escolero, O. Anthropogenic impacts on tropical karst lakes: “Lagunas de Montebello,” Chiapas. Ecohydrology 2018, 11, e2029. [Google Scholar] [CrossRef]
  25. Caballero, M.; Mora, L.; Muñoz, E.; Escolero, O.; Bonifaz, R.; Ruiz, C.; Prado, B. Anthropogenic influence on the sediment chemistry and diatom assemblages of Balamtetik Lake, Chiapas, Mexico. Environ. Sci. Pollut. Res. 2020, 27, 15935–15943. [Google Scholar] [CrossRef]
  26. Bakhtiyar, Y.; Arafat, M.Y.; Andrabi, S.; Tak, H.I. Zooplankton: The Significant Ecosystem Service Provider in Aquatic Environment. In Bioremediation and Biotechnology, Volume 3; Springer International Publishing: Cham, Switzerland, 2020; pp. 227–244. [Google Scholar]
  27. Nogueira, M.G.; Reis Oliveira, P.C.; Tenorio de Britto, Y. Zooplankton assemblages (Copepoda and Cladocera) in a cascade of reservoirs of a large tropical river (SE Brazil). Limnetica 2008, 27, 151–170. [Google Scholar] [CrossRef]
  28. Suárez-Morales, E.; Reid, J.W.; Elías-Gutiérrez, M. Diversity and Distributional Patterns of Neotropical Freshwater Copepods (Calanoida: Diaptomidae). Int. Rev. Hydrobiol. 2005, 90, 71–83. [Google Scholar] [CrossRef]
  29. Alcocer, J.; Oseguera, L.A.; Sánchez, G.; González, C.G.; Martínez, J.R.; González, R. Bathymetric and morphometric surveys of the Montebello Lakes, Chiapas. J. Limnol. 2016, 75, 56–65. [Google Scholar] [CrossRef] [Green Version]
  30. Durán-Calderón, I.; Escolero-Fuentes, O.; Muñoz-Salinas, E.; Castillo-Rodríguez, M.; Silva-Romo, G. Cartografía geomorfológica a escala 1:50000 del Parque Nacional Lagunas de Montebello, Chiapas (México). Boletín Soc. Geológica Mex. 2014, 66, 263–277. [Google Scholar] [CrossRef]
  31. Hecky, R.E.; Kling, H.J. Phytoplankton ecology of the great lakes in the rift valleys of Central Africa. Arch. Hydrobiol. Beih. Ergebn. Limnol. 1987, 25, 197–228. [Google Scholar]
  32. Kilham, P.; Kilham, S.S.; Hecky, R.E. Hypothesized resource relationships among African planktonic diatoms. Limnol. Oceanogr. 1986, 31, 1169–1181. [Google Scholar] [CrossRef] [Green Version]
  33. Arar, E.J.; Collins, G.B. Method 445.0 In Vitro Determination of Chlorophyll a and Pheophytin a in Marine and Freshwater Algae by Fluorescence; U.S. Environmental Protection Agency: Cincinnati, OH, USA, 1997. [Google Scholar]
  34. Suárez-Morales, E.; Gutierrez-Aguirre, M.A. Morfología y Taxonomía de los Mesocyclops (Crustacea: Copepoda: Cyclopoida) de México; ECOSUR-CONACYT: Chetumal, Mexico, 2001. [Google Scholar]
  35. Benzie, J.A. The Genus Daphnia (Including Daphniopsis) (Anomopoda: Daphniidae) (Vol. 21); Kenobi Productions: Leiden, The Netherlands, 2005; ISBN 90-5782-151-6. [Google Scholar]
  36. Korovchinsky, N.M. Sididae & Holopediidae. Guides to the Identification of the Microinvertebrates of the Continental Waters of the World, 3; Academic Publishing: The Hague, The Netherlands, 1992. [Google Scholar]
  37. Korovchinsky, N.M. Description of two new species of Diaphanosoma Fischer, 1850 (Crustacea, Branchiopoda, Sididae) from the United States and Canada and species richness of the genus in North America. Hydrobiologia 2002, 489, 45–54. [Google Scholar] [CrossRef]
  38. Elías-Gutiérrez, M.; Suárez-Morales, E.; Gutiérrez-Aguirre, M.A.; Silva-Briano, M.; Granados-Ramírez, J.G.; Garfias-Espejo, T. Cladocera y Copepoda de las Aguas Continentales de México; UNAM: Mexico City, Mexico, 2008. [Google Scholar]
  39. Pozo, C.; Mercado-Salas, N.F.; Suárez-Morales, E.; Morrone, J.J. Distribution patterns of the American species of the freshwater genus Eucyclops (Copepoda: Cyclopoida). J. Crustac. Biol. 2012, 32, 457–464. [Google Scholar] [CrossRef] [Green Version]
  40. Bonecker, C.C.; Nagae, M.Y.; Bletller, M.C.M.; Velho, L.F.M.; Lansac-Tôha, F.A. Zooplankton biomass in tropical reservoirs in southern Brazil. Hydrobiologia 2007, 579, 115–123. [Google Scholar] [CrossRef]
  41. Boix, D.; Gascón, S.; Sala, J.; Badosa, A.; Brucet, S.; López-Flores, R.; Martinoy, M.; Gifre, J.; Quintana, X.D. Patterns of composition and species richness of crustaceans and aquatic insects along environmental gradients in Mediterranean water bodies. In Pond Conservation in Europe; Springer: Dordrecht, The Netherlands, 2007; pp. 53–69. [Google Scholar]
  42. Legendre, P.; Gallagher, E.D. Ecologically meaningful transformations for ordination of species data. Oecologia 2001, 129, 271–280. [Google Scholar] [CrossRef]
  43. Clarke, K.R.; Warwick, R. Changes in Marine Communities: An Approach to Statistical Analysys and Interpretation; PRIMER-E: Plymouth, UK, 2001. [Google Scholar]
  44. O’brien, R.M. A Caution Regarding Rules of Thumb for Variance Inflation Factors. Qual. Quant. 2007, 41, 673–690. [Google Scholar] [CrossRef]
  45. R Core Team. R: A Language and Environment for Statistical Computing; R Core Team: Vienna, Austria, 2021. [Google Scholar]
  46. Maier, G. Daphnia invasion: Population dynamics of Daphnia assemblages in two eutrophic lakes with particular reference to the introduced alien Daphnia ambigua. J. Plankton Res. 1996, 18, 2001–2015. [Google Scholar] [CrossRef] [Green Version]
  47. Jeppesen, E.; Jensen, J.P.; Søndergaard, M.; Lauridsen, T. Trophic dynamics in turbid and clearwater lakes with special emphasis on the role of zooplankton for water clarity. Hydrobiologia 1999, 408, 217–231. [Google Scholar] [CrossRef]
  48. Caramujo, M.J.; Boavidá, M.J. The crustacean communities of river Tagus reservoirs. Zooplankton structure as reservoir trophic state indicator. Limnetica 2000, 18, 37–56. [Google Scholar] [CrossRef]
  49. Haberman, J.; Haldna, M. Indices of zooplankton community as valuable tools in assessing the trophic state and water quality of eutrophic lakes: Long term study of Lake Võrtsjärv. J. Limnol. 2014, 73, 61–71. [Google Scholar] [CrossRef] [Green Version]
  50. Čeirāns, A. Zooplankton indicators of trophy in Latvian lakes. Bioloģija Biol. 2007, 723, 61–69. [Google Scholar]
  51. Masson-Delmotte, V.; Zhai, P.; Pirani, A.; Connors, S.L.; Péan, C.; Berger, S.; Caud, N.; Chen, Y.; Goldfarb, L.; Gomis, M.I. (Eds.) IPCC Summary for Policymakers. In Climate Change 2021: The Physical Science Basis. Contribution of Working Group I to the Sixth Assessment Report of the Intergovernmental Panel on Climate Change; Cambridge University Press: Cambridge, UK, 2021. [Google Scholar]
  52. Matsumura-Tundisi, T.; Rietzler, A.C.; Tundisi, J.G. Biomass (dry weight and carbon content) of plankton crustacea from Broa reservoir (Sao Carlos, S.P.-Brazil) and its fluctuation across one year. Hydrobiologia 1989, 179, 229–236. [Google Scholar] [CrossRef]
  53. Vargas-Sánchez, M.; Alcocer, J.; Oseguera, L.A. Seston and eutrophication on a tropical karst lake district: Lagunas de Montebello, Chiapas, Mexico. Limnetica 2022, 41, 1. [Google Scholar] [CrossRef]
  54. Alcocer, J.; Prado, B.; Mora, L.; Oseguera, L.A.; Caballero, M. Sediment characteristics of tropical, karst lakes and their relationship with watershed topography, lake morphometry, and human activities. J. Paleolimnol. 2021, 66, 333–353. [Google Scholar] [CrossRef]
  55. Fernández, R.; Alcocer, J.; Oseguera, L.A. Microcystins presence threatens the ecosystem health of a tropical National Park: Lagunas de Montebello, Chiapas. Rev. Bras. Bot. 2021, 44, 207–212. [Google Scholar] [CrossRef]
  56. Pérez, L.; Lorenschat, J.; Massaferro, J.; Pailles, C.; Sylvestre, F.; Hollwedel, W.; Brandorff, G.-O.; Brenner, M.; Islebe, G.; del Socorro Lozano, M.; et al. Bioindicators of climate and trophic state in lowland and highland aquatic ecosystems of the Northern Neotropics. Rev. Biol. Trop. 2013, 61, 603–644. [Google Scholar] [CrossRef] [Green Version]
  57. Rodrigues-Cabral, C.; Diniz, L.P.; da Silva, A.J.; Fonseca, G.; Silva Carneiro, L.; de Melo Júnior, M.; Caliman, A. Zooplankton species distribution, richness and composition across tropical shallow lakes: A large scale assessment by biome, lake origin, and lake habitat. Ann. Limnol. -Int. J. Limnol. 2020, 56, 25. [Google Scholar] [CrossRef]
  58. Suárez-Morales, E.; Gutiérrez-Aguirre, M.A.; Walsh, E.J. Freshwater Copepoda (Crustacea) from the Chihuahuan Desert with Comments on Biogeography. Southwest. Nat. 2010, 55, 525–531. [Google Scholar] [CrossRef]
  59. Mercado-Salas, N.F.; Khodami, S.; Kihara, T.C.; Elías-Gutiérrez, M.; Arbizu, P.M. Genetic structure and distributional patterns of the genus Mastigodiaptomus (Copepoda) in Mexico, with the de-scription of a new species from the Yucatan Peninsula. Arthropod Syst. Phylogeny 2018, 76, 487–507. [Google Scholar]
  60. Fernández, R.; Oseguera, L.A.; Alcocer, J. Zooplankton biodiversity in tropical karst lakes of southeast Mexico, Chiapas. Rev. Mex. Biodivers. 2020, 91, 913184. [Google Scholar] [CrossRef]
  61. Brooks, J.L.; Dodson, S.I. Predation, Body Size, and Composition of Plankton: The effect of a marine planktivore on lake plankton illustrates theory of size, competition, and predation. Science 1965, 150, 28–35. [Google Scholar] [CrossRef]
  62. He, H.; Jin, H.; Jeppesen, E.; Li, K.; Liu, Z.; Zhang, Y. Fish-mediated plankton responses to increased temperature in subtropical aquatic mesocosm ecosystems: Implications for lake management. Water Res. 2018, 144, 304–311. [Google Scholar] [CrossRef]
  63. Lemmens, P.; Declerck, S.A.; Tuytens, K.; Vanderstukken, M.; De Meester, L. Bottom-up effects on biomass versus top-down effects on identity: A multiple-lake fish community manipulation experiment. Ecosystems 2018, 21, 166–177. [Google Scholar] [CrossRef]
  64. Pace, M.L.; Orcutt, J.D. The relative importance of protozoans, rotifers, and crustaceans in a freshwater zooplankton community1. Limnol. Oceanogr. 1981, 26, 822–830. [Google Scholar] [CrossRef] [Green Version]
  65. Li, Y.; Xie, P.; Zhang, J.; Tao, M.; Deng, X. Effects of filter-feeding planktivorous fish and cyanobacteria on structuring the zooplankton community in the eastern plain lakes of China. Ecol. Eng. 2017, 99, 238–245. [Google Scholar] [CrossRef]
  66. Gliwicz, M.Z. Predation and the evolution of vertical migration in zooplankton. Nature 1986, 320, 746–748. [Google Scholar] [CrossRef]
  67. Sikora, A.; Dawidowicz, P. Do the presence of filamentous cyanobacteria and an elevated temperature favor small-bodied Daphnia in interspecific competitive interactions? Fundam. Appl. Limnol. 2014, 185, 307–314. [Google Scholar] [CrossRef]
  68. Gilbert, J.D.; De Vicente, I.; Ortega, F.; Jiménez-Melero, R.; Parra, G.; Guerrero, F. A comprehensive evaluation of the crustacean assemblages in southern Iberian Mediterranean wetlands. J. Limnol. 2014, 74, 169–181. [Google Scholar] [CrossRef] [Green Version]
Figure 1. The “Lagunas de Montebello” National Park Lake District, Chiapas, Mexico. (The lakes included in this study are indicated). (Lake names abbreviations as in Table 1). (The black shape in the upper right inset map identifies the Río Grande de Comitán basin).
Diversity 14 00564 g001
Figure 2. Singularity of the microcrustacean taxa in the lakes of the “Lagunas de Montebello” National Park, Chiapas. (SMC: total microcrustacean assemblage, SCAL: calanoid copepods, SCYC: cyclopoid copepods, CCLAD: cladocerans).
Diversity 14 00564 g002
Figure 3. Chlorophyll-a concentration (Chl-a) (average + standard deviation), and microcrustaceans abundance and biomass in the cold/dry (a,c,e) and the warm/rainy (b,d,f) seasons, in the studied lakes of the “Lagunas de Montebello” National Park, Chiapas. (Lake names abbreviations as in Table 1).
Diversity 14 00564 g003aDiversity 14 00564 g003b
Figure 4. Microcrustaceans contribution by size-classes to abundance and biomass in the cold/dry (a,c) and the warm/rainy (b,d) seasons in the studied lakes of the “Lagunas de Montebello” National Park, Chiapas. [S: small (400–740 µm), M: medium (750–950 µm), L: large (1000–1400 µm)]. (Lake names abbreviations as in Table 1).
Diversity 14 00564 g004
Figure 5. Heatmaps based on abundance (a) and biomass (b) values of the microcrustacean taxa in the studied lakes of the “Lagunas de Montebello” National Park, Chiapas. (Lake names abbreviations as in Table 1).
Diversity 14 00564 g005
Figure 6. Canonical correspondence analysis (CCA) triplots of the microcrustacean taxa in the studied lakes of the “Lagunas de Montebello” National Park, Chiapas. (a) based on microcrustacean abundance, and (b) based on microcrustacean biomass. (Lake names abbreviations as in Table 1 and taxa names abbreviations as in Table 4 and CL = 9, 12–14; CM = 10, 11, 15–17, 19; CS = 11, 15–21). The arrows represent the environmental constraints (T = Temperature, DO = Dissolved oxygen, ZEU = Euphotic depth, Chl-a = Chlorophyll a concentration, K25 = Electrical Conductivity).
Diversity 14 00564 g006
Table 1. Morphometric parameter and thermal types of the studied Lakes of the “Lagunas de Montebello” National Park, Chiapas. (ZMAX: maximum depth, ZMEAN: mean depth, A: surface area, LMAX: maximum length). (According to [29]).
LakeZMAXZMEANALMAXThermal Type
(m)(m)(ha)(km)
BalanteticBAL31.713.6814Warm polymictic
ChajchajCHA125.39.2448Warm polymictic
San LorenzoLZO6711.8181.33091Warm monomictic
Bosque AzulBOS587.152.51332Warm monomictic
La EncantadaENC8927.58.2385Warm monomictic
San JoséJOS3010.360.61761Warm monomictic
EsmeraldaESM73.61.1140Warm polymictic
EnsueñoENS 3521.62.7220Warm monomictic
Agua TintaTIN2414.73210Warm monomictic
MontebelloMON4512.396.21687Warm monomictic
Cinco LagosCIN16242.523.7817Warm monomictic
PojojPOJ19835.243.71057Warm monomictic
KichailKIC229.512.5582Warm monomictic
TziscaoTZI8628.9306.63201Warm monomictic
PatianúPAT2610.83.4262Warm monomictic
YalalushYAL239.911.5539Warm polymictic
Dos LagosDOS4225.25.2336Warm polymictic
Table 2. Main physicochemical variables and chlorophyll-a concentration of the studied lakes of the “Lagunas de Montebello” National Park, Chiapas. (x: average, s.d.: standard deviation, ZEU: euphotic zone, T: temperature, DO: dissolved oxygen concentration, pH; potential of hydrogen, K25: electrical conductivity, Chl-a: chlorophyll-a concentration).
VariableTrophicAnnualMixingStratification
Statusxs.d.xs.d.xs.d.
ZEU (m)Eu4.12.72.61.72.61.5
Oligo21.19.220.69.022.39.7
T (°C)Eu18.881.3518.341.3619.790.87
Oligo19.802.0418.150.6421.461.53
DO (mg L−1)Eu5.645.526.786.853.732.02
Oligo5.601.496.371.264.831.33
pH (pH units)Eu8.050.428.260.417.700.03
Oligo8.000.368.250.247.760.30
K25 (μS cm−1)Eu685224748242579177
Oligo308187303194313189
Chl-a (μg L−1)Eu56.748.979.048.419.519.5
Oligo0.70.30.60.30.70.4
Table 3. Taxonomic composition of the microcrustacean and their distribution among the studied lakes of the “Lagunas de Montebello” National Park, Chiapas. (Lake names abbreviations as in Table 1). (Green identifies impacted/eutrophic lakes, while blue non-impacted/oligotrophic lakes).
Copepoda TaxaBALCHALZOBOSENCJOSESMENSTINMONCINPOJKICTZIPATYALDOS
Calanoida
Mastigodiaptomus montezumae XXX
Mastigodiaptomus nesusXX XX XXXXXXXXXX
Mastigodiaptomus maya X X X XXXXX X X
Leptodiaptomus cuauhtemociX XXXX XXXXXXX X
Aglodiaptomus clavipes X
Cylopoida
Macrocyclops albidus X
Macrocyclops fuscus X
Ectocyclops sp. X X
Thermocyclops tenuis XXX X
Thermocyclops crasssus X X X
Thermocyclops inversus XXXX XX X XXX
Mesocyclops aspericornis X XX
Mesocyclops longisetus X X
Diacyclops puuc X
Mesocyclops thermocyclopoidesX
Mesocyclops edaxX X X XXX XX
Microcyclops dubitabilis X X XX
Microcyclops ceibaensis XXXX XX XX
Apocyclops panamensis XX
Eucyclops tziscao X
Tropocyclops prasinus prasinus X X XX X
Cladocera TaxaBALCHALZOBOSENCJOSESMENSTINMONCINPOJKICTZIPATYALDOS
Daphnia ambigua X X X
Daphnia cheraphila X X
Daphnia cf. galeata X X X XX
Daphnia gessneri X XXX XXX
Daphnia cf. hyalina X
Daphnia obtusaX XXX X
Eubosmina tubicenX XXXXX X XX XX X
Ceriodaphnia dubiaX XXXX XX X XXX
Moina micruraXXX
MoinodaphniaX X
Diaphanosoma XXXXXXXXX XX
MicrocrustaceaBALCHALZOBOSENCJOSESMENSTINMONCINPOJKICTZIPATYALDOS
Total Copepoda46798535666576545
Total Cladocera51444632334445424
Grand total971113121167991091111969
Table 4. Microcrustacean taxa that contributed the most to dissimilarity among the lakes of the “Lagunas de Montebello” National Park, Chiapas, during the mixing (cold/dry) and stratification (warm/rainy) seasons. (Diss. = contribution to dissimilarity, Cum. = cumulative contribution to dissimilarity). (Lake names abbreviations as in Table 1).
Mixing (Cold/Dry)
CopepodaDiss. (%)Cum. (%)Lakes
Microcyclops ceibaensis10.1110.11CHA, LZO, BOS, ENC, ESM, ENS
Mastigodiaptomus maya9.5219.64LZO, ESM, TIN, MON, CIN, POJ, KIC, PAT, DOS
Leptodiaptomus cuauhtemoci8.7028.33LZO, ENC, ENS, TIN, MON, CIN, POJ, KIC, TZI, YAL
Mesocyclops aspericornis8.4036.73CHA, BOS, ENC
Thermocyclops tenuis8.3245.05CHA, LZO, BOS, DOS
Mastigodiaptomus nesus8.1853.23BAL, CHA, JOS, ENS, TIN, MON, CIN, POJ, KIC, TZI, PAT, YAL, DOS
Mesocyclops edax8.1261.35BAL, ENC, TIN, POJ, KIC, TZI, YAL, DOS
Mastigodiaptomus montezumae8.0869.43LZO, BOS, ENC
Thermocyclops inversus6.5775.99BOS, ENC, JOS, PAT, DOS
Apocyclops panamensis6.0382.02CHA, LZO
CladoceraDiss. (%)Cum. (%)Lakes
Diaphanosoma sp.16.6816.68ENC, JOS, ESM, ENS, TIN, MON, CIN, POJ, TZI, PAT
Daphnia obtusa16.5133.19BAL, LZO, BOS, ENC, KIC
Eubosmina tubicen14.1447.33BAL, LZO, BOS, ENC, ESM, TIN, POJ, DOS
Ceriodaphnia dubia12.1459.47BAL, BOS, ENC, JOS, ENS, TIN, CIN
Daphnia gessneri11.8771.34CIN, POJ, KIC, PAT, YAL, DOS
Moina micrura10.5181.85BAL, CHA
Stratification (warm/rainy)
CopepodaDiss. (%)Cum. (%)Lakes
Microcyclops ceibaensis10.0810.08CHA, LZO, BOS, ENC, ENS, MON, CIN
Mastigodiaptomus maya9.8019.87ENC, ESM, TIN, MON, CIN, POJ, KIC, PAT, DOS
Thermocyclops inversus9.0728.94BOS, ESM, TIN, MON, POJ, PAT, YAL, DOS
Mastigodiaptomus montezumae9.0638.00LZO, BOS, ENC
Leptodiaptomus cuauhtemoci7.7445.74LZO, ENC, ENC, JOS, ENS, MON, CIN, POJ, KIC, TZI, YAL
Mesocyclops edax7.7253.46BAL, ENC, TIN, KIC, YAL, DOS
Mastigodiaptomus nesus6.6060.06BAL, CHA, ENC, JOS, ENS, TIN, MON, CIN, POJ, KIC, TZI, PAT, YAL, DOS
Apocyclops panamensis5.8365.88CHA, LZO
Thermocyclops tenuis5.8371.71BAL, LZO
Tropocyclops prasinus prasinus4.6776.38BOS, JOS, KIC
Mesocyclops thermocyclopoides4.1580.53BAL
CladoceraDiss. (%)Cum. (%)Lakes
Moina micrura17.1117.11BAL, CHA, LZO
Diaphanosoma sp.14.6231.73BOS, ENC, JOS, ENS, TIN, MON, CIN, POJ, TZI, PAT, YAL
Daphnia gessneri13.5845.31JOS, CIN, POJ, KIC, PAT, YAL, DOS
Ceriodaphnia dubia12.8958.2BAL, LZO, BOS, ENC, ENS, TIN, CIN, KIC, TZI, PAT
Daphnia obtusa12.7970.99BAL, BOS, ENC, KIC
Eubosmina tubicen12.1983.18BAL, LZO, BOS, ENC, JOS, ESM, TIN, CIN, TZI, PAT, DOS
Table 5. Microcrustacean sizes, size-classes, and biomass distribution per taxon in the studied lakes of the “Lagunas de Montebello” National Park, Chiapas. (L: large 1000–1400 µm, M: medium 750–950 µm, S: small 400–740 µm, DW: dry weight, ♂: males, ♀: females).
Nr.TaxaSizeSizeBiomass (µg DW L−1)
(µm)ClassOvigerous ♀
1Mastigodiaptomus montezumae1267 ± 82L4.43.84.9
2Mastigodiaptomus nesus1133 ± 108L5.45.77.8
3Mastigodiaptomus maya1833 ± 234L34.134.1
4Leptodiaptomus cuauhtemoci1067 ± 208L4.84.8
5Aglodiaptomus clavipes2000 ± 255L34.134.1
6Macrocyclops albidus1300 ± 123L 6.6
7Macrocyclops fuscus1400 ± 267L 6.6
8Ectocyclops sp. 1000 ± 34L 6.6
9Thermocyclops tenuis1100 ± 156L 6.6
10Thermocyclops crasssus830 ± 53M 6.6
11Thermocyclops inversus645 ± 67S—M2.0–3.12.0–3.12.9
12Mesocyclops aspericornis1000 ± 80L 6.6
13Mesocyclops longisetus1050 ± 71L 6.6
14Diacyclops puuc1000 ± 50L 6.6
15Mesocyclops thermocyclopoides720 ± 57S—M2.0–3.12.0–3.12.9
16Mesocyclops edax750 ± 212S—M2.0–3.12.0–3.12.9
17Microcyclops dubitabilis613 ± 59S—M2.0–3.12.0–3.12.9
18Microcyclops ceibaensis457 ± 79S2.02.0
19Apocyclops panamensis610 ± 127S—M2.0–3.12.0–3.12.9
20Eucyclops tziscao430 ± 54S2.02.0
21Tropocyclops prasinus prasinus450 ± 40S2.02.0
22Daphnia ambigua700–1300L 7.38.7
23Daphnia cheraphila1000–1500L 7.38.7
24Daphnia cf. galeata800–1800L 7.38.7
25Daphnia gessneri900–1550L 7.38.7
26Daphnia cf. hyalina1000–1500L 7.38.7
27Daphnia obtusa750–1850L 7.38.7
28Eubosmina tubicen420 ± 50S 2.8
29Ceriodaphnia dubia450–780S 1.5
30Moina micrura sp.800 ± 100M 2.3
31Moinodaphnia sp.590 ± 96S 1.7
32Diaphanosoma sp.790 ± 124M 2.9
33Cyclopoid copepodite273 ± 17S 0.8
34Large calanoid copepodite656 ± 77S 2.2
Small calanoid copepodite439 ± 78S 1.8
35Large nauplii278 ± 46S 2.0
Small nauplii105 ± 21S 0.4
36Daphnia juvenile450–750S 2.3
Publisher’s Note: MDPI stays neutral with regard to jurisdictional claims in published maps and institutional affiliations.

