Article

Evaluation of Climate Change Impacts on the Global Distribution of the Calliphorid Fly Chrysomya albiceps Using GIS

1
Department of Entomology, Faculty of Science, Ain Shams University, Cairo 11566, Egypt
2
Biology Department, College of Science, Princess Nourah bint Abdulrahman University, Riyadh 11671, Saudi Arabia
3
Applied Biotechnology Program, Faculty of Science, Ain Shams University, Cairo 11566, Egypt
*
Authors to whom correspondence should be addressed.
Diversity 2022, 14(7), 578; https://doi.org/10.3390/d14070578
Submission received: 6 June 2022 / Revised: 13 July 2022 / Accepted: 14 July 2022 / Published: 20 July 2022
(This article belongs to the Special Issue Modeling the Ecology and Evolution of Biodiversity)

Abstract

:
Climate change is expected to influence the geographic distribution of many taxa, including insects. Chrysomya albiceps is one of the most pervasive calliphorid fly with apparent ecological, forensic, and medical importance. However, the global habitat suitability is varied due to climate change. Models that forecast species spatial distribution are increasingly being used in wildlife management, highlighting the need for trustworthy techniques to assess their accuracy. So, we used the maximum entropy implemented in Maxent to predict the current and future potential global geographic distribution of C. albiceps and algorithms of DIVA-GIS to confirm the predicted current model. The Maxent model was calibrated using 2177 occurrence records. Based on the Jackknife test, four bioclimatic variables along with altitude were used to develop the final models. For future models, two representative concentration pathways (RCPs), 2.6 and 8.5, for 2050 and 2070 were used. The area under curve (AUC) and true skill statistics (TSS) were used to evaluate the resulted models with values equal to 0.92 (±0.001) and 0.7, respectively. Two-dimensional niche analysis illustrated that the insect can adapt to low and high temperatures (9 °C to 27 °C), and the precipitation range was 0 mm to 2500 mm. The resulted models illustrated the global distribution of C. albiceps with alteration to its distribution in the future, especially on the Mediterranean coasts of Europe and Africa, Florida in the USA, and the coasts of Australia. Such predicted shifts put decision makers against their responsibilities to prevent destruction in economic, medical, and ecological sectors.

1. Introduction

Significant changes in the climate have had a divergent effect on biodiversity in the recent decades [1]. Climate change, commonly known as global warming, is driven by greenhouse gases generated as a result of human activity, especially burning fossil fuels. The average temperature is predicted to rise from 2 to 4 °C over the next 50 years due to the increase in CO2 concentration in the earth’s atmosphere [2]. The effects of such changes in earth temperatures are unpredictable and random. The geographical range of insect species will be affected by climate change and this coincides with a rise in several problems in agricultural, medical, and veterinary sectors [3]. The resurgence of the medical and veterinary importance of insect species becomes a more and more serious danger, especially with future climate change scenarios [3,4]. The reshaping of species distributed throughout the world will surely produce serious ecological and economic crises [5]. So, recently, developing models to predict such changes has become a decisive issue for medical and veterinary entomologists to assess the impact of such changes on human societies, especially for important insect families, such as Calliphoridae [5,6].
Calliphoridae is one of the most common and interesting families of Diptera [7]. Its flies are familiar as blowflies, bluebottles, and greenbottles; with about 1500 species, the family comprises almost 8% of the calyptrate flies that occupy all continents except Antarctica [8]. Moreover, it includes a variety of lifestyle species classified throughout several subfamilies, such as the Calliphorinae, Chrysomyinae, Luciliinae, Ameniinae, Bengaliinae, Helicoboscinae, Polleniinae, Melanomyinae, Rhiniinae, Mesembrinellinae, and Toxotarsinae [9]. Most Calliphorid adults are oviparous, and some are larviparous, and either unilarviparous or multilarviparous. The adults are nectar feeders, while larvae have several feeding behaviors, such as saprophagy, hematophagy, coprophagy, and ectoparasitism [10].
Chrysomya albiceps is one of the most well-known species of family Calliphoridae. With a Holarctic distribution, it is an important fly with ecological, forensic, and medical importance. C. albiceps is a significant fly that parasitizes warm-blooded animals and produces facultative cutaneous myiasis in livestock, goats, donkey, sheep, camels, and humans [11,12]. Myiasis is a type of parasitism in which the fly larva (maggot) infects animal tissue, it is very widespread on our planet, especially in the tropical and subtropical regions [13]. In forensics, it is also common species found at crime scenes helping identify the unknown cadavers and determine postmortem intervals [14]. On the other hand, C. albiceps has ecological importance, as it helps in recycling elements in ecosystems by decomposing dead bodies [15]. The adults are good and effective pollinators that provide a good fruit set and increase yield for mango agriculture [16,17]. C. albiceps—with a wide distribution range—has adapted to several climatological conditions, but like any other biological unit, it will face dramatic changes in its geographical distribution due to climate change [18,19,20].
Now, the geographical information system (GIS) and its modeling tools help scientists in mapping the distributions of insect pests, develop models assessing the suitability of certain environmental conditions for sustaining specific insect species under current or future conditions, and presage where pest species might find suitable conditions and become established with economically important consequences [21]. Predictive models can be useful complements, including those developed to predict a pest’s spatial and temporal expansion after its first introduction into suitable habitats or estimate increasing economic losses to the livestock sector in addition to evaluating the status of important species, such as C. albiceps [22].
The present study aims to predict the global current and future distribution of C. albiceps using the species distribution modeling approach. In addition, it aims to answer the important question of how climate change will reshape the C. albiceps global range through the next 50 years using different climatological scenarios.

2. Materials and Methods

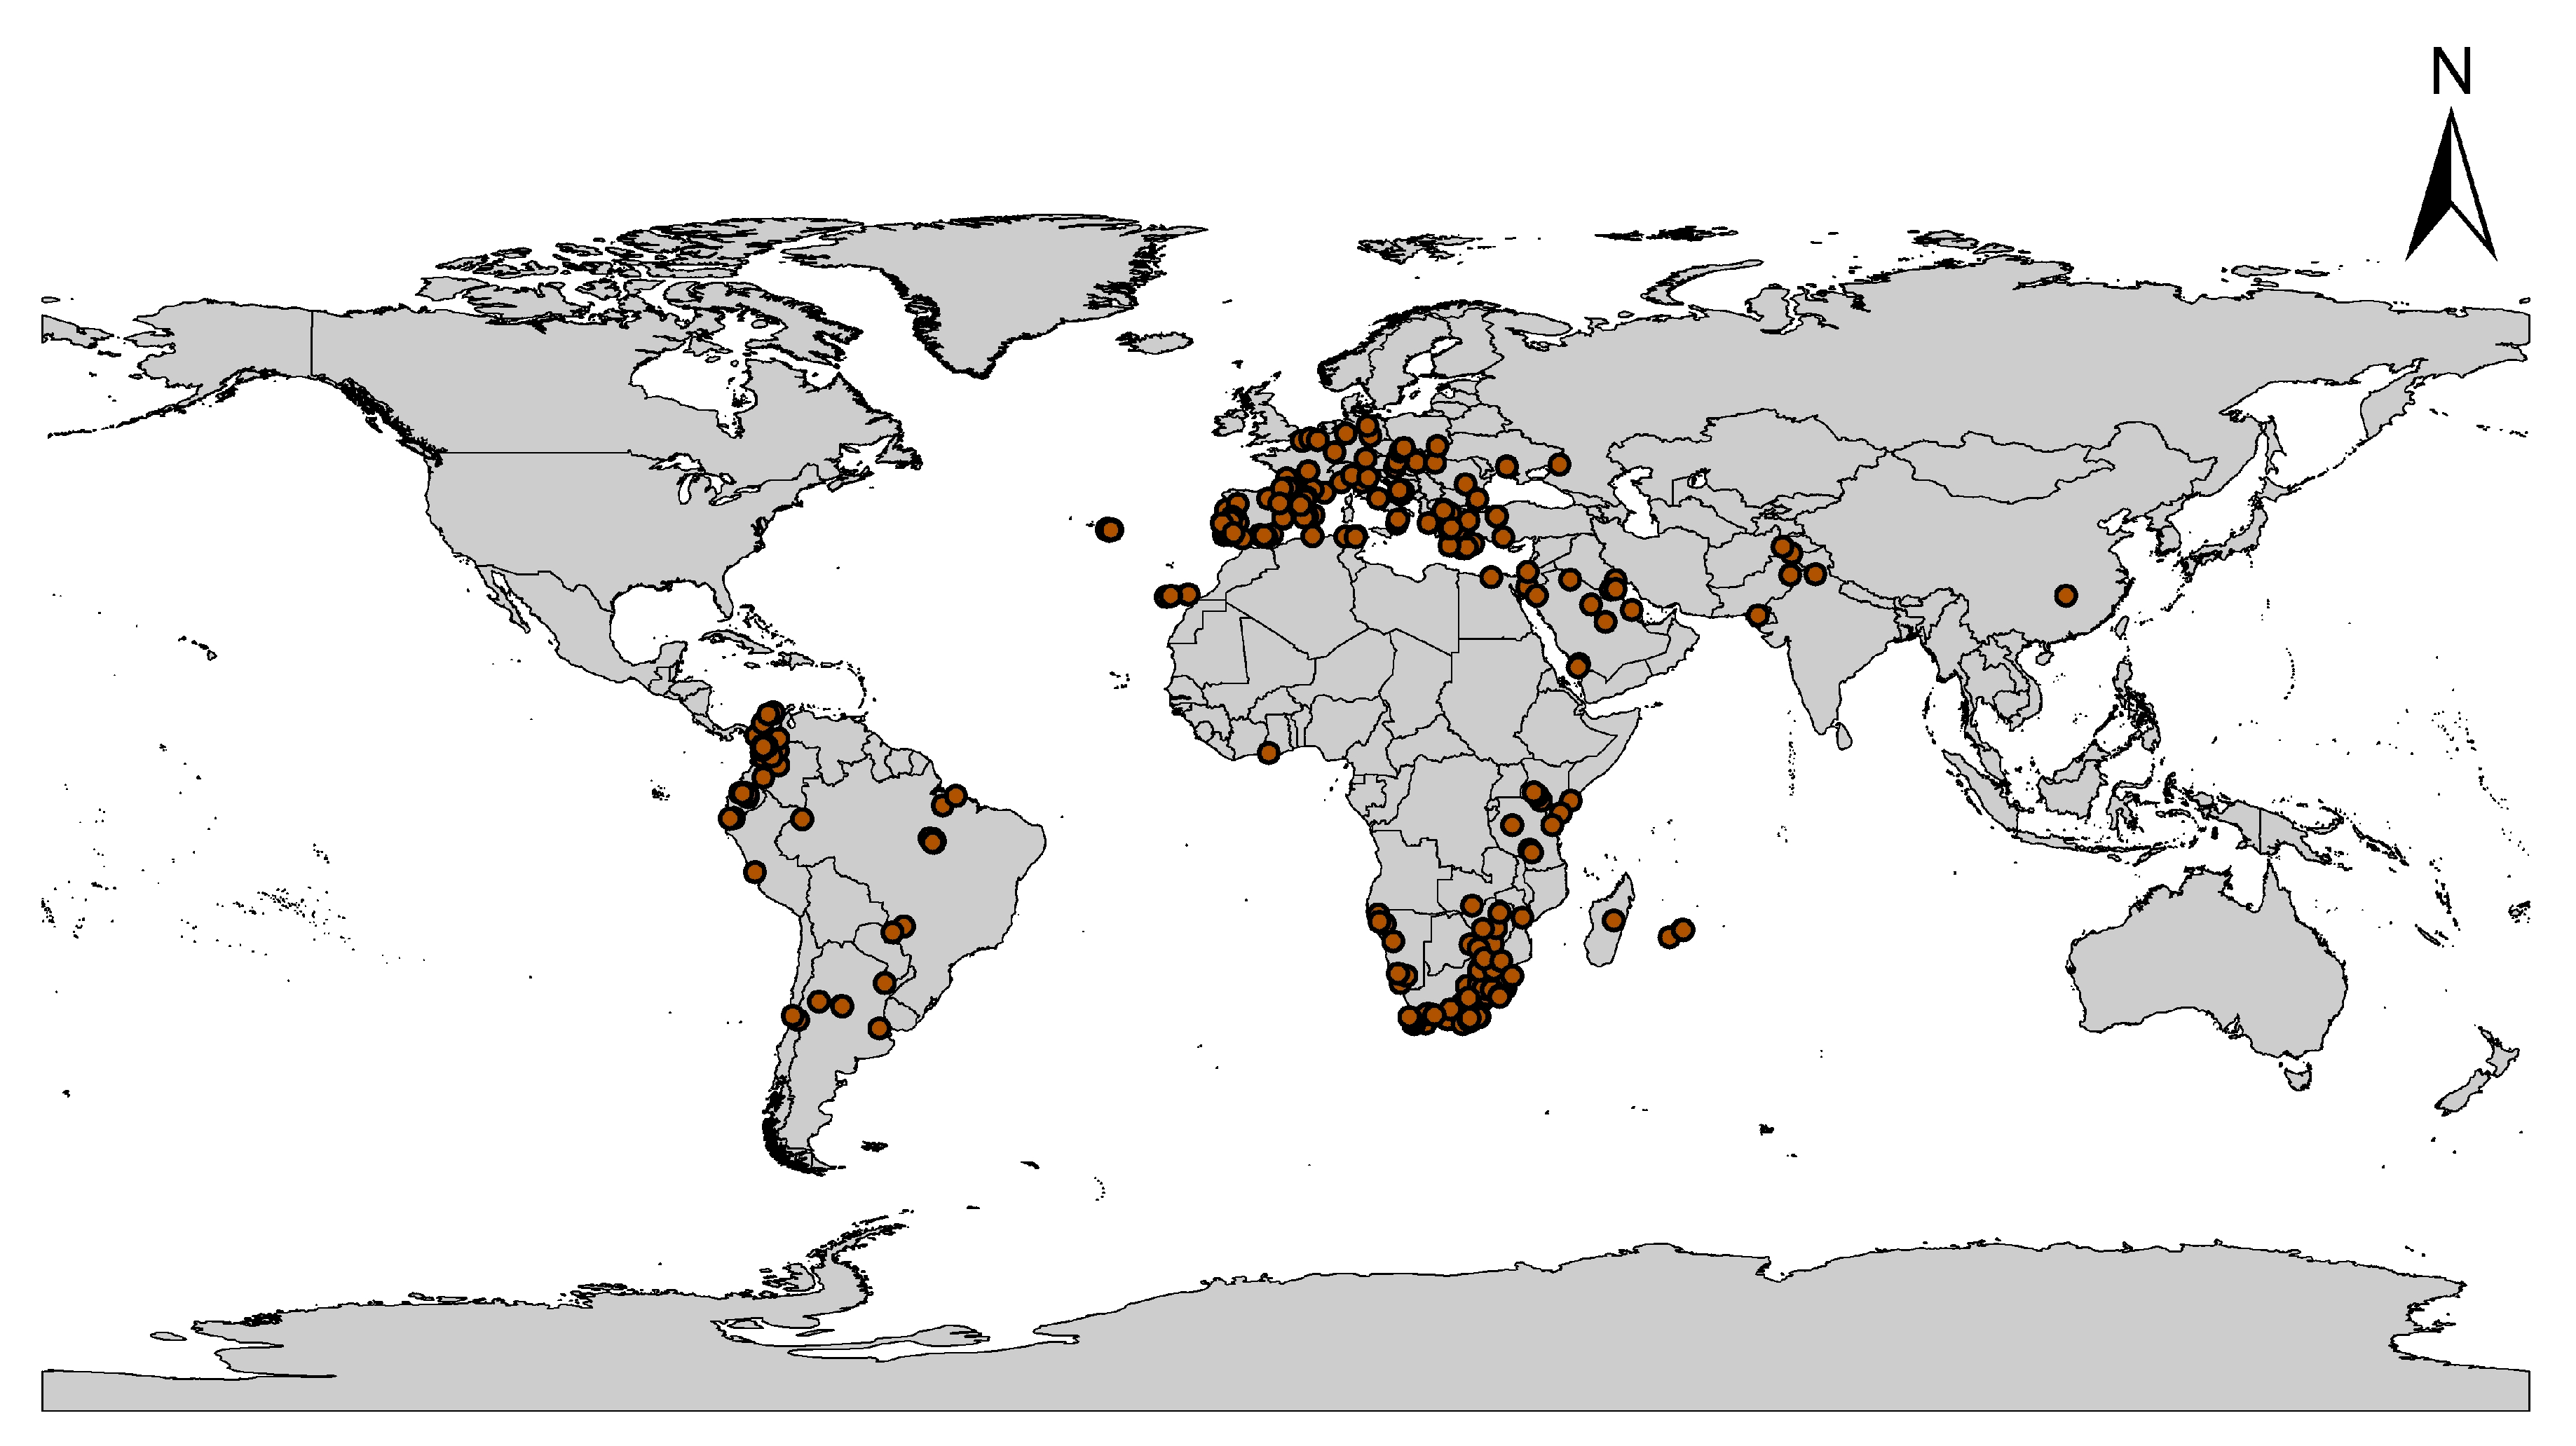
2.1. Global Occurrence Data of C. albiceps

Global C. albiceps occurrence records were collected from different digital databases including the Global Biological Information Facility (GBIF.org: https://doi.org/10.15468/dl.hbhmdq (accessed on 3 January 2022)), Project NOAH (Projectnoah.org (18 December 2021)), and I Naturalist (inaturalist.org (10 January 2022)). The occurrence data were about 3500 georeferenced points (Table S1). The data were subjected to three major filtration steps, which included removing duplicated data, cleaning records without latitudes and longitudes, and finally, spatial rarefication of points by distances [23,24]. The remaining records with 2177 points were converted to comma-delimited (CSV) files and utilized to predict the current and future global distribution of C. albiceps (Figure 1).

2.2. Environmental Variables

The WorldClim global climate database was used to derive a total of nineteen bioclimatic variables, as well as altitude with a spatial resolution of 2.5 arc-min or 5 km2 at the equator (accessed on December 2021). For current bioclimatic data, fifteen bioclimatic covariates were converted into the ASCII format using ArcGIS v 10.7. Bioclimatic layers 8–9 and 18–19 were omitted due to known spatial artifacts [24,25]. Pearson correlation coefficient was used to reduce the multicollinearity among bioclimatic variables at a value equal to (|r| ≥ 0.8) (Tables S2 and S3) [23,24,25]. This coefficient hinders the correlation among the covariates through the function of SDM Tools in ArcGIS 10.7 (universal tool; explore climate data; remove highly correlated variable) [26]. Finally, four bioclimatic covariates along with altitude were selected for further analysis. These covariates were Bio_1 (annual mean temperature), Bio_6 (min temperature of coldest month), Bio_7 (temperature annual range), and Bio_11 (mean temperature of coldest quarter), respectively. For future prediction, a parallel dataset of bioclimatic covariates was downloaded (from www.worldclim.org (accessed on 18 November 2020)) for two representative concentration pathways (RCPs 2.6 and 8.5) covering the two periods 2050 and 2070. These future data layers were also converted to the ASCII format via ArcGIS v 10.7 and used for future prediction [23,26].

2.3. Habitat Suitability Modeling

To anticipate the probable habitat distribution of C. albiceps under current and future climate change scenarios, we used two modeling techniques: the maximum entropy implemented in Maxent (version 3.4.1) and Clim. Model on DIVA-GIS software [27,28]. Both used presence-only data to forecast species distribution with pseudoabsence points [23,27]. For Maxent model the following settings were used: output format = logistic, random test percentage = 25, regularization multiplier = 1, maximum iterations = 10,000, convergence threshold = 0.0001, and maximum number of background points (as a pseudo-absence points) = 10,000. In our models, we used 75% of the occurrence records to train the model and 25% of the records to test it. Maxent is a popular model for estimating species distribution using only presence data, and it works well even with small sample sizes [29,30]. The Clim model of DIVA-GIS software was only used for the current status using the default setting in the software.

2.4. Model Interpretation and Evaluation

To evaluate the possible habitat range of C. albiceps, the model was run with four bioclimatic variables and 2177 presence-only locations. C. albiceps occurrence records were separated into two quasi-independent groups, with 75% and 25% of the data used for model training and testing, respectively [31]. To assess errors and compare model consistency, the model was fitted on the entire data set with tenfold cross-validation [23]. The area under curve (AUC) was used to evaluate the model’s performance. The AUC spans from 0.5 to 1.0, with values greater than 0.9 indicating excellent performance [32]. The jackknife test was used to discover key bioclimatic variables in assessing the target species’ potential spread [12]. Moreover, the accuracy of the projected models was estimated using true skill statistics (TSS) [23,24]. TSS values vary from −1 to 1, with positive values near 1 indicating a strong link between the predicted model and the distribution and negative values indicating a weak association [33]. Finally, all methodology steps have been established in the Research Laboratory of Biogeography and Wildlife Parasitology (RLBWP), Entomology Departments, Faculty of Science, Ain Shams University.

3. Results

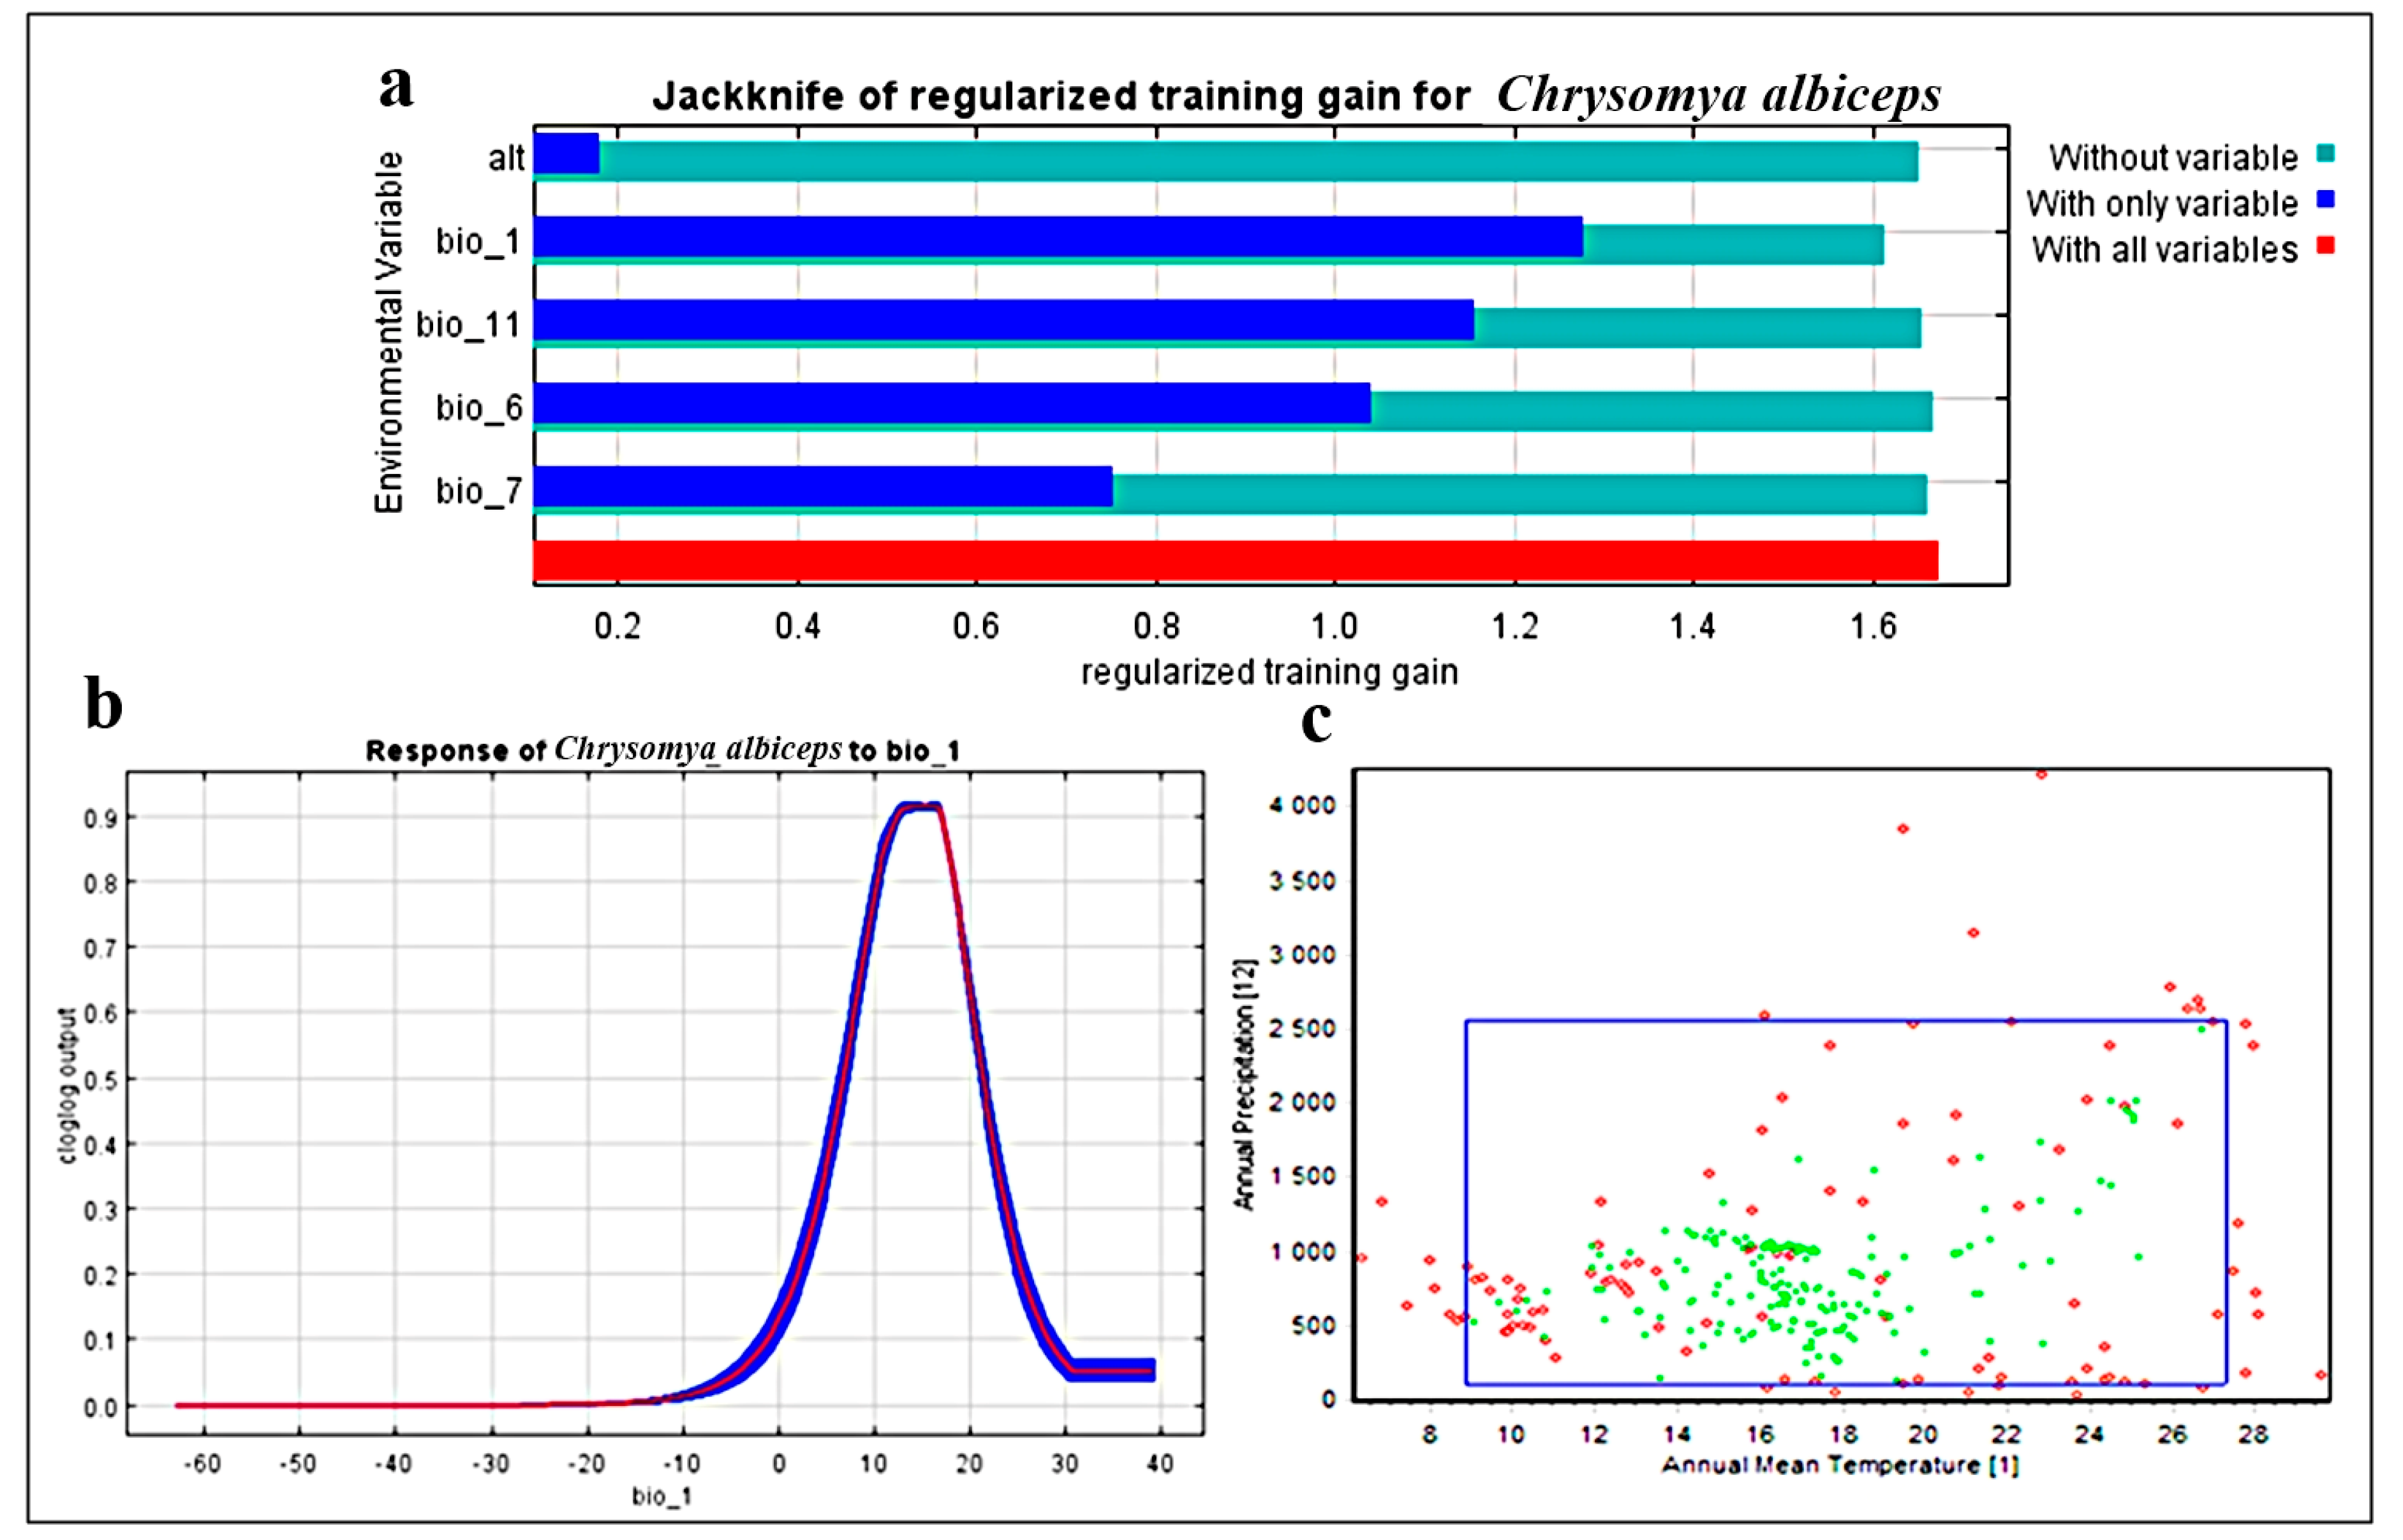
3.1. Model Performance and Effects of Environmental Variables

The Maxent model has a good accuracy in predicting the potential distribution of C. albiceps, with a mean test AUC value of 0.92. Bio_1 (annual mean temperature), Bio_6 (min temperature of coldest month), Bio_7 (temperature annual range), and Bio_11 (Mean temperature of coldest quarter) were the most relevant bioclimatic variables for C. albiceps prediction (Figure 2). These four variables were the most powerful predictors of C. albiceps distribution, accounting for 75% of the variance. Bio 1 had a strong predictive power according to the jackknife results (Figure 2). Furthermore, the true skill statistics (TSS) were used to test the model’s functionality, and the findings show that producing maps with a value of 0.7 is of high quality. TSS readings of more than 0.5 are generally considered acceptable.

3.2. Two-Dimensional Niche Analysis

For the most efficient bioclimatic variables employed in investigating this pest, the enveloped test was used to produce the two-dimensional niche of C. albiceps: annual mean temperature (bio 1) and annual precipitation (bio 12) (Figure 2c). The findings show that this insect is predicted to have a good ability to adapt to a variety of environmental temperatures. Its annual mean temperature ranges from 9 °C to 27 °C, with annual rainfall ranging from 0 mm to 2500 mm. These findings shed the light on the global distribution of this insect, which can be adapted in both extremely dry hot deserts and extremely cold rainy places.

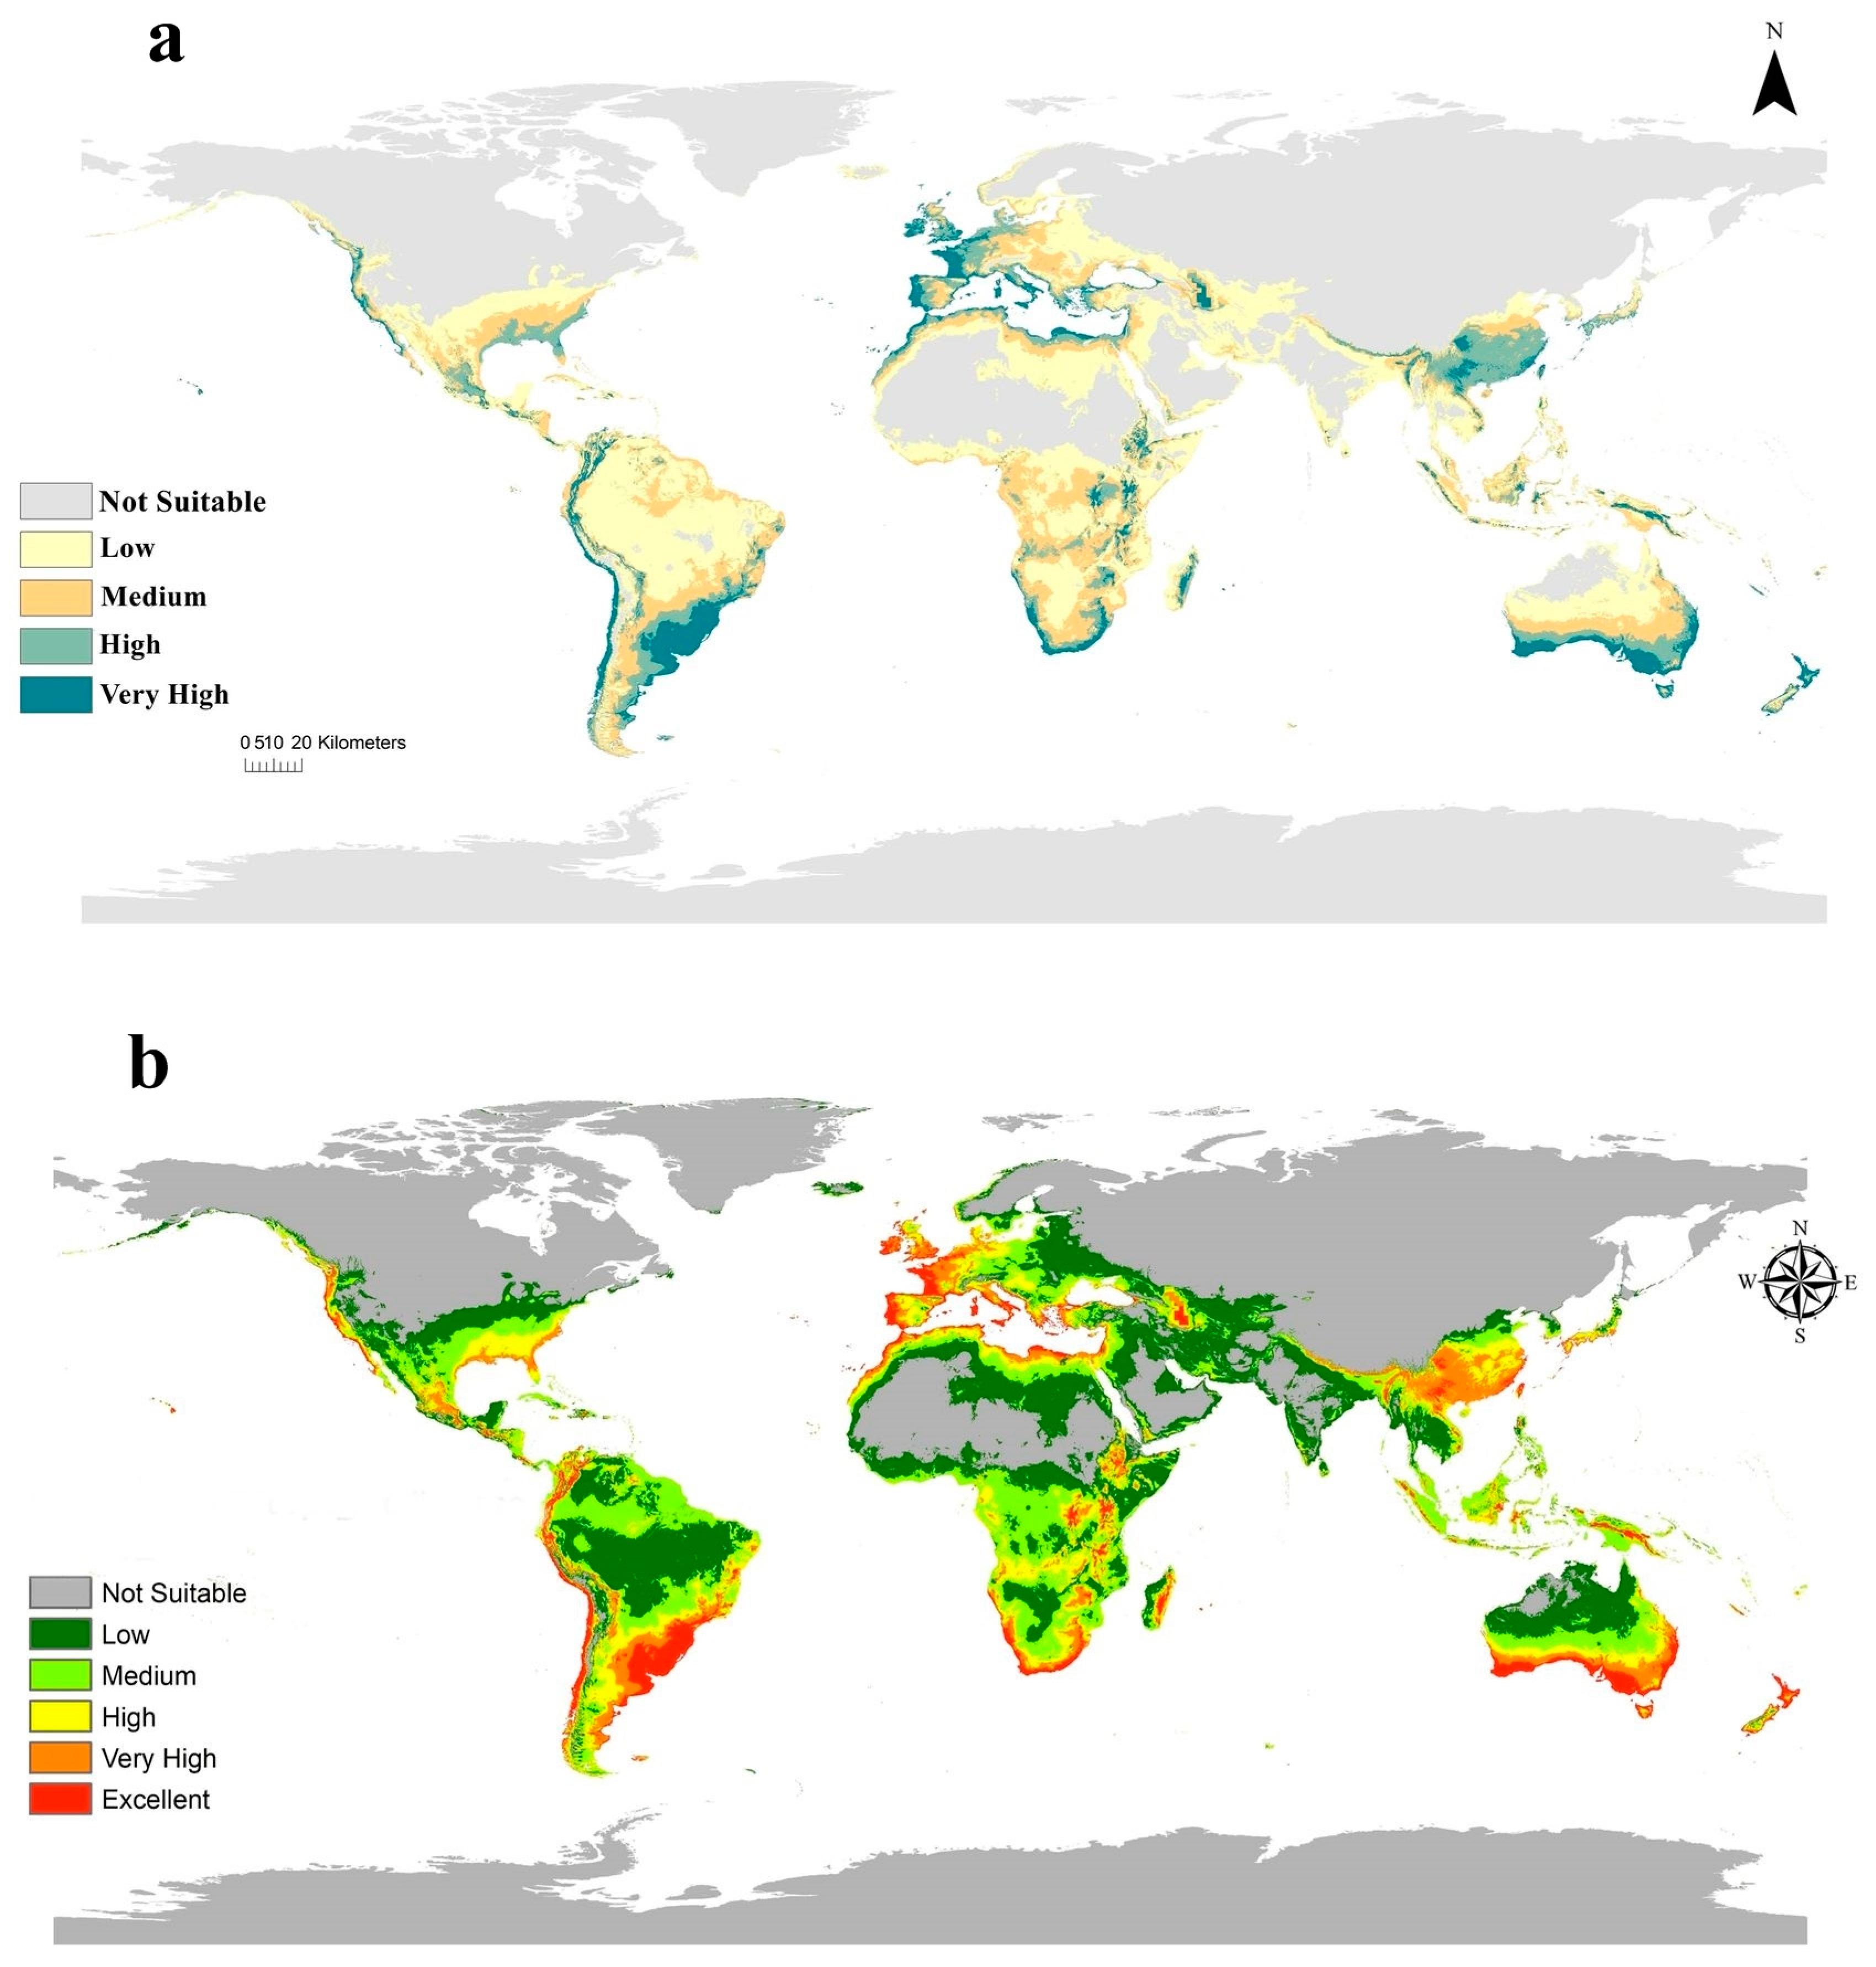
3.3. Current Potential Distribution of C. albiceps

The global potential spread of C. albiceps under current climatic conditions is presented in Figure 3. Both models resulted from Maxent, and DIVA showed compatible habitat suitability for C. albiceps spreading and agreed with the actual distribution of C. albiceps. This insect is considered to be a cosmopolitan species inhabiting all continents except Antarctica. In Africa, Maxent and DIVA models showed very high and excellent habitat suitability of C. albiceps in the counties of north Africa ranging from Egypt in the east to Morocco and west Saharan in the west. Besides, the Horn of Africa and southern Africa showed medium to very high suitability, whilst subtropical Africa illustrated no suitability in both models (Figure 3a,b). In Asia, China, North and South Korea, and southern parts of Japan exhibit very high and excellent suitability for the fly’s existence (Figure 3a,b). In Europe, the resulted models revealed very high and excellent suitability throughout major European lands, including Italy, France, Spain, Portugal, the Netherlands, England, Greece, and Turkey, while the northern territories of Europe showed low suitability (Figure 3a,b). In North America, the resulted current models indicated low suitability in C. albiceps distribution over its land except on the western coast of Canada and parts of the United States, the eastern–southern coast of the Mexican Gulf showed very high and excellent suitability. In South America, Brazil, Uruguay, and Chile illustrated very high suitability in the resulted models (Figure 3a,b). Finally, northern Australia appeared to have low suitability, but southern parts of Australia, including New South Wales, Sydney, and Melbourne in Victoria showed very high suitability, meanwhile, New Zealand showed very high suitability (Figure 3a,b).

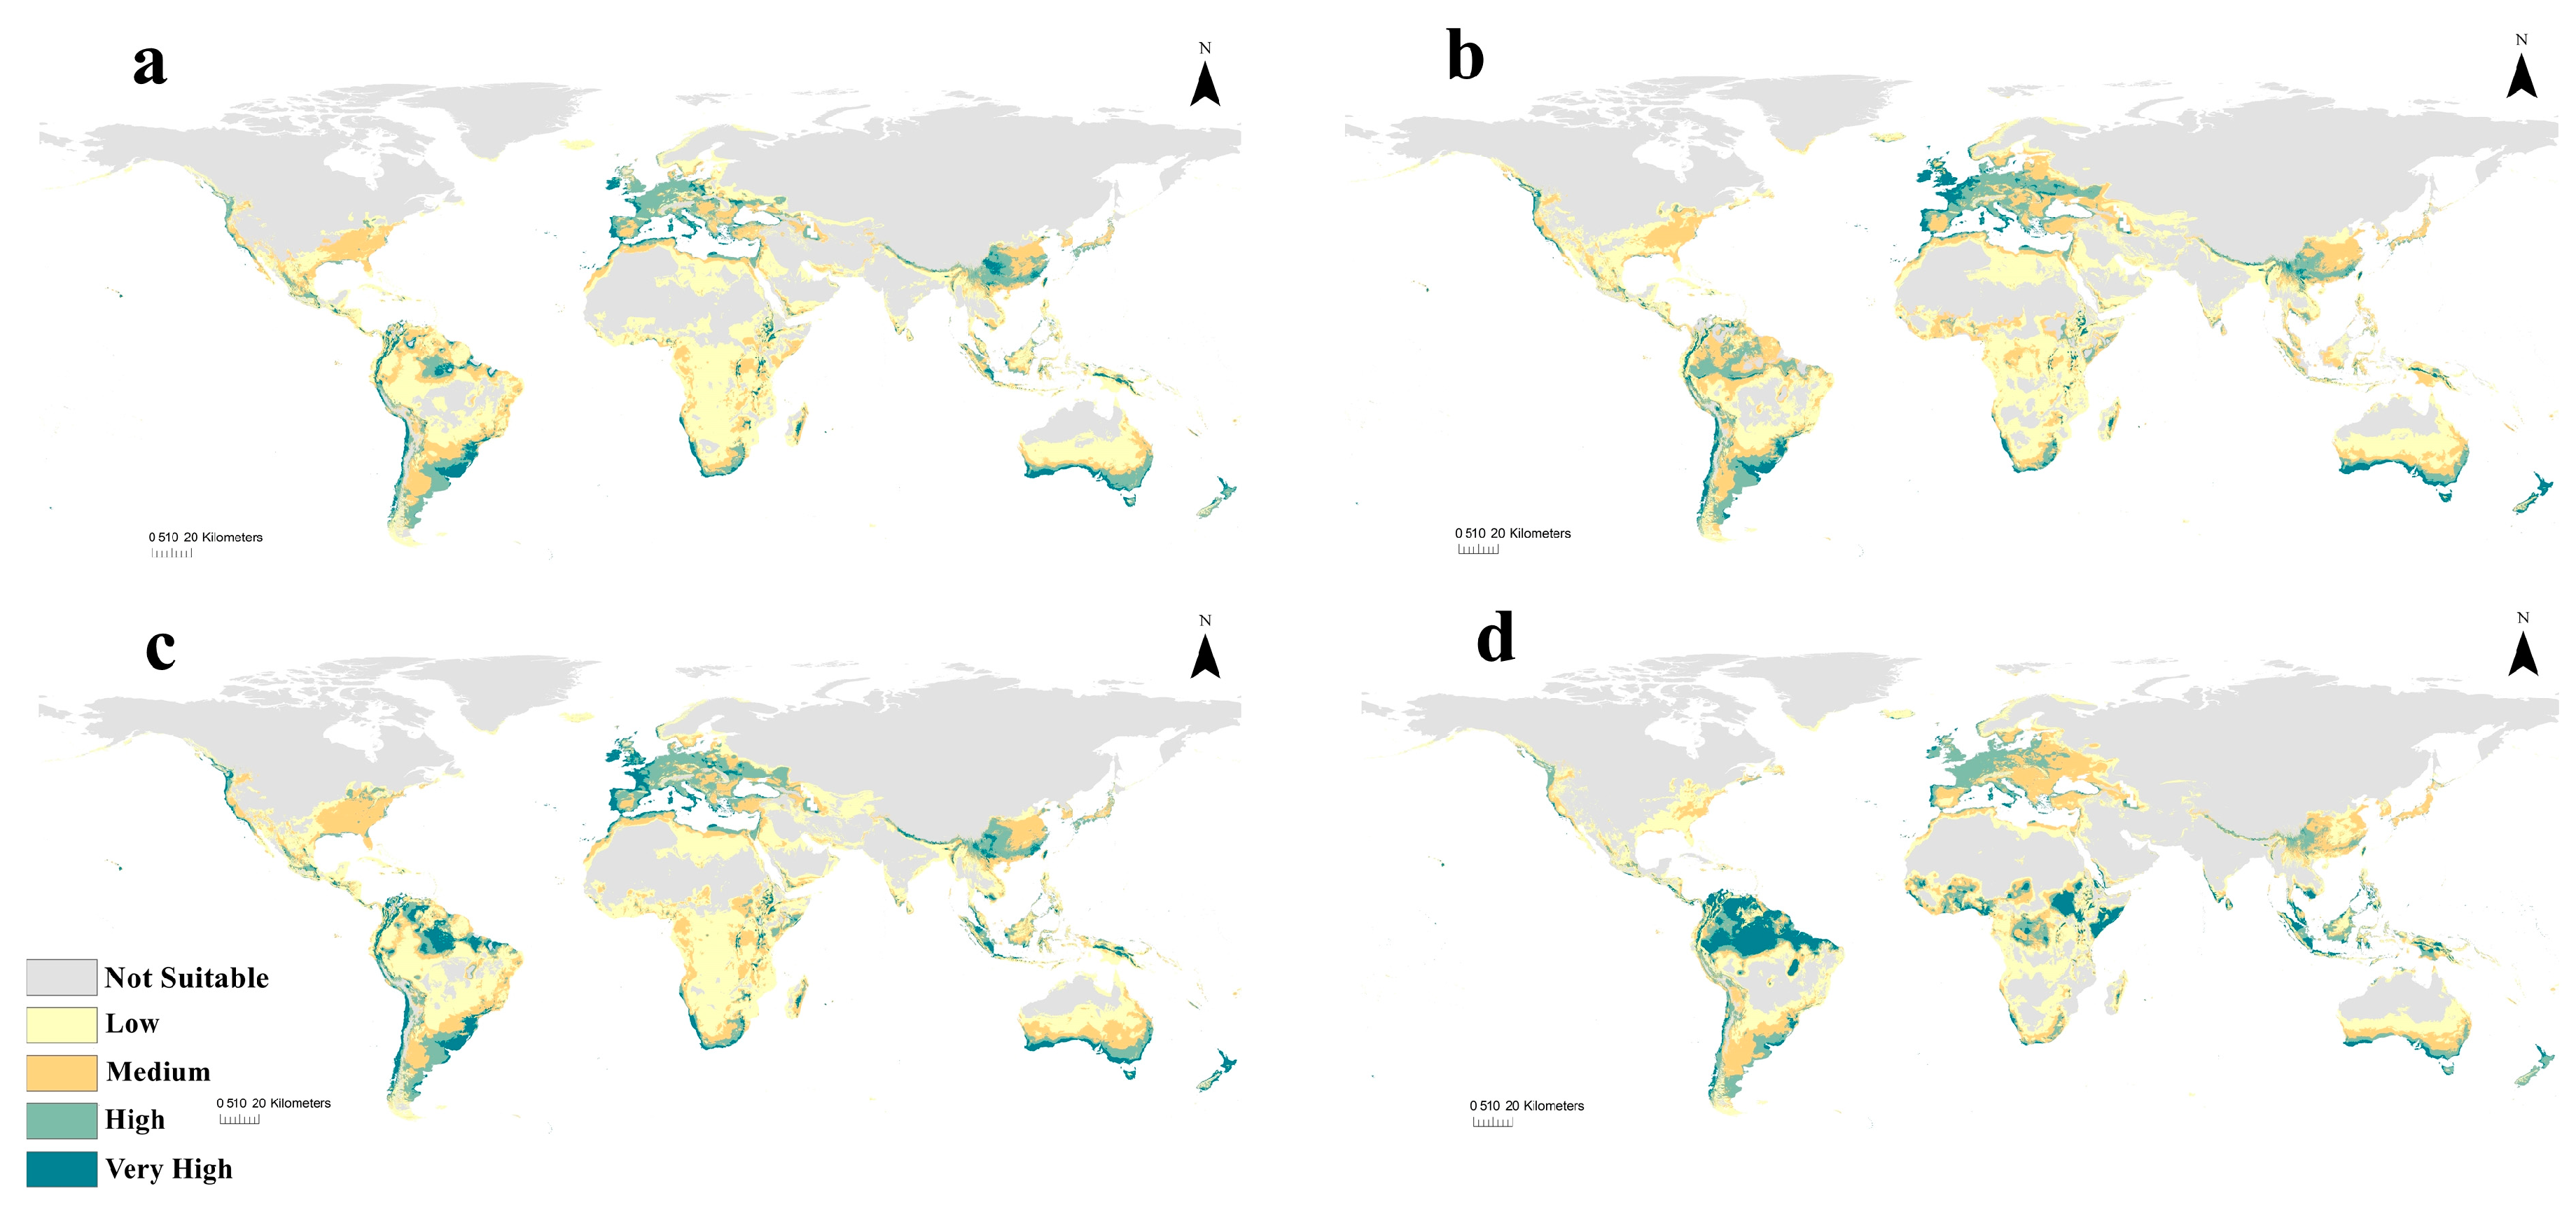
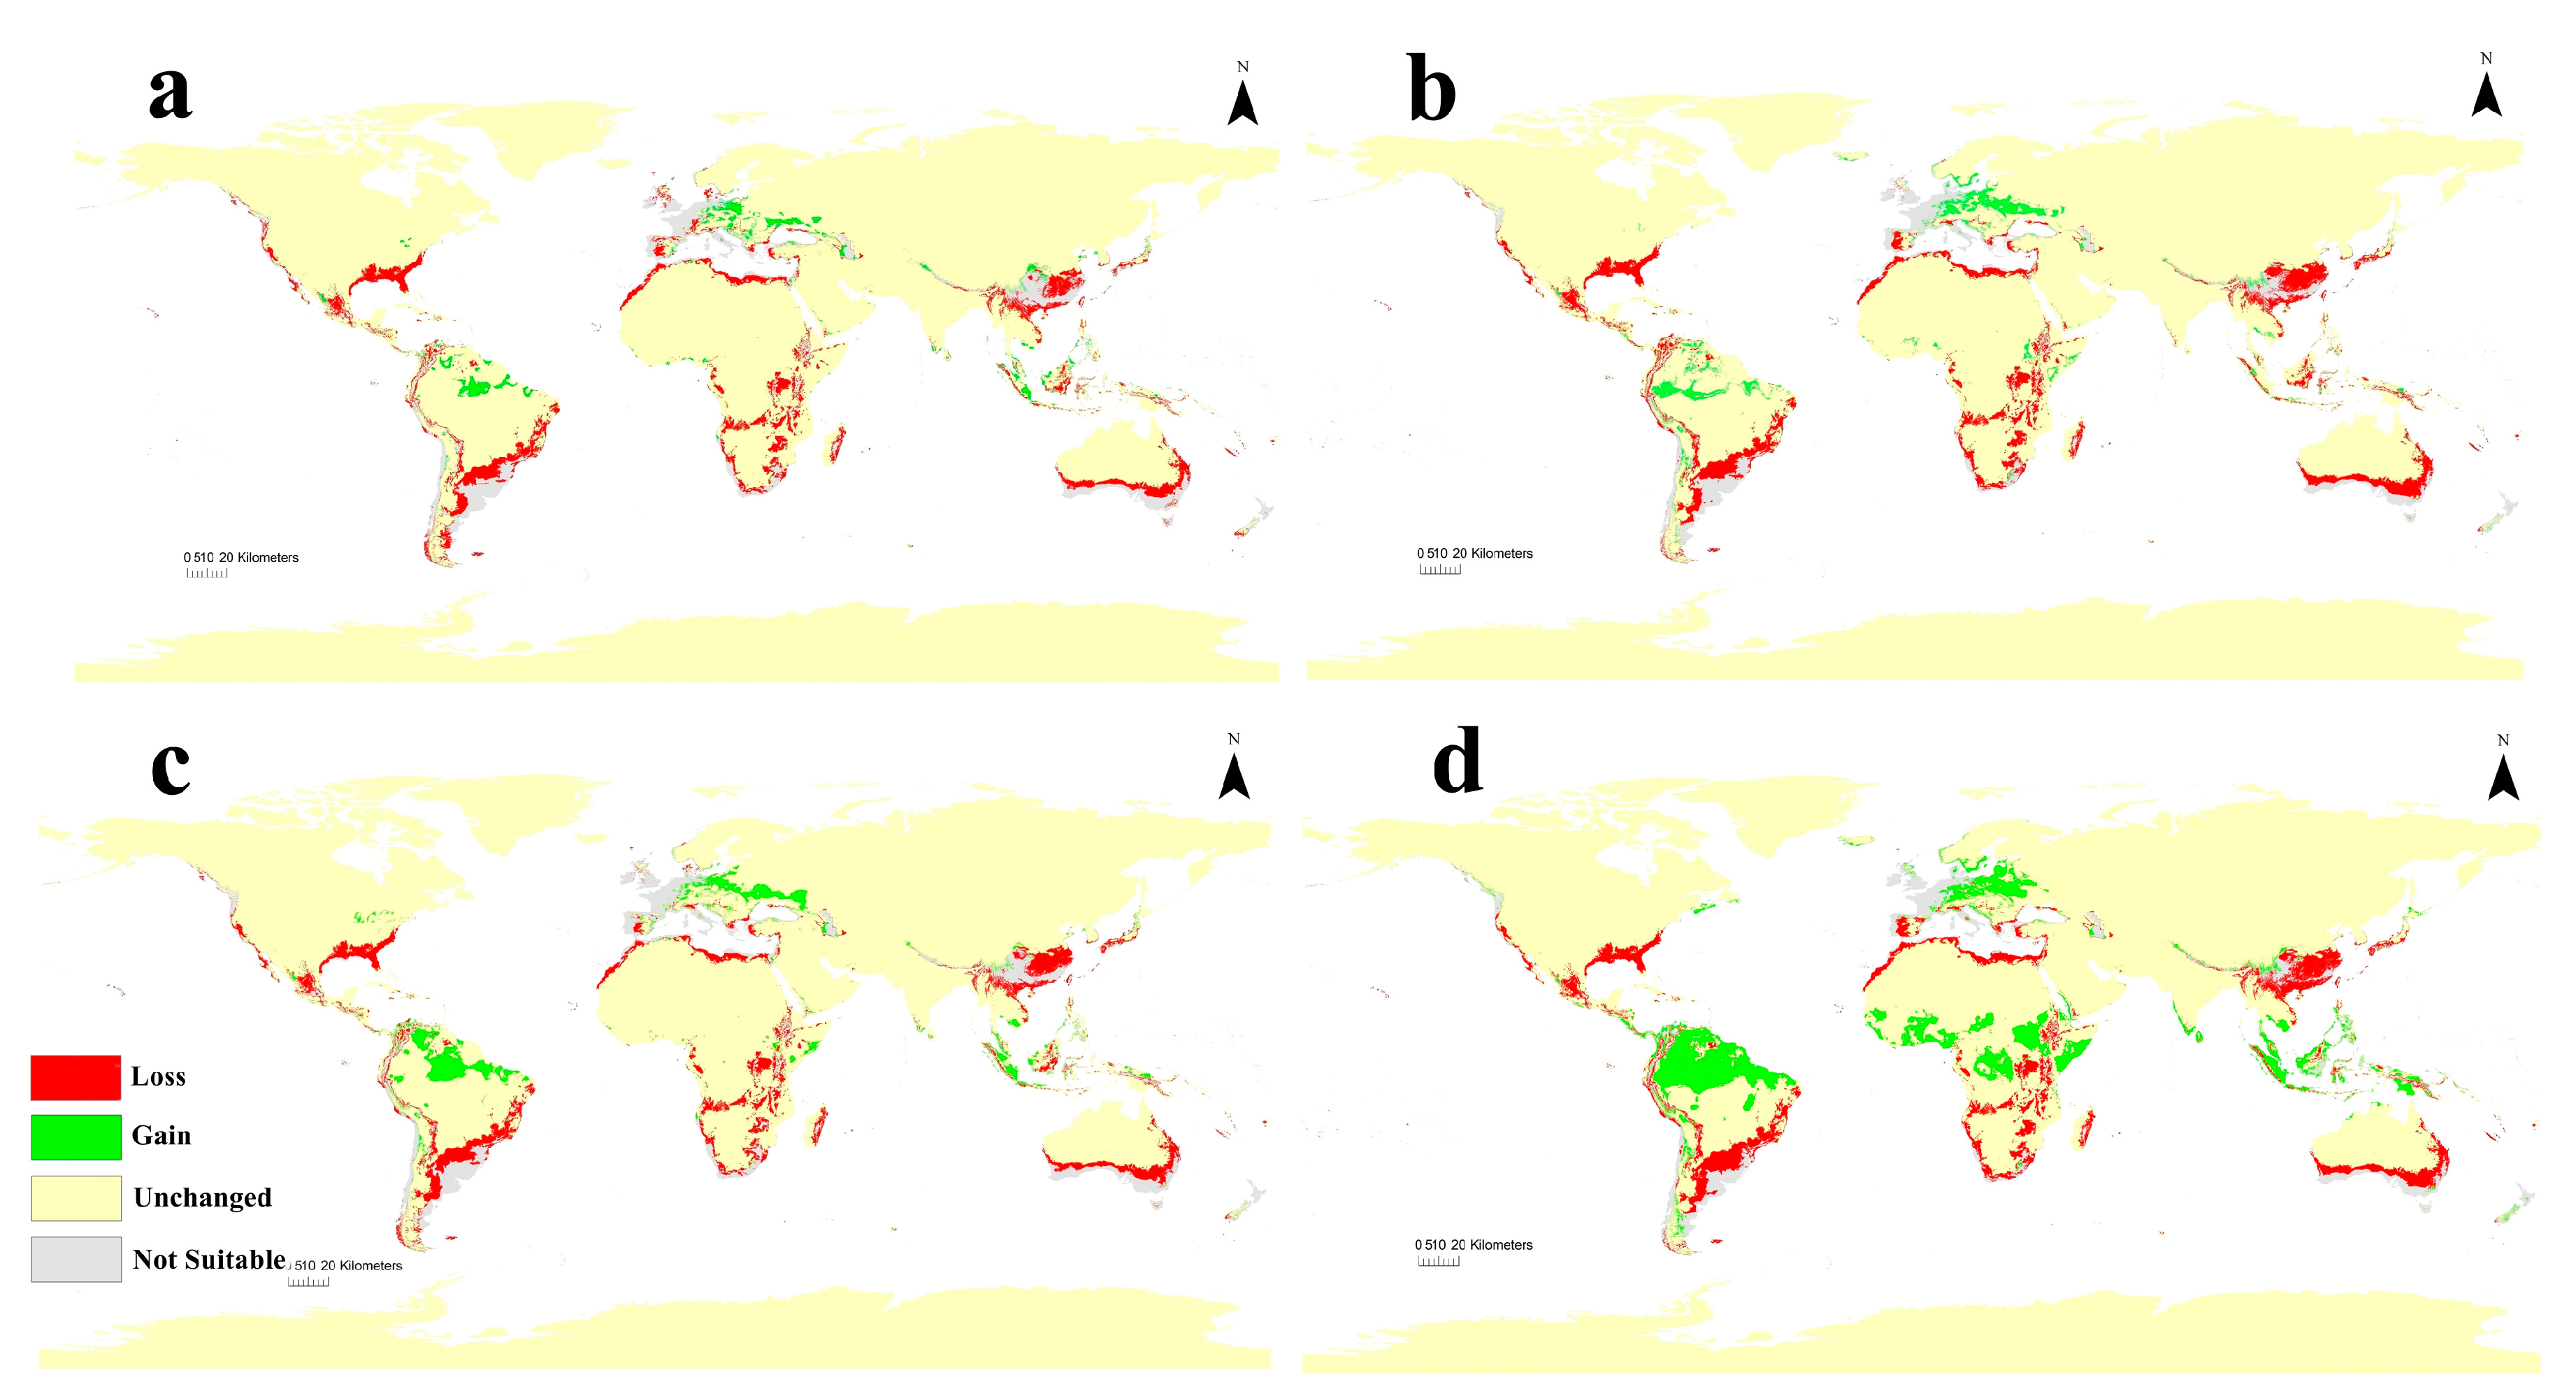
3.4. Future Potential Distribution of C. albiceps

The Maxent models for the potential distribution of C. albiceps under future climate change scenarios RCP 2.6 and RCP 8.5 for the years 2050 and 2070 are illustrated in Figure 4. In Africa, our predictive models assured very high suitability in north Africa, no suitability in sub-Saharan Africa, and low suitability in subtropical Africa (Figure 4a–c). However, the highest RCP (8.5) in 2070 was found in subtropical Africa ranging from Somalia in the east to Senegal and Sierra Leone in the west, which showed very high suitability (Figure 4d). In Asia, the future Maxent models predicted notable changes in the suitability of C. albiceps rather than the current prediction where countries, such as China, North and South Korea, and southern parts of Japan, exhibit medium to low suitability (Figure 4). In Europe, the western parts showed medium to high suitability in the future predictions (Figure 4). In North America, the southern coast of the United States revealed medium to low suitability, while in South America, northern parts, including Colombia, Venezuela, Ecuador, and the main parts of Brazil and Bolivia, illustrated high to very high suitability (Figure 4). Finally, southern parts of Australia exhibited low to medium suitability and the future models predicted no changes in New Zealand (Figure 4).
The calibration maps of current and future predictions for two different RCPs in 2050 and 2070 are used to summarize the level of changes in C. albiceps distribution owing to global warming (Figure 5). Under low hypothetical emissions of greenhouse gases (GHG) (RCP 2.6 in 2050 and 2070), the changes are not notable and usually not significant on all continents, although the species will lose some of their habitats, especially in coastal areas of temperate regions (Figure 5a,c). Moreover, for the highest hypothetical emissions of GHG (RCP 8.5 2050 and 2070), the insect loses a very large range, especially in the subtropical region in Africa, western Asia, and southern parts of North and South America, and there is clear gain in suitability that appears in Europe (Figure 5b,d).

4. Discussion

Throughout the long history of our planet, the cycles of climate could be considered a natural issue, but anthropogenic activities disrupt such a harmonic cycle and drive the earth to global warming [34]. The changes that will affect life on earth in a wide range of forms from species range shift to complete extinction [35,36]. Flies of the order Diptera are not far from such alterations. Many species of medical and veterinary important flies will alter the way by which they are distributed through space and time, including that of the genus Chrysomya. The Old World screwworm fly C. bezziana—as an example—was predicted to invade Japan, the place where its ancestors were never recorded before due to climate changes [26]. The rearranging of species composition will have unpredicted economic and ecological consequences [37]. So, studies that evaluate how the species range will be modified in the near and far future and become more urgent either for pre-control measures for the pests or conservation of beneficial species [23].
C. albiceps was selected through this work to evaluate the way by which the generated climate change scenarios will affect its distribution [38]. The results of the two-dimension niche using annual mean temperature and precipitation show how this species of flies adapt to a wide range of climatological conditions (Figure 2) in contrast to its cousin C. bezziana, which has a very specific temperature range [23]. This very good adaptability of C. albiceps gives the advantage of this species for them to be distributed through almost all continents, but, unfortunately, it did not rescue the species against the changing climate (Figure 2) [10].
Two modeling techniques (Maxent and Clim model incorporated in DIVA-GIS) were used to predict the current suitable habitat of C. albiceps depending on the climatological parameters. The two techniques are among the most frequently used GIS methods in studying biological units through several previous studies [39,40]. Both are simple, effective, and easy to use, but Maxent is better and widely used [23]. This is because of its ability to deal with presence-only data with small sample size, and its outstanding predictive performance due to the artificial intelligence of maximum entropy implemented in it [27,28,29]. The acquired maps of the two modeling methods look almost identical. The represented suitable habitat appears compatible with the current distribution of this insect throughout the world today [10]. C. albiceps is currently distributed through the Old World and most parts of South America, but the generated results indicated the suitability of its habitat in southern North America and most parts of Australia. The presence of a suitable habitat does not mean the occurrence of the species in such area, as more environmental factors could govern species distribution, such as geographical isolation. Australian territory, as an example, appears with high and very high suitability to C. albiceps, but it has never been recorded before in Australia. This may be due to the isolation of Australia or the appearance of several equivalent ecological species through the continent, such as Calliphora albifrontalis, C. augur, C. dubia, C. hilli hilli, C. maritima, C. stygia, C. vicina, Chrysomya rufifacies, Ch. varipes and Onesia tibialis [41].
According to four different future climate change scenarios for 2050 and 2070, the models produce how C. albiceps distribution range will be changed in response to global warming. The generated calibration maps that measure alteration in species distribution show how this fly will lose many parts of its distribution range throughout the world, especially in regions with the Mediterranean climate (The Mediterranean coasts of Europe and Africa, Florida of the USA, and the coasts of Australia) (Figure 5) [42]. The direct effect of such changes cannot be predicted easily, and more studies are needed to appraise the values of this fly, especially on the local scale. In North Africa and parts of southern Europe, the C. albiceps is predicted to completely disappear. How will this affect the area ecosystems? Is it will affect the recycling of organic material? Will this new niche space help more dangerous fly species invade this territory, such as C. bezziana? Will it disturb the forensic investigations of the areas where this fly disappears? In addition, how will the mango yield be affected by the disappearance of its important pollinator? In the opposite direction, the new areas of C. albiceps will face new challenges and very rare neglected veterinary issues, such as myiases, could be a dangerous obstacle for the sheep and goat grazing economy in many central European countries [43].
The present work forms a warring on how climate change will alter the global geographic distribution of C. albiceps. From the resulted predictive maps, C. albiceps lost a huge distribution range, and, consequently, negative influences will appear at pollination, forensic, and even ecological role levels. All efforts should be taken to decrease greenhouse gas emissions on all levels from the decision makers to the normal laymen to prevent unpredicted economic and ecological consequences that will one day threaten life on earth itself.

Supplementary Materials

The following supporting information can be downloaded at: https://www.mdpi.com/article/10.3390/d14070578/s1, Tables S1–S3: The total occurrence points of C. albiceps.

Author Contributions

Conceptualization, E.M.H. and M.G.N.; methodology, E.M.H. and M.G.N.; software, E.M.F., M.A.H., M.A.M., O.M.N. and Y.M.H.; validation, R.M.N., A.E.A. and A.A.A.; formal analysis, E.M.H., M.G.N., A.A.A.-K., R.M.N., A.E.A. and A.A.A.; investigation, E.M.F., M.A.H., M.A.M., O.M.N. and Y.M.H.; resources, R.M.N., A.E.A., A.A.A., E.M.F., M.A.H., M.A.M., O.M.N. and Y.M.H.; data curation, A.A.A.-K., E.M.F., M.A.H., M.A.M., O.M.N. and Y.M.H.; writing—original draft preparation, E.M.H., M.G.N., A.A.A.-K., R.M.N., A.E.A., A.A.A., E.M.F., M.A.H., M.A.M., O.M.N. and Y.M.H.; writing—review and editing, E.M.H., M.G.N., A.A.A.-K., R.M.N., A.E.A., A.A.A., E.M.F., M.A.H., M.A.M., O.M.N. and Y.M.H.; visualization, R.M.N., A.E.A. and A.A.A.; supervision, M.G.N., E.M.H. and A.A.A.-K.; project administration, E.M.H., M.G.N., A.A.A.-K., R.M.N., A.E.A., A.A.A., E.M.F., M.A.H., M.A.M., O.M.N. and Y.M.H.; funding acquisition, A.A.A.-K. All authors have read and agreed to the published version of the manuscript.

Funding

University Researchers Supporting Project number (PNURSP2022R37), Princess Nourah bint Abdulrahman University, Riyadh, Saudi Arabia.

Institutional Review Board Statement

Not applicable.

Informed Consent Statement

Not applicable.

Data Availability Statement

Not applicable.

Acknowledgments

The authors acknowledge the support from Princess Nourah bint Abdulrahman University Researchers Supporting Project number (PNURSP2022R37), Princess Nourah bint Abdulrahman University, Riyadh, Saudi Arabia. The authors need to thank Marine Radwen from USAID Egypt for her help in revising the manuscript linguistically.

Conflicts of Interest

The authors declare no conflict of interest.

References

  1. Fei, S.; Desprez, J.M.; Potter, K.M.; Jo, I.; Knott, J.A.; Oswalt, C.M. Divergence of species responses to climate change. Sci. Adv. 2017, 3, e1603055. [Google Scholar] [CrossRef] [PubMed] [Green Version]
  2. Letcher, T.M. Why do we have global warming? In Managing Global Warming; Academic Press: Cambridge, MA, USA, 2019; pp. 3–15. [Google Scholar]
  3. Bellard, C.; Bertelsmeier, C.; Leadley, P.; Thuiller, W.; Courchamp, F. Impacts of climate change on the future of biodiversity. Ecol. Lett. 2012, 15, 365–377. [Google Scholar] [CrossRef] [PubMed] [Green Version]
  4. Di Pol, G.; Crotta, M.; Taylor, R.A. Modelling the temperature suitability for the risk of West Nile Virus establishment in European Culex pipiens populations. Transbound. Emerg. Dis. 2022, 1, 1–13. [Google Scholar] [CrossRef] [PubMed]
  5. Beaumont, L.J.; Hughes, L.; Pitman, A. Why is the choice of future climate scenarios for species distribution modelling important? Ecol. Lett. 2008, 11, 1135–1146. [Google Scholar] [CrossRef] [PubMed]
  6. Van Der Putten, W.H.; Macel, M.; Visser, M.E. Predicting species distribution and abundance responses to climate change: Why it is essential to include biotic interactions across trophic levels. Philos. Trans. R. Soc. B Biol. Sci. 2010, 365, 2025–2034. [Google Scholar] [CrossRef]
  7. Hosni, E.M.; Kenawy, M.A.; Nasser, M.G.; Al-Ashaal, S.A.; Rady, M.H. A Brief Review of Myiasis with Special Notes on the Blow Flies’ Producing Myiasis (F.: Calliphoridae). Egypt. Acad. J. Biol. Sci. E Med. Entomol. Parasitol. 2019, 11, 25–32. [Google Scholar] [CrossRef]
  8. Verves, Y.G. The new faunistic data on Calliphoridae and Sarcophagidae (Diptera) of the Republic of Seychelles. Phelsuma 2007, 15, 71–81. [Google Scholar]
  9. Nasser, M.G.; Hosni, E.M.; Kenawy, M.A.; Alharbi, S.A.; Almoallim, H.S.; Rady, M.H.; Merdan, B.A.; Pont, A.C.; Al-Ashaal, S.A. Evolutionary profile of the family Calliphoridae, with notes on the origin of myiasis. Saudi J. Biol. Sci. 2021, 28, 2056–2066. [Google Scholar] [CrossRef]
  10. Alahmed, A.M.; Nasser, M.G.; Sallam, M.F.; Dawah, H.; Kheir, S.; AlAshaal, S.A. Two new records of flies causing myiasis from Saudi Arabia with a survey of flies parasitizing goats and sheep in Jazan Region. Trop. Biomed. 2020, 37, 499–512. [Google Scholar]
  11. Greenberg, B. Flies and Diseases. Vol. I. Ecology, Classification and Biotic Associations; Princeton University Press: Precenton, NJ, USA, 1971; p. 856. [Google Scholar]
  12. Greenberg, B. Flies and Diseases. Vol. II. Biology and Disease Transmission; Princeton University Press: Precenton, NJ, USA, 1973; p. 447. [Google Scholar]
  13. Zumpt, F. Myiasis in Man and Animals in the Old World. A Textbook for Physicians, Veterinarians and Zoologists; Butterworths: London, UK, 1965; p. 267. [Google Scholar]
  14. Ivorra, T.; Martínez-Sánchez, A.; Rojo, S. Coexistence and intraguild competition of Chrysomya albiceps and Lucilia sericata larvae: Case reports and experimental studies applied to forensic entomology. Acta Trop. 2022, 226, 106233. [Google Scholar] [CrossRef]
  15. Iloba, B.N.; Odigie, O.O. Arthropod succession on buried carrion of the African giant. Afr. Sci. 2021, 7, 53–59. [Google Scholar]
  16. Carmo, R.F.; Barbosa, T.M.; Torris, A.F.; Bezerra, M.-A.S.; Vasconcelos, S.D. Diversity of sarcosaprophagous Diptera (Calliphoridae, Sarcophagidae) in organic and conventional mango plantations in the Brazilian semi-arid region. Rev. Bras. De Èntomol. 2021, 65, 1–5. [Google Scholar] [CrossRef]
  17. Dag, A.; Gazit, S. Mango pollinators in Israel. J. Appl. Hortic. 2000, 2, 39–43. [Google Scholar] [CrossRef]
  18. Siqueira, M.F.D.; Peterson, A.T. Consequences of global climate change for geographic distributions of cerrado tree species. Biota Neotrop. 2003, 3, 1–14. [Google Scholar] [CrossRef] [Green Version]
  19. Bale, J.S.; Masters, G.J.; Hodkinson, I.D.; Awmack, C.; Bezemer, T.M.; Brown, V.K.; Butterfield, J.; Buse, A.; Coulson, J.C.; Farrar, J.; et al. Herbivory in global climate change research: Direct effects of rising temperature on insect herbivores. Glob. Chang. Biol. 2002, 8, 1–16. [Google Scholar] [CrossRef]
  20. Gilman, S.E.; Urban, M.C.; Tewksbury, J.; Gilchrist, G.W.; Holt, R.D. A framework for community interactions under climate change. Trends Ecol. Evol. 2010, 25, 325–331. [Google Scholar] [CrossRef]
  21. Cox, J.S.H. The Role of Geographic Information Systems and Spatial Analysis in Area-Wide Vector Control Programm. In Area-wide Control of Insect Pests; Springer: Dordrecht, The Netherlands, 2007; pp. 199–209. [Google Scholar]
  22. Naeem, M.; Alahmed, A.M.; Kheir, S.M.; Sallam, M.F. Spatial distribution modeling of Stegomyia aegypti and Culex tri-taeniorhynchus (Diptera: Culicidae) in Al-bahah Province, Kingdom of Saudi Arabia. Trop. Biomed. 2016, 33, 295–310. [Google Scholar]
  23. Hosni, E.M.; Nasser, M.; Al-Ashaal, S.; Rady, M.H.; Kenawy, M.A. Modeling current and future global distribution of Chrysomya bezziana under changing climate. Sci. Rep. 2020, 10, 4947. [Google Scholar] [CrossRef]
  24. Abou-Shaara, H.; Alashaal, S.A.; Hosni, E.M.; Nasser, M.G.; Ansari, M.J.; Alharbi, S.A. Modeling the Invasion of the Large Hive Beetle, Oplostomusfuligineus, into North Africa and South Europe under a Changing Climate. Insects 2021, 12, 275. [Google Scholar] [CrossRef]
  25. Escobar, L.E.; Lira-Noriega, A.; Medina-Vogel, G.; Peterson, A.T. Potential for spread of the white-nose fungus (Pseudogym-noascus destructans) in the Americas: Use of Maxent and Niche A to assure strict model transference. Geospat. Health 2014, 9, 221–229. [Google Scholar] [CrossRef]
  26. Hosni, E.M.; Nasser, M.; Al-Khalaf, A.A.; Al-Shammery, K.A.; Al-Ashaal, S.; Soliman, D. Invasion of the Land of Samurai: Potential Spread of Old-World Screwworm to Japan under Climate Change. Diversity 2022, 14, 99. [Google Scholar] [CrossRef]
  27. Phillips, S.J.; Dudík, M. Modeling of species distributions with Maxent: New extensions and a comprehensive evaluation. Ecography 2008, 31, 161–175. [Google Scholar] [CrossRef]
  28. Phillips, S.J.; Dudík, M.; Schapire, R.E. Maxent Software for Modeling Species Niches and Distributions (Version 3.4.1). Available online: http://biodiversityinformatics.amnh.org/open_source/maxent/ (accessed on 20 March 2020).
  29. Phillips, S.J.; Anderson, R.P.; Schapire, R.E. Maximum entropy modeling of species geographic distributions. Ecol. Model. 2006, 190, 231–259. [Google Scholar] [CrossRef] [Green Version]
  30. Elith, J.H.; Graham, C.P.H.; Anderson, R.P.; Dudík, M.; Ferrier, S.; Guisan, A.; Hijmans, R.J.; Huettmann, F.; Leathwick, J.R.; Lehmann, A.; et al. Novel methods improve prediction of species’ distributions from occurrence data. Ecography 2006, 29, 129–151. [Google Scholar] [CrossRef] [Green Version]
  31. Kessler, W.H.; Ganser, C.; Glass, G.E. Modeling the Distribution of Medically Important Tick Species in Florida. Insects 2019, 10, 190. [Google Scholar] [CrossRef] [Green Version]
  32. Mulieri, P.R.; Patitucci, L.D. Using ecological niche models to describe the geographical distribution of the myiasis-causing Cochliomyia hominivorax (Diptera: Calliphoridae) in southern South America. Parasitol. Res. 2019, 118, 1077–1086. [Google Scholar] [CrossRef]
  33. Allouche, O.; Tsoar, A.; Kadmon, R. Assessing the accuracy of species distribution models: Prevalence, kappa and the true skill statistic (TSS). J. Appl. Ecol. 2006, 43, 1223–1232. [Google Scholar] [CrossRef]
  34. Kondratev, K.I.; Kondrat’ev, K.I.; Kondratyev, K.Y.; Kondrat’ev, K.J.; Krapivin, V.F.; Varotsos, C.; Barōtsos, K. Global Carbon Cycle and Climate Change; Springer Science & Business Media: Berlin/Heidelberg, Germany, 2003. [Google Scholar]
  35. Liu, Y.; Shi, J. Predicting the Potential Global Geographical Distribution of Two Icerya Species under Climate Change. Forests 2020, 11, 684. [Google Scholar] [CrossRef]
  36. Sax, D.F.; Early, R.; Bellemare, J. Niche syndromes, species extinction risks, and management under climate change. Trends Ecol. Evol. 2013, 28, 517–523. [Google Scholar] [CrossRef] [Green Version]
  37. Hannah, L.; Thomas, E.L. Biodiversity and Climate Change. In Climate Change and Biodiversity; Yale University: London, UK, 2004; Volume 3. [Google Scholar]
  38. Alotaibi, F.; Alkuriji, M.; AlReshaidan, S.; Alajmi, R.; Metwally, D.M.; Almutairi, B.; Alorf, M.; Haddadi, R.; Ahmed, A. Body Size and Cuticular Hydrocarbons as Larval Age Indicators in the Forensic Blow Fly, Chrysomya albiceps (Diptera: Calliphoridae). J. Med Èntomol. 2021, 58, 1048–1055. [Google Scholar] [CrossRef]
  39. Naeem, M.; Yuan, X.; Huang, J.; An, J. Habitat suitability for the invasion of Bombus terrestris in East Asian countries: A case study of spatial overlap with local Chinese bumblebees. Sci. Rep. 2018, 8, 11035. [Google Scholar] [CrossRef] [PubMed]
  40. Hosni, E.M.; Al-Khalaf, A.A.; Nasser, M.G.; Abou-Shaara, H.F.; Radwan, M.H. Modeling the Potential Global Distribution of Honeybee Pest, Galleria mellonella under Changing Climate. Insects 2022, 13, 484. [Google Scholar] [CrossRef] [PubMed]
  41. Wallman, J.; Donnellan, S. The utility of mitochondrial DNA sequences for the identification of forensically important blowflies (Diptera: Calliphoridae) in southeastern Australia. Forensic Sci. Int. 2001, 120, 60–67. [Google Scholar] [CrossRef]
  42. Kourgialas, N.N.; Dokou, Z. Water management and salinity adaptation approaches of Avocado trees: A review for hot-summer Mediterranean climate. Agric. Water Manag. 2021, 252, 106923. [Google Scholar] [CrossRef]
  43. Daniele, B.-C.; Barbara, S.; Isabel, B.; Alberto, G. Economic risk assessment of the quality labels and productive efficiency strategies in Spanish extensive sheep farms. Agric. Syst. 2021, 191, 103169. [Google Scholar] [CrossRef]
Figure 1. Observed distribution of C. albiceps.
Diversity 14 00578 g001
Figure 2. (a) The jackknife test of the most important variables, (b) Response curve of the most effective bioclimatic factor (bio 1) in C. albiceps distribution, and (c) Two-dimensional niche of C. albiceps between annual temperature (bio 1) represented by red dots and annual precipitation (bio 12) represented by green dots.
Diversity 14 00578 g002
Figure 3. Current potential global distribution of C. albiceps: (a). Using maxent and (b). using DIVA.
Diversity 14 00578 g003
Figure 4. Maxent models of predicted global future distribution of C. albiceps under two RCPs: (a) 2050 for RCP 2.6; (b) 2050 for RCP 8.5; (c) 2070 for RCP 2.6, and (d) 2070 for RCP 8.5.
Diversity 14 00578 g004
Figure 5. Calibration maps showing gain and loss in habitat suitability of C. albiceps through the four future scenarios against the current status with threshold (>0.5): (a) 2050 for RCP 2.6; (b) 2050 for RCP 8.5; (c) 2070 for RCP 2.6, and (d) 2070 for RCP 8.5.
Diversity 14 00578 g005
Publisher’s Note: MDPI stays neutral with regard to jurisdictional claims in published maps and institutional affiliations.

