
Phylogenetic Tree Selection by Testing Substitution Number in Clade


Institute of Statistics, National Yang Ming Chiao Tung University, Hsinchu 30010, Taiwan
*
Author to whom correspondence should be addressed.
Diversity 2022, 14(7), 543; https://doi.org/10.3390/d14070543
Submission received: 26 April 2022
/
Revised: 27 June 2022
/
Accepted: 4 July 2022
/
Published: 6 July 2022
(This article belongs to the Special Issue Modeling the Ecology and Evolution of Biodiversity)
Abstract
:The phylogenetic tree is a widely-used tool to show the evolutionary relationship between taxa. There are many types of phylogenetic trees proposed in the literature such as maximum likelihood, neighbor-joining, and UPGMA trees. The topologies of different types of trees are not the same. Even for the same type of tree, the topologies are different when they embed different nucleotide substitution models, such as the JC69 model, K80 model, TN93 model, and so on. Although each type of tree has its advantages, selecting a suitable tree among these choices becomes a challenging problem. In this study, we propose a method based on testing the nucleotide substitution number between sequences to select trees. An Ebolavirus example is used to illustrate the method. In addition, this approach can select a suitable nucleotide substitution model for a particular type of tree. For this ebolavirus example, the JC69 model is the selected substitution model for the maximum likelihood tree.
1. Introduction
The phylogenetic tree is a useful method to show the relationship between different taxa [1]. The branching relationships of a tree can reflect the degree to which different sequences are related. Two sequences that are very much alike will be located as neighboring outside branches. In addition to displaying the relationship between different taxa, the phylogenetic tree is a useful method to predict the microRNA (miRNA) biomarkers of cancers by combining other bioinformatics approaches [2]. Furthermore, the phylogenetic tree has been used as a very useful tool to explore the association between various diseases and the association between disease and vaccination. The association between major depression and gastroesophageal reflux has been explored based on the phylogenetic analysis of miRNA biomarkers [3]. Additionally, the association between anti-NMDA receptor encephalitis and vaccination [4,5] and the association between anti-NMDA receptor encephalitis and the coronavirus disease 2019 (COVID-19) have been explored using the phylogenetic analysis [6].
Many types of trees have been established in the literature, including the maximum likelihood method, the neighbor-joining method, the unweighted pair-group method using arithmetic averages (UPGMA), and the maximum parsimony method [7,8,9,10]. They are either based on a character criterion or a distance criterion. For example, the maximum parsimony tree and the maximum likelihood tree are character-based methods. The UPGMA and neighbor-joining trees are distance-based methods. There are two types of error for phylogenetic trees including the topological error and the branch-length error [11]. The topological error is the difference in the branching pattern between an inferred tree and the true tree, and the branch-length error is the deviation of estimated branch lengths from the true branch lengths. Topological errors might be more serious than branch-length errors. Even for the same type of tree, the topology is not exactly the same when embedding different substitution models. Although each type of tree has its advantages, different trees may have very distinct topologies. Thus, we might be interested in selecting trees satisfying some topology criterion.
Several approaches have been developed to assess the confidence of tree selection including the bootstrap probability [12], the Kishino–Hasegawa tests [13,14], and an approximately unbiased test [15]. The approximately unbiased test was recommended for the tree selection problem, which could satisfy the requirement for unbiasedness at least approximately and thus controls for type-1 error in most cases [15]. In addition, a k-means clustering method was also proposed to select a suitable tree [16]. The k-means clustering method does not need any evolutionary model assumptions, but only needs to investigate sequence similarity using a penalty score. However, the calculation process of this approach is complicated, which might not be very useful in real applications.
In this study, we propose using the method of testing substitution number per site to select phylogenetic trees. This method is based on the topology of the tree. The substitution number between the nucleotide sequences in the same clade of a reasonable tree should be smaller than the substitution number between the nucleotide sequences in different clades. Thus, we use this criterion to propose our method, and regard the selected trees as suitable trees. It is noted that this method is proposed from an intuitive point of view that the nucleotide sequences in the same clade should be more similar to those in different clades. Nevertheless, there is no guarantee that this method will always select the true tree. The criterion of this method requires that the substitution number per site be small between two sequences joined to a common branch. Since the estimated substitution number per site is a point estimator that cannot provide any estimation precision, to provide a more precise method to test it, we adopt a hypothesis testing to test whether the substitution number per site for the sequences joined to a common branch is zero.
To propose the hypothesis testing, we need to choose a nucleotide substitution model for sequence evolution. There are many kinds of nucleotide substitution models, including the JC69 model, K80 model, F81 model, F84 model, HKY85 model and TN93 model [7,17,18,19,20,21]. The substitution number estimator and its variance estimator for these substitution models have been well established in the literature [17,18,22,23,24,25,26]. From our studies, in developing the method, the nucleotide substitution model selection does not significantly affect the tree selection result. Therefore, we adopt the simple JC69 model as the substitution model in the hypothesis testing. An Ebolavirus example is used to illustrate and validate the method. To plot a phylogenetic tree for the Ebolavirus by the software MEGA 6 [27], first, we need to select a tree construction method such as the maximum likelihood, neighbor-joining, or UPGMA method. After that, we need to select a substitution model to plot the tree.
2. Methods
Before describing the method, we introduce notations first. Let , and denote the substitution number, substitution number estimate, and variance estimate, respectively. To compare different trees, we adopt the similarity of sequences in the same clade of trees to evaluate the performance of the trees. To measure the similarity of two sequences, we can use the p-value of the hypothesis test,
to be a similarity degree of two sequences. A large p-value for testing (1) indicates more similarity between the two sequences because the null hypothesis is not rejected. The p-value for testing (1) is:
where is the standard normal random variable. When two sequences are the same, since does not exist, we define the p-value to be 1. Here the normal approximation is considered in (2). Since the length of the gene nucleotide sequence of a gene is usually large, by the central limit theorem, we can assume that the substitution number follows a normal distribution. If the length of the nucleotide sequence is not large such as the microRNA nucleotide sequence, we might consider other tests.
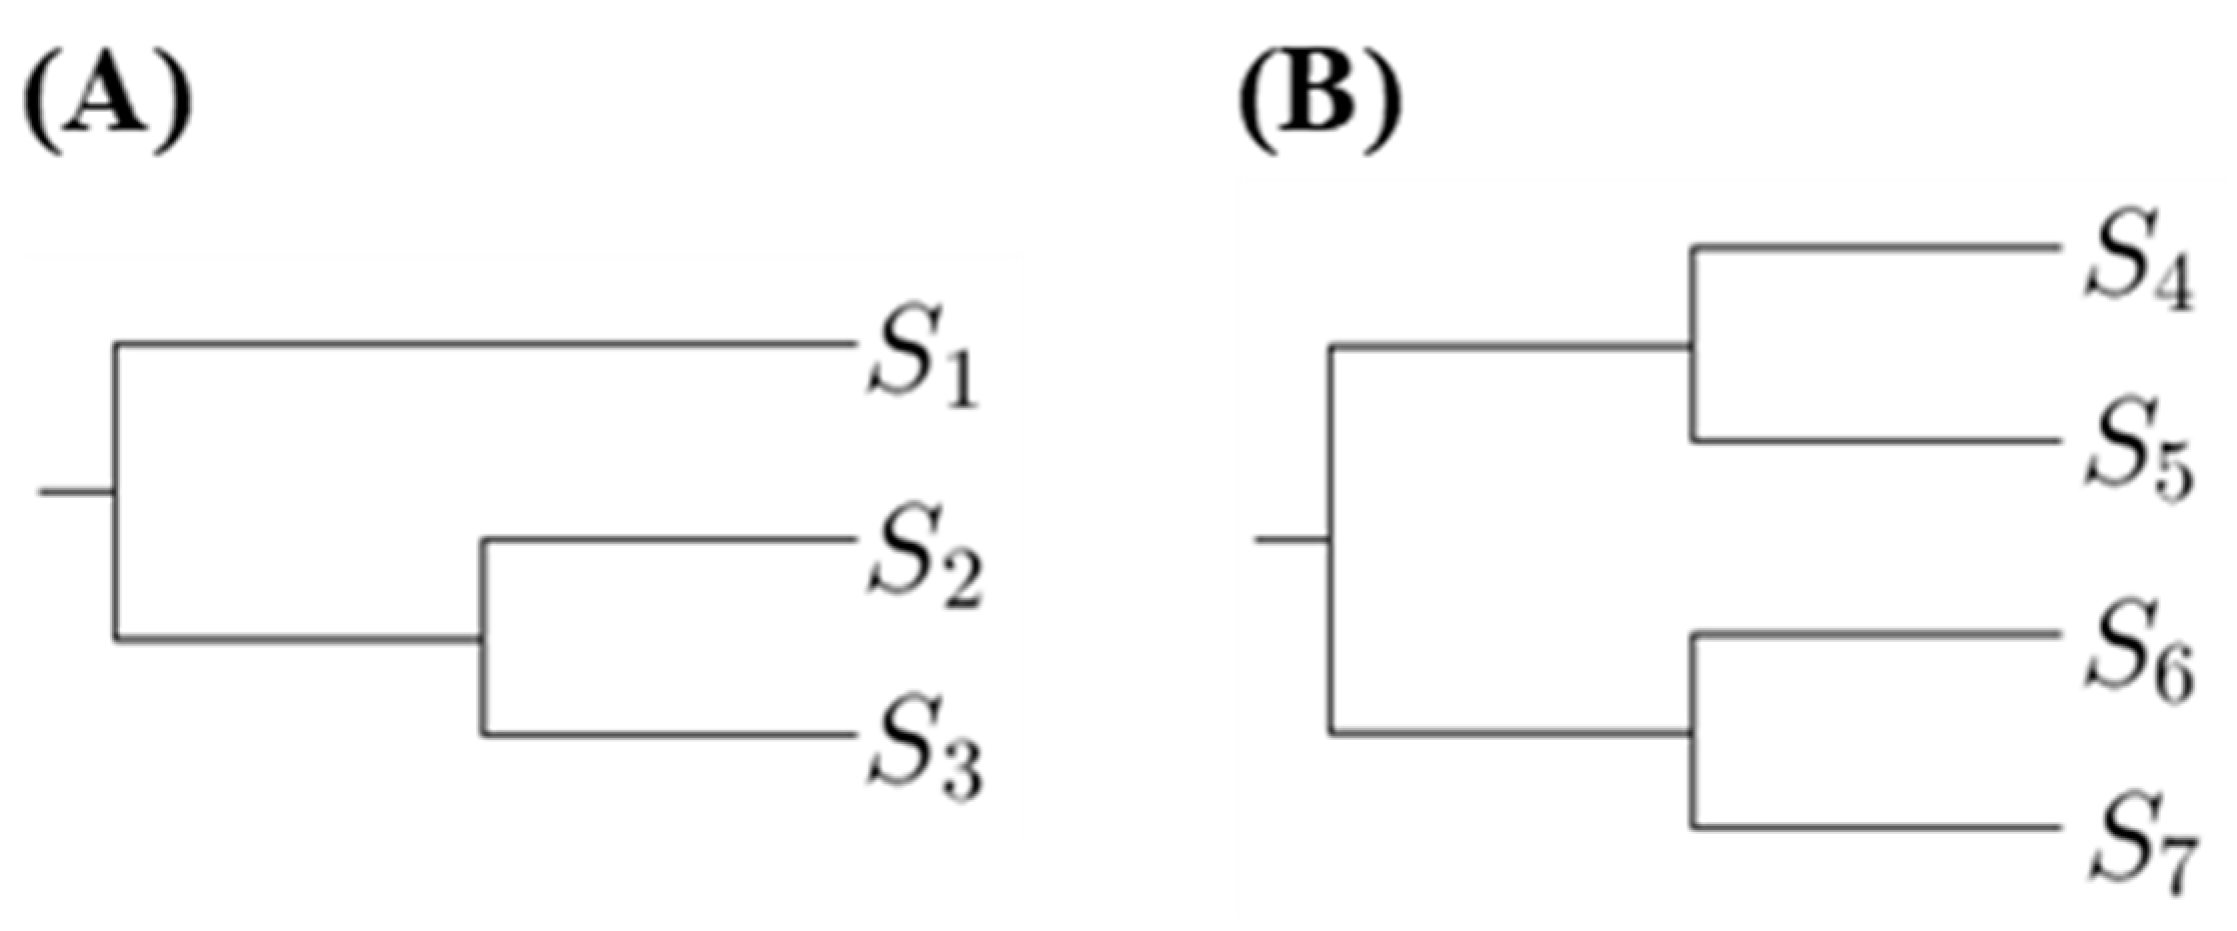
The proposed method is to select a tree such that the p-values for any pairs of sequences in the same clade are not too small. Hence we first compute the number of p-values less than a threshold in the first clades. Using Figure 1 as an example, there are two phylogenetic trees, where are DNA sequences. Let denote the substitution number of the two sequences and for . For Figure 1A, we compute the p-value for testing in the first clade; for Figure 1B, we compute the p-values for testing and in the first clade.
The phylogenetic trees, which have the minimum number of p-values less than a threshold in the first clades, are the most suitable. If there is more than one tree achieving this criterion and we want to select one, we can compare the number of p-values in second clades. There are two types of the second clade presented in Figure 1. When comparing the p-values in second clades, we compute the p-values for testing two sequences that are from distinct first clades. Using Figure 1 as an example, for Figure 1A, we compute the p-values for testing and ; for Figure 1B, we compute the p-values for testing , , and . Then we choose the tree with the minimum number of p-values less than a threshold in second clades, and so on.
To simplify the notation, we define the number of p-values less than a threshold in the ith clades as . However, only comparing the number of p-values less than a threshold is not an appropriate way to select a tree. Instead, a more reasonable approach is to compare the ratio of p-values less than a threshold. For example, when considering the second clade cases in Figure 1, the number of all p-values for Figure 1A is 2 and the number of all p-values for Figure 1B is 4. Hence we cannot directly compare the number of p-values less than the threshold because the number of p-values for each tree is not the same. Therefore, for the ith clade, we define a magnitude,
which is the ratio of the number of p-values in this clade less than the threshold to the number of p-values in this clade. It is noted that we do not need to consider multiple testing to test several hypotheses here because Equation (3) is used instead of using the number of p-values less than the threshold. This is somehow equivalent to adjusting the p-values. A procedure for selecting a tree based on is given as follows.
Procedure 1: Select a suitable phylogenetic tree
Step 1. Use software to build several phylogenetic trees using different methods.
Step 2. Set a threshold and compute for each phylogenetic tree.
Step 3. The trees with the minimum value are the desirable trees under the criterion. If there is more than one tree with the minimum value, we can go to the next steps.
Step 4. Let . For the trees with the minimum value of , compute and follow a similar way in Step 3 to select a tree. If there is more than one tree satisfying the condition, we go further to consider the ()th clade and follow a similar method to select trees.
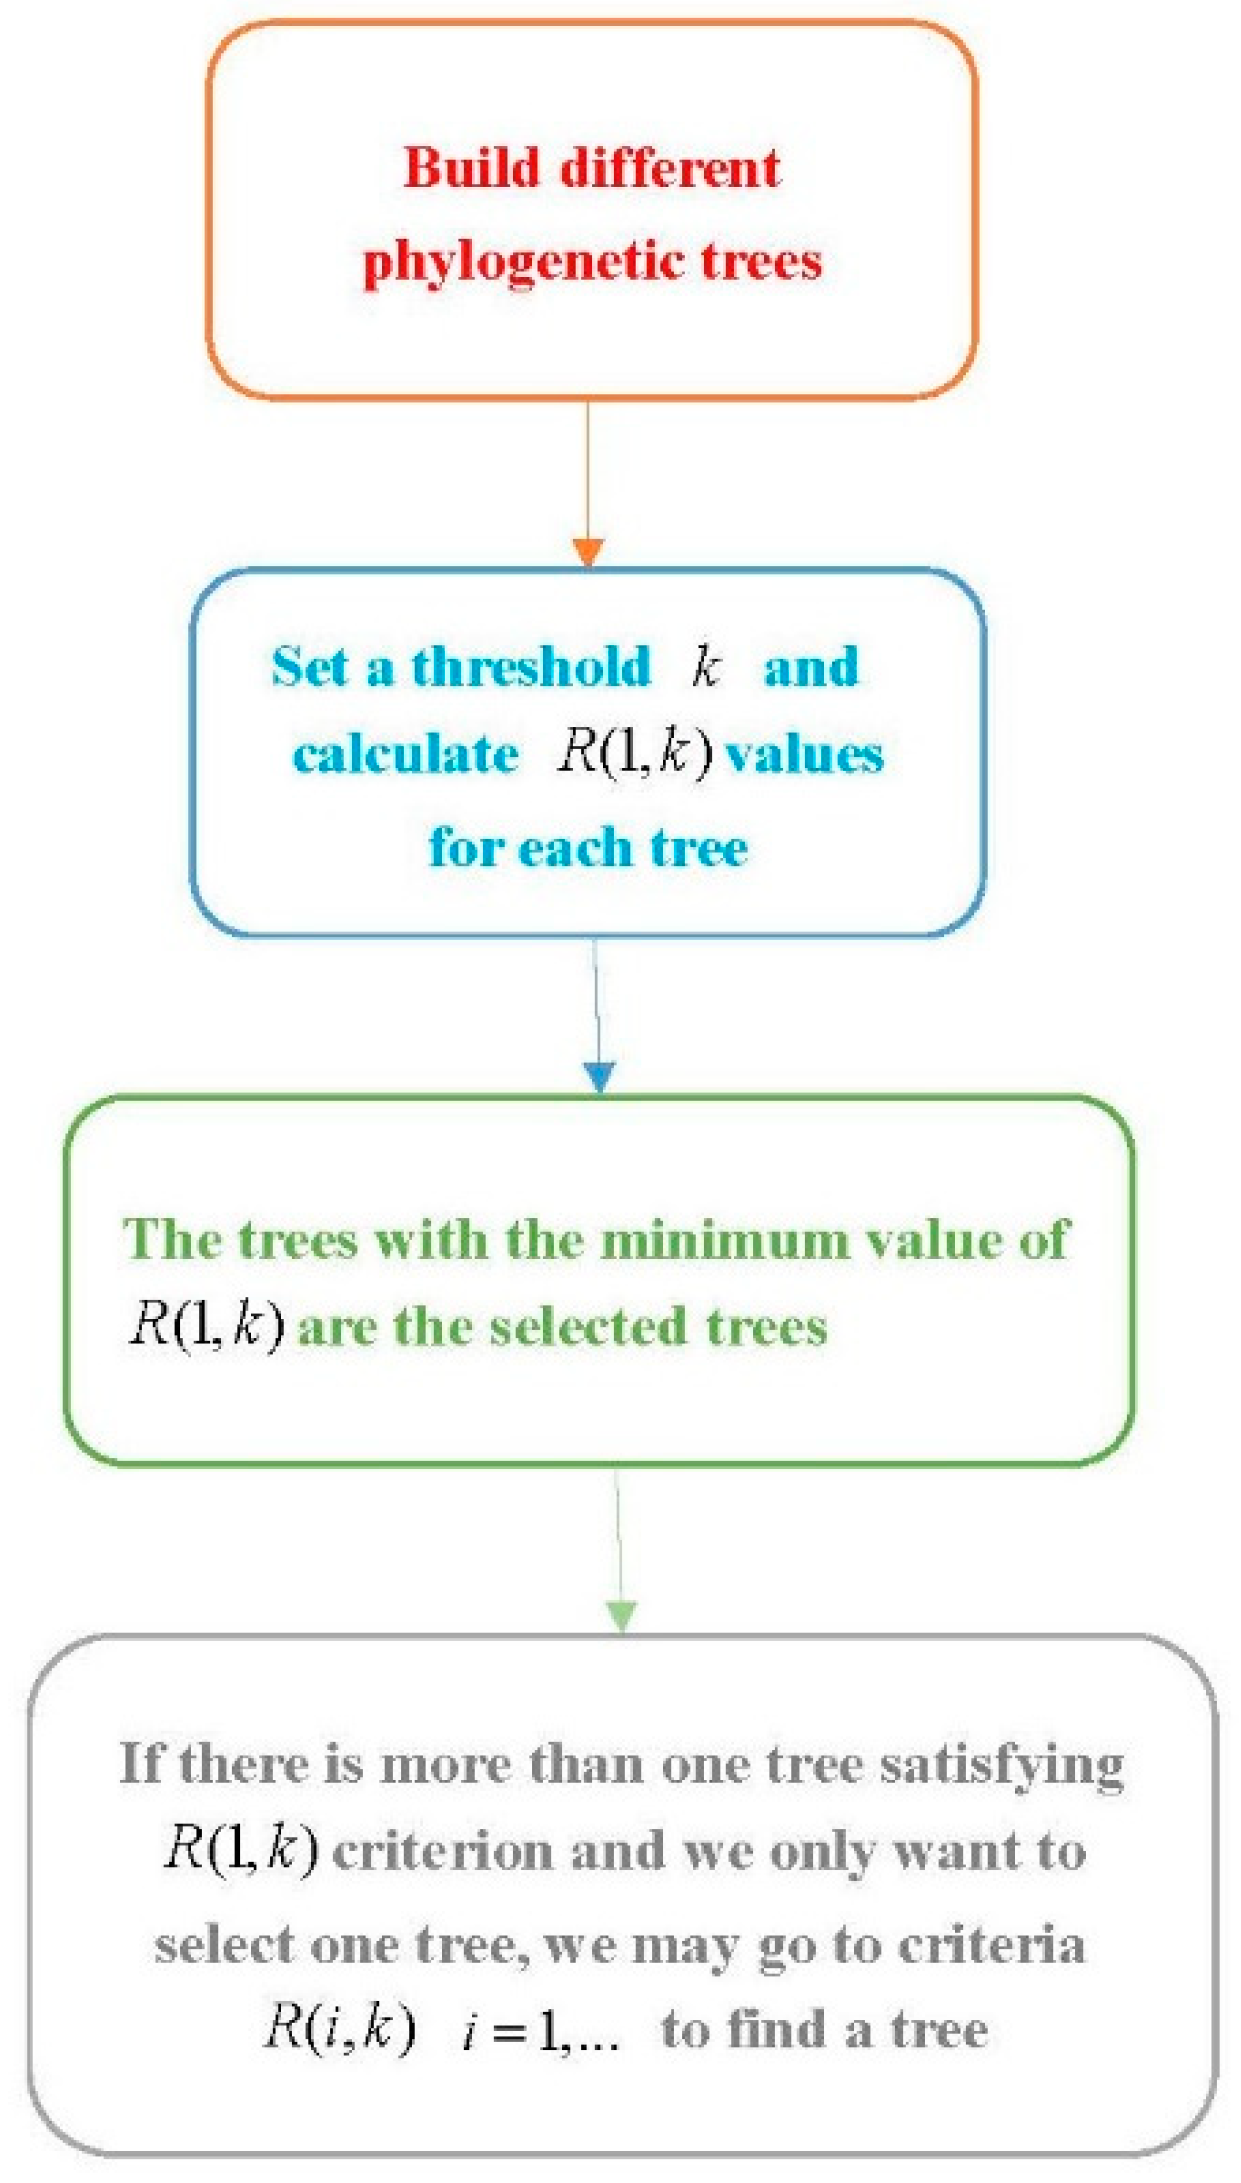
This method can be easily implemented when we only consider the criterion. The criteria of with are more difficult to carry out. Although only using the R(1,k) criterion might select more than one tree, it is easier to carry out. The flowchart of this procedure is provided in Figure 2.
In Procedure 1, the threshold should be determined first. Since the threshold of the p-value should be small, we suggest that can be in the range of (0,0.1). A more appropriate way is to consider several values of and select a tree by comparing the results for these different values. More details of selection are discussed in Section 3. In addition, it is worth noting that there are many options for the variance estimator in Equation (2) [24,26]. According to our study with the Ebolavirus example, different nucleotide substitution models and different variance estimators do not affect the result. Thus, in the example, we adopt the substitution model JC69 and its usual variance estimator.
where is the length of the sequences.
3. An illustrate Example and Result
We use an Ebolavirus example to illustrate our method. The genus Ebolavirus contains five species: Bundibugyo ebolavirus (BDBV), Zaire ebolavirus (EBOV), Reston ebolavirus (RESTV), Sudan ebolavirus (SUDV), and Taï Forest ebolavirus (TAFV) [28]. The three species—BDBV, EBOV and SUDV—have been associated with large Ebolavirus disease outbreaks in Africa. EBOV and SUDV are the main viruses of the five Ebolaviruses. Hence in this study, we discuss 28 Ebolaviruses in these two species. The accession numbers of the Ebolaviruses in the Genbank are AF272001.1, AY354458.1, EU338380.1, FJ968794.1, HQ613402.1, HQ613403.1, JN638998.1, KC242783.2, KC242784.1 to KC242794.1, KC242796.1, KC242798.1 to KC242801.1, KJ660346.2 to KJ660348.2, and NC_006432. The Ebolaviruses EU338380, FJ968794, JN638998, KC242783, and NC_006432.1 belong to the SUDV species and the other Ebolaviruses belong to the EBOV species.
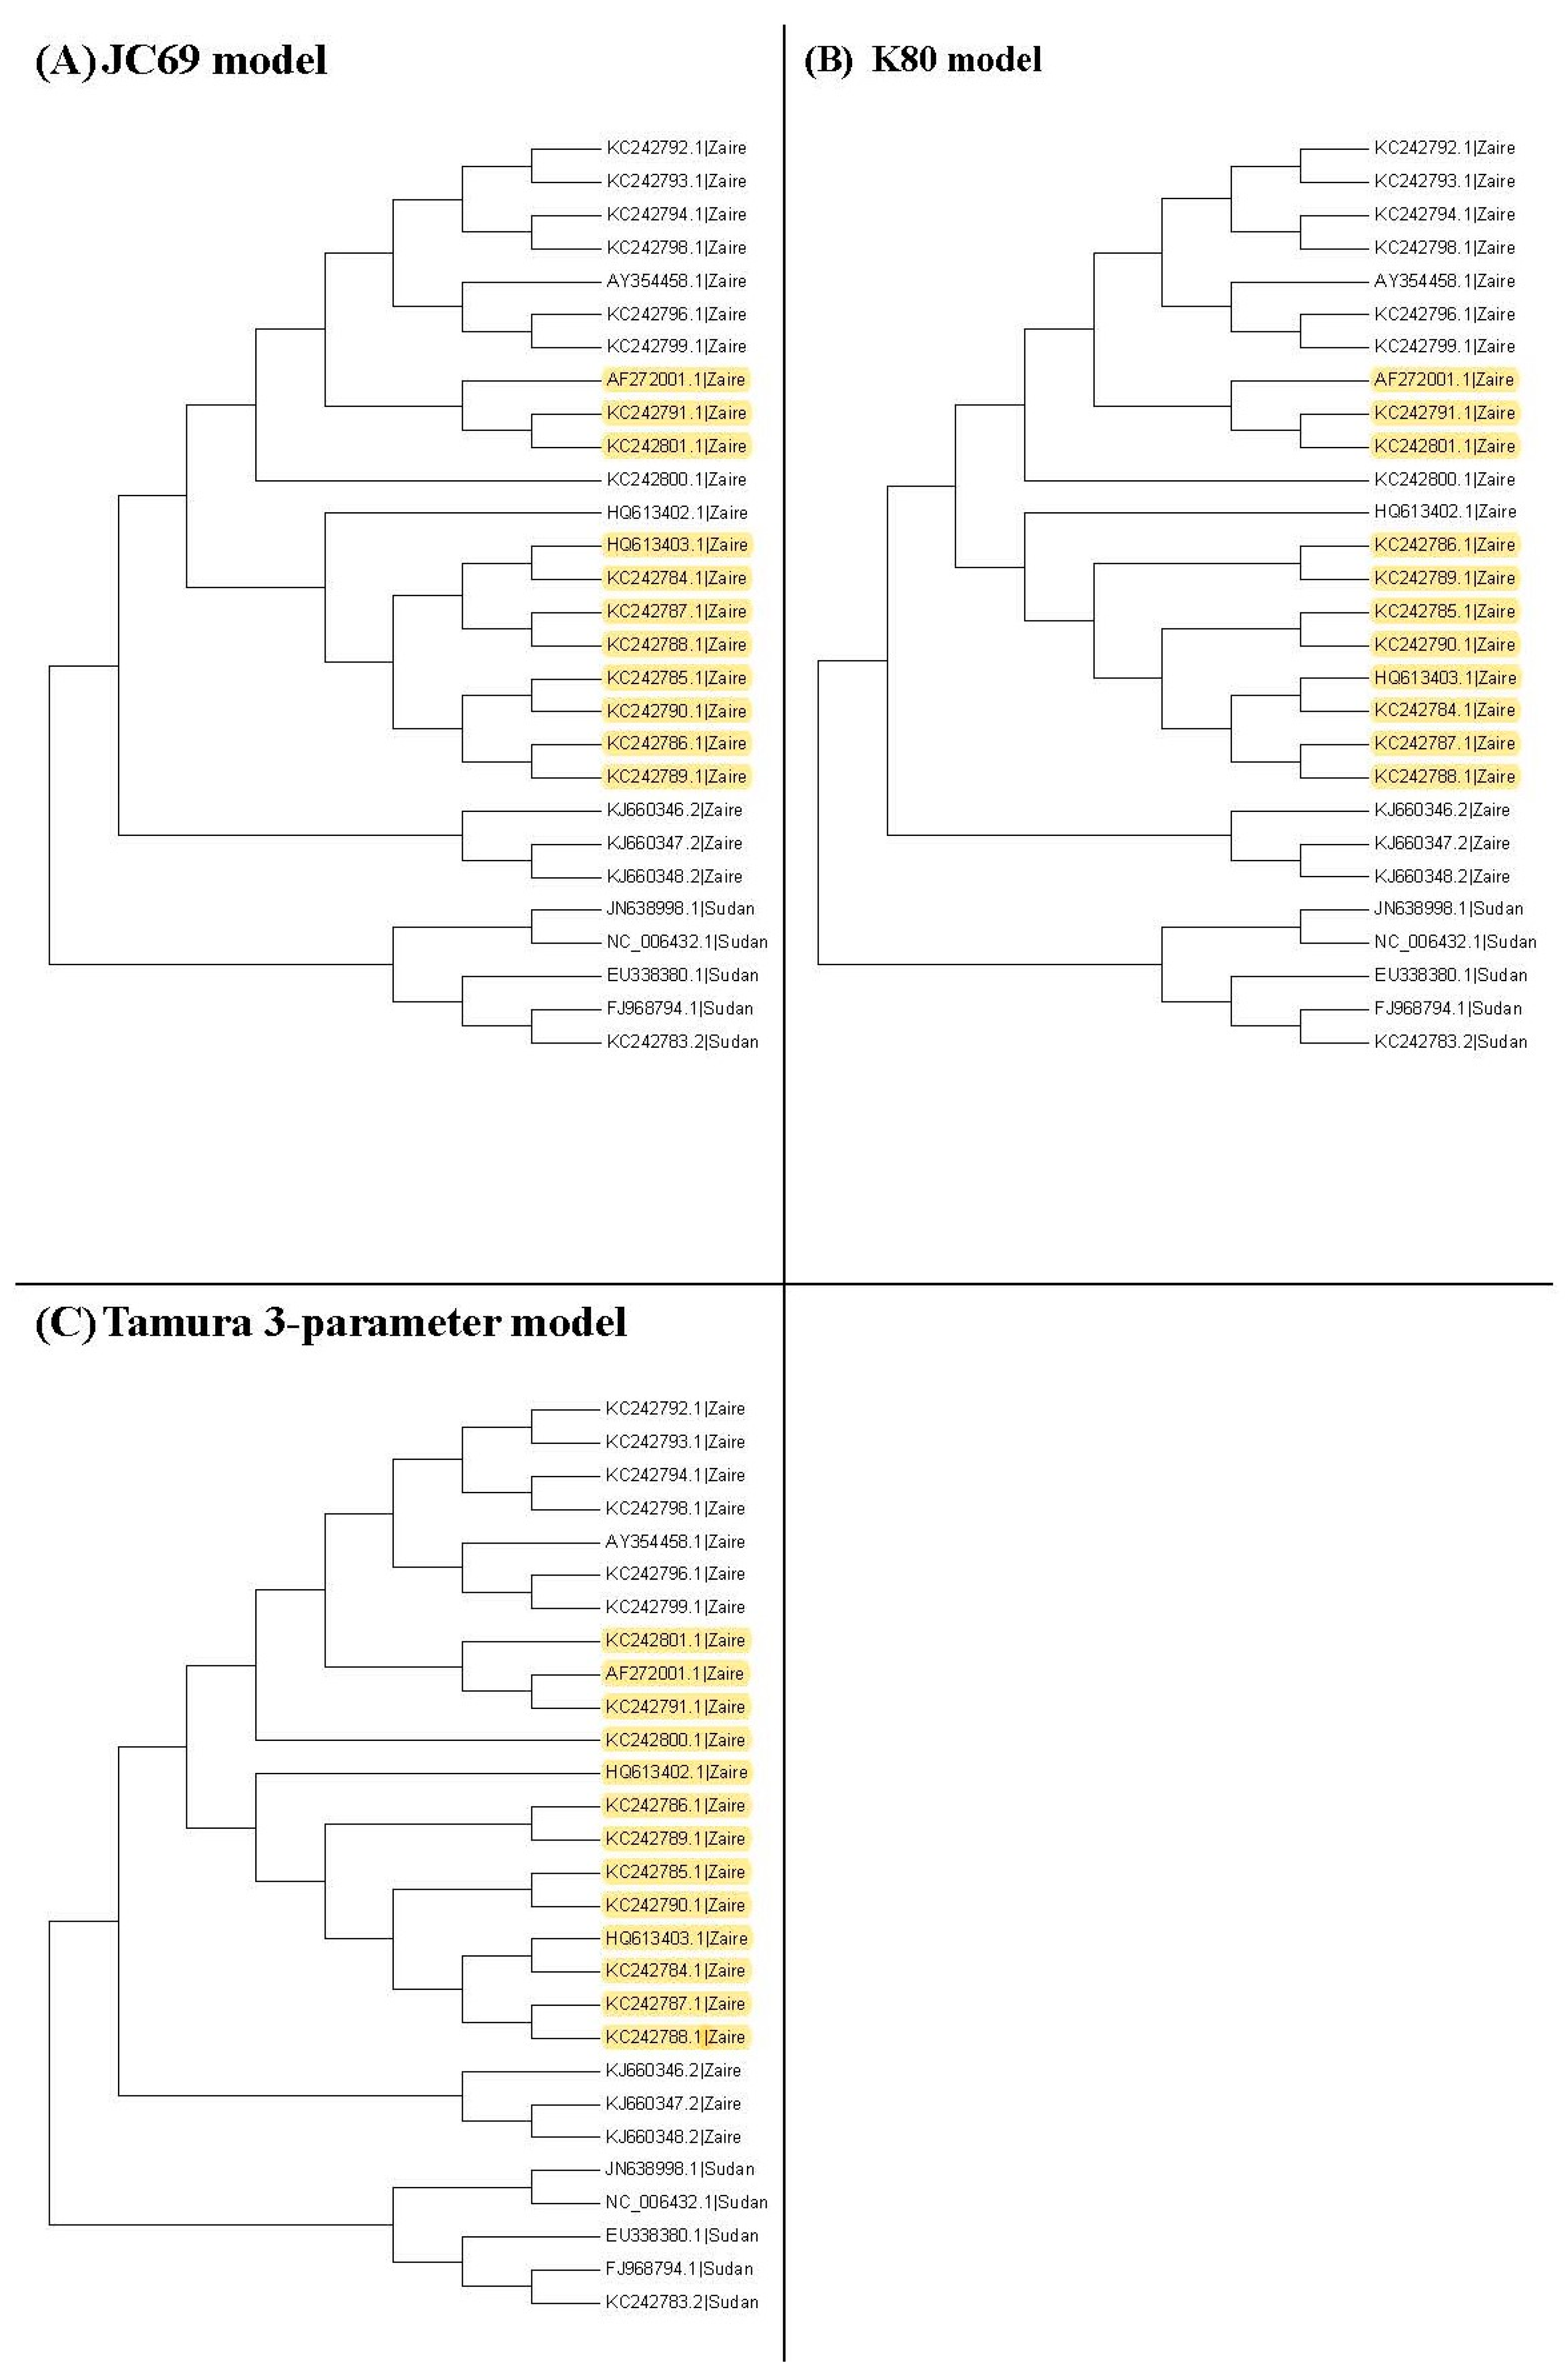
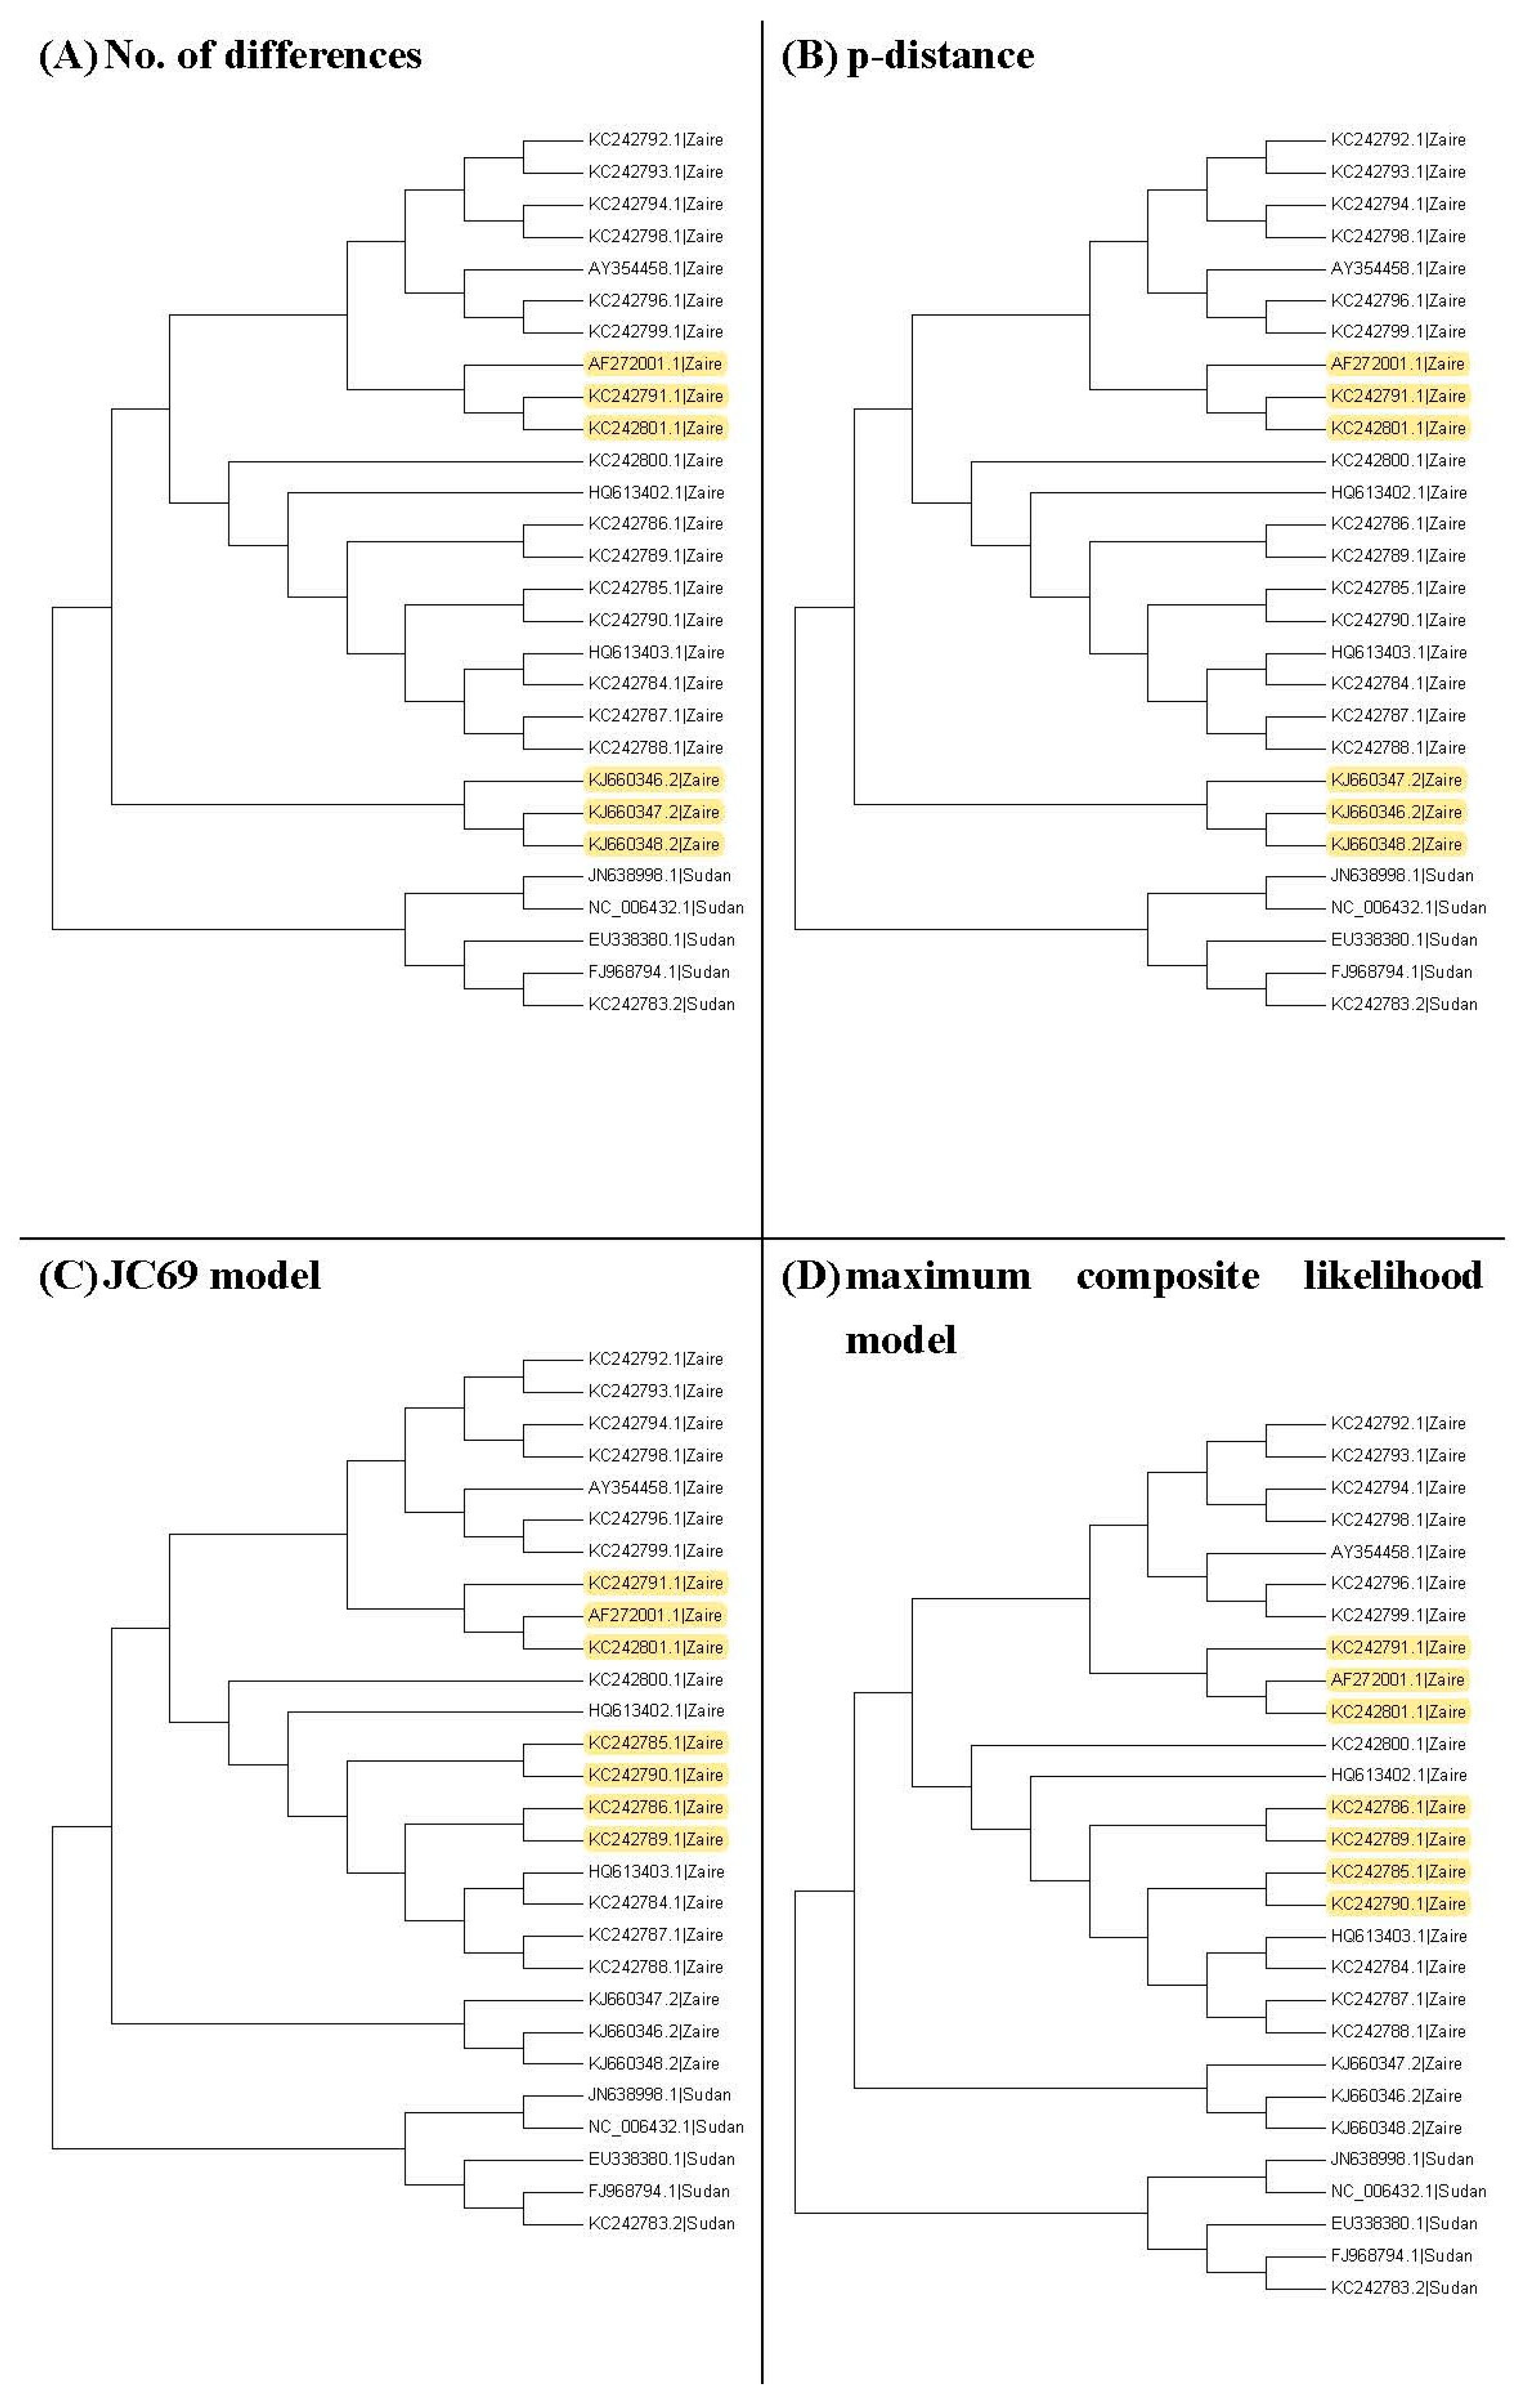
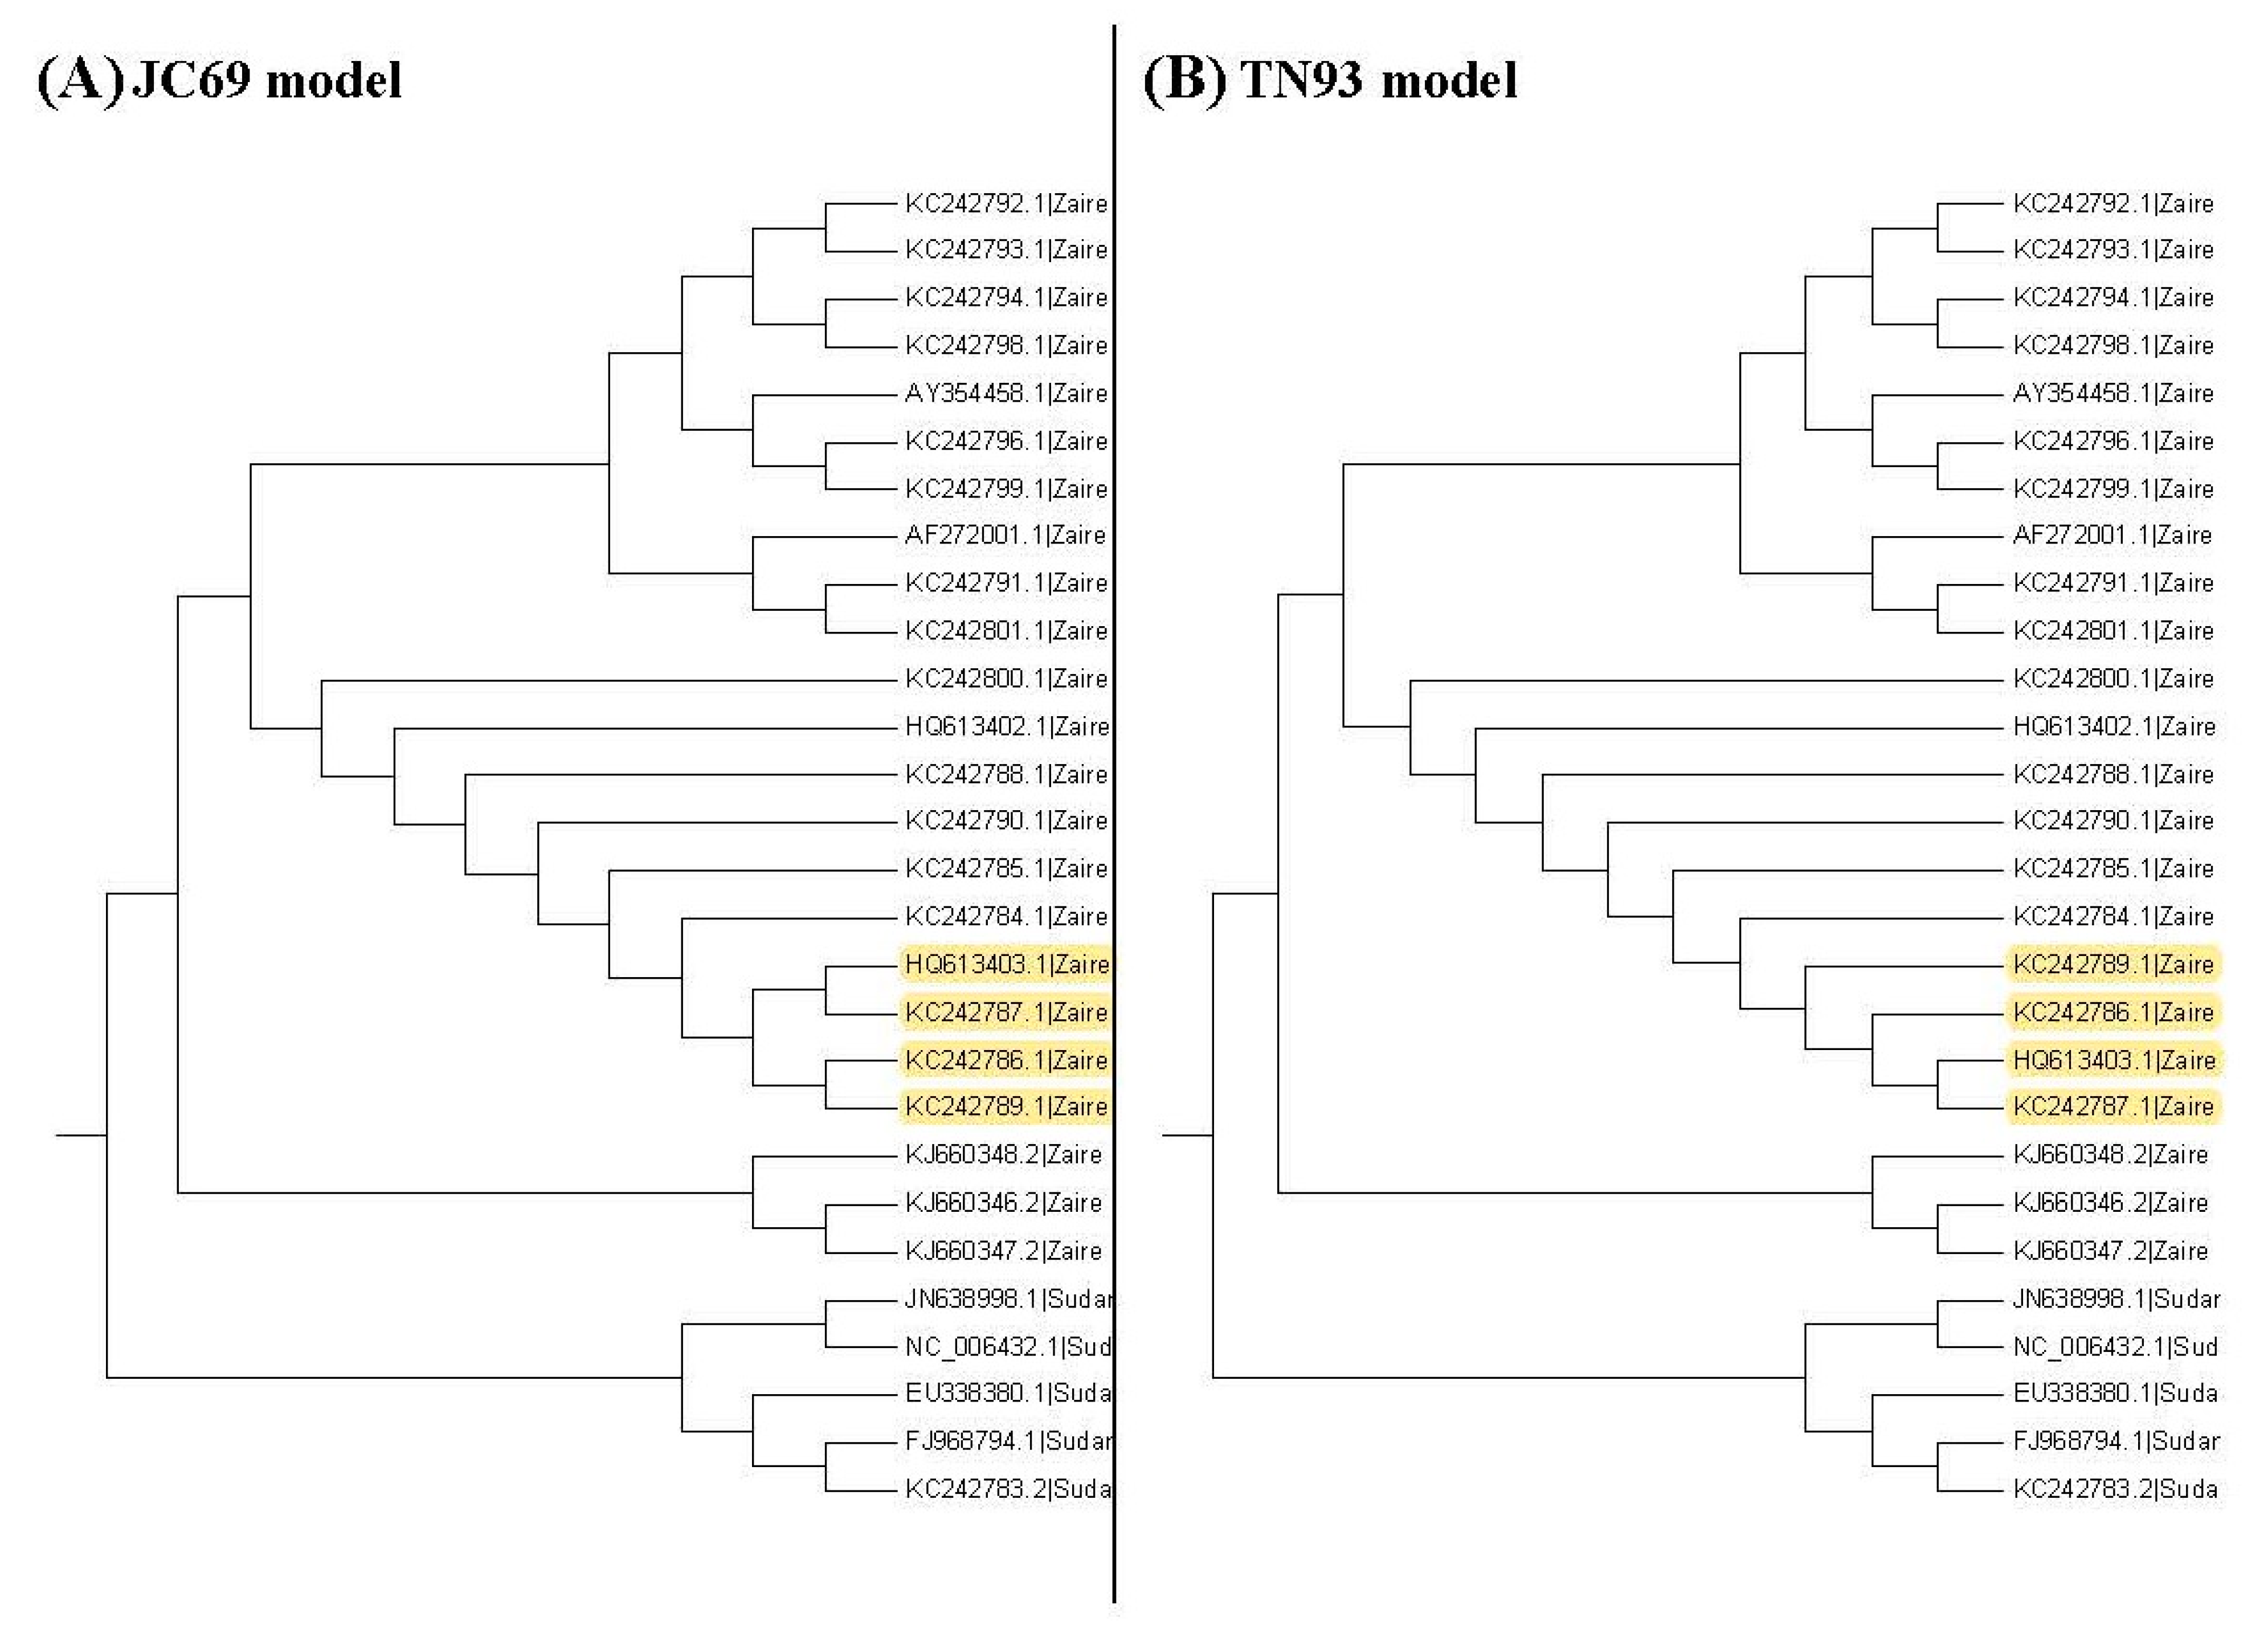
Figure 3, Figure 4 and Figure 5 show the maximum likelihood trees, neighbor-joining trees, and UPGMA trees plotted by MEGA 6 with distinct substitution models for these 28 Ebolaviruses. The maximum likelihood trees in Figure 3A–C are based on the JC69 model, K80 model, and Tamura 3-parameter model, respectively. The neighbor-joining trees in Figure 4A–D are based on the number of the differences between two sequences, the p-distance, JC69 model, and the maximum composite likelihood model, respectively. The UPGMA trees in Figure 5A,B are based on the JC69 model and TN93 model.
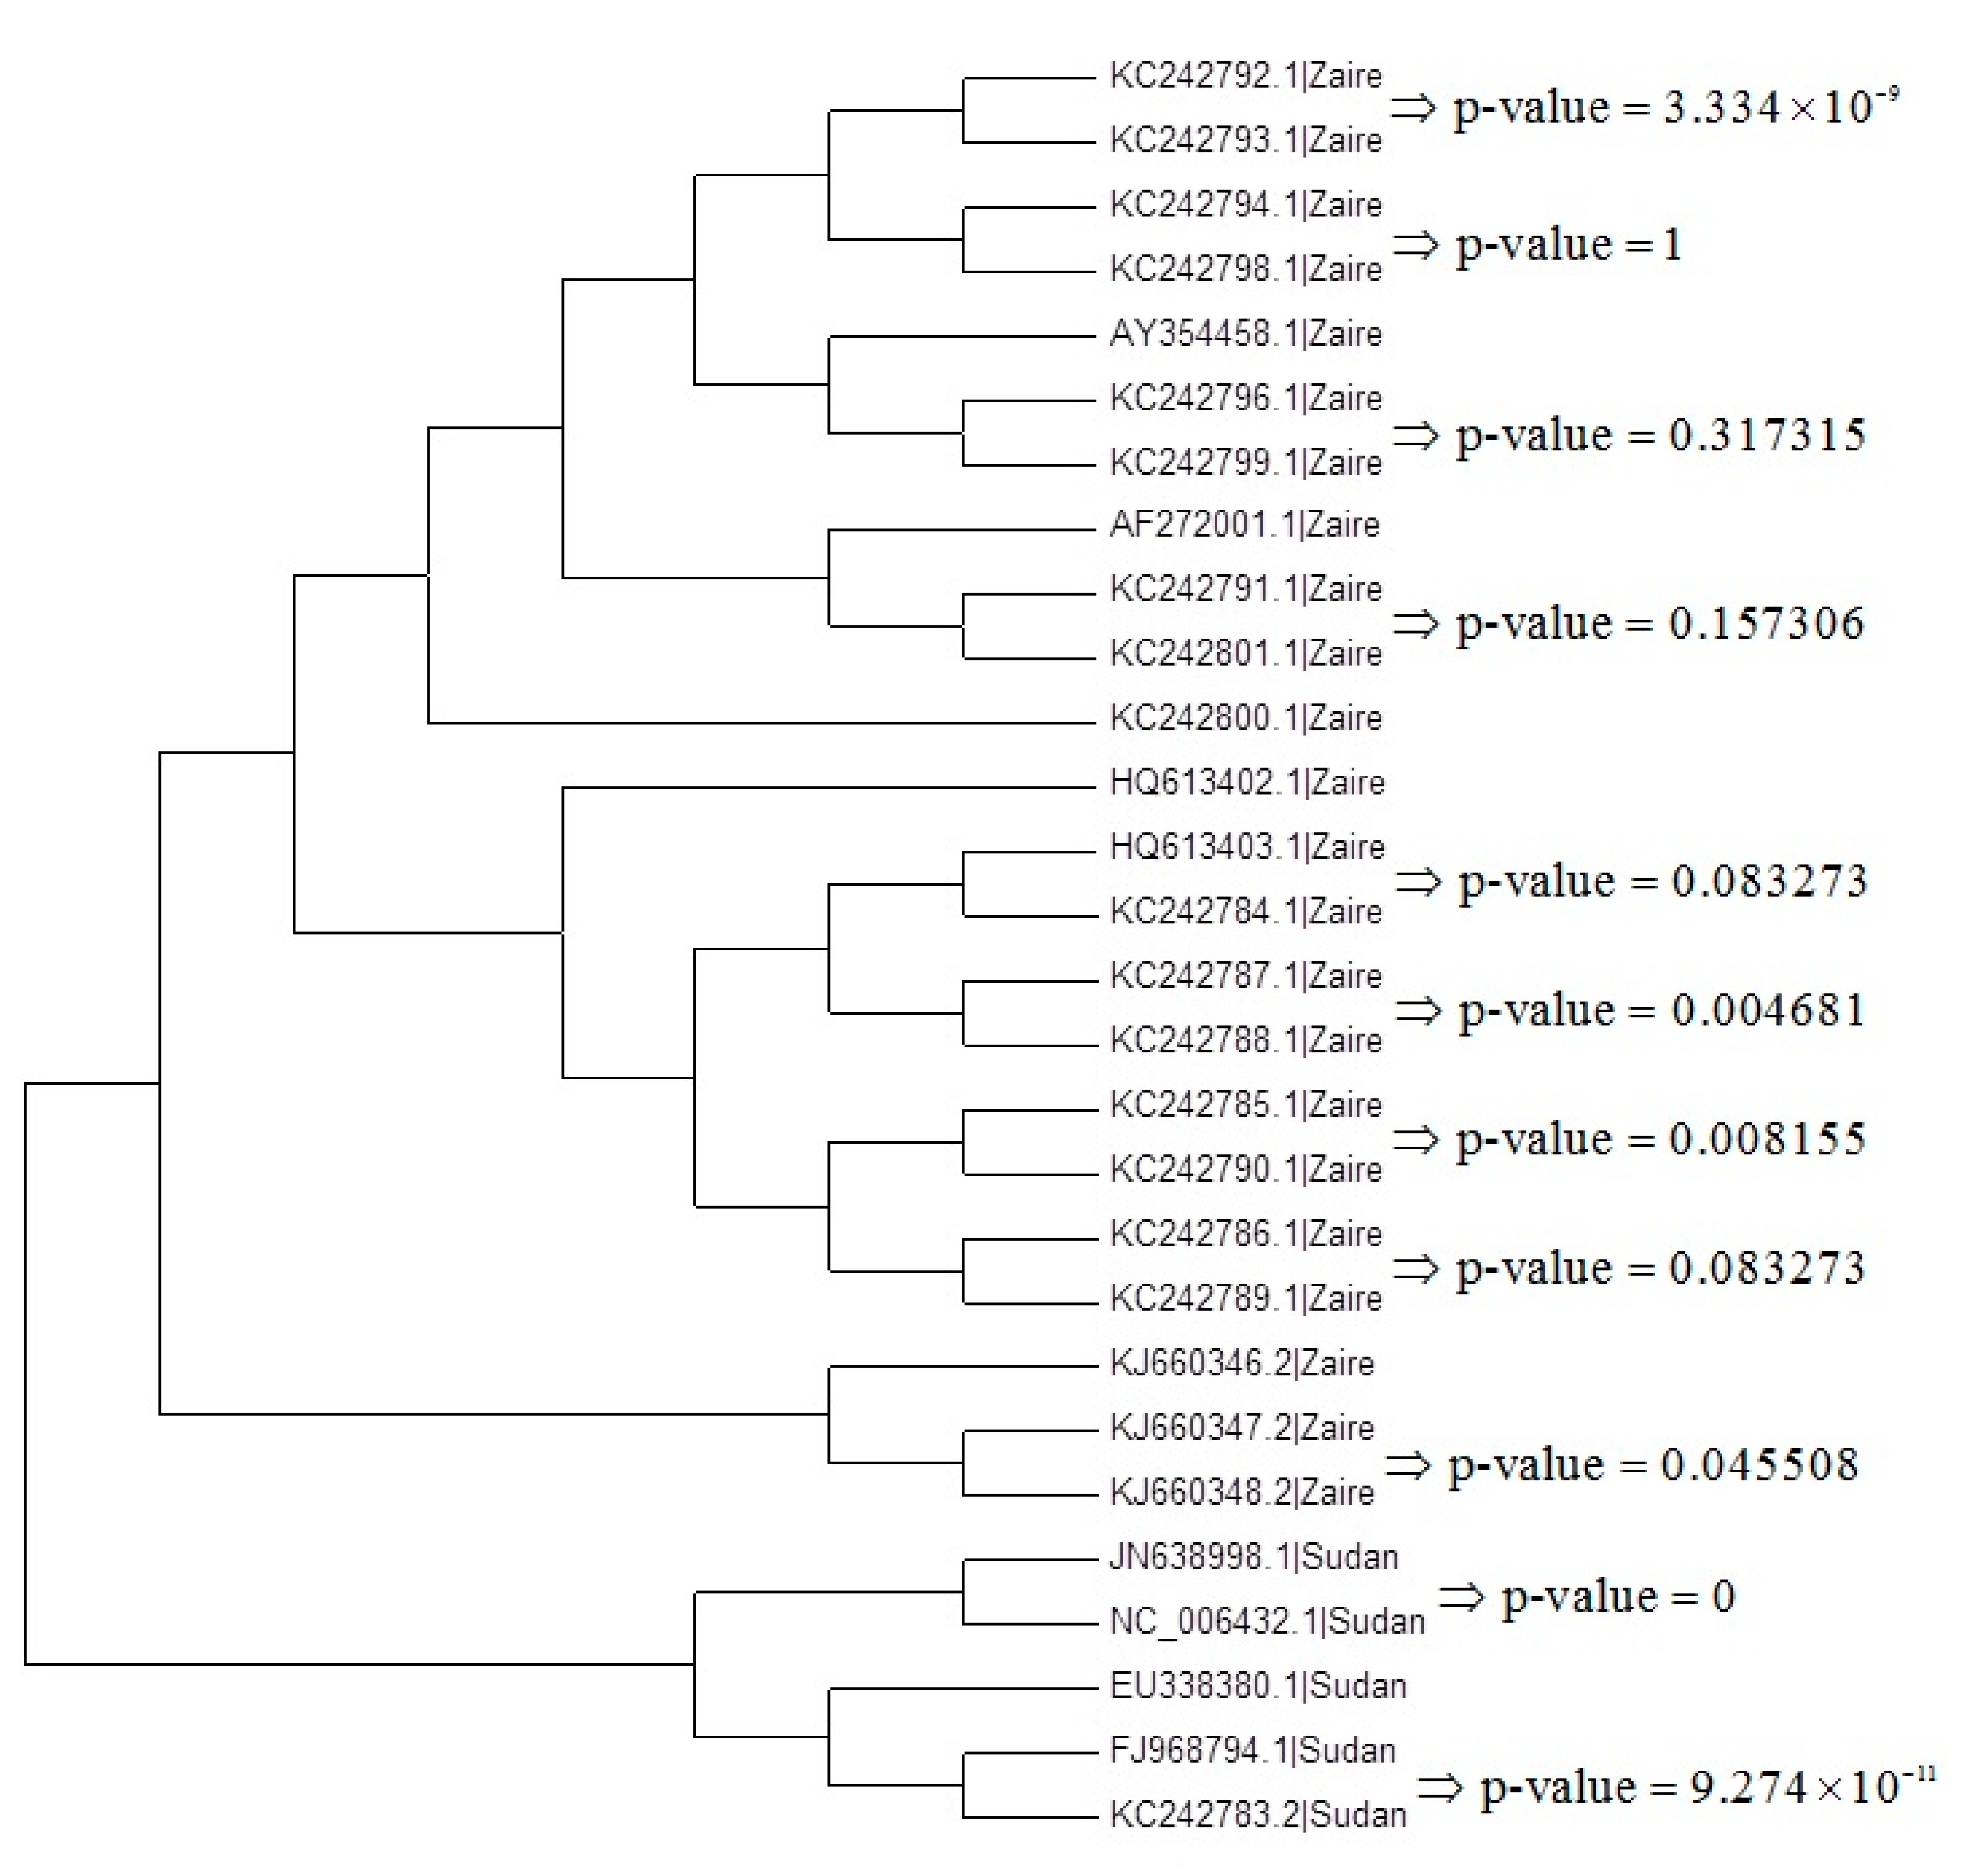
Here we follow Procedure 1 to choose the suitable tree and use the maximum likelihood tree based on the JC69 model as an example in Figure 6. We compute the p-values in all of the first clade. For example, Figure 6 shows the p-values of the first clade for the maximum likelihood tree based on the JC69 model.
After computing the p-values for all of the first clades, we can calculate the values that are provided in Table 1.
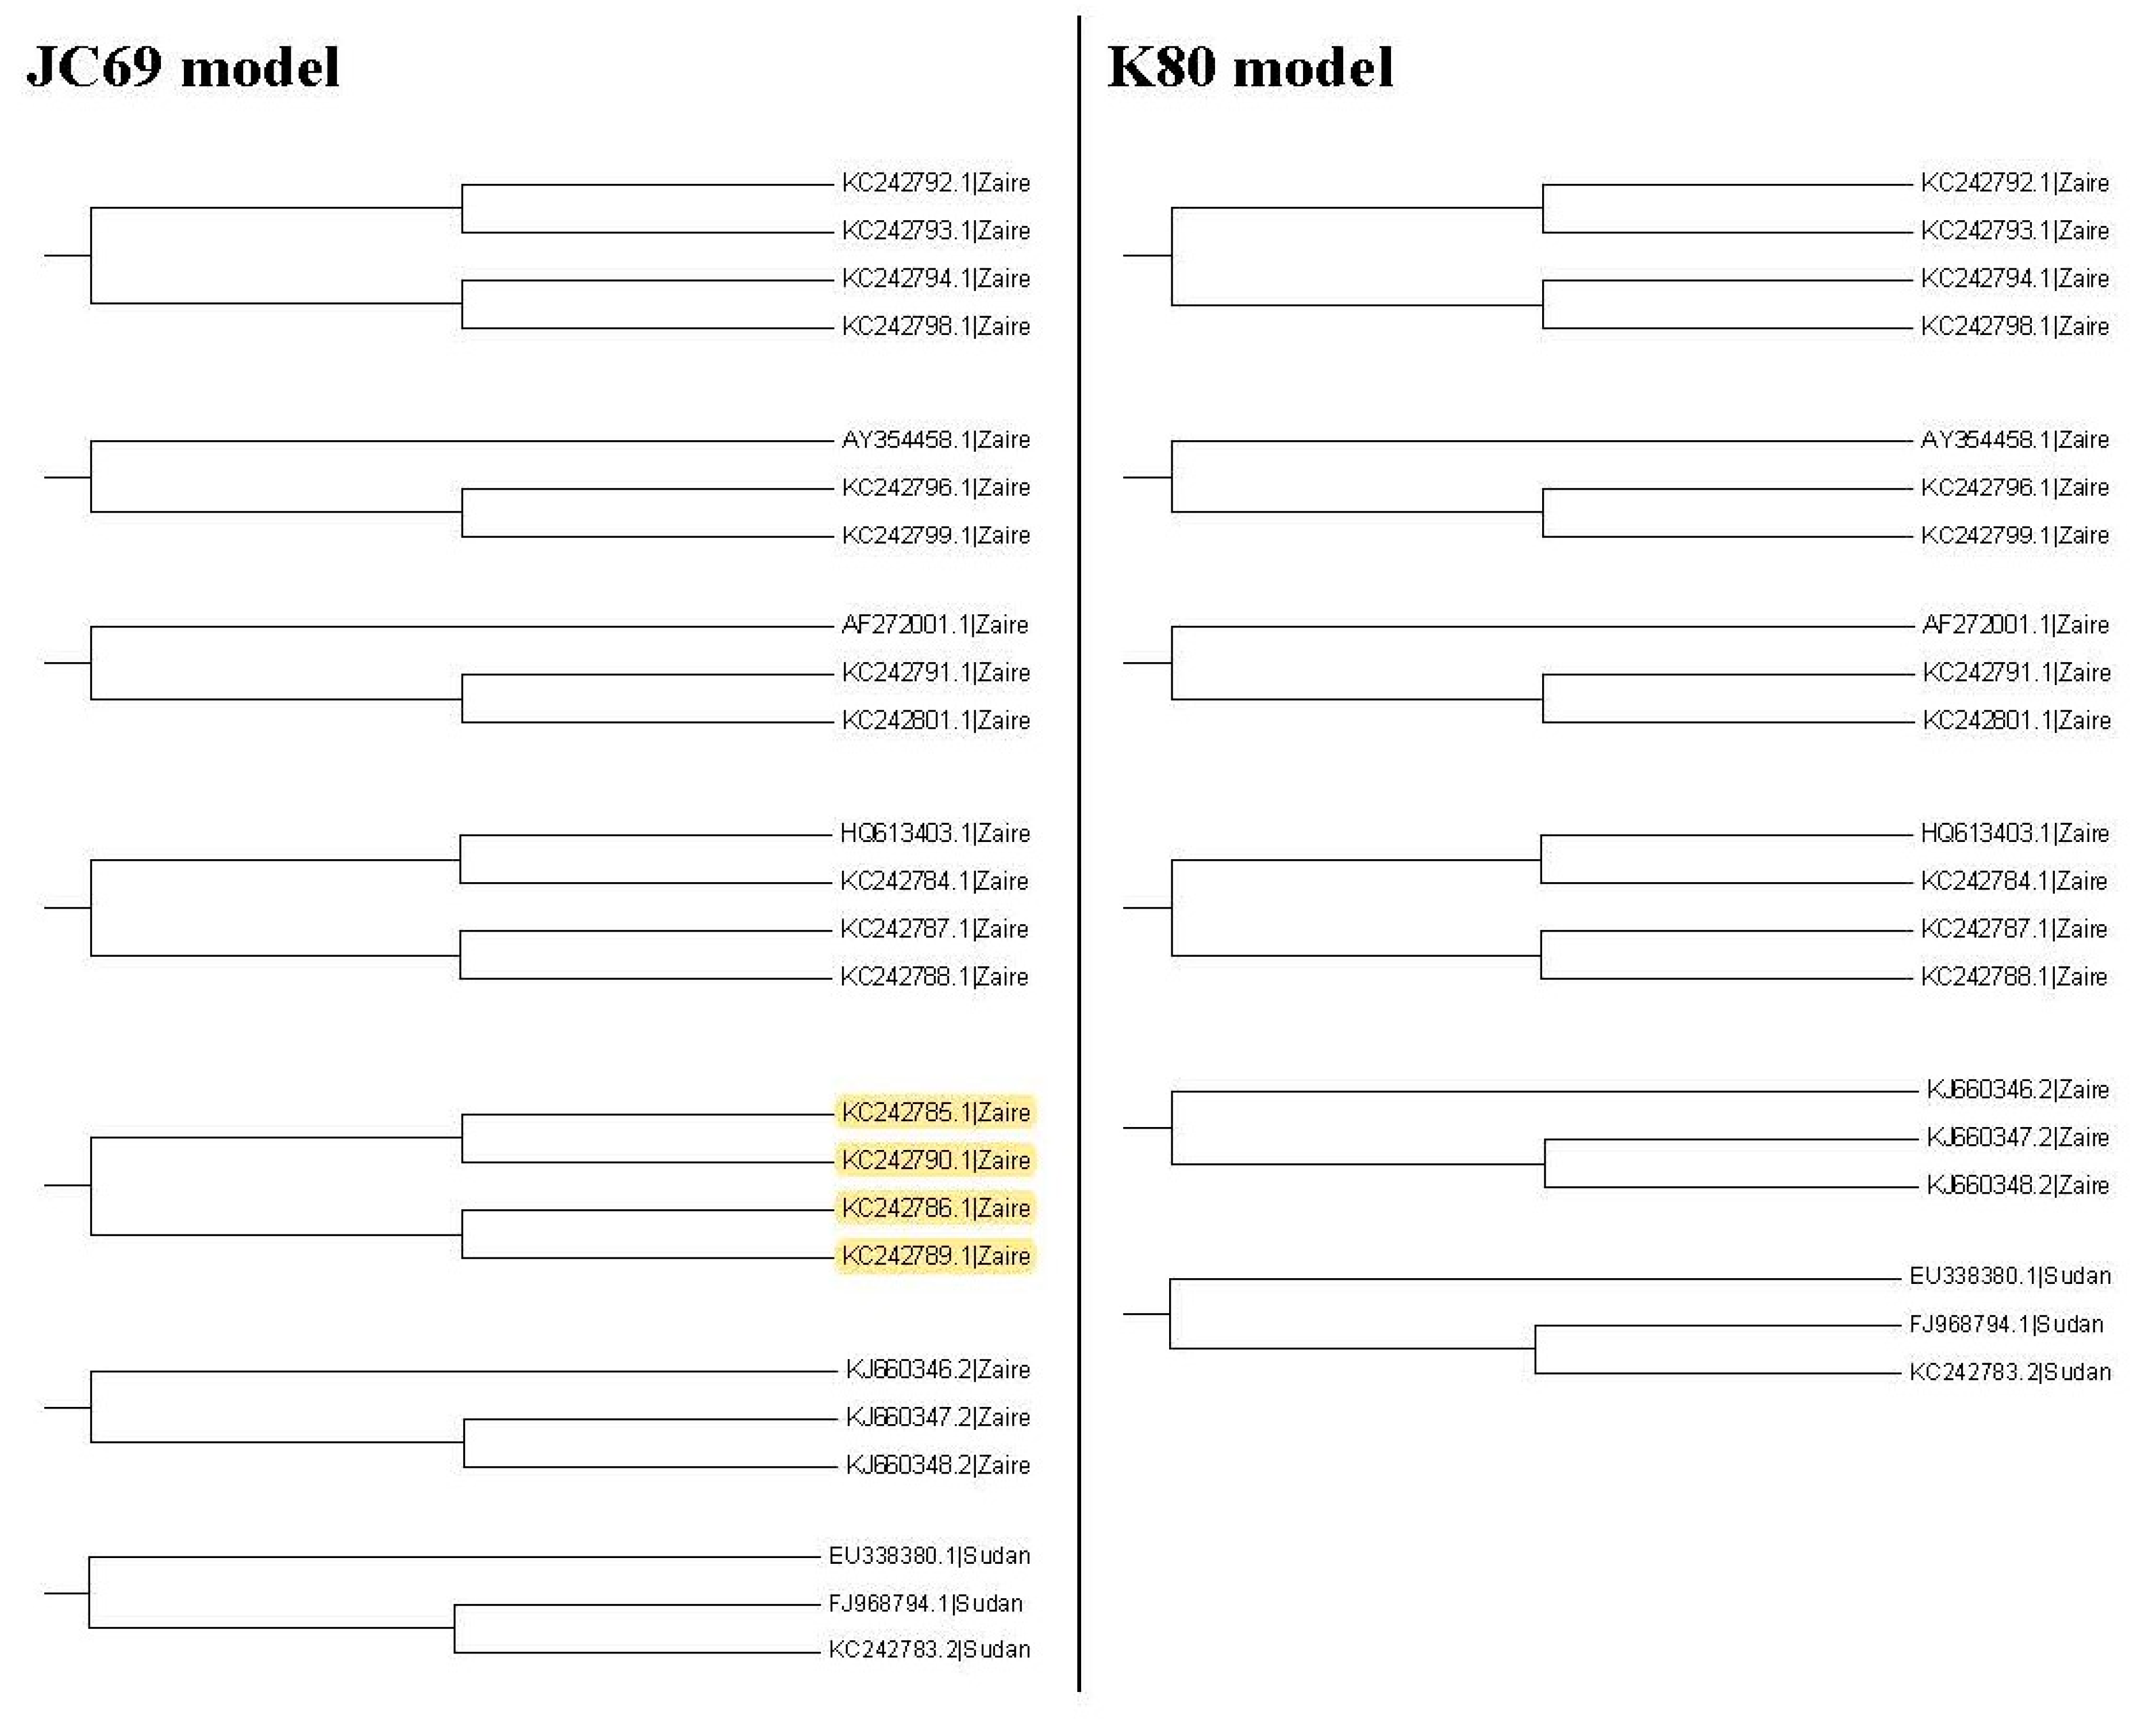
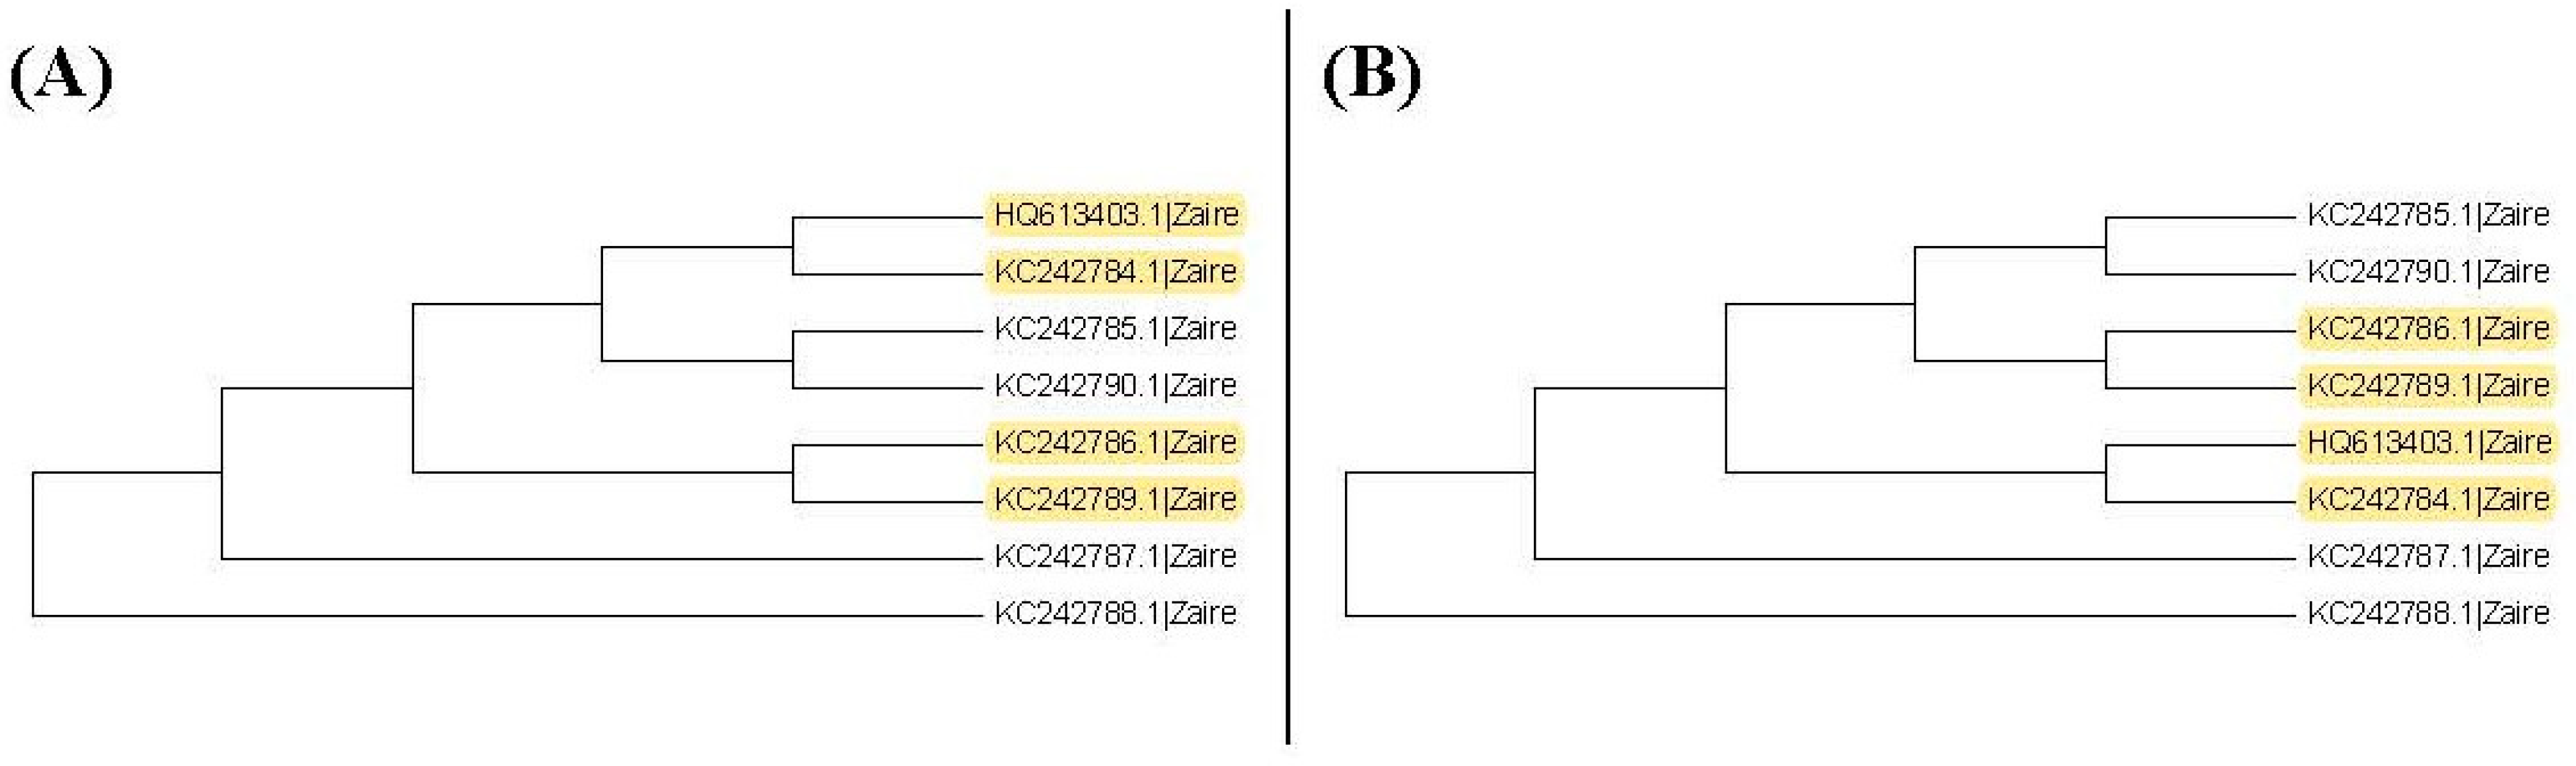
In this study, we consider several k values. For these k values, we find that the trees based on the JC69 model and K80 model have the minimum value of R(1,k). Therefore, according to the R(1,k) criterion, these two trees are desirable. We can further compare these two trees by using the R(2,k) criterion. Hence we further consider the second clades for these two trees. Figure 7 shows all the second clades for them. Then we find that the second clades are the same for these two trees except for one (marked with yellow color), which appears in the tree based on the JC69 model, but not in the tree based on the K80 model. In this case, according to the criterion, this method cannot be applied to compare the p-values in the second clade. The reason is that we need to compare the difference between these two trees in Figure 7. Only the subtree marked with the yellow color is the difference between these two trees. We can calculate for this subtree marked with the yellow color, but there is no corresponding subtree in the K80 model that we can calculate its value. Therefore, we cannot compare them for the second clade.
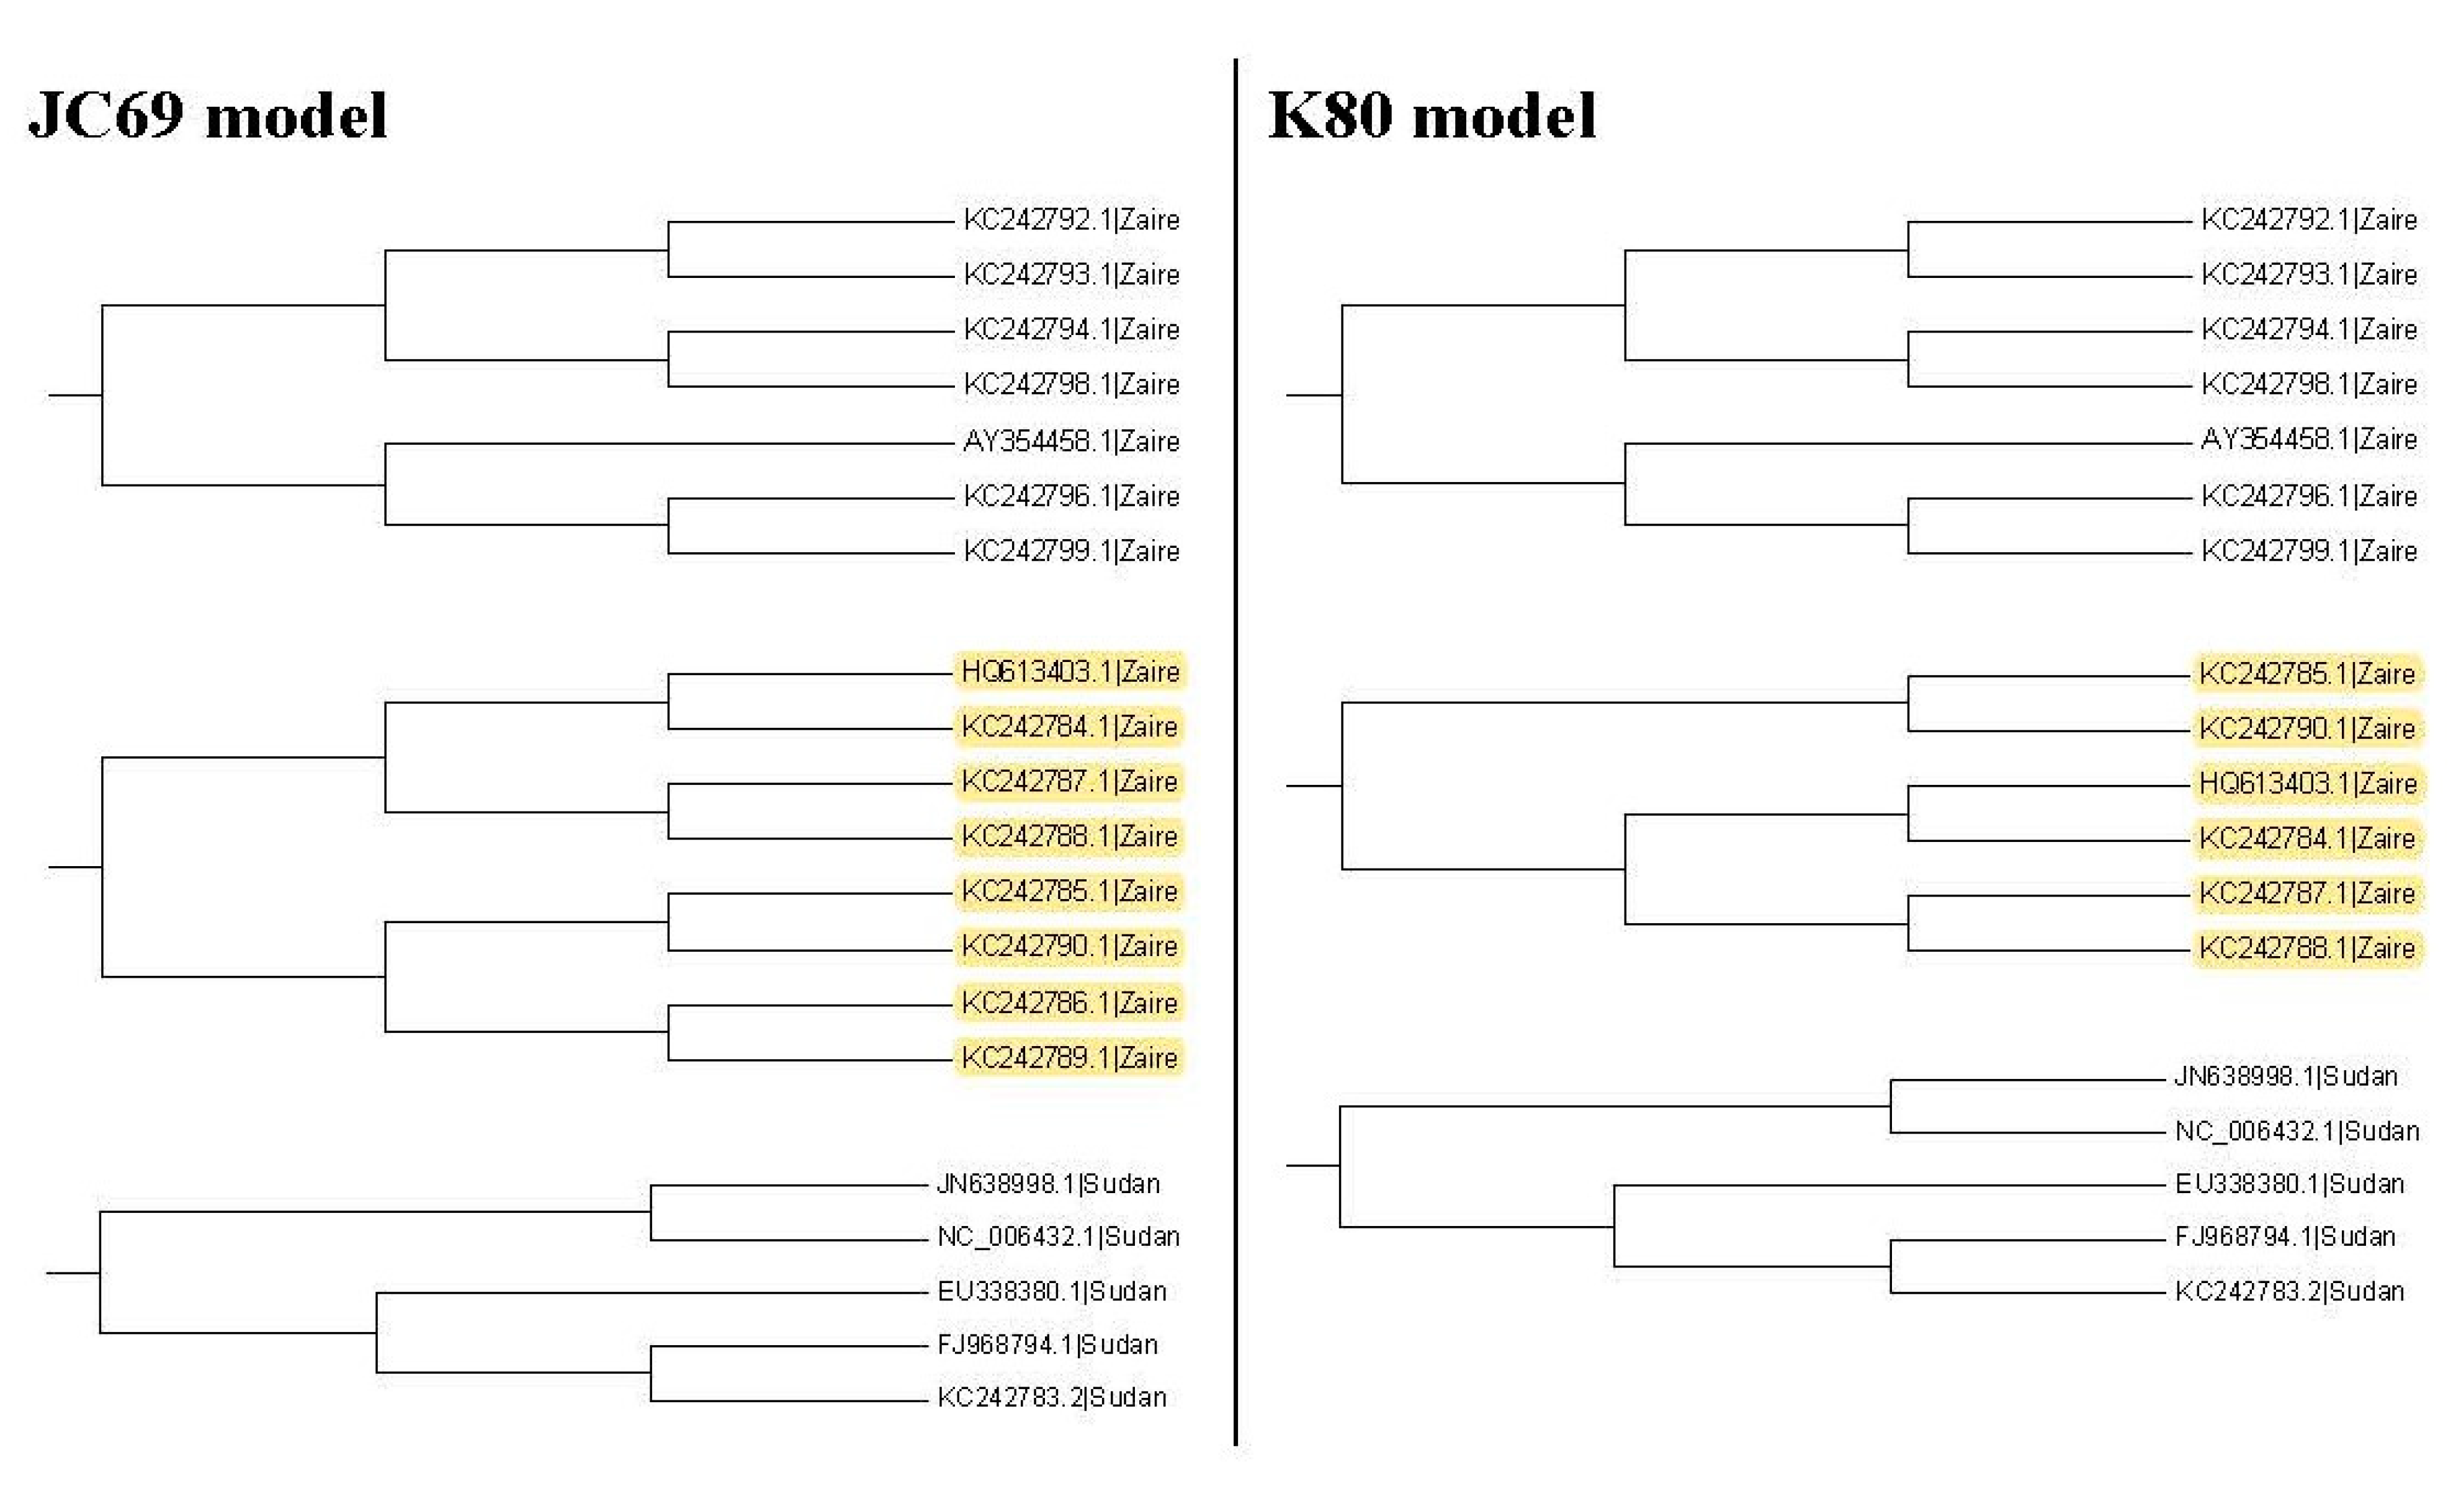
Thus, we go further to the third clades to compare these two trees. Figure 8 shows all the third clades for them and only one clade is different. Table 2 and Table 3 show the p-values for testing the nucleotide substitution numbers between sequences in the third clade for the maximum likelihood trees based on the JC69 model and the K80 model, respectively. Table 4 shows values for several thresholds . We find that the tree based on the JC69 model has the minimum value for these . Then, according to our method, this tree is the selected one.
In this example, we can see that the proposed method cannot be applied in the second clade. It is easier to calculate all of the p-values for the first clade. For the second or upper clades, it is not as easy as the case in the first clade to calculate all of the p-values. Therefore, in the second or upper clades, we can only consider comparing the p-values of the subtrees different in the clade. Therefore, when two trees do not have the same number of subtrees in the second or upper clade, it may not be possible to compare their p-values such as in the second clade in this example. In fact, in Step 3 of Procedure 1, we mention that the trees satisfying could be desired trees if we allow the selection of at least two trees. Therefore, only considering the criterion and allowing the selection of more than one tree might be an easy way to implement this method.
In this example, we consider 10 values in the range of (0, 0.1). In this case, we can observe the results for different values and make a more objective decision to select trees. For different values, the calculation of the values only requires counting the ratio of p-values less than . It does not have much calculation loading. If we do not have any preference in selecting , comparing the results for different could be a good way to select trees.
4. Discussion
It may not be easy to verify which type of phylogenetic tree is valid for analyzing real data. As a result, it is also hard to verify whether the trees selected by the proposed method are valid. Nevertheless, we use another viewpoint to state the advantage of this proposed method. The sequences, HQ613403.1, and KC242784.1 to KC242790.1, of the illustrated example are used to explain the rationality of our method. When we plot the neighbor-joining tree, nine substitution models can be chosen in MEGA 6. Among all models, the topology trees for the K80 model and Tamura 3-parameter model are the same as in Figure 9B and the topology trees for the other models are the same as in Figure 9A. For the maximum likelihood trees, the topology trees for all models are also the same as in Figure 9A. Therefore, we can say that the topology tree in Figure 9A is more suitable for these sequences.
Note that Figure 9A is the topology tree plotted by the substitution models: p-distance, JC69 model, Tajima Nei model, TN93 model, maximum composite likelihood model, and LogDet model. Figure 9B is the topology tree plotted by the K80 model and the Tamura 3-parameters model.
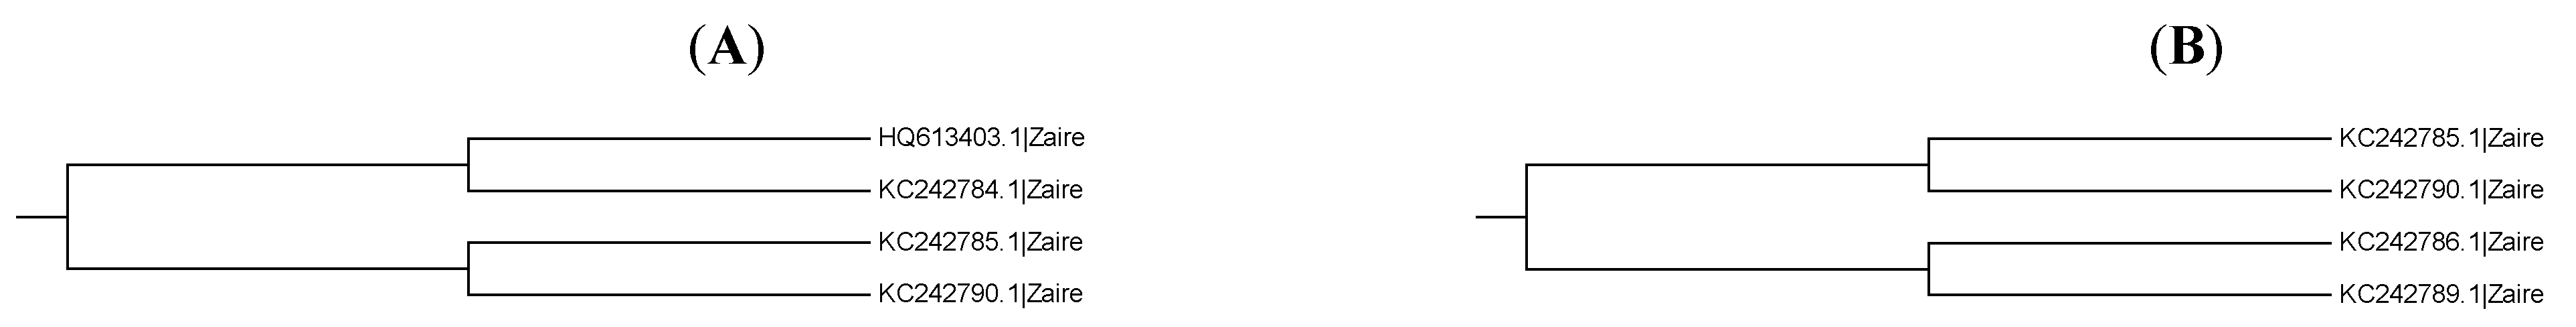
Now we follow our method to select the tree. Then we need to compare the first clades for these trees. Because the first clades are all the same for these trees, we cannot find a suitable tree from the first clades. Hence, we further consider the second clades for these two trees. Figure 10 shows the second clades for them. Table 5 and Table 6 show the p-values for testing the nucleotide substitution number between sequences in the second clade for the neighbor-joining tree based on the JC69 model and the K80 model, respectively. The number of p-values less than the threshold in the second clades for each tree is shown in Table 7. We can find that the tree constructed based on the JC69 model has the minimum number of p-values less than . Then, according to our method, we also choose Figure 9A to be the suitable tree for these sequences. Therefore, our method is reasonable for selecting a suitable tree.
5. Conclusions
There are many phylogenetic tree construction methods established in the literature such as the maximum likelihood, neighbor-joining, and UPGMA approaches. The topologies of different trees are not exactly the same. Even for the same method, the topologies of trees are different when they embed different nucleotide substitution models. In this study, we propose a methodology to choose a suitable tree. This methodology uses hypothesis testing to test the nucleotide substitution number between sequences and compute their p-values. An Ebolavirus example is used to illustrate this methodology. A subgroup of Ebolavirus sequences is also used to verify the proposed method. The result shows that the proposed method is a useful approach to choosing a suitable tree.
Author Contributions
Conceptualization, H.W.; methodology, W.C. and H.W.; analysis, W.C.; writing, W.C. and H.W. funding acquisition, H.W. All authors have read and agreed to the published version of the manuscript.
Funding
This work was supported by the Ministry of Science and Technology 109-2118-M-009-005-MY2, Taiwan.
Institutional Review Board Statement
Not applicable.
Data Availability Statement
Not applicable.
Acknowledgments
The authors thank Dwueng-Chwuan Jhwueng for his valuable comments and reviewers’ helpful comments.
Conflicts of Interest
The authors declare no conflict of interest.
References
- Graur, D.; Li, W. Molecular Evolution; Sinauer Associates: Sunderland, MA, USA, 1997. [Google Scholar]
- Wang, H. Predicting MicroRNA Biomarkers for Cancer Using Phylogenetic Tree and Microarray Analysis. Int. J. Mol. Sci. 2016, 17, 773. [Google Scholar] [CrossRef] [PubMed] [Green Version]
- Chen, Y.H.; Wang, H. The Association between Depression and Gastroesophageal Reflux based on Phylogenetic Analysis of miRNA Biomarkers. Curr. Med. Chem. 2020, 27, 6536–6547. [Google Scholar] [CrossRef] [PubMed]
- Wang, H. A protocol for investigating the association of vaccination and anti-NMDA receptor encephalitis. Front. Biosci. 2018, 10, 229–237. [Google Scholar] [CrossRef] [Green Version]
- Wang, H. Anti-NMDA Receptor Encephalitis and Vaccination. Int. J. Mol. Sci. 2017, 18, 193. [Google Scholar] [CrossRef] [PubMed] [Green Version]
- Wang, H. COVID-19, Anti-NMDA Receptor Encephalitis and MicroRNA. Front. Immunol. 2022, 13, 825103. [Google Scholar] [CrossRef] [PubMed]
- Felsenstein, J. Evolutionary trees from DNA sequences: A maximum likelihood approach. J. Mol. Evol. 1981, 17, 368–376. [Google Scholar] [CrossRef]
- Saitou, N.; Nei, M. The neighbor-joining method: A new method for reconstructing phylogenetic trees. J. Mol. Evol. 1987, 4, 406–425. [Google Scholar]
- Yang, Z. Computational Molecular Evolution; Oxford University Press: Oxford, UK, 2006. [Google Scholar]
- Posada, D.; Crandall, K. Felsenstein Phylogenetic Likelihood. J. Mol. Evol. 2021, 89, 134–145. [Google Scholar] [CrossRef]
- Tateno, Y.; Nei, M.; Tajima, F. Accuracy of estimated phylogenetic trees from molecular data. I. Distantly related species. J. Mol. Evol. 1982, 18, 387–404. [Google Scholar] [CrossRef]
- Felsenstein, J. Confidence-Limits on Phylogenies—An Approach Using the Bootstrap. Evolution 1985, 39, 783–791. [Google Scholar] [CrossRef]
- Kishino, H.; Hasegawa, M. Evaluation of the maximum likelihood estimate of the evolutionary tree topologies from DNA sequence data, and the branching order in Hominoidea. J. Mol. Evol. 1989, 29, 170–179. [Google Scholar] [CrossRef] [PubMed]
- Vuong, Q.H. Likelihood ratio tests for model selection and non-nested hypotheses. Econometrica 1989, 57, 307–333. [Google Scholar] [CrossRef] [Green Version]
- Shimodaira, H. An approximately unbiased test of phylogenetic tree selection. Syst. Biol. 2002, 51, 492–508. [Google Scholar] [CrossRef] [PubMed] [Green Version]
- Wang, H.Y.; Hung, S.L. Phylogenetic tree selection by the adjusted k-means approach. J. Appl. Stat. 2012, 39, 643–655. [Google Scholar] [CrossRef]
- Jukes, T.H.; Cantor, C.R. Evolution of protein molecules. Mamm. Protein Metab. 1969, 3, 21–132. [Google Scholar]
- Kimura, M. A Simple Method for Estimating Evolutionary Rates of Base Substitutions through Comparative Studies of Nucleotide-Sequences. J. Mol. Evol. 1980, 16, 111–120. [Google Scholar] [CrossRef]
- Felsenstein, J. Distance Methods for Inferring Phylogenies: A Justification. Evolution 1984, 38, 16–24. [Google Scholar] [CrossRef]
- Hasegawa, M.; Kishino, H.; Yano, T. Dating of the human-ape splitting by a molecular clock of mitochondrial DNA. J. Mol. Evol. 1985, 22, 160–174. [Google Scholar] [CrossRef]
- Tamura, K.; Nei, M. Estimation of the number of nucleotide substitutions in the control region of mitochondrial DNA in humans and chimpanzees. Mol. Biol. Evol. 1993, 10, 512–526. [Google Scholar]
- Tajima, F.; Nei, M. Biases of the estimates of DNA divergence obtained by the restriction enzyme technique. J. Mol. Evol. 1982, 18, 115–120. [Google Scholar] [CrossRef]
- Tateno, Y.; Takezaki, N.; Nei, M. Relative efficiencies of the maximum-likelihood, neighbor-joining, and maximum-parsimony methods when substitution rate varies with site. Mol. Biol. Evol. 1994, 11, 261–277. [Google Scholar] [PubMed]
- Wang, H.Y.; Tzeng, Y.H.; Li, W.H. Improved variance estimators for one- and two-parameter models of nucleotide substitution. J. Theor. Biol. 2008, 254, 164–167. [Google Scholar] [CrossRef] [PubMed] [Green Version]
- Wang, H. Confidence intervals for the substitution number in the nucleotide substitution models. Mol. Phylogenet. Evol. 2011, 60, 472–479. [Google Scholar] [CrossRef] [PubMed]
- Chen, W.; Wang, H. Variance estimation for nucleotide substitution models. Mol. Phylogenet. Evol. 2015, 90, 97–103. [Google Scholar] [CrossRef] [PubMed]
- Tamura, K.; Stecher, G.; Peterson, D.; Filipski, A.; Kumar, S. MEGA6: Molecular Evolutionary Genetics Analysis version 6.0. Mol. Biol. Evol. 2013, 30, 2725–2729. [Google Scholar] [CrossRef] [Green Version]
- Kuhn, J.H.; Becker, S.; Ebihara, H.; Geisbert, T.; Johnson, K.; Kawaoka, Y.; Lopkin, W.; Negredo, A.; Netesov, S.; Nichol, S.; et al. Proposal for a revised taxonomy of the family Filoviridae: Classification, names of taxa and viruses, and virus abbreviations. Arch. Virol. 2010, 155, 2083–2103. [Google Scholar] [CrossRef] [Green Version]
Figure 1.
Two phylogenetic trees showing first clades (A) and second clades (B).

Figure 2.
The flowchart of Procedure 1.

Figure 3.
The maximum likelihood trees for the 28 Ebolavirus sequences based on the JC69 model, K80 model, and Tamura 3-parameter model. Yellow color: difference.
Figure 3.
The maximum likelihood trees for the 28 Ebolavirus sequences based on the JC69 model, K80 model, and Tamura 3-parameter model. Yellow color: difference.

Figure 4.
The neighbor-joining trees for the 28 Ebolavirus sequences. Yellow color: difference.

Figure 5.
The UPGMA trees for the Ebolavirus sequences. Yellow color: difference.

Figure 6.
The p-values for testing the nucleotide substitution number between sequences in the first clades for the maximum likelihood tree based on the JC69 model.
Figure 6.
The p-values for testing the nucleotide substitution number between sequences in the first clades for the maximum likelihood tree based on the JC69 model.

Figure 7.
The second clades for the maximum likelihood trees based on the JC69 model and the K80 model. Yellow color: difference.
Figure 7.
The second clades for the maximum likelihood trees based on the JC69 model and the K80 model. Yellow color: difference.

Figure 8.
The third clades for the maximum likelihood trees based on the JC69 model and the K80 model. Yellow color: difference.
Figure 8.
The third clades for the maximum likelihood trees based on the JC69 model and the K80 model. Yellow color: difference.

Figure 9.
The neighbor-joining trees for the subgroup of ebolavirus sequences. Yellow color: difference. (A) Other models exclude K80 model and the Tamura 3-parameters model; (B) K80 model and the Tamura 3-parameters model.
Figure 9.
The neighbor-joining trees for the subgroup of ebolavirus sequences. Yellow color: difference. (A) Other models exclude K80 model and the Tamura 3-parameters model; (B) K80 model and the Tamura 3-parameters model.

Figure 10.
(A) The second clade for the tree in Figure 9A; (B) The second clade for the tree in Figure 9B.


Table 1.
The values for phylogenetic trees.
| Substitution Model | 0.01 | 0.02 | 0.03 | 0.04 | 0.05 | 0.06 | 0.07 | 0.08 | 0.09 | 0.1 | |
|---|---|---|---|---|---|---|---|---|---|---|---|
| Maximum likelihood | JC69 model | ||||||||||
| K80 model | |||||||||||
| Tamura 3-parameter model | |||||||||||
| Neighbor- joining | No. of differences | ||||||||||
| p-distance | |||||||||||
| JC69 model | |||||||||||
| Maximum composite likelihood | |||||||||||
| UPGMA | JC69 model | ||||||||||
| TN93 model | |||||||||||
Table 2.
The p-values for testing the nucleotide substitution number between sequences in the third clade for the maximum likelihood tree based on the JC69 model.
Table 2.
The p-values for testing the nucleotide substitution number between sequences in the third clade for the maximum likelihood tree based on the JC69 model.
| HQ613403.1|Zaire | KC242784.1|Zaire | KC242787.1|Zaire | KC242788.1|Zaire | |
|---|---|---|---|---|
| KC242785.1|Zaire | ||||
| KC242790.1|Zaire | ||||
| KC242786.1|Zaire | ||||
| KC242789.1|Zaire |
Table 3.
The p-values for testing the nucleotide substitution number between sequences in the third clade for the maximum likelihood tree based on the K80 model.
Table 3.
The p-values for testing the nucleotide substitution number between sequences in the third clade for the maximum likelihood tree based on the K80 model.
| HQ613403.1|Zaire | KC242784.1|Zaire | KC242787.1|Zaire | KC242788.1|Zaire | |
|---|---|---|---|---|
| KC242785.1|Zaire | ||||
| KC242790.1|Zaire |
Table 4.
The values for the maximum likelihood tree. The difference between these two models is marked by the red color in the JC69 model.
Table 4.
The values for the maximum likelihood tree. The difference between these two models is marked by the red color in the JC69 model.
| Substitution Model | 0.01 | 0.02 | 0.03 | 0.04 | 0.05 | 0.06 | 0.07 | 0.08 | 0.09 | 0.1 |
|---|---|---|---|---|---|---|---|---|---|---|
| JC69 model | ||||||||||
| K80 model | ||||||||||
Table 5.
The p-values for testing the nucleotide substitution number between sequences in the second clade for the tree in Figure 9A.
Table 5.
The p-values for testing the nucleotide substitution number between sequences in the second clade for the tree in Figure 9A.
| HQ613403.1|Zaire | KC242784.1|Zaire | |
|---|---|---|
| KC242785.1|Zaire | ||
| KC242790.1|Zaire |
Table 6.
The p-values for testing the nucleotide substitution number between sequences in the second clade for the tree in Figure 9B.
Table 6.
The p-values for testing the nucleotide substitution number between sequences in the second clade for the tree in Figure 9B.
| KC242786.1|Zaire | KC242789.1|Zaire | |
|---|---|---|
| KC242785.1|Zaire | ||
| KC242790.1|Zaire |
Table 7.
The numbers of p-values less than in the second clade for the trees in Figure 9. The difference between these two models is marked by the red color in the JC69 model.
Table 7.
The numbers of p-values less than in the second clade for the trees in Figure 9. The difference between these two models is marked by the red color in the JC69 model.
| Substitution Model | 0.01 | 0.02 | 0.03 | 0.04 | 0.05 | 0.06 | 0.07 | 0.08 | 0.09 | 0.1 | |
|---|---|---|---|---|---|---|---|---|---|---|---|
| Neighbor- joining | JC69 model | ||||||||||
| K80 model | |||||||||||
Publisher’s Note: MDPI stays neutral with regard to jurisdictional claims in published maps and institutional affiliations. |
© 2022 by the authors. Licensee MDPI, Basel, Switzerland. This article is an open access article distributed under the terms and conditions of the Creative Commons Attribution (CC BY) license (https://creativecommons.org/licenses/by/4.0/).
Share and Cite
MDPI and ACS Style
Chen, W.; Wang, H. Phylogenetic Tree Selection by Testing Substitution Number in Clade. Diversity 2022, 14, 543. https://doi.org/10.3390/d14070543
AMA Style
Chen W, Wang H. Phylogenetic Tree Selection by Testing Substitution Number in Clade. Diversity. 2022; 14(7):543. https://doi.org/10.3390/d14070543
Chicago/Turabian StyleChen, Weishan, and Hsiuying Wang. 2022. "Phylogenetic Tree Selection by Testing Substitution Number in Clade" Diversity 14, no. 7: 543. https://doi.org/10.3390/d14070543
Note that from the first issue of 2016, this journal uses article numbers instead of page numbers. See further details here.