Article

Seasonal Shifts in the Morphological Traits of Bloom-Forming Cyanobacteria in Lake Chaohu, China

1
State Key Laboratory of Lake Science and Environment, Nanjing Institute of Geography and Limnology, Chinese Academy of Sciences, Beijing East Road 73, Nanjing 210008, China
2
Nanjing School, University of Chinese Academy of Sciences, Tianquan Road 188, Nanjing 100049, China
3
Jiangsu Key Laboratory for Eco-Agriculture Biotechnology around Hongze Lake, Jiangsu Collaborative Innovation Center of Regional Modern Agriculture and Environmental Protection, Huaiyin Normal University, Huaian 223309, China
*
Author to whom correspondence should be addressed.
Diversity 2022, 14(6), 435; https://doi.org/10.3390/d14060435
Submission received: 7 May 2022 / Revised: 25 May 2022 / Accepted: 28 May 2022 / Published: 29 May 2022
(This article belongs to the Special Issue Diversity and Ecology of Algae in China)

Abstract

:
Harmful cyanobacterial blooms in eutrophic water bodies pose a major threat to the environment and to human health. The morphological functional traits of cyanobacteria play important roles in maintaining their competitive advantages. To explore the regulatory mechanisms of the morphological functional traits of different bloom-forming cyanobacteria, we performed a one-year-long phytoplankton survey from November 2016 to October 2017 in Lake Chaohu, China. The colony size and cell diameter of the dominant cyanobacteria were measured, and their relationships were analyzed. The results showed that Dolichospermum flos-aquae and Microcystis aeruginosa were the dominant cyanobacteria in the lake. Microcystis was the dominant species during the summer; the growth of Dolichospermum growth surpassed that of Microcystis, and Dolichospermum became the dominant species in the late autumn, winter and spring. From winter to spring, the colony size of Dolichospermum decreased from 222.25 μm to 10.51 μm, and the individual cell diameter increased from 6.5 μm to 7.4 μm. From summer to autumn, Dolichospermum showed enlarged colony sizes and reduced cell diameters. The Microcystis colony size increased from 83.71 μm in the spring to 196.71 μm in the summer and autumn, while cells diameter remained essentially at 3–4 μm from March to October in Lake Chaohu. The relationship between colony size and cell diameter in Dolichospermum was significantly positive, while that of Microcystis was not significant. These results suggest that Dolichospermum may maintain biomass through a trade-off between cell diameter and colony size, and that a flexible morphological regulatory mechanism exists. This study seeks to improve our understanding of how bloom-forming cyanobacteria maintain their dominance by regulating their morphological traits.

1. Introduction

Cyanobacterial blooms are a major global problem that affects water quality and aquatic organisms, as well as animals and humans, by producing cyanotoxins and different malodorous compounds. The formation and maintenance of cyanobacterial blooms are considered to be a synergistic result of their internal physiological and morphological features and external driving forces, i.e., nutrients, temperature, and underwater available light [1]. When the external driving forces change, the regulation of functional traits in these cyanobacteria may play an important role in the maintenance of blooms, e.g., through trade-offs in morphological traits. However, our understanding of the trade-offs in terms of the morphological traits of these bloom-forming cyanobacteria is limited.
In some eutrophic lakes, cyanobacterial biomasses were found to be insensitive or lagged in response to a decrease in nutrient levels [2,3,4]. Factors related to global changes are usually considered to be the main variables regulating their responses. Moreover, the relative importance of these factors in promoting cyanobacteria is taxon dependent [5,6]. In addition to external environmental factors, the functional traits of bloom-forming cyanobacteria may also contribute to their responses. Functional traits have been shown to be effective factors that drive the response of these cyanobacteria to changes in nutrients or in variables related to global changes [7]. In particular, cyanobacteria can modify their morphological functional traits to adapt to environmental changes and maintain their biomass [8].
In recent years, much effort has been directed toward functional trait-based approaches to community ecology in order to elucidate the ecological mechanisms of phytoplankton community succession and biomass maintenance. Trade-offs between functional characteristics, such as the trade-off between growth rate and cell size of the red tide alga Alexandrina, have been shown to play an important role in biomass maintenance [9]. A growing number of studies have focused on the trade-offs between functional traits of phytoplankton. A study in Bodensee Lake found that there were distinct trade-offs between defense and growth speed for phytoplankton, which is called the defense–growth trade-off. Defense and growth rate represent key characteristics of Bodensee phytoplankton; their defense and growth rate of change can effectively prevent competitive exclusion [10]. Li et al. studied the effects of temperature and macronutrients on phytoplankton colonies in three different lakes and analyzed the spatiotemporal trade-off characteristics of temperature, eutrophication and cyanobacterial growth in different lakes during different periods. The study showed that Microcystis benefited directly from climate warming and eutrophication, which reveals the mechanisms for spatiotemporal trade-offs [11]. Among bloom-forming cyanobacteria, Dolichospermum and Microcystis can regulate their morphological characteristics, such as cell diameter and chain length, and their photosynthetic characteristics to maintain their growth and biomass, which indicates that trade-offs among the traits may play important roles in the maintenance of cyanobacterial blooms [8].
Colony formation is often thought of as a passive aggregation of individual cells driven by cell adhesion and as an effective way to reduce predation risk [12,13]. The competitive advantage of cyanobacteria is attributed to their ability to migrate rapidly through the water column by virtue of their buoyancy. In addition, they achieve high resistance to zooplankton predation by forming large colonies [14]. Floating colonies can efficiently harvest light and store nutrients at specific depths [15]. Cell diameter is likely to directly affect colony size [16]. The cell diameter and colony size of cyanobacteria show seasonal changes. The effect of these changes on the maintenance of the cyanobacterial biomass is unclear, and the trade-offs between cell diameter and colony size have not been fully studied [17].
In this study, we hypothesized that bloom-forming cyanobacteria could regulate their individual diameters and colony sizes to maintain their competitive advantages, which could be a mechanism driving the maintenance of cyanobacterial blooms. To explore the spatiotemporal transformation processes of different dominant cyanobacteria and their trade-off mechanisms, we conducted a one-year-long survey in Lake Chaohu to analyze the seasonal and spatial variations in the phytoplankton community and the relationship between individual diameter and colony size.

2. Materials and Methods
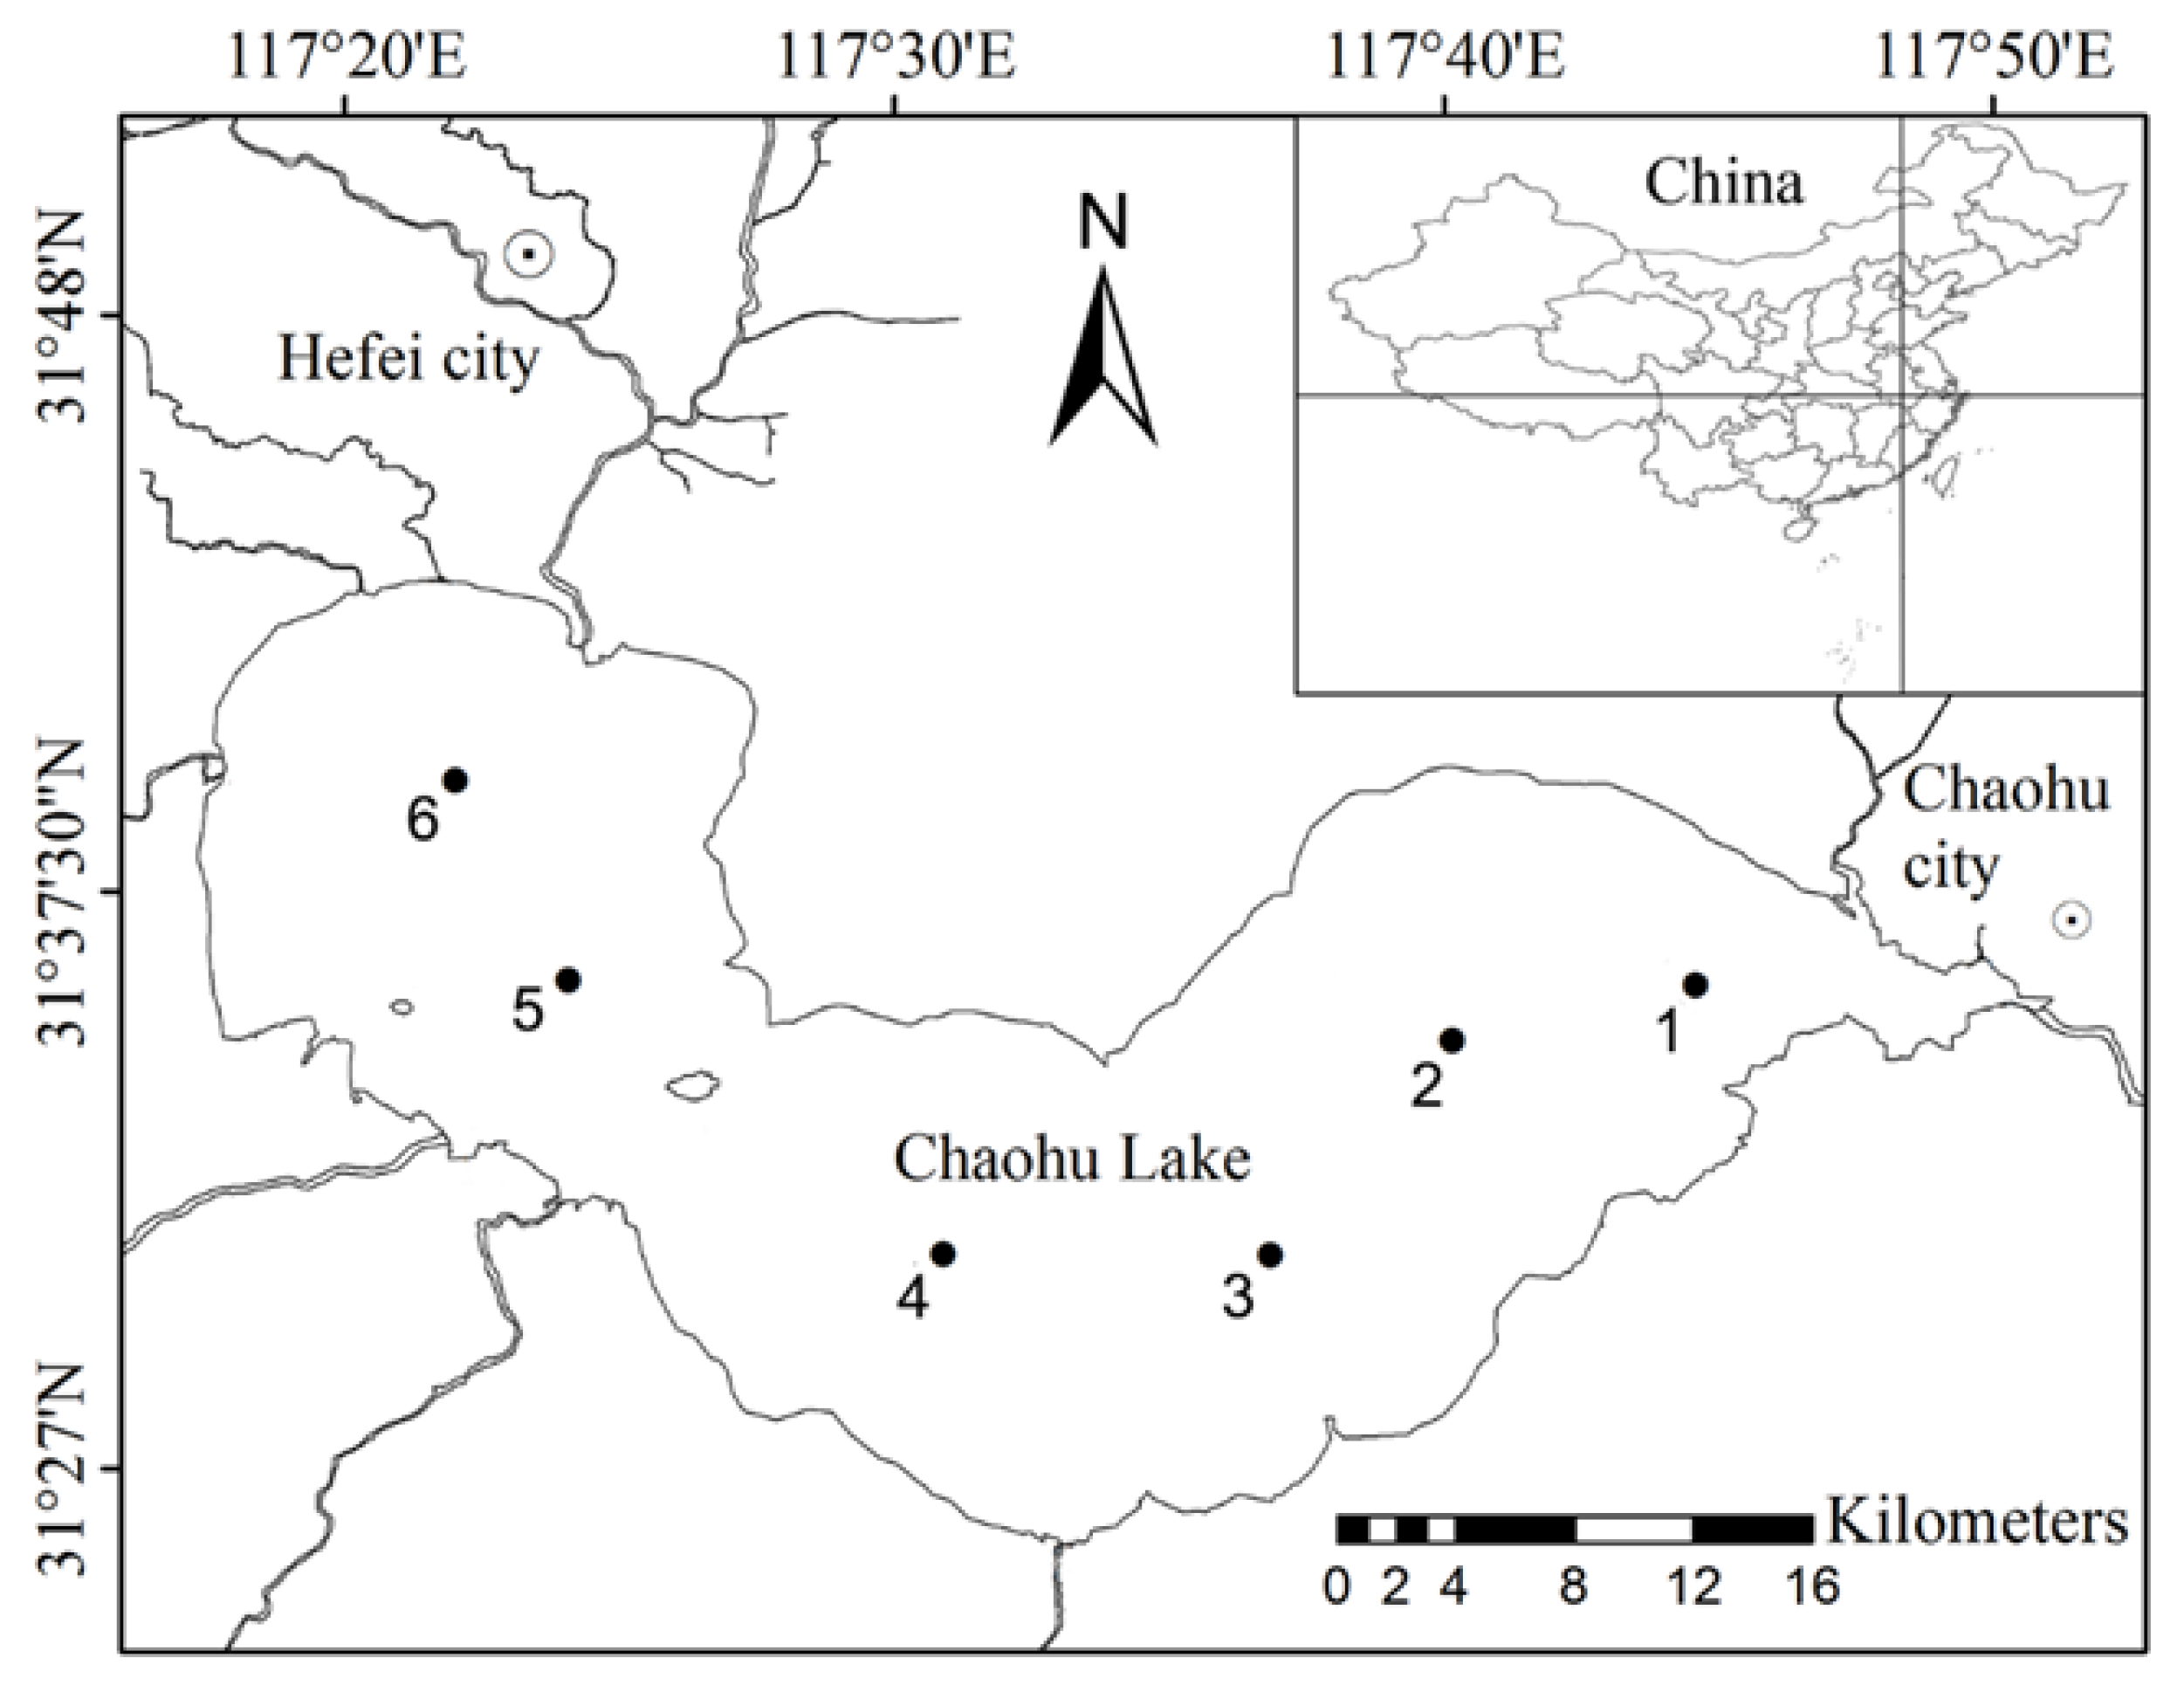
2.1. Study Lake

Lake Chaohu, the fifth-largest freshwater lake in China, is located in the middle of Anhui Province, China (117°116′46″–117°151′54″ E, 30°143′28″–31°125′28″ N). The surface area of the lake is approximately 750 km2, but this varies according to the water level (maximum depth: 6 m; mean depth: 3 m). Lake Chaohu is in a state of severe eutrophication, and cyanobacterial blooms (primarily consisting of Microcystis and Dolichospermum) have dominated the lake over the past few decades [18,19].

2.2. Sampling Method

To investigate the seasonal shifts in cell diameter and colony size of the dominant bloom-forming cyanobacteria, we performed a monthly investigation from November 2016 to October 2017 in Lake Chaohu, China. The six sites located in the east lake area (sites 1 & 2), central lake area (sites 3 & 4) and west lake area (sites 5 & 6, Figure 1) represent an increasing trend for nutrient levels from east to the west. At each site, integrated water samples were collected by mixing the surface (50 cm below the surface), middle (half of the water depth), and bottom (50 cm above the lake bottom) water using a Ruttner sampler. The environmental parameters (temperature, pH, conductivity and dissolved oxygen) at every sampling site were measured using a multiparameter meter (Model 6600; Yellow Spring Instruments, OH, USA). Total nitrogen (TN) and total phosphorus (TP) were analyzed by peroxydisulfate oxidation, and permanganate index (CODMn) was measured using the most recent method reported in the literature [20]. Transparency (SD) was measured with a Secchi disk. A total of 72 Phytoplankton samples (500 mL) were collected and fixed with an acid Lugol solution. After being left undisturbed for 48 h, the supernatant was removed and concentrated to a volume of approximately 30 mL, and the phytoplankton were identified and counted under a 40 x-magnification microscope (Imager A2 x, ZEISS, Oberkochen, Germany) [21]. Identification and counts were performed at the species or genus level using the most recent literature and updated information from the AlgaeBase website [22,23]. The biovolume was calculated from the measurements of 30 organisms of each species at each site [24]. The biomass was determined as the algal volume for each site and converted to fresh weight, assuming a specific gravity of 1 g/cm3 [25].
The cell diameters of M. aeruginosa and D. flos-aquae, the two dominant cyanobacterial bloom-forming species, were measured and analyzed by collecting at least 50 individuals from each sample. Photomicrographs of the samples were taken using a ZEISS AxioCam HRc digital camera (ZEISS, Oberkochen, Germany) coupled with a microscope at ×100 and ×400 magnification and were analyzed using Image-Pro Plus 6.0 software (Media Cybernetics, Inc., Rockville, USA). Colony size was measured with a laser particle size analyzer (Mastersizer 2000, Malvern, UK).

2.3. Statistical Analysis

Statistical analysis and related graphs were performed on Origin 2017 and the R language platform R. 4.2.0 [26]. The differences in the cell diameters for Dolichospermum and Microcystis over the various months were determined using one-way analysis of variance (ANOVA). Differences were considered significant at p < 0.05. The colony sizes for Dolichospermum and Microcystis were extracted by combining the results for colony size and phytoplankton composition. The relationships between cell diameters and colony sizes in Dolichospermum and Microcystis were assessed by linear regression and a generalized linear model. Before analyzing the corresponding relationships between cell diameter and colony size, the colony size of each taxon was log-transformed to minimize differences in scale and to achieve normality and variance homogeneity.

3. Results

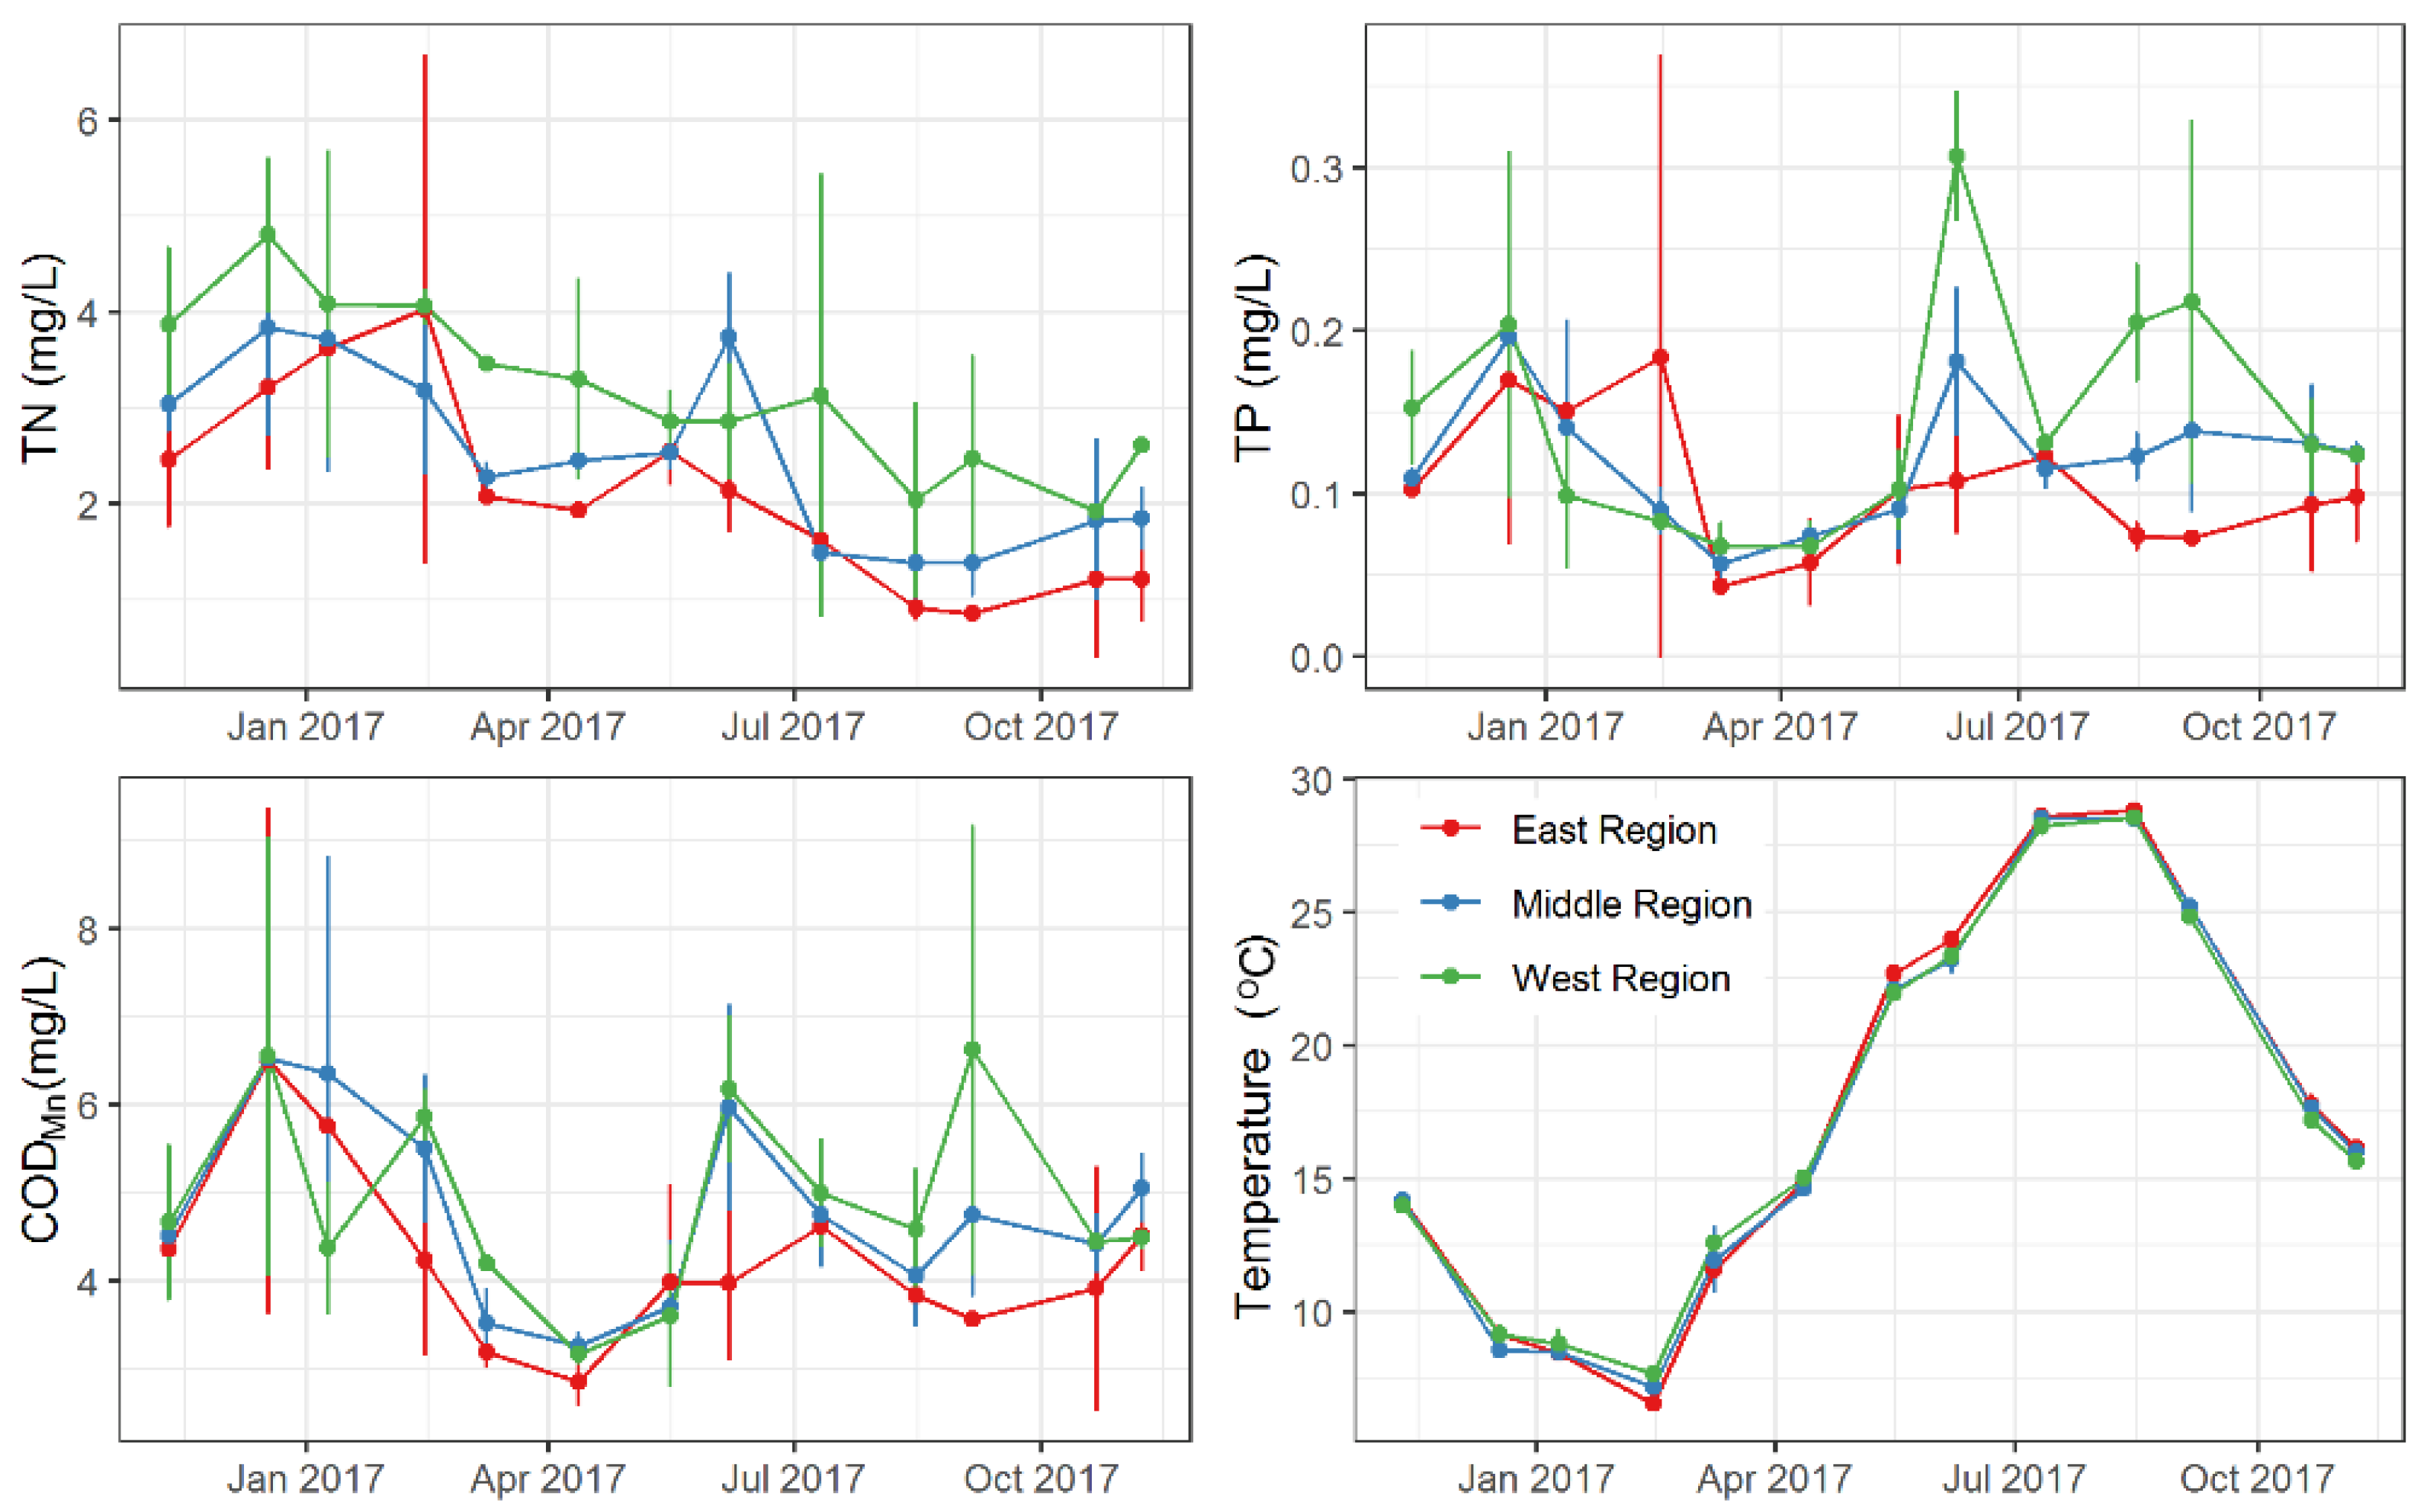
3.1. Monthly Variations in Environmental Factors

The means and standard deviations of environmental parameters and nutrients from monthly water samples collected at three regions are shown in Table 1. The spatial and temporal distribution characteristics of TN, TP, CODMn and water temperature are presented in Figure 2. In space, the nutrients showed decreasing trends from west to east. These parameters also showed obvious seasonal variations. TN concentration was higher in winter than those in other seasons. TP concentration and CODMn usually were lower in spring than those in other seasons.

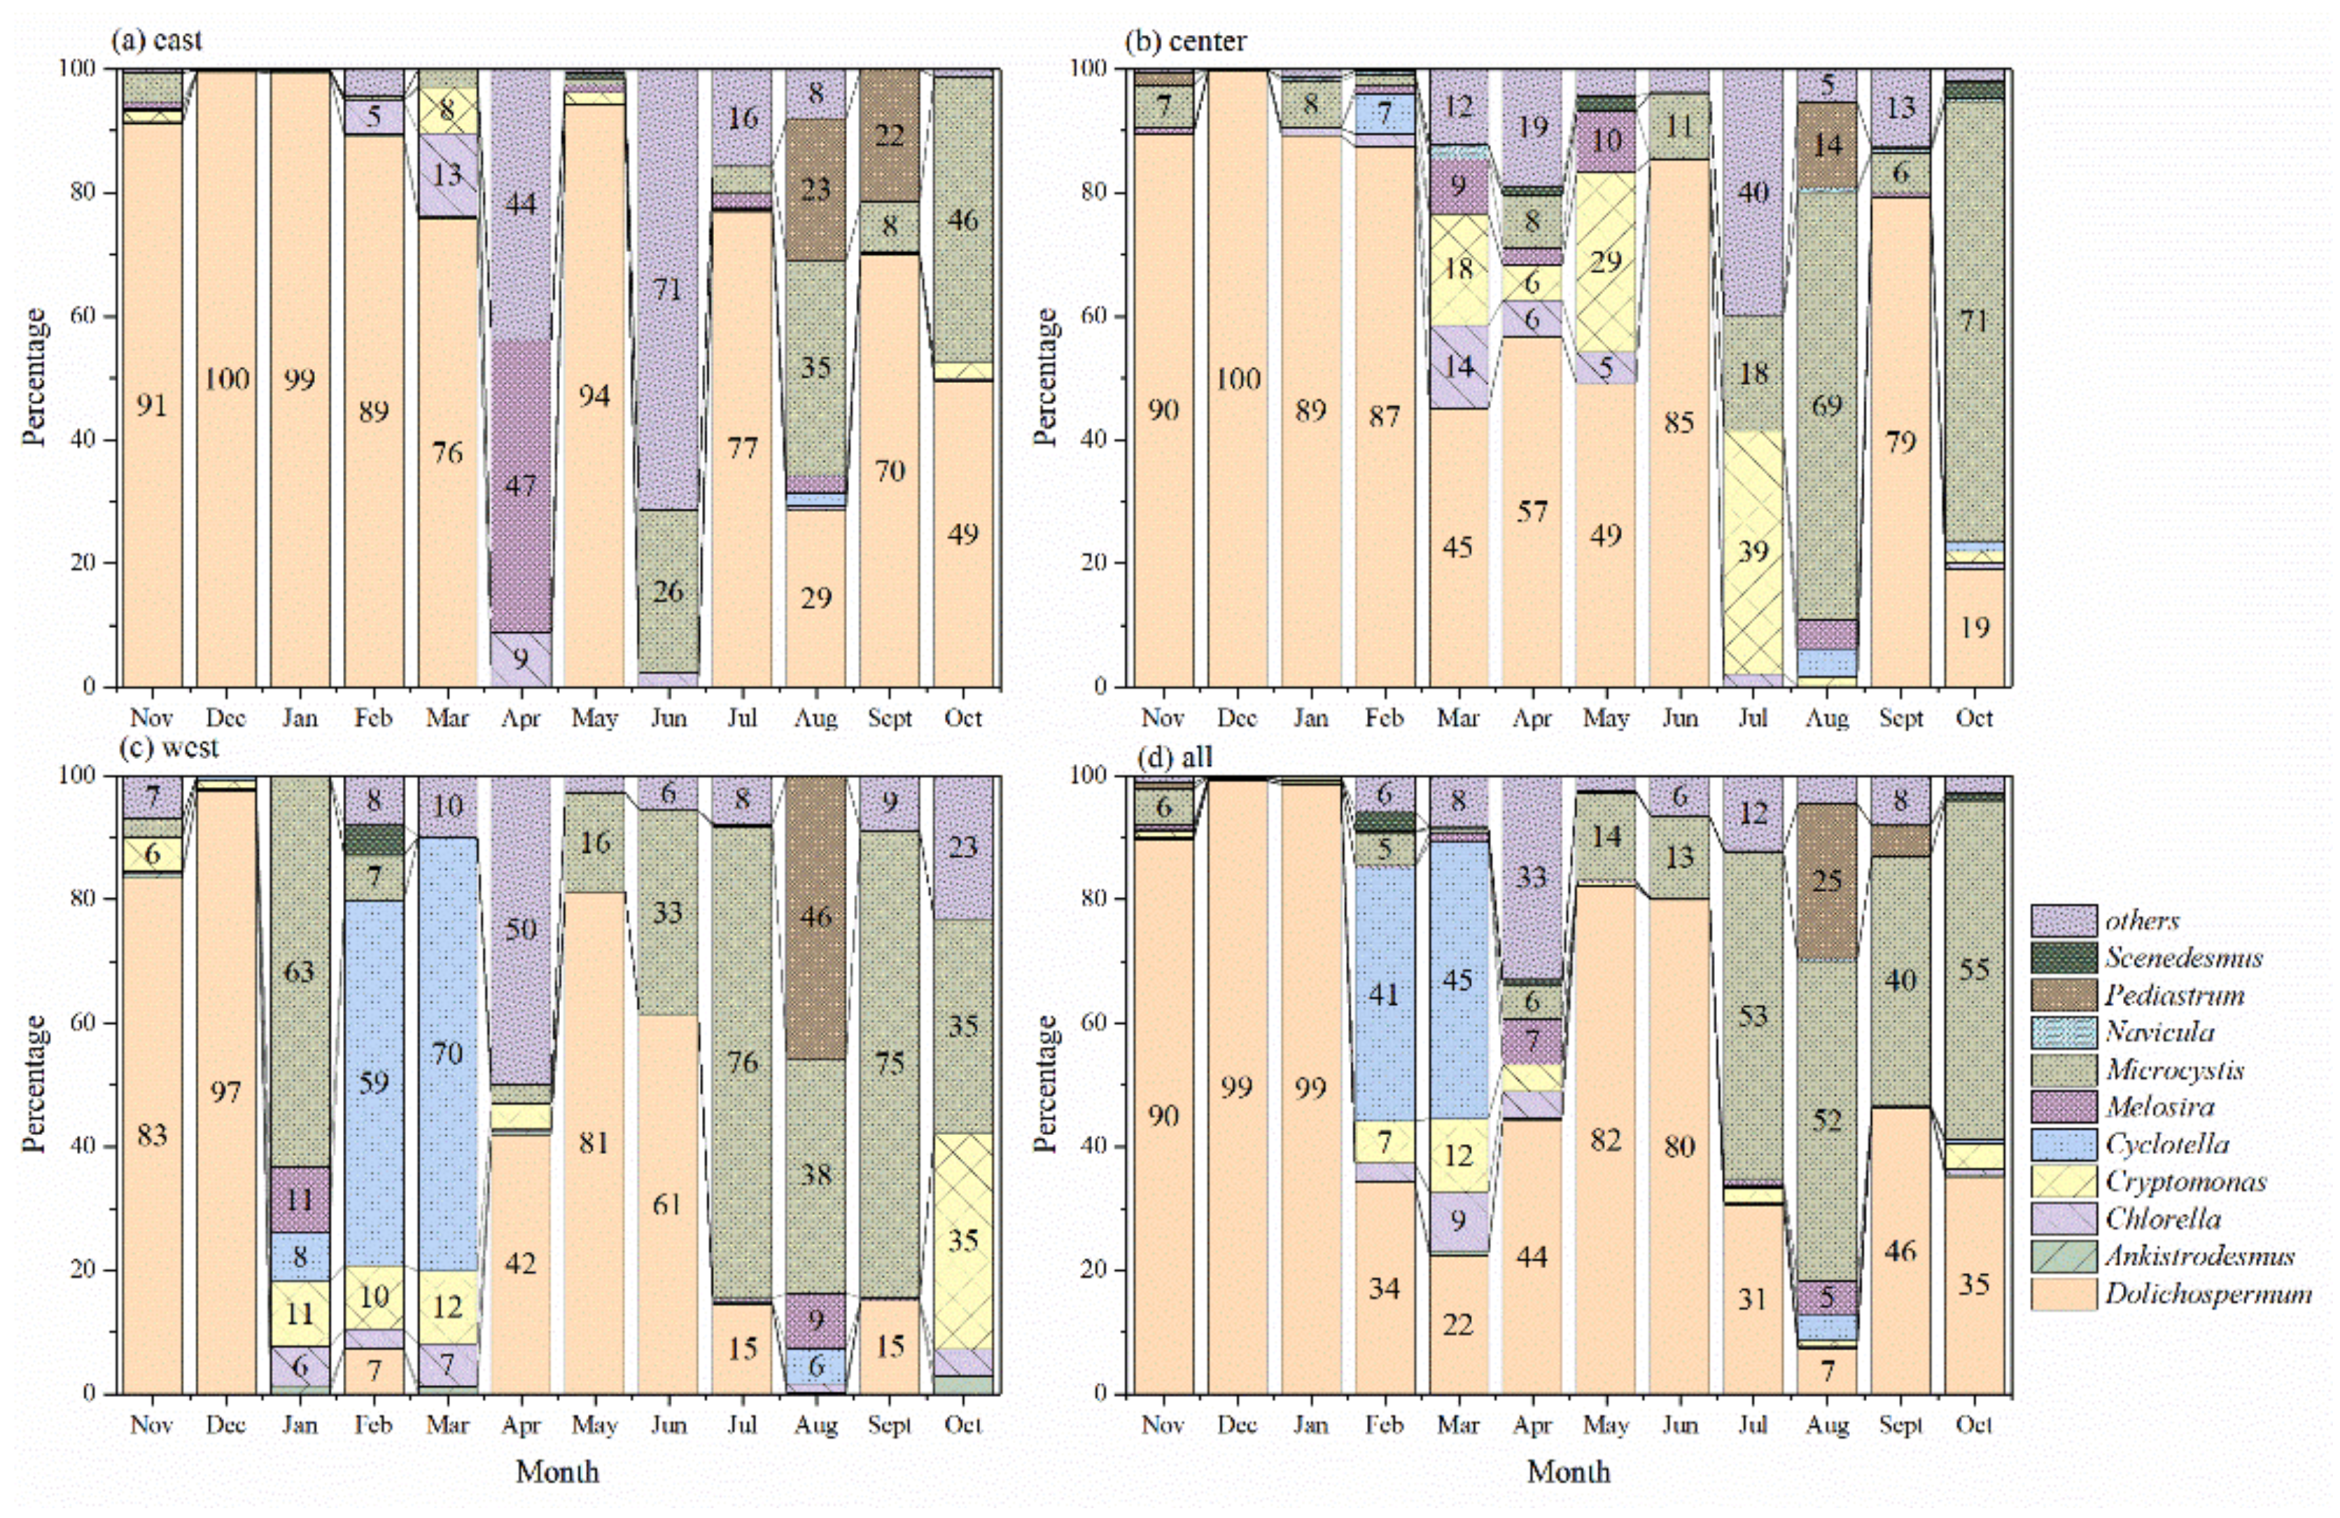
3.2. Seasonal Shift in Phytoplankton Composition

According to the phytoplankton composition results, the Lake Chaohu phytoplankton usually consisted of Dolichospermum, Ankistrodesmus, Chlorella, Cryptomonas, Cyclotella, Melosira, Microcystis, Navicula, Pediastrum, Scenedesmus and others (Figure 3). Over the entire lake, Dolichospermum flos-aquae and Microcystis aeruginosa were the dominant species of phytoplankton and the main contributors to cyanobacterial blooms.
In the eastern area, Dolichospermum formed the dominant phytoplankton population, and its biomass was more than 70% for most months. The dominance of Dolichospermum changed in April, and the population of Microcystis grew rapidly after May. The proportion of Microcystis in April, June and October was more than 25%, and it became the dominant phytoplankton population in the eastern area (Figure 3a). In the central area, Dolichospermum formed the main phytoplankton population except in July, August and October. Microcystis accounted for more than 70% in August and October and became the dominant species (Figure 3b). In the western area, Dolichospermum only showed a high proportion in November, December, April, May, and June, and Microcystis was the dominant population in January, July, August, September, and October. (Figure 3c)
The environment of Lake Chaohu was in a eutrophic state (Table 1). Compared with the different lake areas, the TP and TN of the western lake were twice as high as those of the eastern and central areas (p < 0.05). The CODMn of the western area was significantly higher than those of the central area and eastern area (p < 0.05). There was no significant difference in pH, SD or water depth among the three areas (p > 0.05).

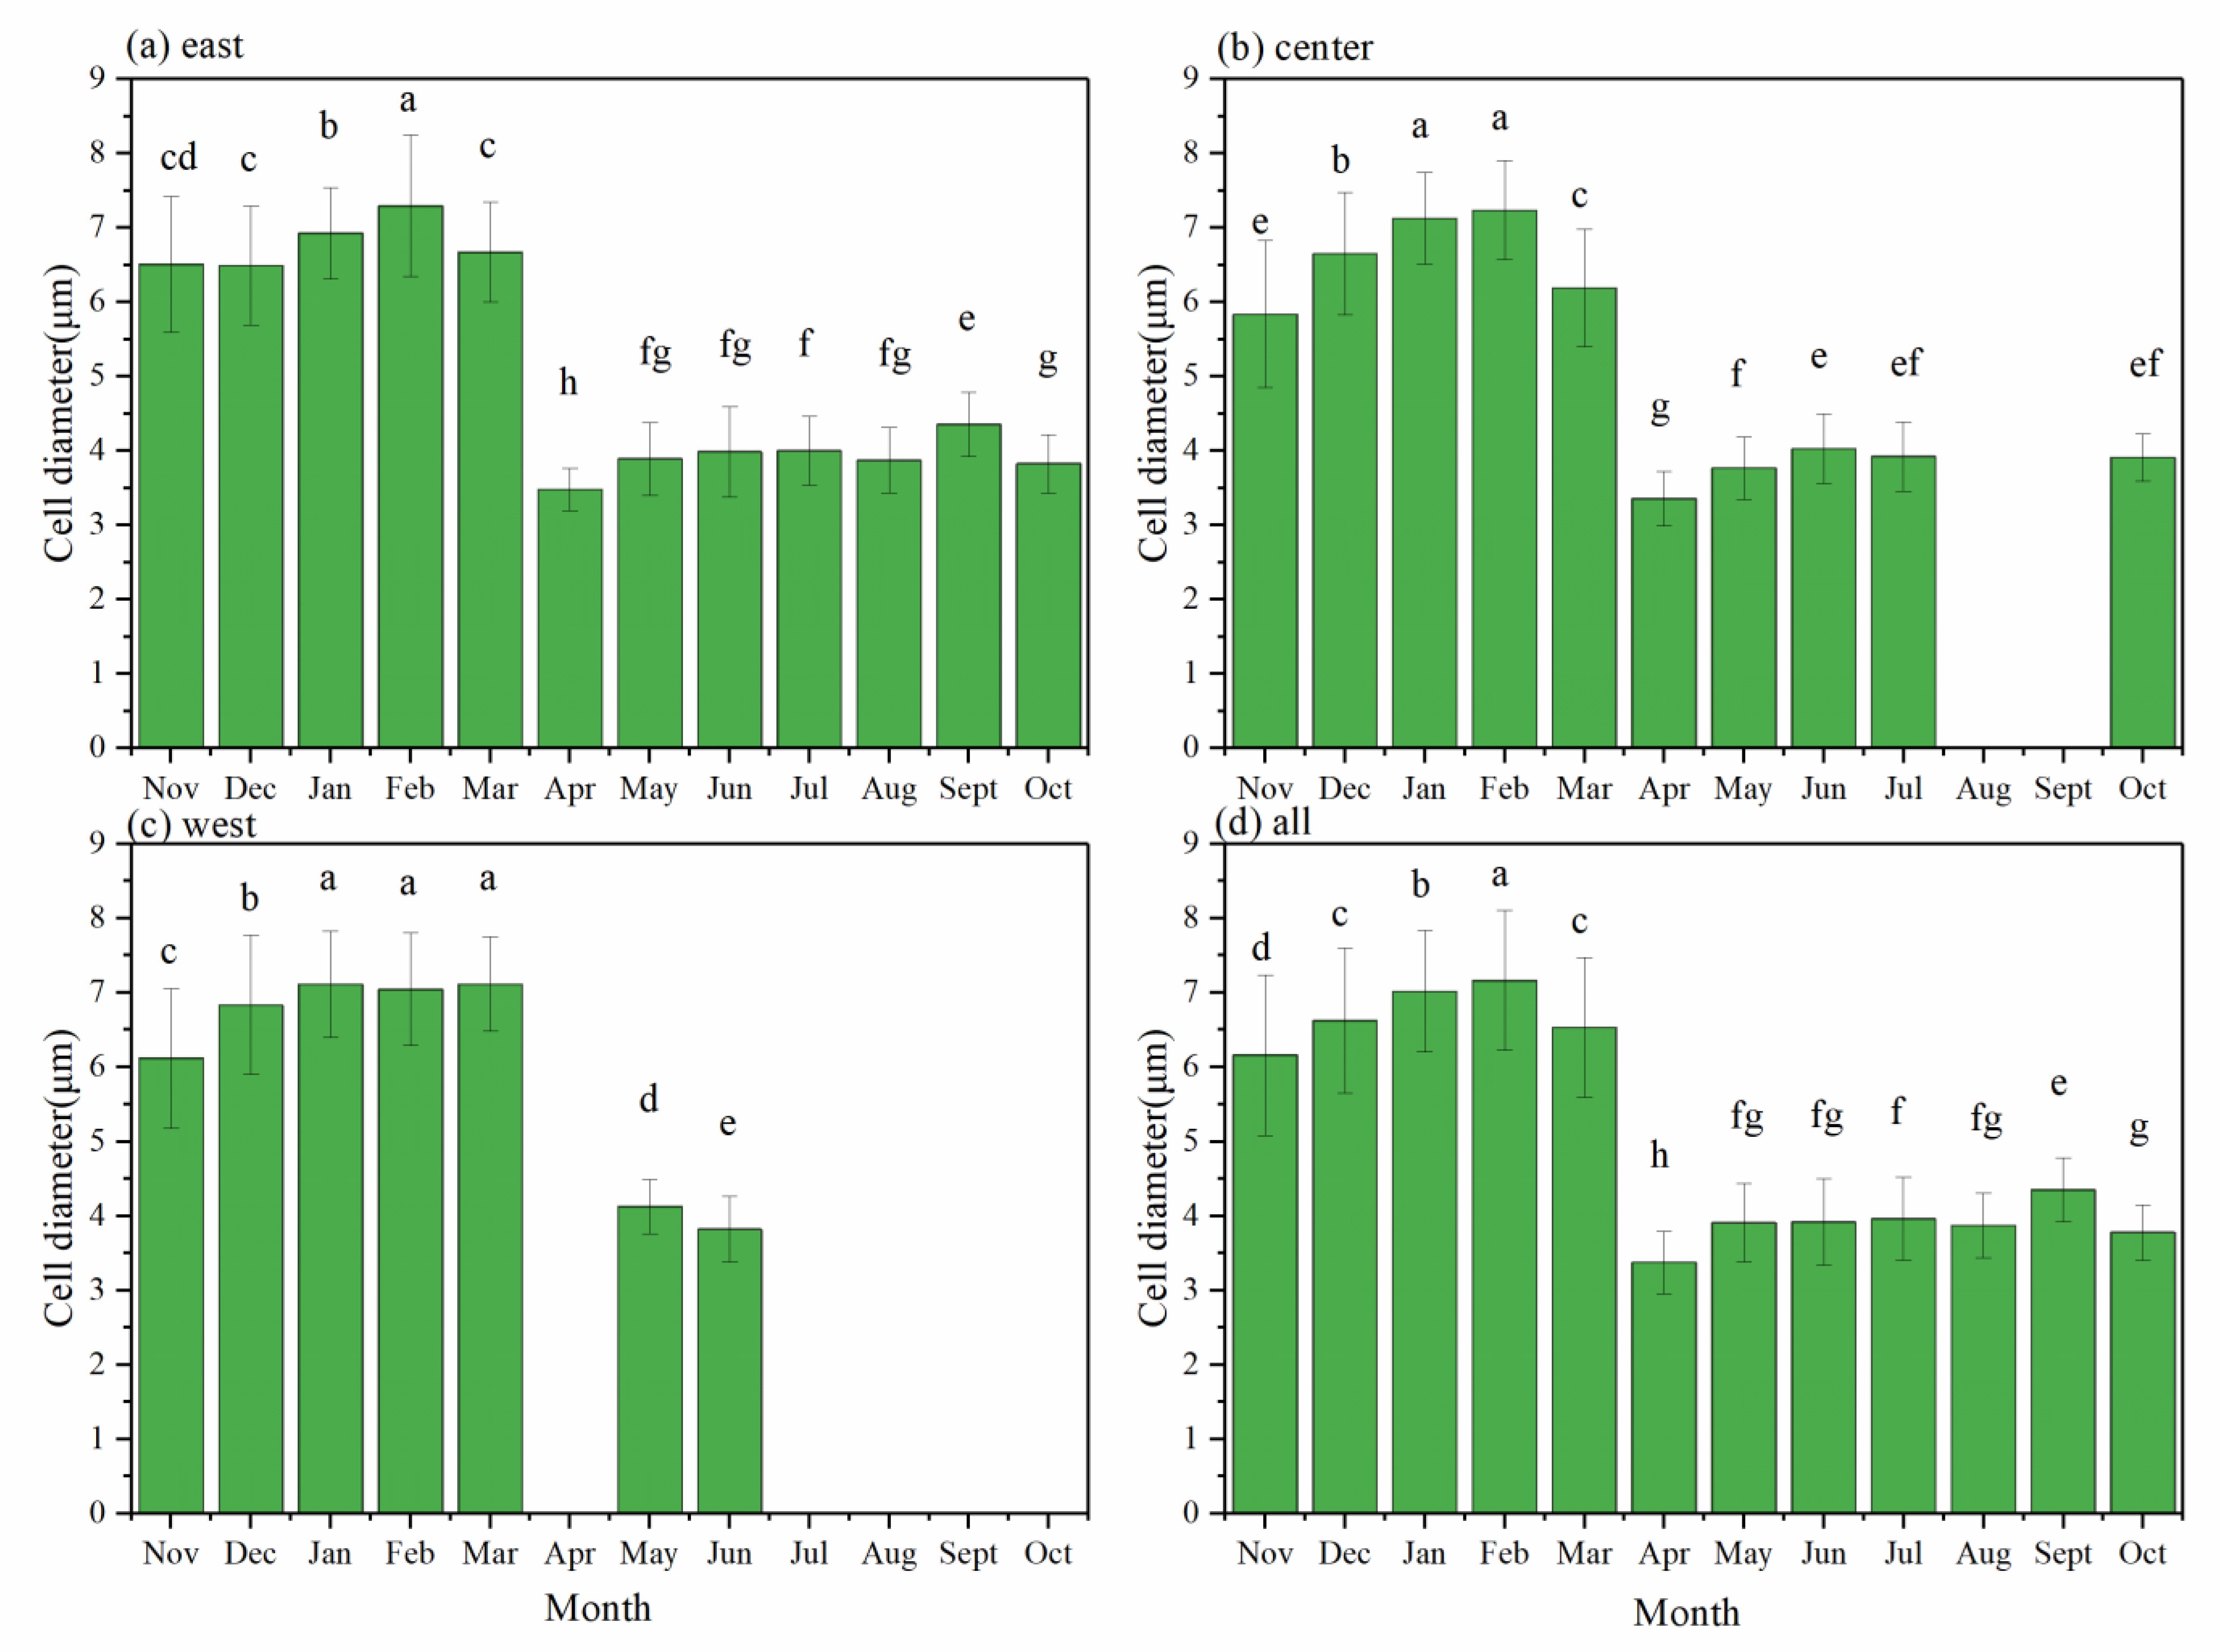
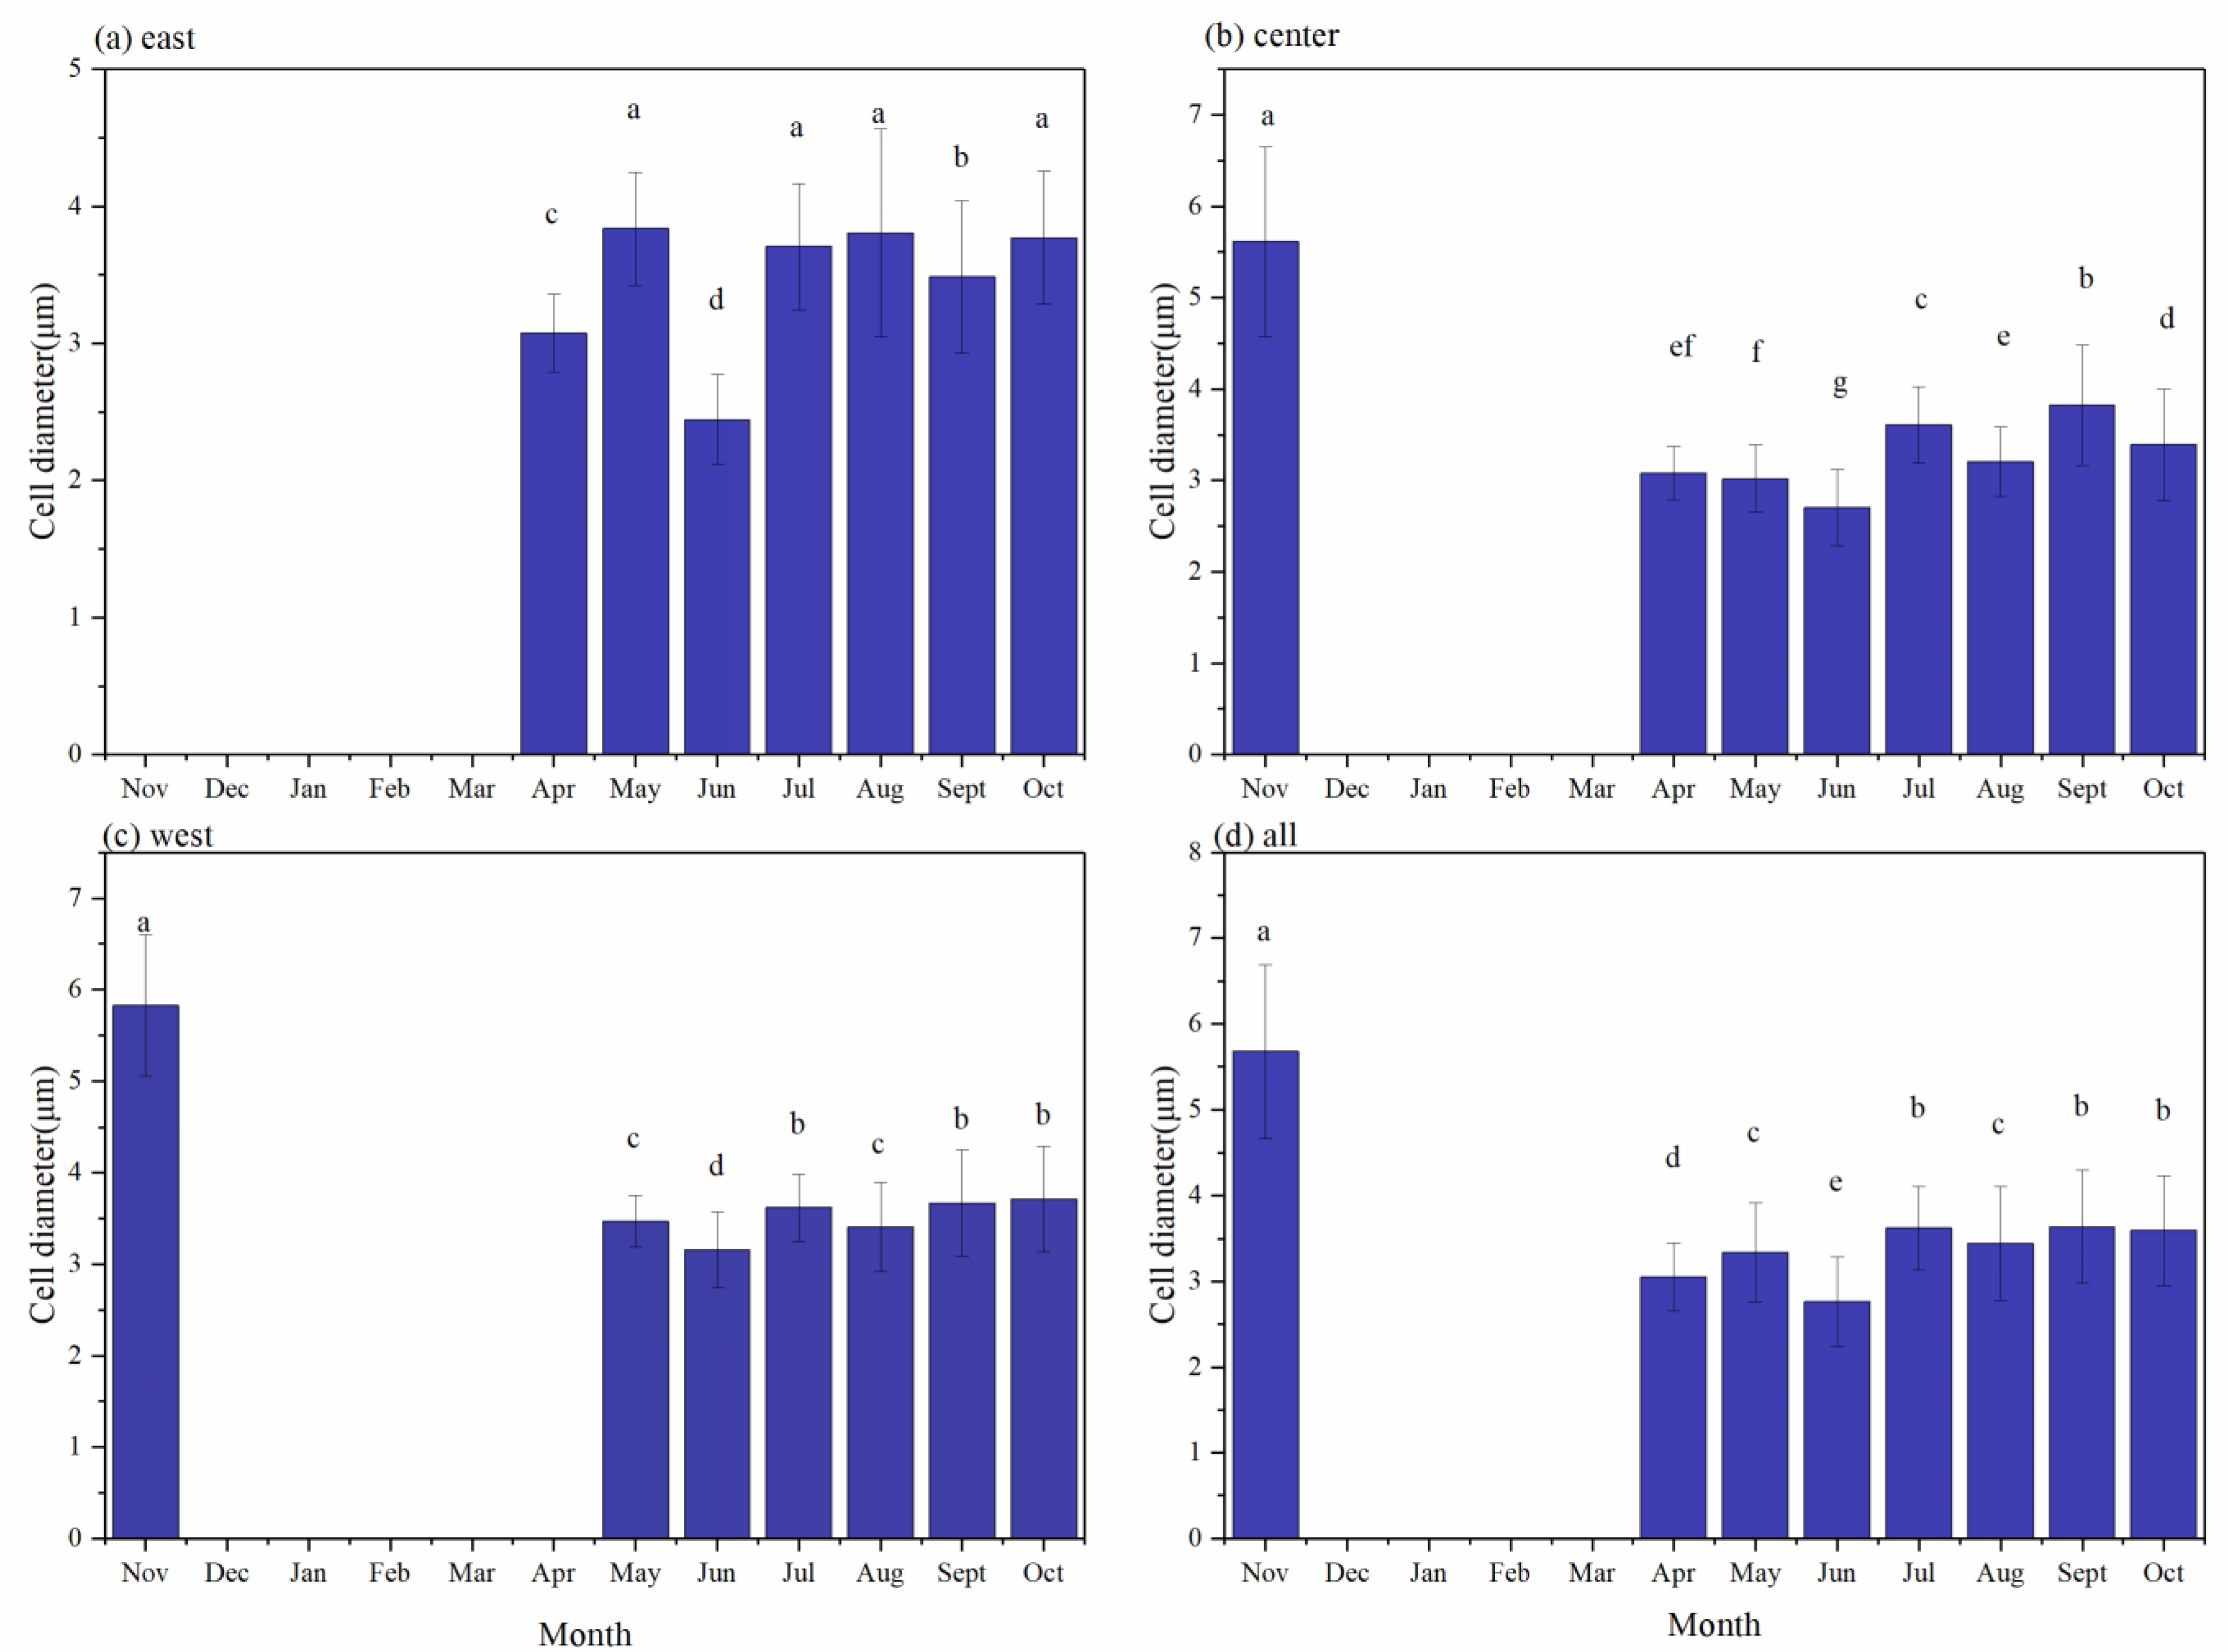
3.3. Cell Diameters in Dolichospermum and Microcystis

During the investigation period, Dolichospermum was present during each month in Lake Chaohu. For the lake overall, the average cell diameter of Dolichospermum was 7.0 μm in the winter, 4.6 μm in the spring, 3.9 μm in the summer, and 4.8 μm in the autumn seasons. The values of the average cell diameter of the three lake areas were similar to those of the entire lake (Figure 4). The cell diameter of Dolichospermum showed an increasing trend from November 2016 to February 2017, increasing from 6.19 μm to 7.3 μm. Then, the cell diameter decreased from 6.58 μm in March to 3.39 μm in April and remained at approximately 4 μm from May to October. The values of cell diameter from November 2016 to February 2017 were significantly higher than those from May to October (p < 0.05).
During the investigation period, Microcystis was present during most months in Lake Chaohu except December, January, February, March, and April. For the lake overall, the average cell diameter of Microcystis was 3.2 μm in the spring, 3.3 μm in the summer, and 4.3 μm in the autumn seasons. No Microcystis was present during the winter. The average cell diameters of Microcystis were similar, and there was no significant difference among the three lake areas (Figure 5). Microcystis generally was not present in December, January, February, or March. The Microcystis cell diameter reached its highest value of 5.73 μm in November. The values for cell diameters were significantly lower from April to October than in November.

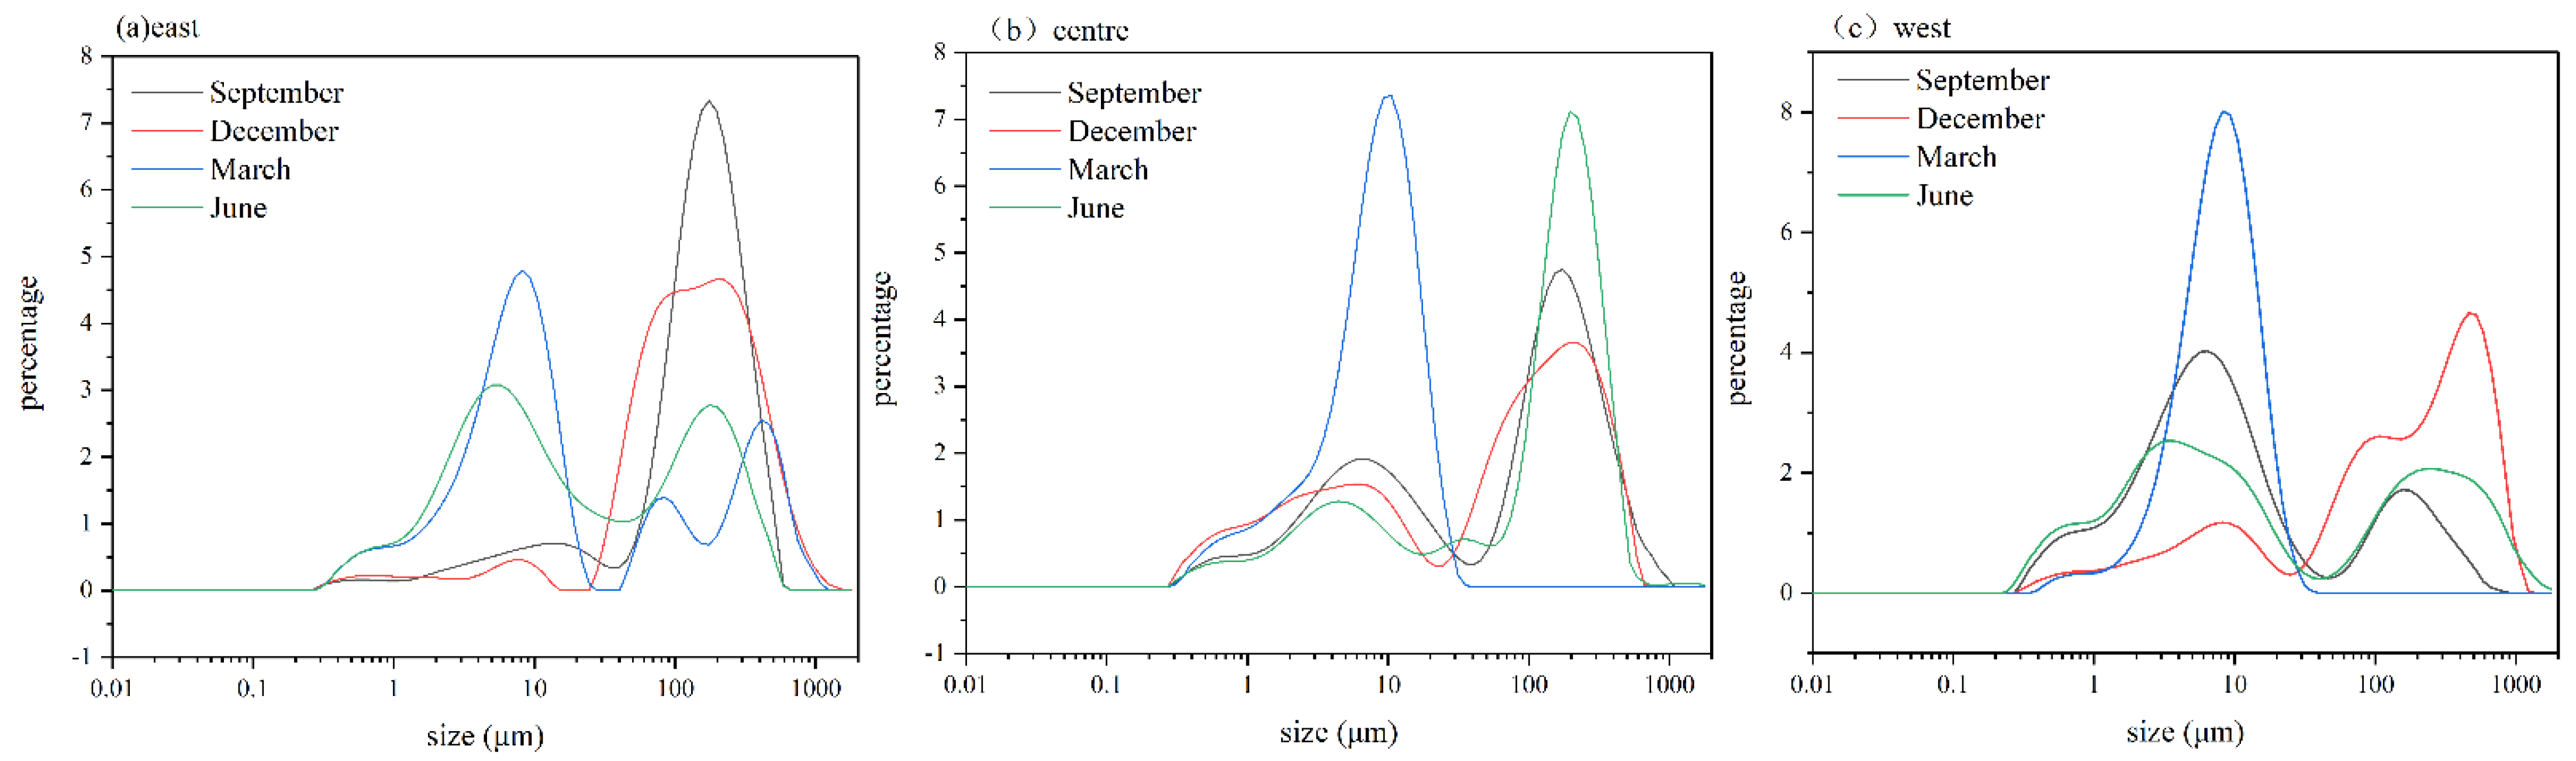
3.4. Colony Size in Different Lake Regions

According to the frequency histograms of colony size, there were generally two peaks for each lake area and each season. In the eastern area, the colony sizes during the peaks were 174.11 μm and 15.16 μm in September, and the corresponding frequency values were 7.33% and 0.70%, respectively (Figure 6a). By including the results of the phytoplankton composition analysis, we found that Pediastrum was the main contributing species for the small peak, and Dolichospermum was the main contributing species for the large peak. In December, the colony sizes during the peaks were 8.23 μm and 196.71 μm, and Dolichospermum was the dominant species for the large peak. In March, the colony sizes during the peaks were 8.23 μm, 83.71 μm and 409.16 μm. Dolichospermum was the main contributing species for the large peak, Microcystis contributed to the medium peak, and the small peak was that of Cyclotella. In June, the colony sizes during the peaks were 5.71 μm and 174.11 μm; Microcystis was the main contributing species for the peak, and other species were the main contributing species for the larger peak.
In the central area, the colony sizes during the peaks were 196.71 μm and 6.45 μm in September. By including the results of the phytoplankton composition analysis, we found that Dolichospermum was the dominant species, so both peaks were due to Dolichospermum. In December, the colony sizes during the peaks were 196.71 μm and 6.45 μm, and Dolichospermum was the main contributor for the two peaks. In March, the colony size during the largest peak was 10.51 μm, and Dolichospermum was the main contributing species for the peak. In June, the main peaks were due to Dolichospermum and Microcystis, and the colony sizes were 196.71 μm and 4.71 μm, respectively (Figure 6b).
In the western area, the colony sizes during the peaks were 6.45 μm and 154.11 μm in September. By including the results of the phytoplankton composition analysis, we found that Dolichospermum was the dominant species, and both peaks were due to Dolichospermum. In December, the large peak was due to Dolichospermum, and the colony sizes were 462.28 μm and 8.23 μm. In March, a peak was observed due to Cyclotella, whose colony size was 8.23 μm, and other species. In June, the colony sizes at the peaks were 251.10 μm and 3.1 μm, and Dolichospermum and Microcystis contributed to the two peaks, respectively (Figure 6c).

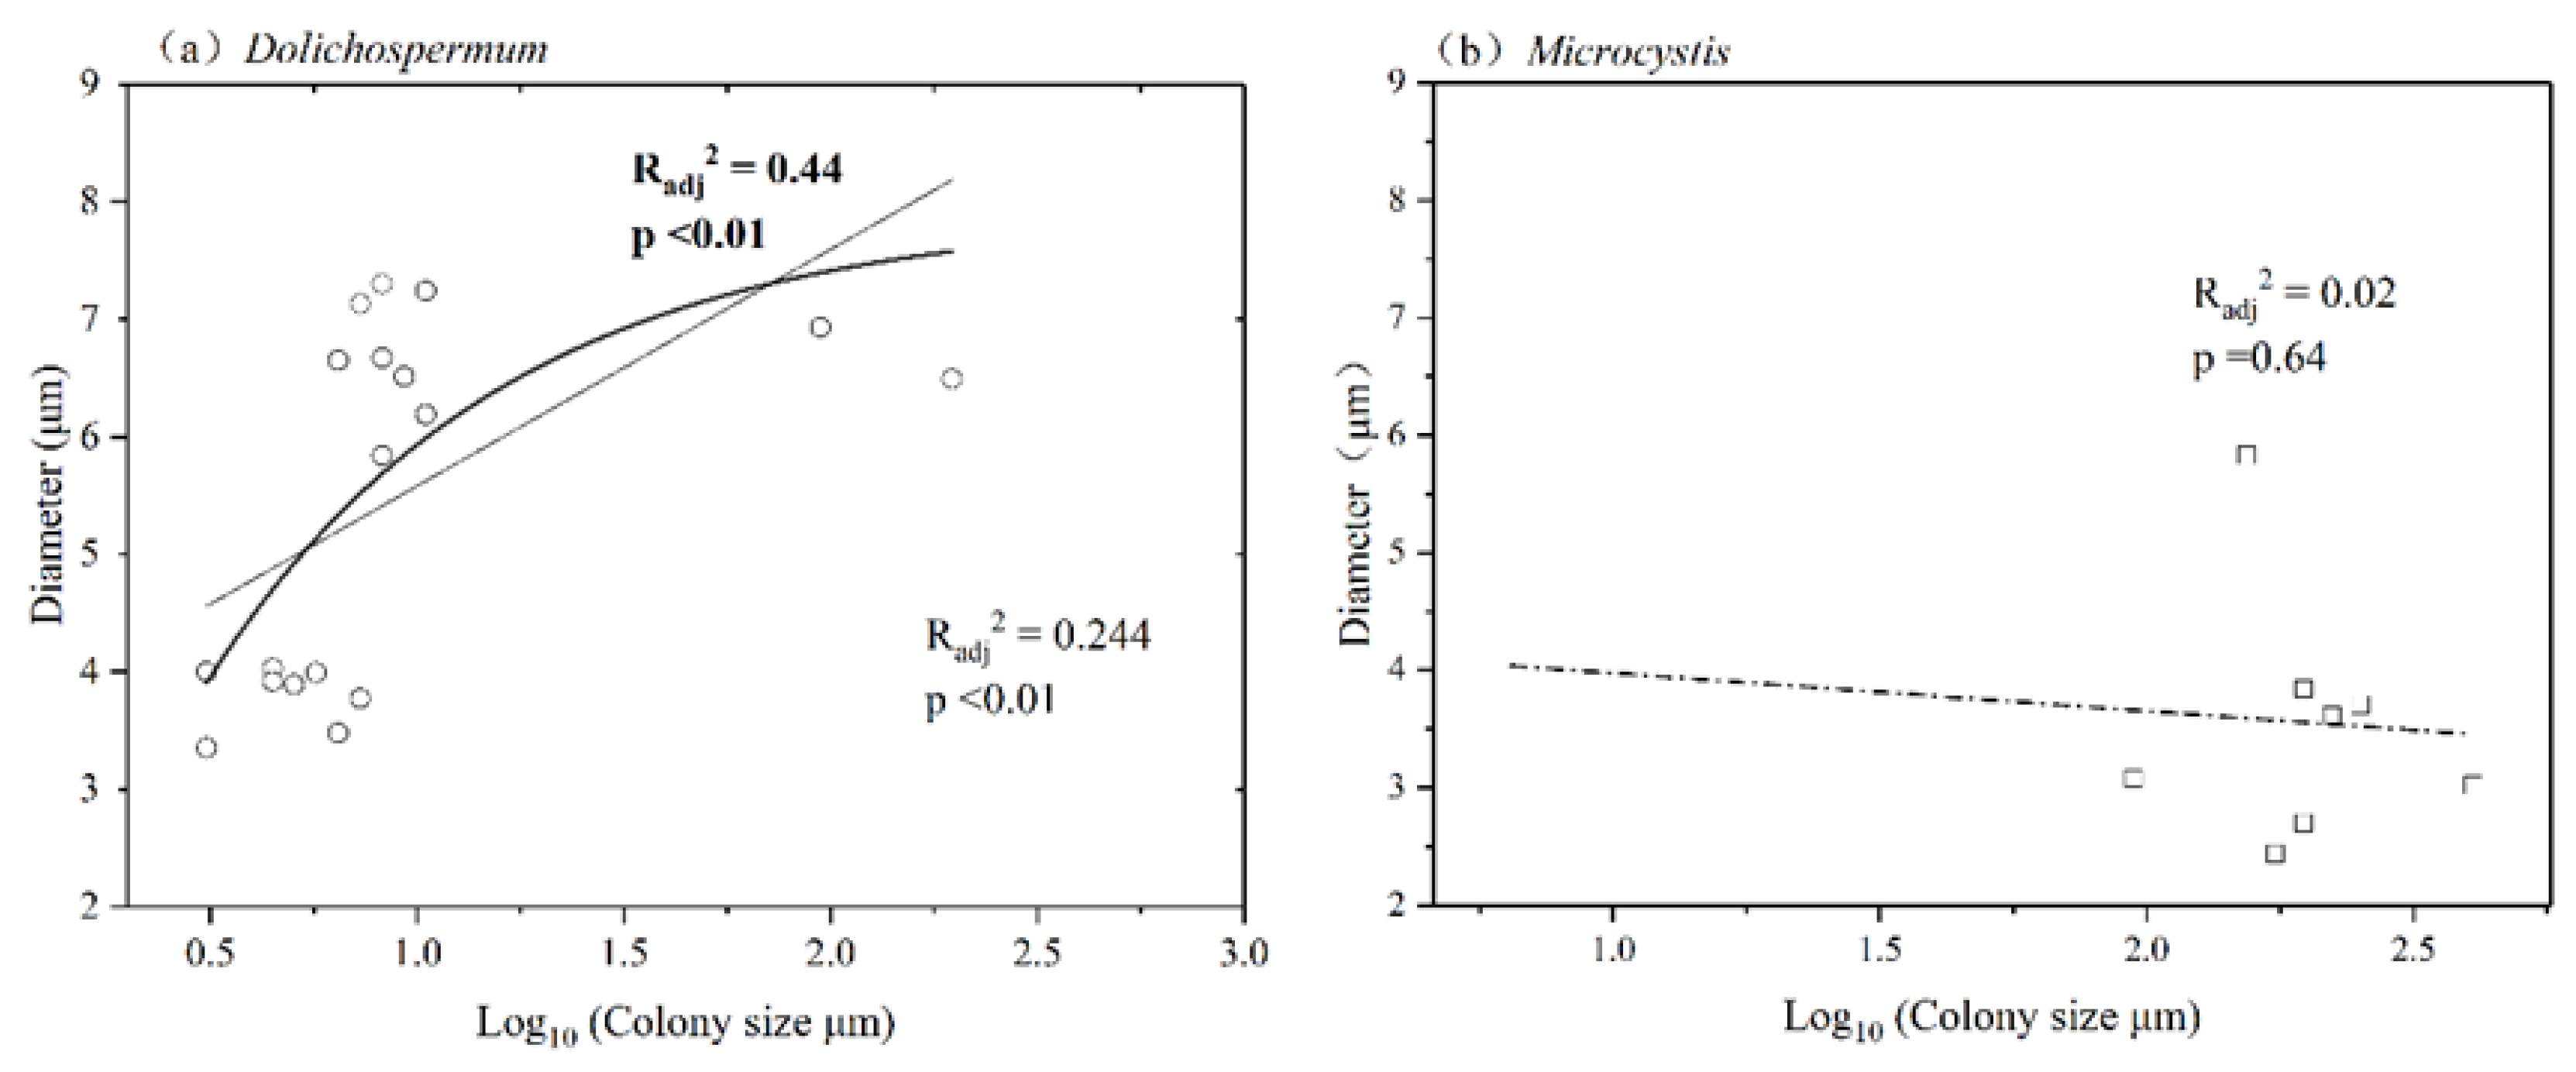
3.5. Corresponding Relationships between Cell Diameter and Colony Size

According to the results of linear regression and the generalized linear model, there was a significant relationship between cell diameter and colony size for Dolichospermum (p < 0.05). The correlation coefficient of the generalized linear model was higher than that of linear regression. There was no significant relationship between cell diameter and colony size for Microcystis (Figure 7).

4. Discussion

4.1. Spatiotemporal Variation in Algal Composition

According to the community composition of phytoplankton, Dolichospermum and Microcystis were the dominant cyanobacterial genera of phytoplankton in Lake Chaohu. The biomass of Dolichospermum and Microcystis exceeded 75% of the total biomass during each month. Dolichospermum dominated the phytoplankton community in the spring, when the average temperature was lower than 25 °C. Dolichospermum blooms mainly occurred simultaneously in the eastern area and central area of Lake Chaohu. During the same time, Microcystis was not detected in any of the areas of Lake Chaohu. This phenomenon was consistent with other studies [27]. In the summer and autumn, Microcystis grew rapidly with increasing temperatures and became the dominant cyanobacterium. Microcystis blooms were concentrated in the western area. After October, the dominant species gradually shifted to Dolichospermum with the decrease in temperature. Microcystis blooms in the western area gradually decreased, and Dolichospermum blooms dominated the eastern area of Lake Chaohu. These findings were consistent with those of our previous study [28], which indicated that there has been no observable change in the community composition of phytoplankton in recent years.
The spatial characteristics of cyanobacterial blooms were directly related to the spatial variation of eutrophication in the lake. The concentrations of nutrients, such those of total phosphorus and total nitrogen, in the western area were higher than those of the central and eastern areas, which was primarily attributed to the input from river runoff in the western region of the catchment [29]. There was a significant positive relationship between TP and Microcystis biomass [30,31]. Therefore, it is possible that Microcystis was limited by the relatively low TP in the eastern lake area and flourished in the high TP western lake areas. Dolichospermum was predominant when nitrogen levels were limited or when the TN/TP ratio was low, because Dolichospermum is able to fix N2 when nitrogen is in short supply [32]. However, few heterocysts were observed in the sample dominated by Dolichospermum, suggesting that nitrogen availability may have been sufficiently high, and that nitrogen fixation by heterocysts was not unnecessary for Dolichospermum dominance. Therefore, the variations in the TN/TP ratio or in the low TN concentration regions may not have been the primary factor driving the dominance of Dolichospermum in Lake Chaohu. In this study, Dolichospermum primarily dominated in the spring, autumn and winter, when the temperature was generally relatively low, which indicates that they might have a competitive advantage in the low-temperature niche.

4.2. The Variation in Colony Size and Cell Diameter

In this study, Dolichospermum cell diameter increased from 6.5 μm to 7.4 μm during the period from November 2016 to March 2017 and then decreased significantly from approximately 7 μm during the period from November 2016 to February 2017 to approximately 4 μm during the period from May to October. The Microcystis cell diameter values were also significantly lower from April to October than in November. The increase in cell diameter during a period of relatively low temperatures may be attributed to a growth strategy in which cyanobacteria store energy to survive low temperature conditions, which is confirmed by the finding that spermidine promotes gene expression in cyanobacteria and promotes the absorption of nutrients to improve cyanobacterial ability to overwinter [33].
The cell diameters of the two cyanobacteria decreased primarily during the growing season. Before the growing season, the two cyanobacteria experienced a few months of overwintering, which depleted the energy stores of the cyanobacteria [34]. Therefore, as the cyanobacteria began to enter their breeding process after dormancy, their cell diameters detected in April were significantly smaller than before. In addition, as the cyanobacteria began to growth, the energy absorbed from nutrients was mainly used for their growth process rather than being stored in the cell for rapid reproduction. This regulation in nutrient utilization strategies might contributed to the variation of cell diameters.
The colony sizes in Lake Chaohu showed distinct seasonal variations. The cyanobacteria colony size decreased from September 2016 to March 2017 and then increased from March to June. The increases in the colony sizes of the two bloom-forming cyanobacteria were helpful for improving their floatation ability and for reducing predation by zooplankton. Buoyancy facilitates light acquisition and reduces predation [35]. The vertical distribution of the cyanobacterial species reflects the autecological preferences of the cyanobacteria for the prevailing environmental conditions and also reflects the minimization of negative interactions and exploitation of positive interactions [36]. The decrease in colony size might be due to sinking after flourishing or due to the shedding of individual cells from the colony.
The formation and growth of colonies was considered to be due to the incomplete separation and due to adhesion of daughter cells after cell division [37]. When a colony grows to a certain size, some cells separate and become propagules for new colony growth. This is also consistent with our previous studies showing that single-celled Microcystis form colonies under predation pressures from zooplankton, and the formation and growth of these colonies is also the result of incomplete separation after cell division [38]. Environmental factors, such as light, nutrients and temperature, have important effects on the formation and size of cyanobacterial colonies [39]. The colony size of Microcystis is known to decrease with increasing temperature or nutrient concentrations despite faster growth of unicellular cells [40,41]. Higher light intensities led to a faster growth rate of cells, which accelerates the consumption of intracellular polysaccharides and other substances, and decrease the propensity to form colonies [42]. In the study, however, no significant differences in the cell diameters or colony size of Microcystis and Dolichospermum were observed among the lake regions with obvious different nutrient levels. This is not consistent with the previous study, perhaps due to the gradient of nutrients or combined effect of multiple variables. As such, this aspect requires further study in the future.
In this study, we found that there were positive relationships between the colony size and cell diameter of Dolichospermum, while there were no such significant relationships for Microcystis. During cyanobacterial blooms, the biomasses of Microcystis and Dolichospermum were highly correlated with cell diameter. These results indicate that Dolichospermum and Microcystis may absorb more nutrients by adjusting colony size and cell diameter, thus gaining competitive advantages. With the increase in Dolichospermum biomass, the available nutrient concentrations decreased, which decreased access to nutrients. We speculate that Dolichospermum changes its growth strategy, growing rapidly while maintaining low cell diameters to increase cell content and colony size. This strategy could facilitate the maintenance of a higher biomass level; therefore, Dolichospermum and Microcystis might maintain their biomass by inducing a trade-off between cell diameter and colony size.

5. Conclusions

In summary, Dolichospermum and Microcystis were found to be the dominant species of the cyanobacterial blooms in Lake Chaohu. Colony size and cell diameter in Dolichospermum were significantly and positively correlated, while no such relationship was observed for Microcystis. The regulation of cell diameter and colony size in Dolichospermum might be a mechanism by which it gains a competitive advantage and maintains biomass. Differences in cell diameter and colony size in response to variations in seasonal environment changes may be due to the unique physiological advantages that Microcystis and Dolichospermum developed during their respective evolutions. Our study highlights the importance of morphological regulation in maintaining bloom-forming cyanobacterial biomass. However, our understanding of the mechanism of the trade-offs among morphological traits is still limited. It is necessary to further investigate the process and factors affecting these trade-offs.

Author Contributions

Conceptualization, M.Z. and X.S.; validation, Y.M. and M.Z.; formal analysis, Y.M.; investigation, Z.Y., L.S. and Y.Y.; writing—original draft preparation, Y.M.; writing—review and editing, M.Z.; funding acquisition, M.Z., X.S. and Z.Y. All authors have read and agreed to the published version of the manuscript.

Funding

This work was supported by grants from the National Natural Science Foundation of China (32171546, 31870447, 32071573, 31971476), the Key Research Program of Frontier Sciences, CAS (Grant No. ZDBS-LY-DQC018), Science and Technology Service Network Initiative of Chinese Academy of Sciences (KFJ-STS-QYZD-2021-01-002) and Science and Technology Achievement Transformation Foundation of Inner Mongolia Autonomous Region (2021CG0013).

Institutional Review Board Statement

Not applicable.

Informed Consent Statement

Not applicable.

Data Availability Statement

The datasets generated during and/or analyzed during the current study are available from the corresponding author on reasonable request.

Acknowledgments

We thank Kuimei Qian for the identification and counting of phytoplankton samples. We also greatly thank anonymous reviewers for reviewing the manuscript.

Conflicts of Interest

The authors declare no conflict of interest.

References

  1. Shan, K.; Song, L.; Chen, W.; Li, L.; Liu, L.; Wu, Y.; Jia, Y.; Zhou, Q.; Peng, L. Analysis of environmental drivers influencing interspecific variations and associations among bloom-forming cyanobacteria in large, shallow eutrophic lakes. Harmful Algae 2019, 84, 84–94. [Google Scholar] [CrossRef] [PubMed]
  2. Potočár, T.; Pereira, J.A.V.; Brányiková, I.; Barešová, M.; Pivokonský, M.; Brányik, T. Alkaline flocculation of Microcystis aeruginosa induced by calcium and magnesium precipitates. J. Appl. Phycol. 2019, 32, 329–337. [Google Scholar] [CrossRef]
  3. Jochimsen, M.C.; Kümmerlin, R.; Straile, D. Compensatory dynamics and the stability of phytoplankton biomass during four decades of eutrophication and oligotrophication. Ecol. Lett. 2012, 16, 81–89. [Google Scholar] [CrossRef] [PubMed] [Green Version]
  4. Jeppesen, E.; Søndergaard, M.; Jensen, J.P.; Havens, K.E.; Anneville, O.; Carvalho, L.; Coveney, M.F.; Deneke, R.; Dokulil, M.T.; Foy, B. Lake responses to reduced nutrient loading–an analysis of contemporary long-term data from 35 case studies. Freshwat. Biol. 2005, 50, 1747–1771. [Google Scholar] [CrossRef]
  5. Rigosi, A.; Carey, C.C.; Ibelings, B.W.; Brookes, J.D. The interaction between climate warming and eutrophication to promote cyanobacteria is dependent on trophic state and varies among taxa. Limnol. Oceanogr. 2014, 59, 99–114. [Google Scholar] [CrossRef] [Green Version]
  6. Zhang, M.; Shi, X.; Yang, Z.; Yu, Y.; Shi, L.; Qin, B. Long-term dynamics and drivers of phytoplankton biomass in eutrophic Lake Taihu. Sci. Total Environ. 2018, 645, 876–886. [Google Scholar] [CrossRef]
  7. Edwards, K.F.; Litchman, E.; Klausmeier, C.A. Functional traits explain phytoplankton community structure and seasonal dynamics in a marine ecosystem. Ecol. Lett. 2013, 16, 56–63. [Google Scholar] [CrossRef]
  8. Guan, Y.; Zhang, M.; Yang, Z.; Shi, X.; Zhao, X. Intra-annual variation and correlations of functional traits in Microcystis and Dolichospermum in Lake Chaohu. Ecol. Indic. 2020, 111, 106052. [Google Scholar] [CrossRef]
  9. Nguyen, M.K.; Moon, J.-Y.; Lee, Y.-C. Loading effects of low doses of magnesium aminoclay on microalgal Microcystis sp. KW growth, macromolecule productions, and cell harvesting. Biomass Bioenergy 2020, 139, 105619. [Google Scholar] [CrossRef]
  10. Ehrlich, E.; Kath, N.J.; Gaedke, U. The shape of a defense-growth trade-off governs seasonal trait dynamics in natural phytoplankton. ISME J. 2020, 14, 1451–1462. [Google Scholar] [CrossRef]
  11. Li, R.; Chen, Q.; Zhang, X.; Recknagel, F. Effects of temperature and macronutrients on phytoplankton communities across three largely different lakes identified by a time–space trade-off approach. Ecol. Inform. 2015, 29, 174–181. [Google Scholar] [CrossRef]
  12. Yang, Z.; Kong, F.X.; Cao, H.S.; Shi, X.L. Observation on colony formation of Microcystis aeruginosa induced by filtered lake water under laboratory conditions. Ann. De Limnol.-Int. J. Limnol. 2009, 41, 169–173. [Google Scholar] [CrossRef]
  13. Chen, H.; Lurling, M. Calcium promotes formation of large colonies of the cyanobacterium Microcystis by enhancing cell-adhesion. Harmful Algae 2020, 92, 101768. [Google Scholar] [CrossRef]
  14. Tan, X.; Shu, X.; Duan, Z.; Parajuli, K. Two types of bound extracellular polysaccharides and their roles in shaping the size and tightness of Microcystis colonies. J. Appl. Phycol. 2019, 32, 255–262. [Google Scholar] [CrossRef]
  15. Li, M.; Zhu, W.; Guo, L.; Hu, J.; Chen, H.; Xiao, M. To increase size or decrease density? Different Microcystis species has different choice to form blooms. Sci. Rep. 2016, 6, 37056. [Google Scholar] [CrossRef] [Green Version]
  16. Brown, C.R. The ecology and evolution of colony-size variation. Behav. Ecol. Sociobiol. 2016, 70, 1613–1632. [Google Scholar] [CrossRef]
  17. Brandenburg, K.M.; Sylke, W.; Uwe, J.; Anke, K.; Jacqueline, J.; Bernd, K.; Van, D.; Ian, D. Intraspecific trait variation and trade-offs within and across populations of a toxic dinoflagellate. Ecol. Lett. 2018, 21, 1561–1571. [Google Scholar] [CrossRef] [Green Version]
  18. Kong, X.; He, Q.; Yang, B.; He, W.; Xu, F.; Janssen, A.B.G.; Kuiper, J.J.; van Gerven, L.P.A.; Qin, N.; Jiang, Y.; et al. Hydrological regulation drives regime shifts: Evidence from paleolimnology and ecosystem modeling of a large shallow Chinese lake. Glob. Chang. Biol. 2017, 23, 737–754. [Google Scholar] [CrossRef]
  19. Zhang, M.; Zhang, Y.; Yang, Z.; Wei, L.; Yang, W.; Chen, C.; Kong, F. Spatial and seasonal shifts in bloom-forming cyanobacteria in Lake Chaohu: Patterns and driving factors. Phycol. Res. 2016, 64, 44–55. [Google Scholar] [CrossRef]
  20. Li, X.D.; Chen, Y.H.; Liu, C.; Hong, J.; Deng, H.; Yu, D.J. Eutrophication and related antibiotic resistance of enterococci in the Minjiang River, China. Microb. Ecol. 2020, 80, 1–13. [Google Scholar] [CrossRef]
  21. Utermöhl, U.F. Zur Vervollkommnung der quantitativen Erfassung des Planktons. Verh. Int. Ver. Limnol. 1958, 5, 567–595. [Google Scholar]
  22. Hu, H.; Wei, Y. The Freshwater Algae of China: Systematics, Taxonomy and Ecology; Science Press: Beijing, China, 2006. [Google Scholar]
  23. Li, R.; Watanabe, M.; Watanabe, M.M. Taxonomic studies of planktic species of Anabaena based on morphological characteristics in cultured strains. Hydrobiologia 2000, 438, 117–138. [Google Scholar] [CrossRef]
  24. Hillebrand, H.; Dürselen, C.D.; Kirschtel, D.; Pollingher, U.; Zohary, T. Biovolume calculation for pelagic and benthic microalgae. J. Phycol. 1999, 35, 403–424. [Google Scholar] [CrossRef]
  25. Rott, E. Chlorophyll-a-konzentrationen und zellvolumen als parameter der phytoplakntonbiomasse. Ber. Nat.-Med. Ver. Innsbr. 1978, 65, 11–21. [Google Scholar]
  26. R-C-Team. R: A Language and Environment for Statistical Computing; R Core Team: Vienna, Austria, 2020. [Google Scholar]
  27. Jin, Z.H.; Tu, C.Q.; Wang, S.H.; Chen, J.Y.; Lu, C.Y.; Huang, W. Phosphorus adsorption characteristics and loss risk in sediments of Lake Bay during the overwinter period of cyanobacteria. Environ. Sci. 2022, 43, 1976–1987. [Google Scholar] [CrossRef]
  28. Wang, X.; Zhang, M.; Yin, J. Composition and influential factors of phytoplankton function groups in Lake Chaohu. J. Lake Sci. 2018, 30, 431–440. [Google Scholar] [CrossRef] [Green Version]
  29. Hu, M.; Zhang, Y.; Ma, R.; Xue, K.; Cao, Z.; Chu, Q.; Jing, Y. Optimized remote sensing estimation of the lake algal biomass by considering the vertically heterogeneous chlorophyll distribution: Study case in Lake Chaohu of China. Sci. Total Environ. 2021, 771, 144811. [Google Scholar] [CrossRef]
  30. Wan, L.; Chen, X.; Deng, Q.; Yang, L.; Li, X.; Zhang, J.; Song, C.; Zhou, Y.; Cao, X. Phosphorus strategy in bloom-forming cyanobacteria (Dolichospermum and Microcystis) and its role in their succession. Harmful Algae 2019, 84, 46–55. [Google Scholar] [CrossRef]
  31. Zhang, M.; Yang, Z.; Yu, Y.; Shi, X. Interannual and Seasonal Shift between Microcystis and Dolichospermum: A 7-Year Investigation in Lake Chaohu, China. Water 2020, 12, 1978. [Google Scholar] [CrossRef]
  32. Reynolds, C.S. Ecology of Phytoplankton (Ecology, Biodiversity and Conservation); Cambridge University Press: Cambridge, UK, 2006. [Google Scholar]
  33. Zhu, X.; Li, Q.; Yin, C.; Fang, X.; Xu, X. Role of Spermidine in Overwintering of Cyanobacteria. J. Bacteriol. 2015, 197, 2325–2334. [Google Scholar] [CrossRef] [Green Version]
  34. Misson, B.; Latour, D. Influence of light, sediment mixing, temperature and duration of the benthic life phase on the benthic recruitment of Microcystis. J. Plankton Res. 2011, 34, 113–119. [Google Scholar] [CrossRef]
  35. Symes, E.; van Ogtrop, F.F. The effect of pre-industrial and predicted atmospheric CO2 concentrations on the development of diazotrophic and non-diazotrophic cyanobacterium: Dolichospermum circinale and Microcystis aeruginosa. Harmful Algae 2019, 88, 101536. [Google Scholar] [CrossRef] [PubMed]
  36. Eigemann, F.; Schwartke, M.; Schulz-Vogt, H. Niche separation of Baltic Sea cyanobacteria during bloom events by species interactions and autecological preferences. Harmful Algae 2018, 72, 65–73. [Google Scholar] [CrossRef] [PubMed]
  37. Ratcliff, W.C.; Fankhauser, J.D.; Rogers, D.W.; Greig, D.; Travisano, M. Origins of multicellular evolvability in snowflake yeast. Nat. Commun. 2015, 6, 6102. [Google Scholar] [CrossRef] [Green Version]
  38. Yang, Z.; Kong, F. Formation of large colonies: A defense mechanism of Microcystis aeruginosa under continuous grazing pressure by flagellate Ochromonas sp. J. Limnol. 2012, 71, e5. [Google Scholar] [CrossRef] [Green Version]
  39. Haakonsson, S.; Rodriguez-Gallego, L.; Somma, A.; Bonilla, S. Temperature and precipitation shape the distribution of harmful cyanobacteria in subtropical lotic and lentic ecosystems. Sci. Total Environ. 2017, 609, 1132. [Google Scholar] [CrossRef]
  40. Ma, J.; Brookes, J.D.; Qin, B.; Paerl, H.W.; Gao, G.; Wu, P.; Zhang, W.; Deng, J.; Zhu, G.; Zhang, Y.; et al. Environmental factors controlling colony formation in blooms of the cyanobacteria Microcystis spp. in Lake Taihu, China. Harmful Algae 2013, 31, 136–142. [Google Scholar] [CrossRef]
  41. Zhu, W.; Zhou, X.; Chen, H.; Gao, L.; Xiao, M.; Li, M. High nutrient concentration and temperature alleviated formation of large colonies of Microcystis: Evidence from field investigations and laboratory experiments. Water Res. 2016, 101, 167–175. [Google Scholar] [CrossRef]
  42. Xiao, M.; Li, M.; Reynolds, C.S. Colony formation in the cyanobacterium Microcystis. Biol. Rev. 2018, 93, 1399–1420. [Google Scholar] [CrossRef] [Green Version]
Figure 1. Map of Lake Chaohu showing the locations of six sampling sites.
Diversity 14 00435 g001
Figure 2. Monthly variation in total nitrogen (TN), total phosphorus (TP), permanganate index (CODMn) and water temperature in Lake Chaohu from November 2016 to October 2017.
Diversity 14 00435 g002
Figure 3. Phytoplankton community composition from Nov. 2016 to October 2017 in the eastern area (a), central area (b), western area (c) and whole lake area (d) of Lake Chaohu. The numbers in the graph indicate the abundance percentage of these genera.
Diversity 14 00435 g003
Figure 4. The monthly variations in the cell diameter of Dolichospermum flos-aquae in the different lake areas. The letters indicate the significance of the differences among the months.
Diversity 14 00435 g004
Figure 5. The monthly variations in Microcystis aeruginosa cell diameter in the different lake areas. The letters indicate the significance of the differences among the months.
Diversity 14 00435 g005
Figure 6. Seasonal shifts in colony size in the eastern area (a), central area (b) and western area (c) of Lake Chaohu.
Diversity 14 00435 g006
Figure 7. The relationship between cell diameter and colony size in Dolichospermum ((a), the circle) and Microcystis ((b), the squsre). The solid lines on the left panel were significant fitting lines with linear regression and generalized linear model. The dashed line on the right panel indicated that the linear regression was not significant.
Diversity 14 00435 g007
Table 1. Environmental parameters summarized as the mean values ± standard error in Lake Chaohu from November 2016 to October 2017. The letters indicated the significance of the differences among the lake regions. TN: Total nitrogen, TP: total phosphorus, CODMn: permanganate index, SD: Transparency and Depth: water depth.
TN (mg/L)TP (mg/L)CODMn (mg/L)pHSD (cm)Depth (m)T (°C)
East2.01 ± 1.10 c0.10 ± 0.06 c4.49 ± 2.29 b7.31 ± 0.7612 ± 6.623.54 ± 0.3517.66 ± 7.84
Central2.28 ± 1.03 b0.13 ± 0.10 b4.67 ± 1.51 b7.46 ± 0.839.75 ± 5.273.62 ± 0.3917.47 ± 7.79
West4.11 ± 3.87 a0.27 ± 0.34 a6.60 ± 6.99 a7.56 ± 0.9013.04 ± 7.773.25 ± 0.4117.62 ± 7.41
Publisher’s Note: MDPI stays neutral with regard to jurisdictional claims in published maps and institutional affiliations.

