Article

Ant Diversity Declines with Increasing Elevation along the Udzungwa Mountains, Tanzania

by
Caroline Kunene
1,
Stefan H. Foord
2,
Nikolaj Scharff
3,
Thomas Pape
3,
Jagoba Malumbres-Olarte
4,5 and
Thinandavha C. Munyai
1,*
1
School of Life Sciences, University of KwaZulu-Natal, Private Bag X01, Scottsville 3209, South Africa
2
NRF SARChI Chair for Biodiversity Value and Change, Centre for Invasion Biology, School of Mathematical & Natural Science, University of Venda, P Bag X5050, Thohoyandou 0950, South Africa
3
Natural History Museum of Denmark, University of Copenhagen, DK-1123 Copenhagen, Denmark
4
cE3c—Centre for Ecology, Evolution and Environmental Changes/Azorean Biodiversity Group, Faculty of Agriculture and Environment, University of the Azores, 9700-042 Angra do Heroísmo, Portugal
5
LIBRe—Laboratory for Integrative Biodiversity Research, Finnish Museum of Natural History, University of Helsinki, 00100 Helsinki, Finland
*
Author to whom correspondence should be addressed.
Diversity 2022, 14(4), 260; https://doi.org/10.3390/d14040260
Submission received: 7 January 2022 / Revised: 24 March 2022 / Accepted: 26 March 2022 / Published: 30 March 2022
(This article belongs to the Special Issue Diversity, Biogeography and Community Ecology of Ants II)

Abstract

:
Biodiversity patterns along elevational gradients are generally characterised by monotonic decreases or mid-elevational peaks in species richness, while elevational zones may be characterised by distinct assemblages, or higher zones may be subsets of lowland assemblages. Elevational gradients in diversity have been less studied in the Afrotropical region. This study documents ant diversity patterns in three forest types associated with the tropical mountains of Udzungwa; we hypothesise that: (1) ant diversity and activity will show a monotonic decrease from mid-elevation with increasing elevation and (2) that forests associated with different elevations will have a distinct ant assemblage. Pitfall traps were deployed at three targeted elevations (650–800, 800–1400, and 1400–1500 m a.s.l.). Ant species richness declined with increasing elevation from 650 m a.s.l. and formed three elevational assemblages with lower elevation forests having almost twice as many species as sub-montane forests and three times as many as that of the montane forests. In contrast, overall ant activity peaked at 800–1400 m a.s.l. The ant assemblages associated with the lower elevation forest were very distinct, while assemblages associated with the sub-montane and montane forests shared species. Our study reveals valuable and relevant information for biodiversity monitoring and conservation planning as the species associated with each forest type may be used as indicator species for assessing biodiversity responses to climate change and anthropogenic activities on these mountains.

1. Introduction

One of the central goals in ecology is to understand distributional patterns and the abundance of living organisms. This understanding allows ecologists to assess and monitor changes in ecosystems and develop conservation priorities and policies [1,2]. To achieve this goal, ecologists must first quantify and characterise communities across various ecosystems. This involves a description of assemblage structures and their variations across time and space [3].
Environmental gradients have been the target of much research; they facilitate studying the response of biodiversity to climatic conditions and how they vary across space and time [4,5,6,7,8,9,10]. The latitudinal gradient of increasing richness from polar regions to the equator [7] has been one of the best documented biodiversity patterns and is relatively consistent across taxa and regions [11]. Elevational gradients have also been widely studied, but changes in biodiversity along this gradient vary depending on the taxa as well as region [12,13,14].
Altitudinal gradients are powerful model systems [15]. They provide natural experiments for investigating the response of biodiversity to environmental conditions within a small geographic space [16], which makes it particularly easy to test hypotheses about patterns and processes that may occur at a larger scale [17]. The drop in air temperature by 0.6–1.0 °C for every 100 m rise in elevation limits species from moving further up the mountain (especially thermophilic species) and suggests that ecosystems at high altitudes (with the predicted 2 °C increase in air temperature by year 2100) are more vulnerable to climate change, making research on patterns along altitudinal gradients important for conservation [18,19]. Climate change research [20,21,22] predicts a general increase in annual average temperature globally, which will shift eco-zones upwards and result in the disappearance of habitats. This may result in the extinction of affected species and negatively impact local ecosystem functioning [23]. Therefore, it is important to map and understand biodiversity patterns and identify the factors that generate and sustain high concentrations of biodiversity along elevations to support conservation programmes.
The Udzungwa Mountains are part of the Eastern Arc Mountains, a mountain chain stretching from Southeastern Kenya to Southern Tanzania along the coast [24,25]. This mountain chain, together with other Afromontane areas in Eastern Zaire and Ethiopia, is recognised as a biodiversity hotspot [26] and a conservation site for iconic endemic primate species, such as the Udzungwa red colobus (Piliocolobus gordonorum Matschie, 1900) and the Sanje mangabey (Cercocebus sanjei Mittermeier, 1986) [27,28]. Arguably, it also hosts the second richest bird diversity in Africa [27]. Much of what is known about the faunal diversity is from avifauna [27,29,30] and mammal studies [25,31,32], and very little is known about invertebrates, with data emerging especially for slugs [33], spiders [3], millipedes [34], dragonflies [35], Lepidoptera [36], and beetles [37].
Ants are a diverse and important group of insects in tropical rainforests [38]. They contribute an estimated 10–20% of animal biomass in terrestrial ecosystems and are of great ecological importance [39] as they are found in all forest strata and serve as herbivores, scavengers, and predators. Furthermore, they are ecosystem engineers [40] and can be used as biological indicators [41]. The species composition and ecological characteristics of ants species vary along environmental gradients [42], therefore making the presence or absence of a particular species a potentially appropriate indicator of environmental stress [42,43]. Climatic variables, especially temperature and precipitation, are some of the main drivers of ant diversity and assemblage composition across gradients [13,16].
For ant species richness, two general patterns have been observed across elevational gradients: either a decline with increasing elevation [38] or mid-elevational peak [12]. While some studies have reported an increase in ant species richness with increasing elevation, other studies have observed no clear pattern [44]. However, most of these studies set their lowest elevation at 500 m asl, so they assessed only partial gradients.
Here, we document the diversity patterns of ant communities in three forest types along an altitudinal gradient in the Udzungwa Mountains and characterise them by testing the following hypotheses: (1) ant diversity will decline with increasing elevation considering that ants are largely thermophilic, and (2) there will be distinct ant assemblage compositions that correspond to the three main forest types at different elevations.
Our findings will contribute to the knowledge on how Afrotropical ants are distributed along the main forest and in elevation. Furthermore, our findings will reveal useful and relevant information for biodiversity monitoring and conservation planning.

2. Materials and Methods

2.1. Study Site Description

The Udzungwa Mountains (−8.503722 35.9076; −7.678377 36.94129) are widely recognised for their outstanding biodiversity and high endemicity [28]. They form the largest mountain block of the Eastern Arc Mountains [45] covering 10,000 km 2. Their long-term climatic stability has allowed the habitats in these mountains to endure for millions of years [24]. The Udzungwa mountain ranges in altitude from 200 to 2500 m a.s.l. along which different habitats are found, including lower elevation rainforest (300–800 m a.s.l.); sub-montane rainforest (700–1400 m a.s.l.) covered by a moist forest consisting of evergreen species; montane rainforest (1400–1800 m a.s.l.); and mountain bamboo forest (2400 m a.s.l.) covered by a mosaic of bamboo (Sinarundinaria alpina) and Hagenia abyssinica, as described by Shangali et al. [46]. The climate in the Udzungwa Mountains is variable, and the eastern slopes receive 2000–3000 mm of rain per year due to the influence of the Indian Ocean [25,47]. More specifically, the lower elevation forest experiences an average temperature of 22.9 °C and an average humidity of 88%. The sub-montane and montane forests experience an average temperature of 20.02 °C and 17.08 °C, respectively, while the humidity is 94.26% and 96.25%, respectively. The main rainy season is between March and May, and there is a light rainy season between November and February [47]. Our study was conducted in the Udzungwa Mountain National Park and the Uzungwa Scarp Nature Reserve in the southern part of the Udzungwa Mountains [25].

2.2. Ant Sampling

We set up five elevational transects, each with a 50 m × 50 m square plot at targeted elevations (650–800, 800–1400, and 1400–1500 m a.s.l.) for a total of 15 plots (Figure S1). These three elevations correspond to three main forest types: lower elevation forest, submontane forest, and montane forest, respectively (Table 1) [48]. The five transects were separated horizontally by 0.1, 1, 20, and 175 km from the first transect (Figure S1). At each 50 m × 50 m square plot, 12 pitfall traps were installed 4 m apart on each side of the plot (Figure S1) for a total of 48 traps. However, it needs to be noted that the lowest sampled elevation was 650 m a.s.l.; therefore, we studied a partial gradient.
We combined four contiguous traps to form a sample so that we obtained 12 samples from each plot. This sampling design was part of the application of the Conservation Oriented Biodiversity Rapid Assessment for Tropical Forests (COBRA-TF) sampling protocol [49]. Pitfall traps were partly filled with preservative solution (propylene glycol) and a few drops of liquid soap to break the surface tension and to be protected against rain and falling leaves using lids on stilts about 2–3 cm above the ground. The traps ran for 14 days from October to November in 2014.
Samples were washed and sorted in the laboratory and stored in 96% ethanol at −20 °C. Ants were identified to genus using Fisher and Bolton [50] and then identified to species where possible using online databases, viz., AntWiki (http://www.antwiki.org/, accessed on 22 March 2019) and AntWeb (http://antweb.org/, accessed on 25 March 2019). Number codes were assigned to unidentified ant species. Voucher specimens of all species are deposited in the Natural History Museum of Denmark.

2.3. Data Analysis

Sample coverage for species richness was analysed in iNEXT online software [51]. Sampling completeness based on Chao1 richness estimators was determined using EstimateS (Version 9.1.0) [52], and graphs were drawn using R [53]. Chao1 is a known qualitative measure of alpha diversity that considers the ratio of singletons to doubletons and, therefore, considers rare species. The Simpson diversity index was also used to compare dominance between the three main habitats and plots.
The species composition of the ant communities was visualised by non-metric multidimensional scaling (nMDS) using Sorensen’s index dissimilarity matrix based on presence/absence data. The comparison of species composition within the three habitat types was conducted using PERMANOVA in R [53]. The characteristic species of each habitat was determined using the Indicator Value Method (IndVal), which uses the degrees of specificity (uniqueness to a particular site) and fidelity (frequency within the vegetation type/aspect) of each species [54]. An indicator value above 70% shows that a species is both highly specific and has a high fidelity to a given site. The significance of the IndVal values was then tested by random reallocation of replicates among groups [44].

3. Results

3.1. Ant Diversity across Three Main Forest Types along the Elevational Gradient

A total of 31 776 ant specimens belonging to five subfamilies, 34 genera, and 101 morphospecies was collected (Table S1). Myrmicinae was the most diverse subfamily with the highest number (54%) of ant foragers in pitfall traps, 50% of the total number of species (51 species), and 41% of the total number of genera (Table 2). The second most diverse subfamily was Ponerinae with 24% of the species and 29% of the total number of genera, followed by Formicinae with 19% of the species and 18% of the total number of genera. The least diverse subfamilies were Dolichoderinae and Dorylinae with 3% and 4% of the total species richness, respectively. However, Dorylinae had the second highest ant activities. The most speciose genera were Tetramorium (19 species), Pheidole (8 species), and Strumigenys (6 species), while Camponotus and Crematogaster had five species each (Table S1).

3.2. Sampling Completeness

Sampling coverage was nearly complete for the three habitat types, lower elevation, sub-montane, and montane forests, as sampling coverage was close to 1 (Table 3). Coverage was the lowest in lower elevation forests (Figure S2).

3.3. Species Diversity Patterns

Ant activity, which is represented by the total number of individuals per plot, was the highest at mid-elevation mainly because of Myrmicaria rustica angustior (27% of the total activities). At low elevations, Dorylus helvolus dominated ant activities and contributed 27% of the total ant activities. Simpson’s index suggests that lower elevation forest ant communities were the most diverse (0.664), followed by the mid-elevation ones (0.49), with the high elevation communities being the least diverse (0.44). Species richness was higher at low elevations (31 ± 8), followed by mid-elevations (20 ± 9), and finally high elevations (15 ± 7) (Table 3). In the low elevation forest, seventy-four percent of the species were found, while 44% and 33% were collected in the sub-montane and montane forests, respectively.

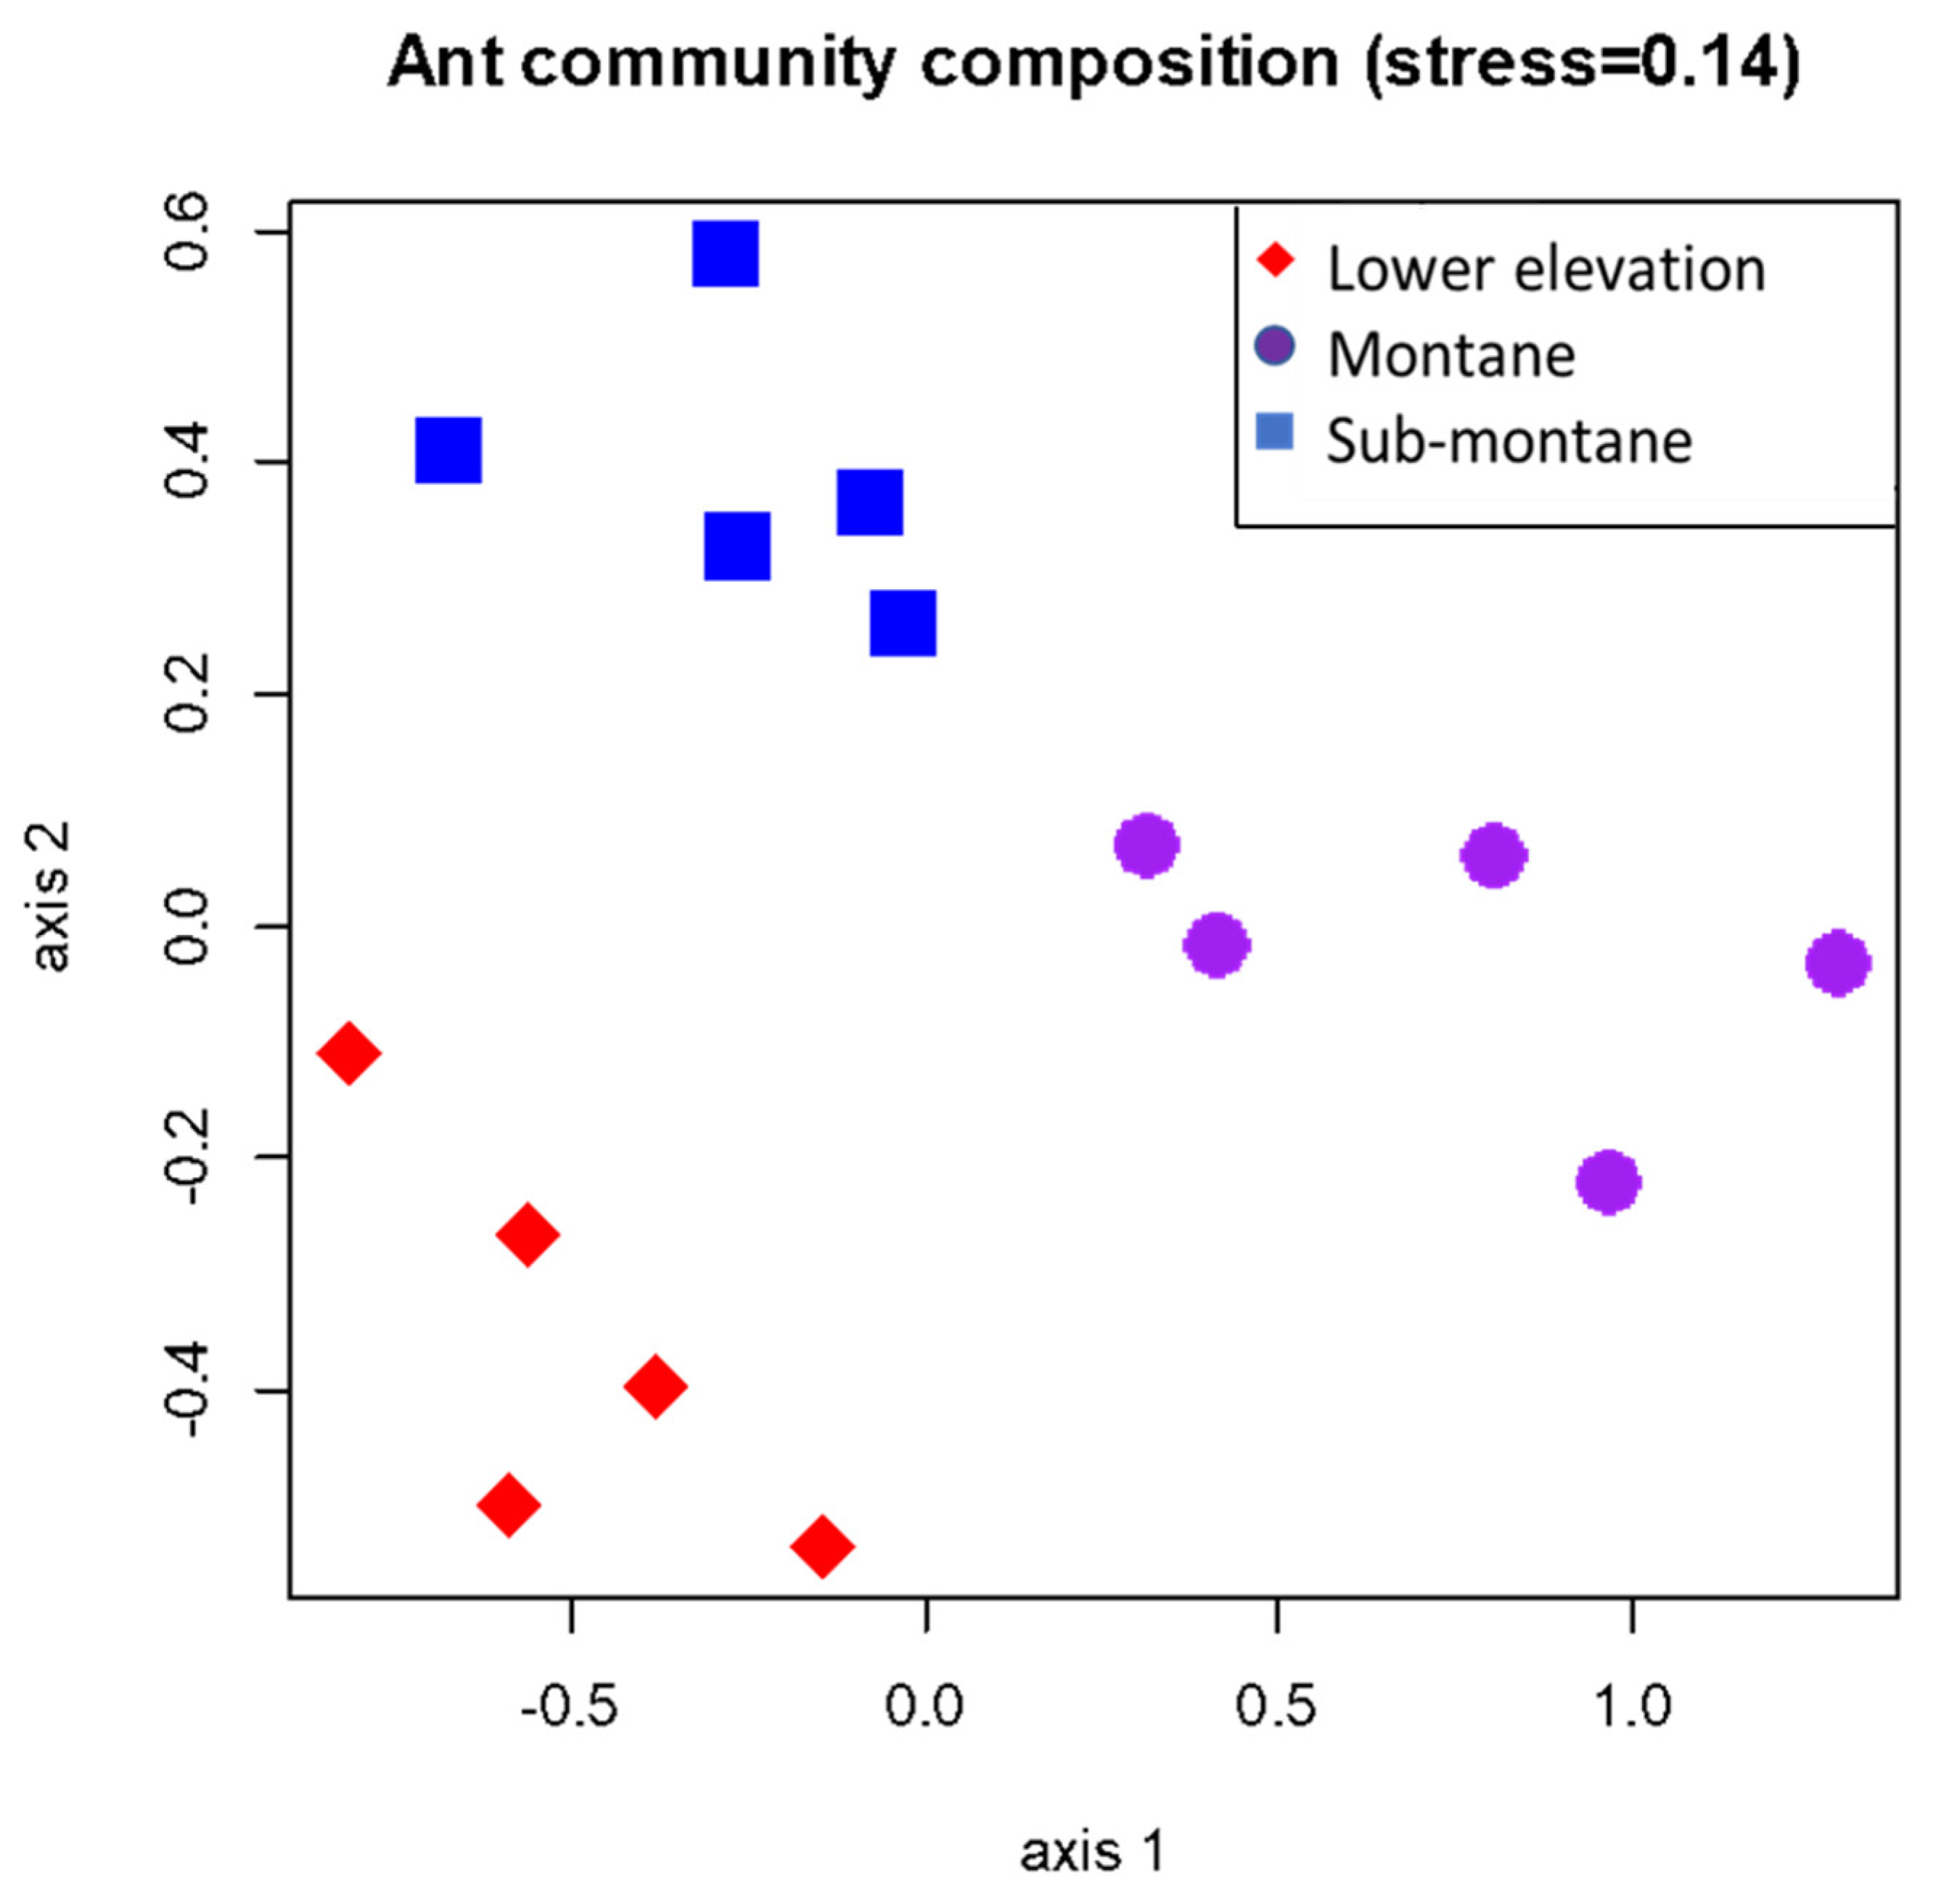
3.4. Ant Assemblage Composition across Gradients

The NMDS showed distinct species assemblages according to their elevations (Figure 1; Figure S3). PERMANOVA confirmed significant differences in species composition between plots at the three elevations (df = 2; Pseudo-F = 2.7863; p = 0.002).

3.5. Indicators Species

Fifteen species had a wide distribution and occurred at all elevations; thirty-seven species were associated with the lower elevation forest, eleven were associated with the sub-montane, and nine were associated with the montane forest (Figure S3; Table S1). However, the latter species were not characteristic of the different forest types. Five species were exclusively sampled in the lower elevation forest, while the sub-montane forest and montane forest had two characteristic species each (Table 4).

4. Discussion

Ant species numbers declined with increasing elevation from 650 m a.s.l. along the Udzungwa Mountains. This is a widely observed pattern along elevational gradients [55,56] but not for all other taxa studied across the Udzungwa Mountains. Along these mountains, ground dwelling spiders increased with elevation [3], bird richness peaked at mid-elevations [30], and plants and small mammals increased with elevation [24,57]; however, it needs to be noted that all these studies were along a partial gradient. Similarly, in other Afrotropical studies, ant species richness patterns along partial elevation gradients varied between mountains and aspects. A mid-elevation peak was observed along the Maloti-Drakensberg mountains (900 to 3000 m a.s.l.) [16] and northern aspect of Soutpansberg mountains (800 to 1700 m asl) but decreased with elevation on the southern aspect of the latter mountain [13], while a complete gradient by Botes, McGeoch, Robertson, van Niekerk, Davids, and Chown [44] along the Cederberg mountains (sea level—1926 m a.s.l.) reported no clear pattern in their study.
It is widely accepted that ants are generally thermophilic [43]. The distribution of ants is mainly determined by their tolerance to heat [58]; therefore, a decrease in ant species along an altitudinal gradient may be explained by the decrease in temperature with altitude [16,17]. Cooler temperatures may slow down metabolic processes of ants, affect the development of eggs and larvae, affect their foraging activities, and consequently reduce their primary productivity [59]. The limited tolerance of ants to the cold may also cause niche conservatism and limit their species ranges [60]. Mountain areas have bands of climatic conditions that act as barriers, limiting the establishment of species in different areas. Each barrier, therefore, creates a difference in species richness [60,61].
Three highly distinct ant assemblages associated with the three forest types were evident. These findings are similar to those of spiders in the Udzungwa Mountains [3]. However, ant assemblages seem to be more distinct, and lower elevation forests had the most distinct assemblages while montane and sub-montane shared species between them (Figure S3). Tropical species have narrow elevational ranges as the stable local environmental conditions allow them to specialise relative to those specific conditions [62]. The latter may explain the separation of assemblages with respect to elevation zones. The distinct low elevation assemblages may be a result of many tropical lower elevation species possessing narrow fundamental niches limiting their distribution to the lower elevation, while other species may occur in more than one elevation as a result of their wider tolerances [63].
The homogeneous habitat structure, as described by some authors (for example, see Lovett [48]), might be the reason for the similarities between the mid- and high-elevation communities, and therefore resembles the distribution of spider communities on the same mountain [3]. However, other important factors may structure arthropod assemblages that might have contributed to this pattern: for example, how species are specialised to resources and their physiological tolerances to climatic conditions [63].
In the tropics, lowland species are reported to have very narrow fundamental niches, which limits their distribution to the lowland [64], which matches our findings (Figure S2). These species vary from subterranean species, a widely distributed Technomyrmex pallipes, to the common rainforest ant Odontomachus assiniensis, a predatory species common in evergreen forests as well as the common and generalist ant species Monomorium mirandum [65]. Many of the ant species in this study favour the lower elevation forest, as shown by the number of species and species associations.
Fewer ant species were restricted to the montane forest, and only two were characteristic of this forest type. Some species seemed to have larger distributional ranges as they were found in all three vegetation zones. This is typical of tropical species at higher elevations as they tend to be generalists with wider tolerances [66] compared to those in lower elevation forests. However, in the current study, species showing wide tolerances were found across the mountain. Amongst them were both generalists and specialised genera such as Myrmicaria (Tropical Climate Specialists), Pheidole (Generalised Myrmicinae), and Solenopsis (Hot Climate Specialists) [67]. However, all these species may be generalists on these mountains as they have wide geographic distribution and show no habitat preferences.
The two most abundant species were Myrmicaria rustica angustior and Dorylus helvolus. The former is found in open areas of Afrotropical regions, and together with some other species in the genus Myrmicaria, they are well-known honeydew feeders and scavengers [68], while some species are even predatory, feeding on other insects. In the current study, Myrmicaria rustica angustior was collected in all habitats and, therefore, did not show any habitat preferences. This can be explained by the fact that the species of genus Myrmicaria do not have a specialised diet [69,70]. Myrmicaria rustica angustior activity peaked at mid-elevations, perhaps owing to overlapping ranges of the lower elevation and montane forests resulting in the edges providing more open habitats for ants to inhabit [64]. However, another influential species, Dorylus helvolus, declined in abundance with increasing elevation. The species of genus Dorylus are generalist predators that consume any kind of prey ranging from immatures of other insects to vertebrate carrion, and this may explain their occurrence throughout the mountains [69]. Moreover, the Dorylus species are known to move nests in response to prey availability [71] and are most likely to have been influenced by this foraging behaviour as their colonies migrate to new colonies in irregular intervals resulting in new colonies forming through colony fission [69].

5. Conclusions

Conservation plans can benefit from the information that we provide here: The species that we have identified as associated with each forest type may be used as an indicator species for monitoring the response of biodiversity to climate change and anthropogenic activities on these mountains. The importance of the Udzungwa Mountains for conserving Eastern Arc biodiversity has been emphasised [27], but biological data on mainly vertebrates and plants have been used in current conservation strategies. Furthermore, there is an urgent need for further research on the effects of the environmental and climatic factors on the diversity patterns of invertebrate communities in the Eastern Arc Mountains.

Supplementary Materials

The following are available online at https://www.mdpi.com/article/10.3390/d14040260/s1, Figure S1: The five (50 m × 50 m) plots consisting of 12 pitfall traps on each side of the plot 4 m apart at each elevation (lower elevation rainforest (650–800 m.a.s.l), sub-montane rainforest (800–1400 m.a.s.l), montane rainforest (1400–1500 m.a.s.l)), Figure S2: Interpolation and extrapolation of species diversity at three forest types (lower elevation, sub-montane, and montane) across the studied communities, Figure S3: A Venn diagram showing the number of species restricted and shared within the three forest types of the Udzungwa mountains and Table S1: Checklist of subfamilies and ant species collected in three habitat types of the Udzungwa mountains.

Author Contributions

J.M.-O., N.S. and T.P. designed the study and collected data; T.C.M. identified the ants; C.K. analysed the data and led the writing of the manuscript under the supervision of T.C.M. and S.H.F.; C.K., S.H.F., T.C.M., J.M.-O., N.S. and T.P. read, edited, and agreed to the published version of the manuscript. All authors have read and agreed to the published version of the manuscript.

Funding

The South African National Research Foundation, grant number 114416 to TC Munyai, grant number 87311 to SH Foord and Danish National Research Foundation for the funding (grant number DNRF96) provided to the Center for Macroecology, Evolution and Climate. NS and TP also acknowledge the support by the Carlsberg Foundation (project 2012_01_0504).

Institutional Review Board Statement

Sampling permits were provided by Tanzania National Parks (TANAPA), the Tanzania Commission for Science and Technology (COSTECH), and the Tanzania Wildlife Research Institute (TAWIRI).

Informed Consent Statement

Not applicable.

Data Availability Statement

The data presented in this study are openly available in FigShare at https://doi.org/10.6084/m9.figshare.19447445.v1.

Acknowledgments

We thank Tanzania National Parks (TANAPA), the Tanzania Commission for Science and Technology (COSTECH), and the Tanzania Wildlife Research Institute (TAWIRI) for providing permits to perform research in the Udzungwa Mountains National Park. Richard M. L. Laizzer and Aloyce Mwakisoma provided invaluable assistance in the field, and the Udzungwa Ecological Monitoring Center (UEMC) and its staff provided logistical support.

Conflicts of Interest

The authors declare no conflict of interest.

References

  1. Dickinson, K.J.M.; Mark, A.F.; Lee, W.G. Long-term monitoring of nonforest communities for biological conservation. New Zealand J. Bot. 1992, 30, 163–179. [Google Scholar] [CrossRef]
  2. Jost, L.; DeVries, P.; Walla, T.; Greeney, H.; Chao, A.; Ricotta, C. Partitioning diversity for conservation analyses. Divers. Distrib. 2010, 16, 65–76. [Google Scholar] [CrossRef]
  3. Malumbres-Olarte, J.; Crespo, L.; Cardoso, P.; Szuts, T.; Fannes, W.; Pape, T.; Scharff, N. The same but different: Equally megadiverse but taxonomically variant spider communities along an elevational gradient. Acta Oecologica-Int. J. Ecol. 2018, 88, 19–28. [Google Scholar] [CrossRef]
  4. McCoy, E.D. The distribution of insects along elevational gradients. Oikos 1990, 58, 313–322. [Google Scholar] [CrossRef]
  5. Brown, J.H. Mammals on mountainsides: Elevational patterns of diversity. Glob. Ecol. Biogeogr. 2001, 10, 101–109. [Google Scholar] [CrossRef] [Green Version]
  6. Sanders, N.J.; Moss, J.; Wagner, D. Patterns of ant species richness along elevational gradients in an arid ecosystem. Glob. Ecol. Biogeogr. 2003, 12, 93–102. [Google Scholar] [CrossRef] [Green Version]
  7. Willig, M.R.; Kaufman, D.M.; Stevens, R.D. Latitudinal gradients of biodiversity: Pattern, process, scale, and synthesis. Annu. Rev. Ecol. Evol. Syst. 2003, 34, 273–309. [Google Scholar] [CrossRef]
  8. Kaspari, M.; Ward, P.S.; Yuan, M. Energy gradients and the geographic distribution of local ant diversity. Oecologia 2004, 140, 407–413. [Google Scholar] [CrossRef]
  9. Arnan, X.; Cerda, X.; Retana, J. Ant functional responses along environmental gradients. J. Anim. Ecol. 2014, 83, 1398–1408. [Google Scholar] [CrossRef] [Green Version]
  10. Rahbek, C. The elevational gradient of species richness—A uniform pattern. Ecography 1995, 18, 200–205. [Google Scholar] [CrossRef]
  11. Tittensor, D.P.; Worm, B. A neutral-metabolic theory of latitudinal biodiversity. Glob. Ecol. Biogeogr. 2016, 25, 630–641. [Google Scholar] [CrossRef]
  12. Munyai, T.C.; Foord, S.H. Ants on a mountain: Spatial, environmental and habitat associations along an altitudinal transect in a centre of endemism. J. Insect Conserv. 2012, 16, 677–695. [Google Scholar] [CrossRef]
  13. Munyai, T.C.; Foord, S.H. Temporal Patterns of Ant Diversity across a Mountain with Climatically Contrasting Aspects in the Tropics of Africa. PLoS ONE 2015, 10, e0122035. [Google Scholar] [CrossRef] [PubMed] [Green Version]
  14. Peters, M.K.; Hemp, A.; Appelhans, T.; Behler, C.; Classen, A.; Detsch, F.; Ensslin, A.; Ferger, S.W.; Frederiksen, S.B.; Gebert, F.; et al. Predictors of elevational biodiversity gradients change from single taxa to the multi-taxa community level. Nat. Commun. 2016, 7, 13736. [Google Scholar] [CrossRef] [PubMed] [Green Version]
  15. Sundqvist, M.K.; Sanders, N.J.; Wardle, D.A. Community and Ecosystem Responses to Elevational Gradients: Processes, Mechanisms, and Insights for Global Change. Annu. Rev. Ecol. Evol. Syst. 2013, 44, 261–280. [Google Scholar] [CrossRef] [Green Version]
  16. Bishop, T.R.; Robertson, M.P.; van Rensburg, B.J.; Parr, C.L. Elevation-diversity patterns through space and time: Ant communities of the Maloti-Drakensberg Mountains of southern Africa. J. Biogeogr. 2014, 41, 2256–2268. [Google Scholar] [CrossRef] [Green Version]
  17. Sanders, N.J.; Lessard, J.P.; Fitzpatrick, M.C.; Dunn, R.R. Temperature, but not productivity or geometry, predicts elevational diversity gradients in ants across spatial grains. Glob. Ecol. Biogeogr. 2007, 16, 640–649. [Google Scholar] [CrossRef]
  18. Korner, C. The use of ’altitude’ in ecological research. Trends Ecol. Evol. 2007, 22, 569–574. [Google Scholar] [CrossRef] [PubMed]
  19. Wang, J.J.; Meier, S.; Soininen, J.; Casamayor, E.O.; Pan, F.Y.; Tang, X.M.; Yang, X.D.; Zhang, Y.L.; Wu, Q.L.; Zhou, J.Z.; et al. Regional and global elevational patterns of microbial species richness and evenness. Ecography 2017, 40, 393–402. [Google Scholar] [CrossRef]
  20. Chinn, W.G.H.; Chinn, T.J.H. Tracking the snow line: Responses to climate change by New Zealand alpine invertebrates. Arct. Antarct. Alp. Res. 2020, 52, 361–389. [Google Scholar] [CrossRef]
  21. Bruno, D.; Belmar, O.; Maire, A.; Morel, A.; Dumont, B.; Datry, T. Structural and functional responses of invertebrate communities to climate change and flow regulation in alpine catchments. Glob. Change Biol. 2019, 25, 1612–1628. [Google Scholar] [CrossRef] [PubMed] [Green Version]
  22. Brunetti, M.; Magoga, G.; Iannella, M.; Biondi, M.; Montagna, M. Phylogeography and species distribution modelling of Cryptocephalus barii (Coleoptera: Chrysomelidae): Is this alpine endemic species close to extinction? Zookeys 2019, 865, 3. [Google Scholar] [CrossRef] [PubMed] [Green Version]
  23. Pecl, G.T.; Araujo, M.B.; Bell, J.D.; Blanchard, J.; Bonebrake, T.C.; Chen, I.C.; Clark, T.D.; Colwell, R.K.; Danielsen, F.; Evengard, B.; et al. Biodiversity redistribution under climate change: Impacts on ecosystems and human well-being. Science 2017, 355, 6332. [Google Scholar] [CrossRef]
  24. Lovett, J.C.; Marshall, A.R.; Carr, J. Changes in tropical forest vegetation along an altitudinal gradient in the Udzungwa Mountains National Park, Tanzania. Afr. J. Ecol. 2006, 44, 478–490. [Google Scholar] [CrossRef]
  25. Rovero, F.; Marshall, A.R.; Jones, T.; Perkin, A. The primates of the Udzungwa Mountains: Diversity, ecology and conservation. J. Anthropol. Sci. 2009, 87, 93–126. [Google Scholar]
  26. Myers, N.; Mittermeier, R.A.; Mittermeier, C.G.; da Fonseca, G.A.B.; Kent, J. Biodiversity hotspots for conservation priorities. Nature 2000, 403, 853–858. [Google Scholar] [CrossRef]
  27. Dinesen, L.; Lehmberg, T.; Rahner, M.C.; Fjeldsa, J. Conservation priorities for the forests of the Udzungwa Mountains, Tanzania, based on primates, duikers and birds. Biol. Conserv. 2001, 99, 223–236. [Google Scholar] [CrossRef]
  28. Rovero, F.; De Luca, D.W. Checklist of mammals of the Udzungwa mountains of Tanzania. Mammalia 2007, 71, 47–55. [Google Scholar] [CrossRef]
  29. Cordeiro, N.J.; Lovett, J.C.; Mulungu, E.; Maina, G.G.; Gerstle, J.H. Initial trends of bird assemblages before and after river diversion in an endemic-rich African forest. Biodivers. Conserv. 2006, 15, 971–983. [Google Scholar] [CrossRef]
  30. Romdal, T.S.; Rahbek, C. Elevational zonation of afrotropical forest bird communities along a homogeneous forest gradient. J. Biogeogr. 2009, 36, 327–336. [Google Scholar] [CrossRef]
  31. Marshall, A.R.; Topp-Jorgensen, J.E.; Brink, H.; Fanning, E. Monkey abundance and social structure in two high-elevation forest reserves in the Udzungwa Mountains of Tanzania. Int. J. Primatol. 2005, 26, 127–145. [Google Scholar] [CrossRef]
  32. Marshall, A.R.; Lovett, J.C.; White, P.C.L. Selection of line-transect methods for estimating the density of group-living animals: Lessons from the primates. Am. J. Primatol. 2008, 70, 452–462. [Google Scholar] [CrossRef] [PubMed]
  33. Rowson, B.; Paustian, M.; Van Goethem, J. New species and records of terrestrial slugs from East Africa (Gastropoda, Urocyclidae, Veronicellidae, Agriolimacidae). Zookeys 2017, 723, 11–42. [Google Scholar] [CrossRef] [PubMed] [Green Version]
  34. Olsen, S.A.; Rosenmejer, T.; Enghoff, H. A mountain of millipedes IX: Species of the family Gomphodesmidae from the Udzungwa Mountains, Tanzania (Diplopoda, Polydesmida). Eur. J. Taxon. 2020, 675, 1–35. [Google Scholar] [CrossRef]
  35. Clausnitzer, V.; Dijkstra, K.D.B.; Kipping, J. Globally threatened dragonflies (Odonata) in Eastern Africa and implications for conservation. J. East Afr. Nat. Hist. 2011, 100, 89–111. [Google Scholar] [CrossRef]
  36. de Jong, R.; Congdon, T.C.E. The montane butterflies of the eastern African forests. In Biogeography and Ecology of the Rain Forests of Eastern Africa; Lovett, J.C., Wasser, S.K., Eds.; Cambridge University Press: Cambridge, UK, 1993; pp. 133–173. [Google Scholar]
  37. Zilihona, I.J.E.; Nummelin, M. Coleopteran diversity and abundance in different habitats near Kihansi waterfall, in the Udzungwa Mountains, Tanzania. Biodivers. Conserv. 2001, 10, 769–777. [Google Scholar] [CrossRef]
  38. Bruhl, C.A.; Mohamed, V.; Linsenmair, K.E. Altitudinal distribution of leaf litter ants along a transect in primary forests on Mount Kinabalu, Sabah, Malaysia. J. Trop. Ecol. 1999, 15, 265–277. [Google Scholar] [CrossRef] [Green Version]
  39. Hölldobler, B.; Wilson, E.O. The Ants; Harvard University Press: Cambridge, MA, USA, 1990. [Google Scholar]
  40. Folgarait, P.J. Ant biodiversity and its relationship to ecosystem functioning: A review. Biodivers. Conserv. 1998, 7, 1221–1244. [Google Scholar] [CrossRef]
  41. Andersen, A.N.; Majer, J.D. Ants show the way Down Under: Invertebrates as bioindicators in land management. Front. Ecol. Environ. 2004, 2, 291–298. [Google Scholar] [CrossRef]
  42. Wiescher, P.T.; Pearce-Duvet, J.M.C.; Feener, D.H. Assembling an ant community: Species functional traits reflect environmental filtering. Oecologia 2012, 169, 1063–1074. [Google Scholar] [CrossRef] [Green Version]
  43. Kaspari, M.; Weiser, M.D. Ant activity along moisture gradients in a neotropical forest. Biotropica 2000, 32, 703–711. [Google Scholar] [CrossRef]
  44. Botes, A.; McGeoch, M.A.; Robertson, H.G.; van Niekerk, A.; Davids, H.P.; Chown, S.L. Ants, altitude and change in the northern Cape Floristic Region. J. Biogeogr. 2006, 33, 71–90. [Google Scholar] [CrossRef]
  45. Burgess, N.D.; Butynski, T.M.; Cordeiro, N.J.; Doggart, N.H.; Fjeldsa, J.; Howell, K.M.; Kilahama, F.B.; Loader, S.P.; Lovett, J.C.; Mbilinyi, B.; et al. The biological importance of the Eastern Arc Mountains of Tanzania and Kenya. Biol. Conserv. 2007, 134, 209–231. [Google Scholar] [CrossRef]
  46. Shangali, C.F.; Mabula, C.K.; Mmari, C. Biodiversity and human activities in the Udzungwa Mountain forests, Tanzania. 1. Ethnobotanical survey in the Uzungwa scarp forest Reserve. J. East Afr. Nat. Hist. 1998, 87, 291–318. [Google Scholar] [CrossRef] [Green Version]
  47. Rovero, F.; Owen, N.; Jones, T.; Canteri, E.; Iemma, A.; Tattoni, C. Camera trapping surveys of forest mammal communities in the Eastern Arc Mountains reveal generalized habitat and human disturbance responses. Biodivers. Conserv. 2017, 26, 1103–1119. [Google Scholar] [CrossRef]
  48. Lovett, J.C. Tanzanian forest tree plot diversity and elevation. J. Trop. Ecol. 1999, 15, 689–694. [Google Scholar] [CrossRef] [Green Version]
  49. Malumbres-Olarte, J.; Scharff, N.; Pape, T.; Coddington, J.A.; Cardoso, P. Gauging megadiversity with optimized and standardized sampling protocols: A case for tropical forest spiders. Ecol. Evol. 2017, 7, 494–506. [Google Scholar] [CrossRef] [Green Version]
  50. Fisher, B.L.; Bolton, B. Ants of Africa and Madagascar: A Guide to the Genera; University of California Press: Orland, CA, USA, 2016. [Google Scholar]
  51. Chao, A.; Ma, K.H.; Hsieh, T.C. iNEXT (iNterpolation and EXTrapolation) Online: Software for Interpolation and Extrapolation of Species Diversity. 2016. Available online: http://chao.stat.nthu.edu.tw/wordpress/software_download (accessed on 25 March 2019).
  52. Colwell, R.K. EstimateS: Statistical Estimation of Species Richness and Shared Species from Samples. Version 9—User’s Guide and Application. Available online: http://purl.oclc.org/estimates (accessed on 25 March 2019).
  53. R Core Team. R: A Language and Environment for Statistical Computing; R Foundation for Statistical Computing: Vienna, Austria, 2020; Available online: https://www.R-project.org (accessed on 25 March 2019).
  54. Dufrene, M.; Legendre, P. Species assemblages and indicator species: The need for a flexible asymmetrical approach. Ecol. Monogr. 1997, 67, 345–366. [Google Scholar] [CrossRef]
  55. Grytnes, J.A.; Vetaas, O.R. Species richness and altitude: A comparison between null models and interpolated plant species richness along the Himalayan altitudinal gradient, Nepal. Am. Nat. 2002, 159, 294–304. [Google Scholar] [CrossRef]
  56. Stevens, G.C. The elevational gradient in altitudinal range—An extension of Rapoport latitudinal rule to altitude. Am. Nat. 1992, 140, 893–911. [Google Scholar] [CrossRef]
  57. Stanley, W.T.; Hutterer, R. Differences in abundance and species richness between shrews and rodents along an elevational gradient in the Udzungwa Mountains, Tanzania. Acta Theriol. 2007, 52, 261–275. [Google Scholar] [CrossRef]
  58. Dunn, R.R.; Guénard, B.; Weiser, M.D.; Sanders, N.J. Geographic Gradients. Ant Ecol. 2010, 91, 38–58. [Google Scholar]
  59. Rosenzweig, M.L.; Abramsky, Z. How are diversity and productivity related? Species Divers. Ecol. Communities 1993, 52–65. [Google Scholar]
  60. Wiens, J.J.; Graham, C.H. Niche conservatism: Integrating evolution, ecology, and conservation biology. Annu. Rev. Ecol. Evol. Syst. 2005, 36, 519–539. [Google Scholar] [CrossRef] [Green Version]
  61. Wiens, J.J.; Ackerly, D.D.; Allen, A.P.; Anacker, B.L.; Buckley, L.B.; Cornell, H.V.; Damschen, E.I.; Davies, T.J.; Grytnes, J.A.; Harrison, S.P.; et al. Niche conservatism as an emerging principle in ecology and conservation biology. Ecol. Lett. 2010, 13, 1310–1324. [Google Scholar] [CrossRef]
  62. Ghalambor, C.K.; Huey, R.B.; Martin, P.R. Why mountain passes are higher in the tropics—Revisited. Integr. Comp. Biol. 2004, 44, 558. [Google Scholar]
  63. Hua, X. The impact of seasonality on niche breadth, distribution range and species richness: A theoretical exploration of Janzen’s hypothesis. Proc. R. Soc. B-Biol. Sci. 2016, 283, 20160349. [Google Scholar] [CrossRef] [Green Version]
  64. McCain, C.M. Global analysis of bird elevational diversity. Glob. Ecol. Biogeogr. 2009, 18, 346–360. [Google Scholar] [CrossRef]
  65. Garcia, F.H.; Wiesel, E.; Fischer, G. The ants of Kenya (Hymenoptera: Formicidae): Faunal overview, first species checklist, bibliography, accounts for all genera, and discussion on taxonomy and zoogeography. J. East Afr. Nat. Hist. 2013, 101, 127–222. [Google Scholar] [CrossRef]
  66. Oyen, K.J.; Giri, S.; Dillon, M.E. Altitudinal variation in bumble bee (Bombus) critical thermal limits. J. Therm. Biol. 2016, 59, 52–57. [Google Scholar] [CrossRef] [Green Version]
  67. Andersen, A.N. Functional groups and patterns of organization in North American ant communities: A comparison with Australia. J. Biogeogr. 1997, 24, 433–460. [Google Scholar] [CrossRef]
  68. Gathalkar, G.; Sen, A. Foraging and predatory activities of ants. In The Complex World of Ants; IntechOpen: London, UK, 2018; pp. 51–70. [Google Scholar] [CrossRef]
  69. Ward, P.S. Army ants—The biology of social predation—Gotwald, W.H. Science 1995, 270, 319–320. [Google Scholar] [CrossRef]
  70. Kenne, M.; Schatz, B.; Durand, J.L.; Dejean, A. Hunting strategy of a generalist ant species proposed as a biological control agent against termites. Entomol. Exp. Et Appl. 2000, 94, 31–40. [Google Scholar] [CrossRef]
  71. Schoning, C. Driver ants invading a termite nest: Why do the most catholic predators of all seldom take this abundant prey? Biotropica 2007, 39, 663–667. [Google Scholar] [CrossRef]
Figure 1. Non-metric multidimensional scaling (NDMS) of community similarity (Bray–Curtis dissimilarity index) based on ant species found in three forests types—lower elevation (red), sub-montane (purple), and montane (blue)—in the Udzungwa Mountains, Tanzania.
Diversity 14 00260 g001
Table 1. Description of the three studied forest habitat types in the Udzungwa Mountains, Tanzania.
Habitat TypesAltitudinal RangeDescription
Lower elevation forest (lowest elevation)650–800 Forest with deciduous and semi-deciduous trees, canopy 15–25 m with emergents reaching 50 m
Sub-montane forest (mid elevation)800–1400Moist forest with mainly evergreen species, canopy 25–40 m with emergents reaching 50 m
Montane forest (high elevation)1400–2600Evergreen moist forest, with canopy height progressively lower with increasing altitude
Table 2. Number of genera, species richness, and individuals (activities) of ant subfamilies collected in the study.
SubfamilySpeciesIndividuals (Activities)
Dolichoderinae
Technomyrmex35
Dorylinae
Aenictus12
Dorylus113,260
Parasyscia24
Formicinae
Camponotus568
Lepisiota5209
Nylanderia1156
Plagiolepis38
Polyrhachis215
Tapinolepsis310
Myrmicinae
Calyptomyrmex11
Cardiocondyla16
Carebara2126
Catalaucus11
Crematogaster550
Melissotarsus11
Meranoplus17
Microdaceton11
Monomorium249
Myrmicaria110,512
Pheidole84751
Solenopsis2308
Strumigenys683
Tetramorium191261
Ponerinae
Anochectus35
Bothroponera479
Cryptopone11
Hypoponera411
Leptogenys4449
Megaponera1210
Mesoponera335
Odontomachus110
Plectroctena382
Table 3. Observed number of species (per habitat and plots), Simpson’s diversity index, and sample coverage for each sampling plot in the three habitat types (lower elevation, sub-montane, and montane forests).
Habitat TypeObserved Species per Habitat (Mean SD)PlotAltitude
m a.s.l
Observed Species Richness per PlotSimpson’s Diversity IndexSample Coverage
Lower elevation71 (30.6 ± 8.1)1650310.5000.9963
2650380.3750.996
7708400.8620.993
10674220.4050.989
13659240.8250.974
Sub-montane44 (19.6 ± 5.3)31005240.2970.998
4993210.4470.995
8978250.6230.998
111006150.6660.996
14908130.8130.911
Montane 33 (15.2 ± 6.5)51448230.7470.994
61482180.2711
91527150.8200.995
121552150.4660.986
15153150.2610.986
Table 4. Indicator values (IndVal) of ant species for forest habitat types along the elevational transects. All indicator values are significant (p < 0.05).
Habitat TypeSpeciesIndicator Value (%)
Lower elevationPheidole sp.05100
Megaponera analis rapax99.52
Camponotus sp.02. (etiolipes gp.)94.12
Tetramorium cf. yarthiellum80
Nylanderia sp.0170.77
Sub-montaneBothroponera sp.0185.71
Myrmicaria rustica angustior81.23
MontaneTetramorium sp.14100
Mesoponera sp.0282.61
Publisher’s Note: MDPI stays neutral with regard to jurisdictional claims in published maps and institutional affiliations.

