Article

Comprehensive Genomic Analysis of G2-like Transcription Factor Genes and Their Role in Development and Abiotic Stresses in Arabidopsis

1
Department of Grassland Science, College of Forestry and Landscape Architecture, South China Agricultural University, Guangzhou 510642, China
2
College of Life Sciences, South China Agricultural University, Guangzhou 510642, China
3
Guangdong Subcenter of the National Center for Soybean Improvement, College of Agriculture, South China Agricultural University, Guangzhou 510642, China
*
Author to whom correspondence should be addressed.
Diversity 2022, 14(3), 228; https://doi.org/10.3390/d14030228
Submission received: 27 January 2022 / Revised: 17 March 2022 / Accepted: 18 March 2022 / Published: 20 March 2022
(This article belongs to the Special Issue Generation of Genome-Wide Genetic Data and Evolutionary Analyses)

Abstract

:
GOLDEN2-LIKE (GLK) transcription factors are a subfamily of GARP family transcription factors, which play an essential function in plant growth and development as well as stress response during abiotic and biotic stress conditions. This study reports GLK genes in the Arabidopsis thaliana genome in-depth and identified 55 AtGLK genes in the Arabidopsis genome. Phylogenetic analyses resolved these GLK gene clusters into seven groups. A Ka/Ks ratios analysis indicated that they had experienced purifying selection. Many essential cis elements are present in the promoter regions of AtGLK genes associated with plant hormones, light, and stress. The expression profile from RNA-Seq data revealed that 29.1% of them had relatively high expression in all tested tissues or organs, indicating their crucial housekeeping function in plant growth and development. However, many other GLK members were selectively expressed in particular tissues or organs. In silico study of the transcriptional regulation of AtGLKs indicated that it is strongly regulated by cold, drought, osmotic, salt, and metal ion stressors. Our research provides essential information for the functional studies of each GLK gene in different species in the future.

1. Introduction

Transcription factors (TFs) can trigger or inhibit transcription of a downstream target gene at specific times. Plant TFs affect every aspect of plant growth and development [1,2,3]. Plants are challenged by abiotic stressors, including high temperatures, heavy metals, salt, drought, cold, and osmotic pressure [4]. Unfavorable environmental conditions, limitation of essential resources, and excess of noxious substances adversely affect crop production worldwide [5,6]. TFs can activate or inhibit gene transcription, influence protein expression, and function, and are crucial in plant stress response and physiological functions [5,7]. The GOLDEN2-LIKE (GLK) transcription factors are members of the Myb transcription factor GARP family [8]. The GLK transcription factor was discovered for the first time in Zea mays [9]. A normal GLK protein has two conserved domains: a Myb-DNA binding domain (DBD) and a GCT box (C-terminal) [10]. Subsequently, G2-like transcription factors contribute significantly to plant growth and development [9], involving various stimuli, including biotic and abiotic stresses [11,12,13,14]. In Arabidopsis, AtGLK1 and AtGLK2 function to regulate chloroplast formation [15,16]. In addition, AtGLK2 plays a significant role in anthocyanin biosynthesis. The loss of function of AtGLK2 limited anthocyanin accumulation in Arabidopsis seedlings, but overexpression of AtGLK2 resulted in massive increases in anthocyanin accumulation [17]. Overexpression of GLK1 in tomato (Solanum lycopersicum) boosts the expression of genes involved in chloroplast formation and fruit photosynthesis, resulting in increased carbohydrate and carotenoid levels in mature fruits [18]. In maize, ZmGLK1 is thought to play a central role in the chloroplast formation of mesophyll cells in C4 plant tissues [10,15]. Mutations in the G2-like gene ALM1 cause decreased seed weight in barley [19]. Furthermore, GLKs have been shown to interact with ANAC092 (ORE-1) to control leaf senescence [20]. AtGLK1 regulates disease resistance genes, and its effect on different pathogens varies [21]. Overexpression of AtGLK1 improves resistance to Fusarium graminearum in A. thaliana and contributes to tolerance of Cucumber Mosaic Virus [11,12,22]. AhGLK1b can provide both fungal and bacterial infection tolerance as well as abiotic stress tolerance [23]. OsGLK1 has also been shown to function in disease resistance in rice [24]. GLKs are also implicated in hormone response. AtGLK1 resistance to Hyaloperonospora Arabidopsis Noco2 is linked to two signaling pathways: salicylic acid and jasmonic acid [13]. Recently, in maize, certain genes of the GLK gene family have been implicated in stress response [25]. The silencing of the SlGLK29 gene might impair cold resistance in tomato [26]. Most recently, the GhGLK1 gene was involved in the regulation of cold and drought stress response in cotton [23]. Many GLK gene activities have been investigated properly, however, those connected to abiotic stress are rarely discussed, and only a few research reports have been published. The GLK gene family has already been identified and investigated in several plant genomes including, cotton [27], maize [25], and tobacco [28]. However, the GLK gene family in Arabidopsis has not been extensively examined. In this work, we performed a comprehensive examination of the GLK gene in Arabidopsis, including genome-wide identification, phylogenetic classification, gene structure, chromosomal position, syntenic relationship, and expression levels in various tissues and stressors. Our results are essential to better understand the function and development of Arabidopsis GLK genes, as well as for potential functional genomic and plant improvement in other plant species.

2. Materials and Methods

2.1. Identification of GLK Proteins in Arabidopsis

To determine the complete set of GLK protein genes in Arabidopsis, previously reported cotton [27], maize [25], and tobacco [28] GLK protein sequences were downloaded and utilized as query sequences for BLASTp searches against the Arabidopsis database TAIR (http://www.arabidopsis.org, accessed on 20 February 2022). The obtained sequences were then analyzed by using the SMART database (http://smart.embl-heidelberg.de, accessed on 14 February 2022), the Pfam database (http://pfam.sanger.ac.uk, accessed on 10 February 2022), and Interpro (http://www.ebi.ac.uk/interpro/, accessed on 12 March 2022) to confirm the presence of the GLK related motifs. The ProtParam web-tool (http://web.expasy.org/protparam/, accessed on 2 March 2022) was assessed to determine the molecular weight (Wt) and theoretical isoelectric point (pI) of the GLK proteins, and the TAIR database (http://www.arabidopsis.org, accessed on 16 February 2022) was assessed to predict their gene ontology (GO) and subcellular localization.

2.2. Phylogenetic Tree Analysis

The full-length protein sequences of all AtGLK and other species’ genes were aligned with ClustalW, and evolutionary trees were generated using MEGAX software by the Maximum Likelihood [29], and Jones–Taylor–Thornton (JTT) matrix-based model with 1000 bootstrap replicates [30].

2.3. Gene Structure and Motif Analysis of AtGLKs

To investigate the exon-intron regions of AtGLK genes, the GSDS platform was used (http://gsds.cbi.pku.edu.cn/, accessed on 20 February 2022). The MEME tool was used for motif annotation of AtGLK proteins (version 4.11.4; http://meme-suite.org/tools/meme, accessed on 25 February 2022).

2.4. AtGLKs’ Promoter Analysis and Co-Expression Network

The TAIR database (http://www.arabidopsis.org/, accessed on 25 February 2022) was used to obtain the promoter regions (upstream 2-kb genomic sequences from the start codon (ATG) of all AtGLK genes. The identified sequences were then subjected to the Plant-CARE database (http://bioinforrmatics.psb.ugent.be/webtools/plantcare/html/, accessed on 25 February 2022) for identification of putative cis-elements. AtGLK genes were used for possible coordination of potential gene expression by using the “CoExSearch” tool [31]. Cytoscape tools (version 2.8.2) was used to generate co-expression networks among AtGLK genes and co-expression genes.

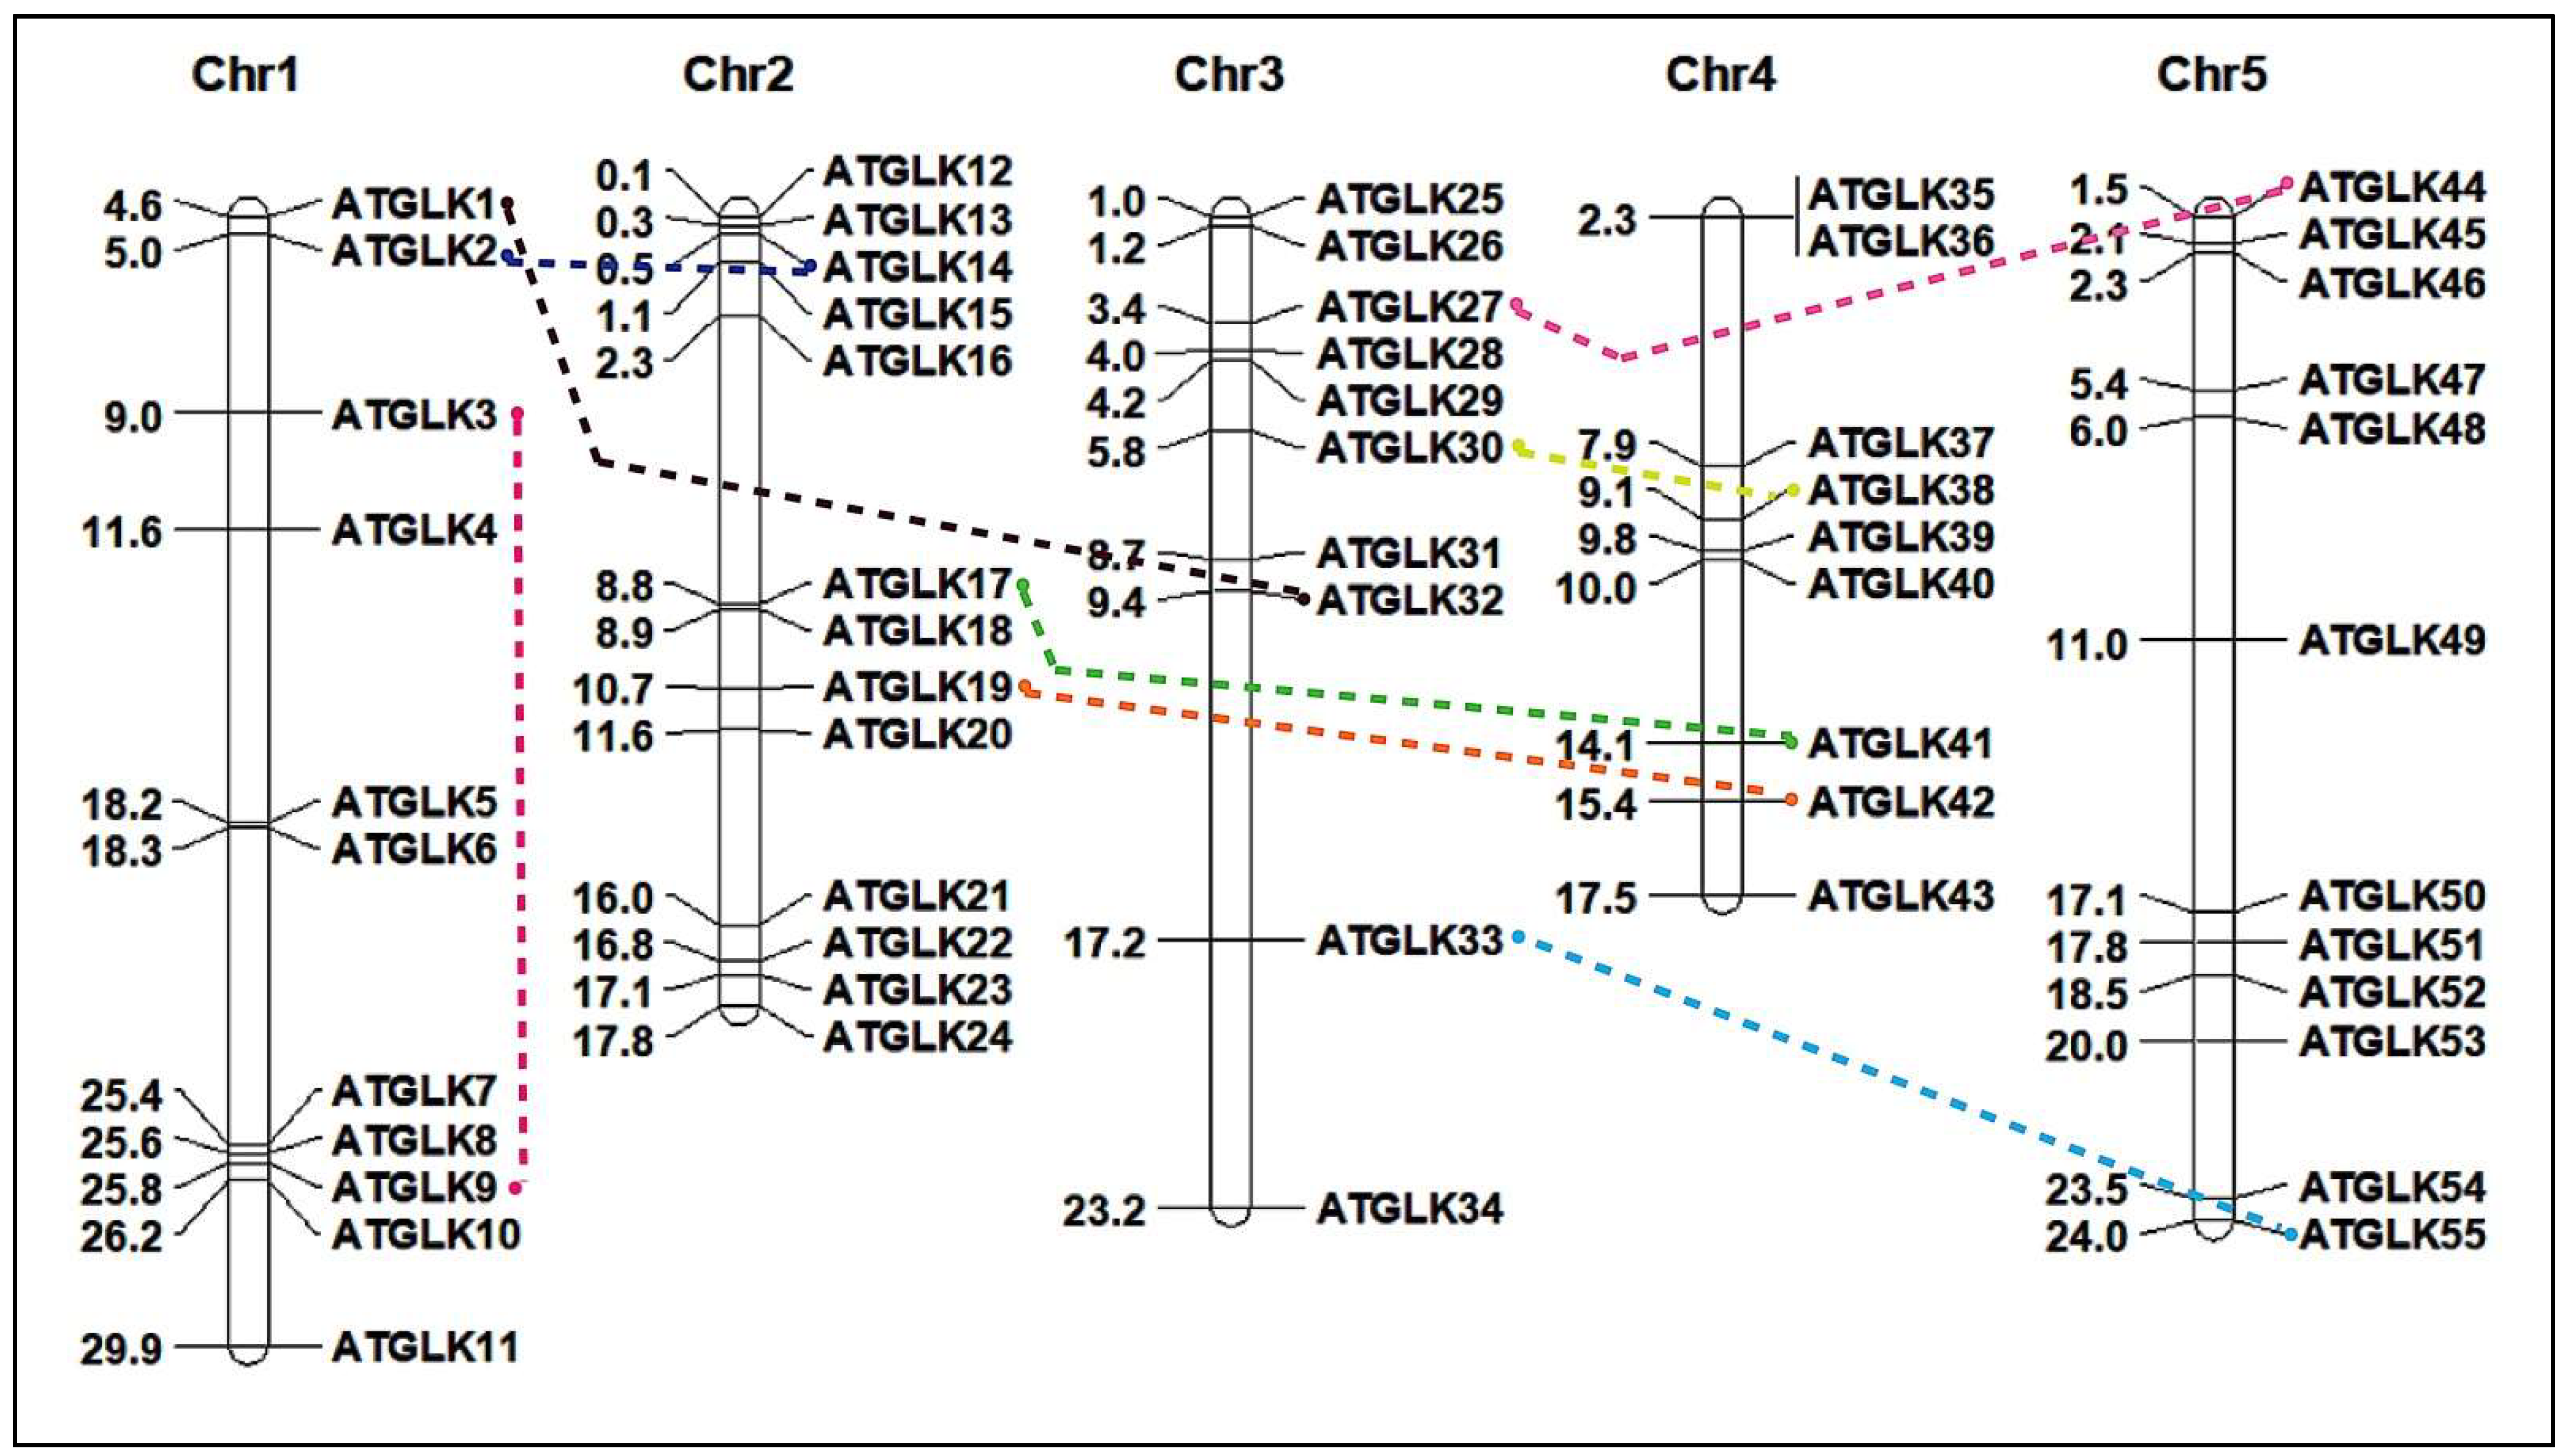
2.5. Chromosome Location of AtGLKs and Ka and Ks Calculation

The chromosomal position of each Arabidopsis GLK gene was obtained from the TAIR website database, respectively. The identified AtGLK genes were then mapped to the corresponding chromosomes using map man software. The segmentally duplicated AtGLK genes were highlighted through various color dots. The amino acid sequences alignments were performed by Clustal Omega (http://www.ebi.ac.uk/Tools/msa/clustalo/, accessed on 26 February 2022). We estimated the Non-synonymous ratios (Ka), synonymous ratios (Ks), and evolutionary constraints (Ka/Ks) between the pairs of AtGLK gene through PAL2NAL and codeML in the PAML package (http://www.bork.embl.de/pal2nal/index.cgi?example=Yes#RunP2N, accessed on 26 February 2022) [32,33,34].

2.6. In Silico Analysis of AtGLK Genes Expression

RNA-seq expression data of 23 Arabidopsis tissues or organs were obtained from the Arabidopsis tissue atlas accession number E-MTAB-7978 (https://www.ebi.ac.uk/arrayexpress/, accessed on 26 February 2022) [35]. The FPKM values for Arabidopsis GLK genes have been obtained from the dataset. Abiotic stress (drought, cold, and osmotic) responses are described by Kilian et al. [36] in the NCBI Expression Omnibus database (http://www.ncbi.nlm.nih.gov/geo/, accessed on 26 February 2022) with accession numbers GSE5621, GSE5622, and GSE5624 datasets. As described in Zhao et al. [37], the GSE108751 datafile contains metal ions transcript data (aluminum, cadmium, copper) and salt stress (NaCl). Based on all expression values, we used Cluster tools v3.0 (http://bonsai.hgc.jp/*mdehoon/software/cluster/, accessed on 26 February 2022) to perform clustering analysis using log2-transformed values, Euclidean distances, and the average linkage clustering method.

3. Results

3.1. Identification of AtGLK Proteins

To investigate each of the AtGLK proteins in the Arabidopsis genome, we performed a BLASTp search in the Arabidopsis database TAIR using known GLK protein sequences from cotton, maize, and tobacco. The non-redundant protein sequences were analyzed using the SMART and Pfam databases for the presence or absence of a Myb-DNA binding domain. This analysis indicated 55 GLK genes in the Arabidopsis genome (Supplementary Table S1). The molecular weights, and theoretical isoelectric points of all identified AtGLK proteins were shown. These AtGLK proteins were typically small, ranging from 166 to 755 aa. The molecular weights of the proteins ranged from 19.21 kDa to 86.18 kDa. The isoelectric points ranged from 4.47 to 9.56 for AtGLK proteins. For each of the identified 55 AtGLK proteins, the presence or lack of any additional domain outside of the GLK domain (s) was examined. A total of three additional domains were detected, allowing the classification of the 55 AtGLK proteins into four groups (Table S2). The group I includes 21 members (38.18%), all of which have no other additional domains outside the GLK domain. The group II includes 15 members (27.27%) with Myb_CC_LHEQLE domain besides a GLK domain. Group III includes 14 members (25.45%) each containing a REC domain and a GLK domain, and Group IV contains five members (9.09%) each with a coiled-coil domain and a GLK domain. Gene Ontology analysis revealed that all these AtGLK proteins showed DNA binding transcription factor activity, mainly localized in the nucleus, and were involved in several biological processes in the cell (Table S3).

3.2. Phylogenetic Tree Analysis

The phylogenetic tree was constructed from AtGLK genes encoding protein sequences using the MEGAX tools by the Maximum Likelihood method with 1000 replicates (Figure 1). Our results revealed that the AtGLK family members were clustered into seven groups. Group I contains fifteen, group II contains twelve, group III contains seven, group IV contains three, group V contains five, group VI contains three, and group VII contains ten AtGLK protein members. An extended phylogenetic tree including GLK proteins from A. thaliana, cotton, maize, and tobacco was also constructed and shown in Figure S1, demonstrating the orthologous relations and strong evolutionary preservation across GLK proteins from diverse species.

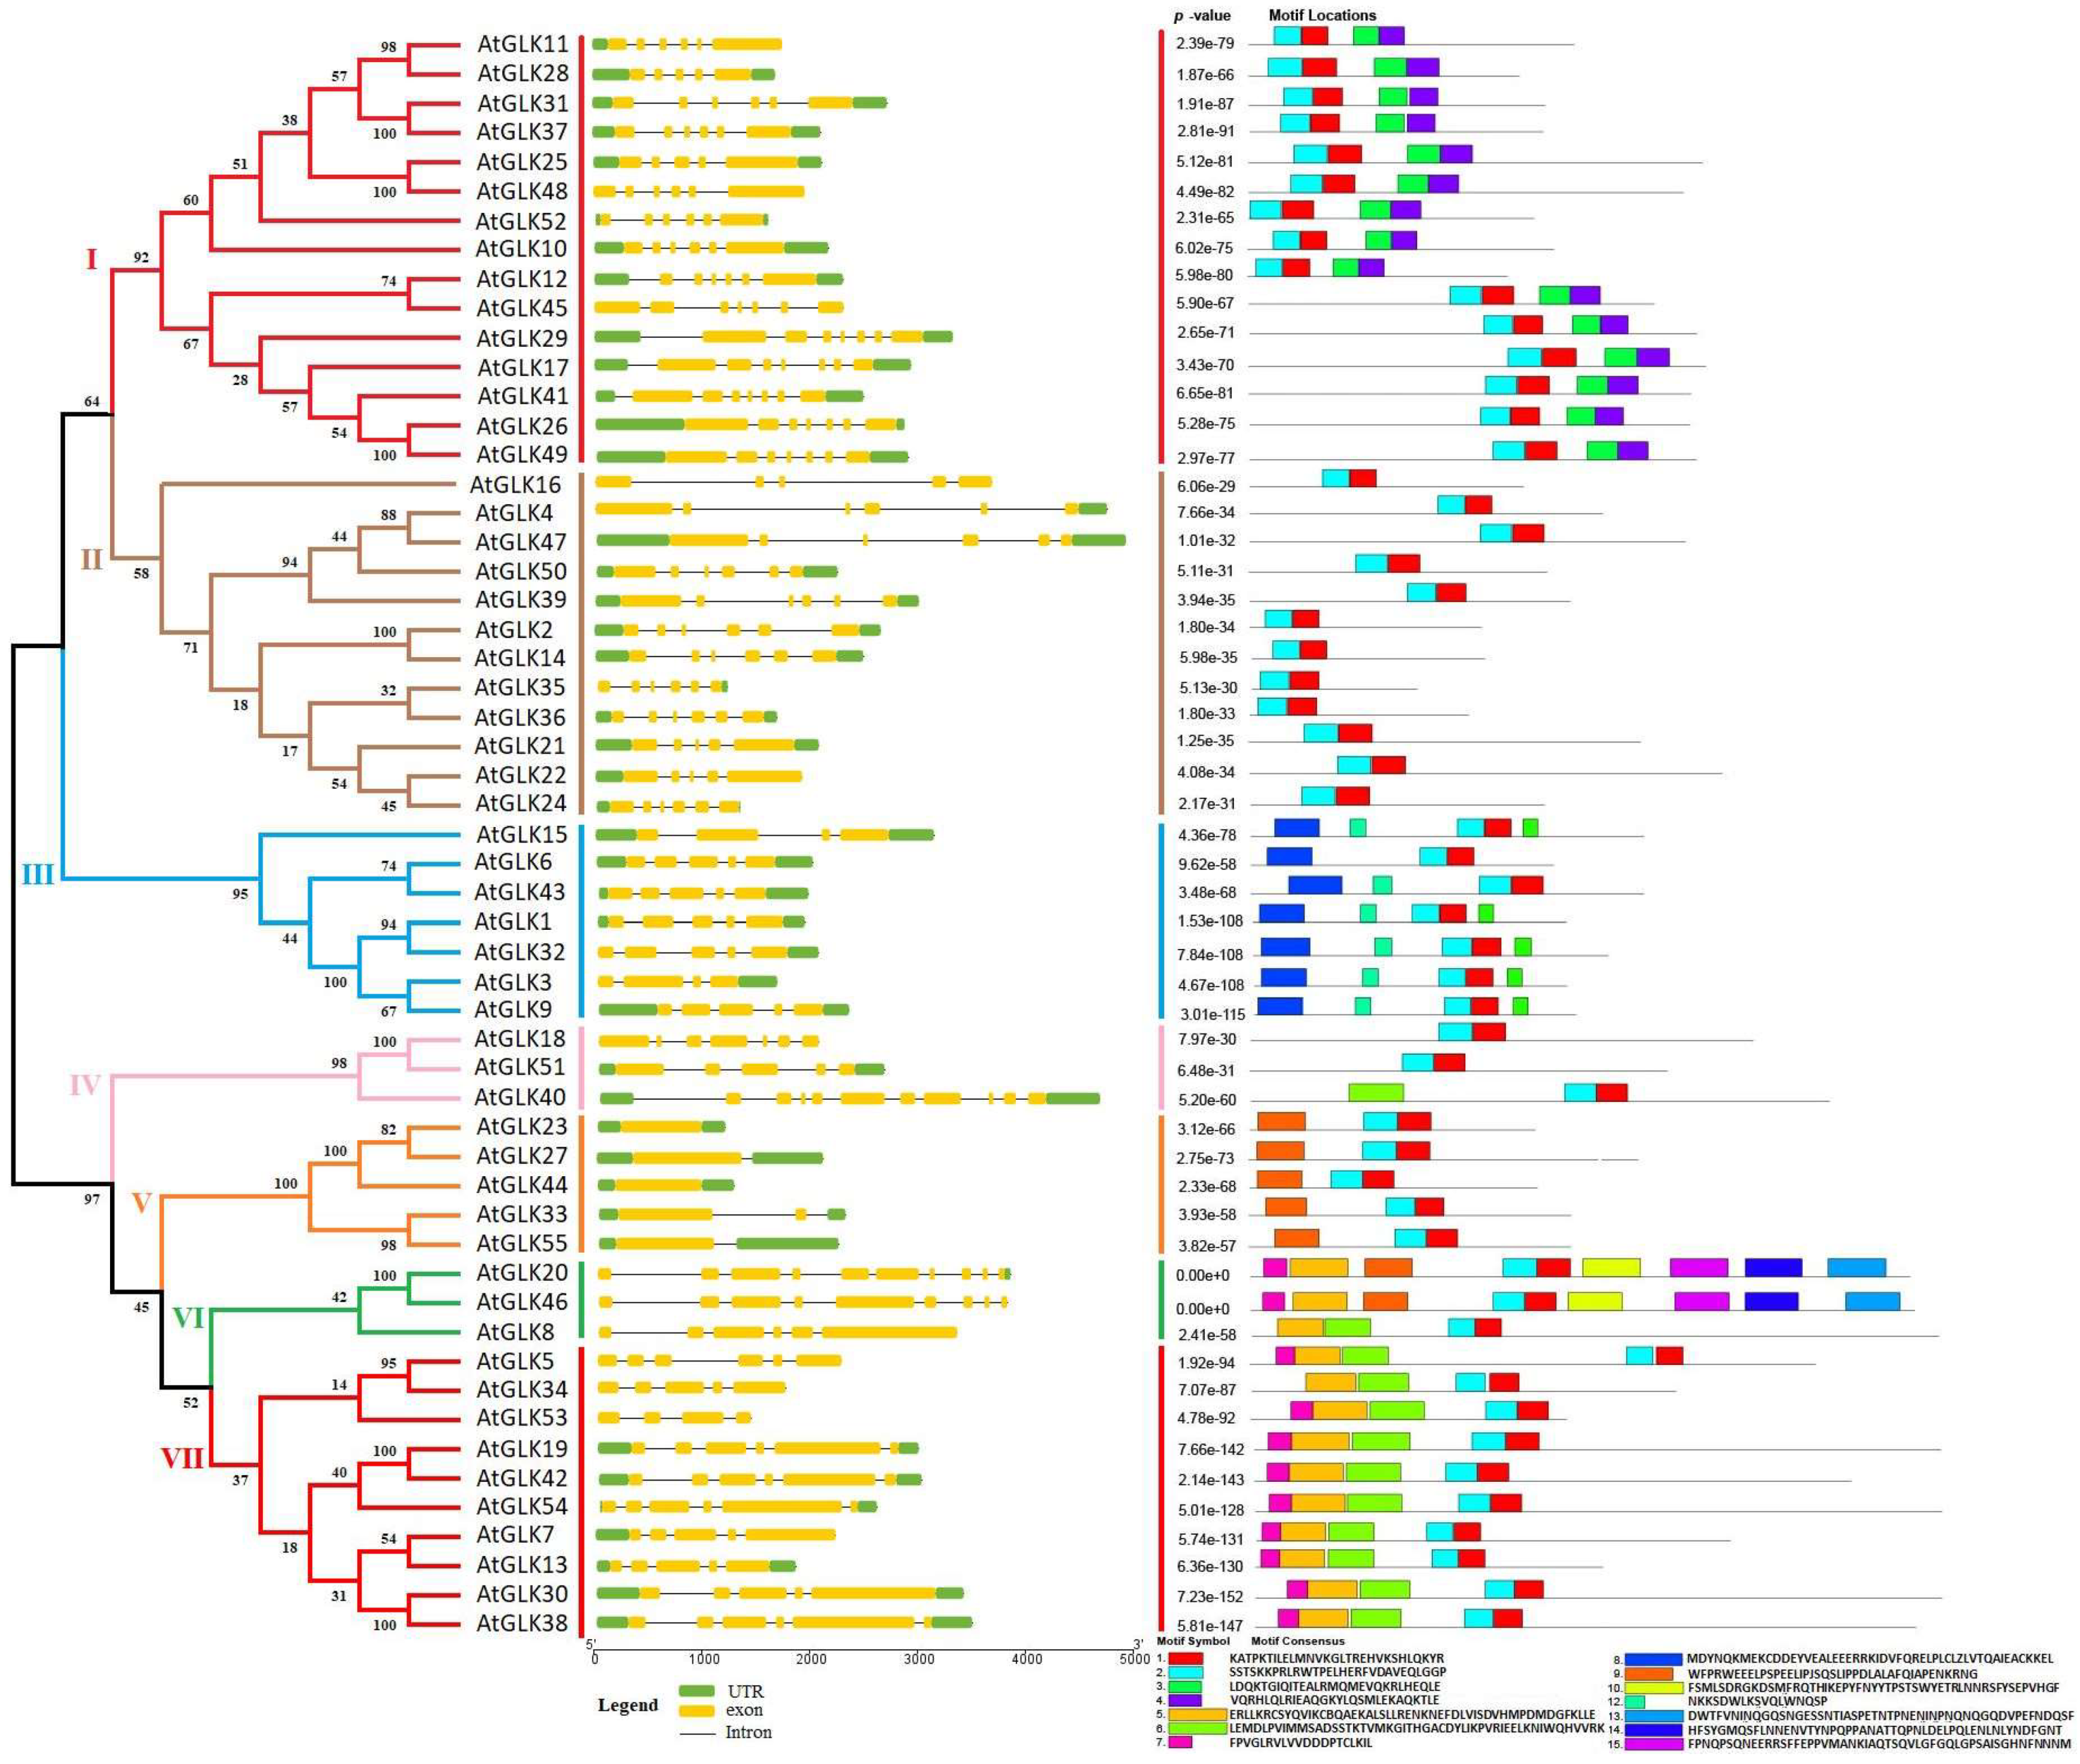
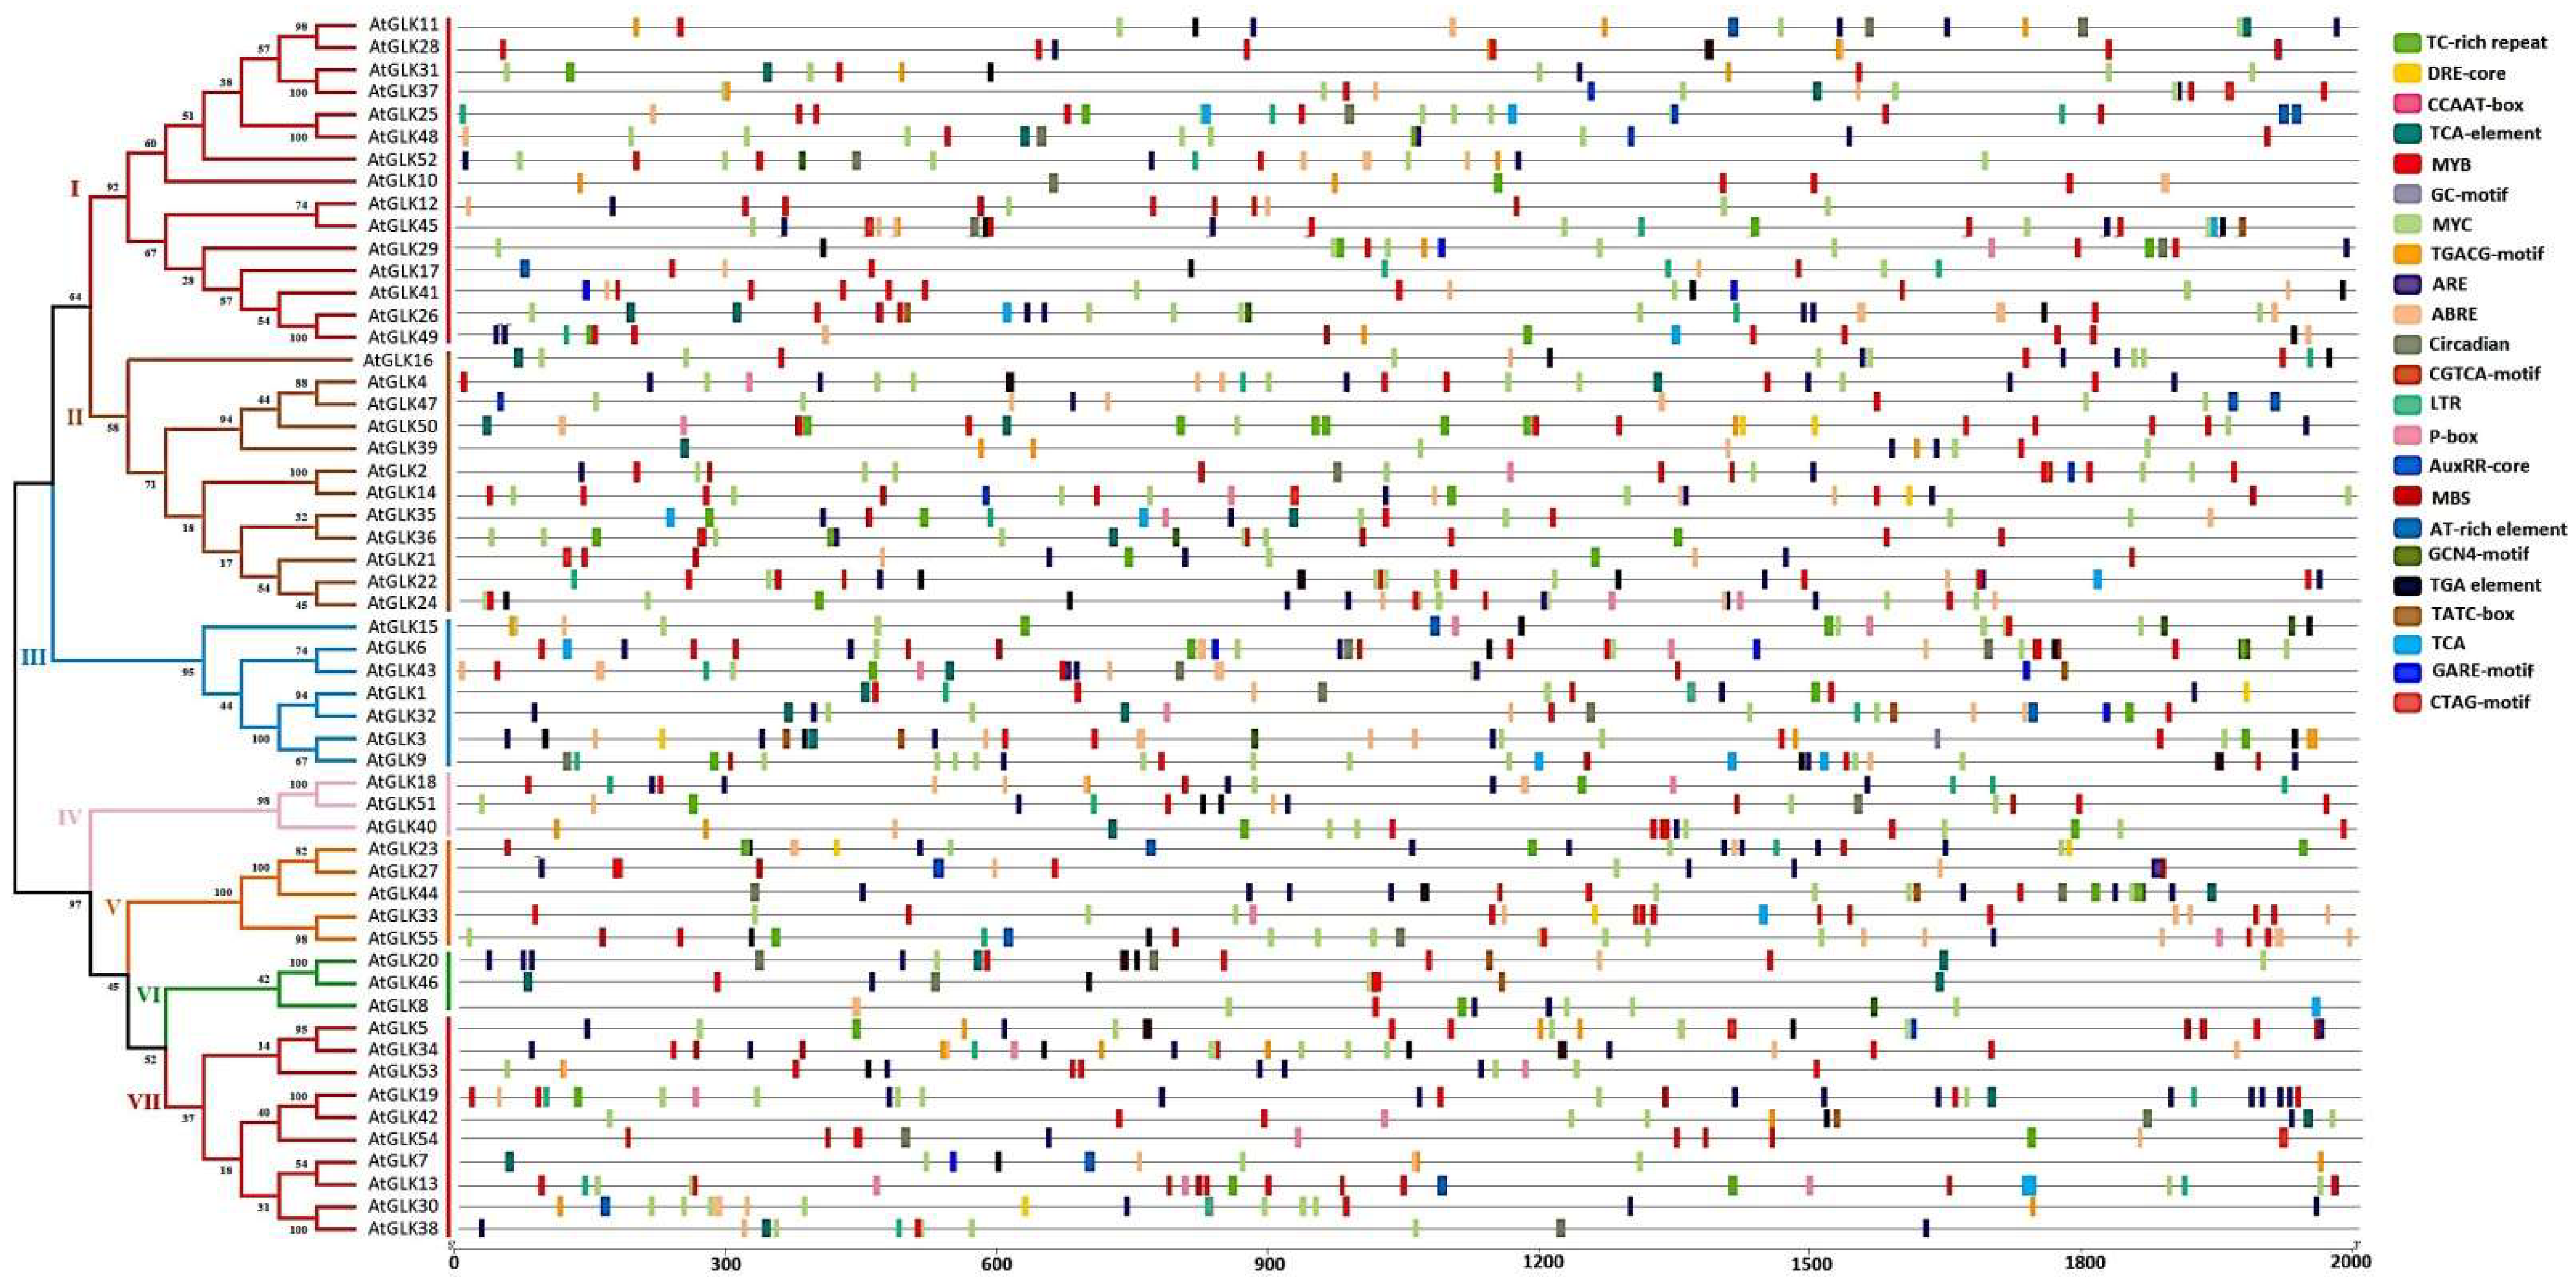
3.3. AtGLK Gene Structure and Motif Composition Analysis

To examine the structural variations in the Arabidopsis GLK family genes, we examined the exon-intron organization of each GLK gene from A. thaliana based on their phylogenetic classification (Figure 1). The exon and intron numbers of GLK genes range from one to ten in A. thaliana. The gene structures were globally conserved within different groups of phylogenetic classification. However, the length variations in exon or intron and numbers were also absolved among each phylogenetic tree analysis group.
To further understand the structural variation in GLK proteins from Arabidopsis, we examined their respective motifs through the MEME software (Figure 1). In total, 15 conserved motifs were found in these AtGLK proteins. These identified motifs ranged from 17 to 50 amino acids. Motifs 1 and 2 were identified in the GLK domain of all members, while Motif 3 and 4 covered the Myb_CC_LHEQLE domain. In contrast, 5–7 motifs covered the REC domain of phylogenetic tree classification of group VII. The Motifs 8–15 were shared by various GLK proteins and can possibly be used to differentiate between subfamilies.

3.4. Chromosomal Localization and WGD Events Analysis

The chromosomal position data for each Arabidopsis GLK gene were obtained from TAIR database (Table S1) and mapped onto the corresponding A. thaliana chromosomes (Figure 2). The 55 AtGLK genes were located on five chromosomes, including 11 AtGLK genes on Chr1, 13 on Chr2, 10 on Chr3, 9 on Chr4, and 12 on Chr5 (Figure 2). Colored dot lines indicate the segmentally duplicated genes (Figure 2). Based on the syntenic relationships data obtained from TAIR database (Search Syntenic Gene), the syntenic relationships between these GLK genes were determined (Figure 2). To investigate the evolutionary selection type of duplicated AtGLK genes, the Ka, Ks, and Ka/Ks ratios among paralogous gene pairs were computed (Table 1). The Ka/Ks ratios range from 0.162 to 0.317, with an average of 0.229.

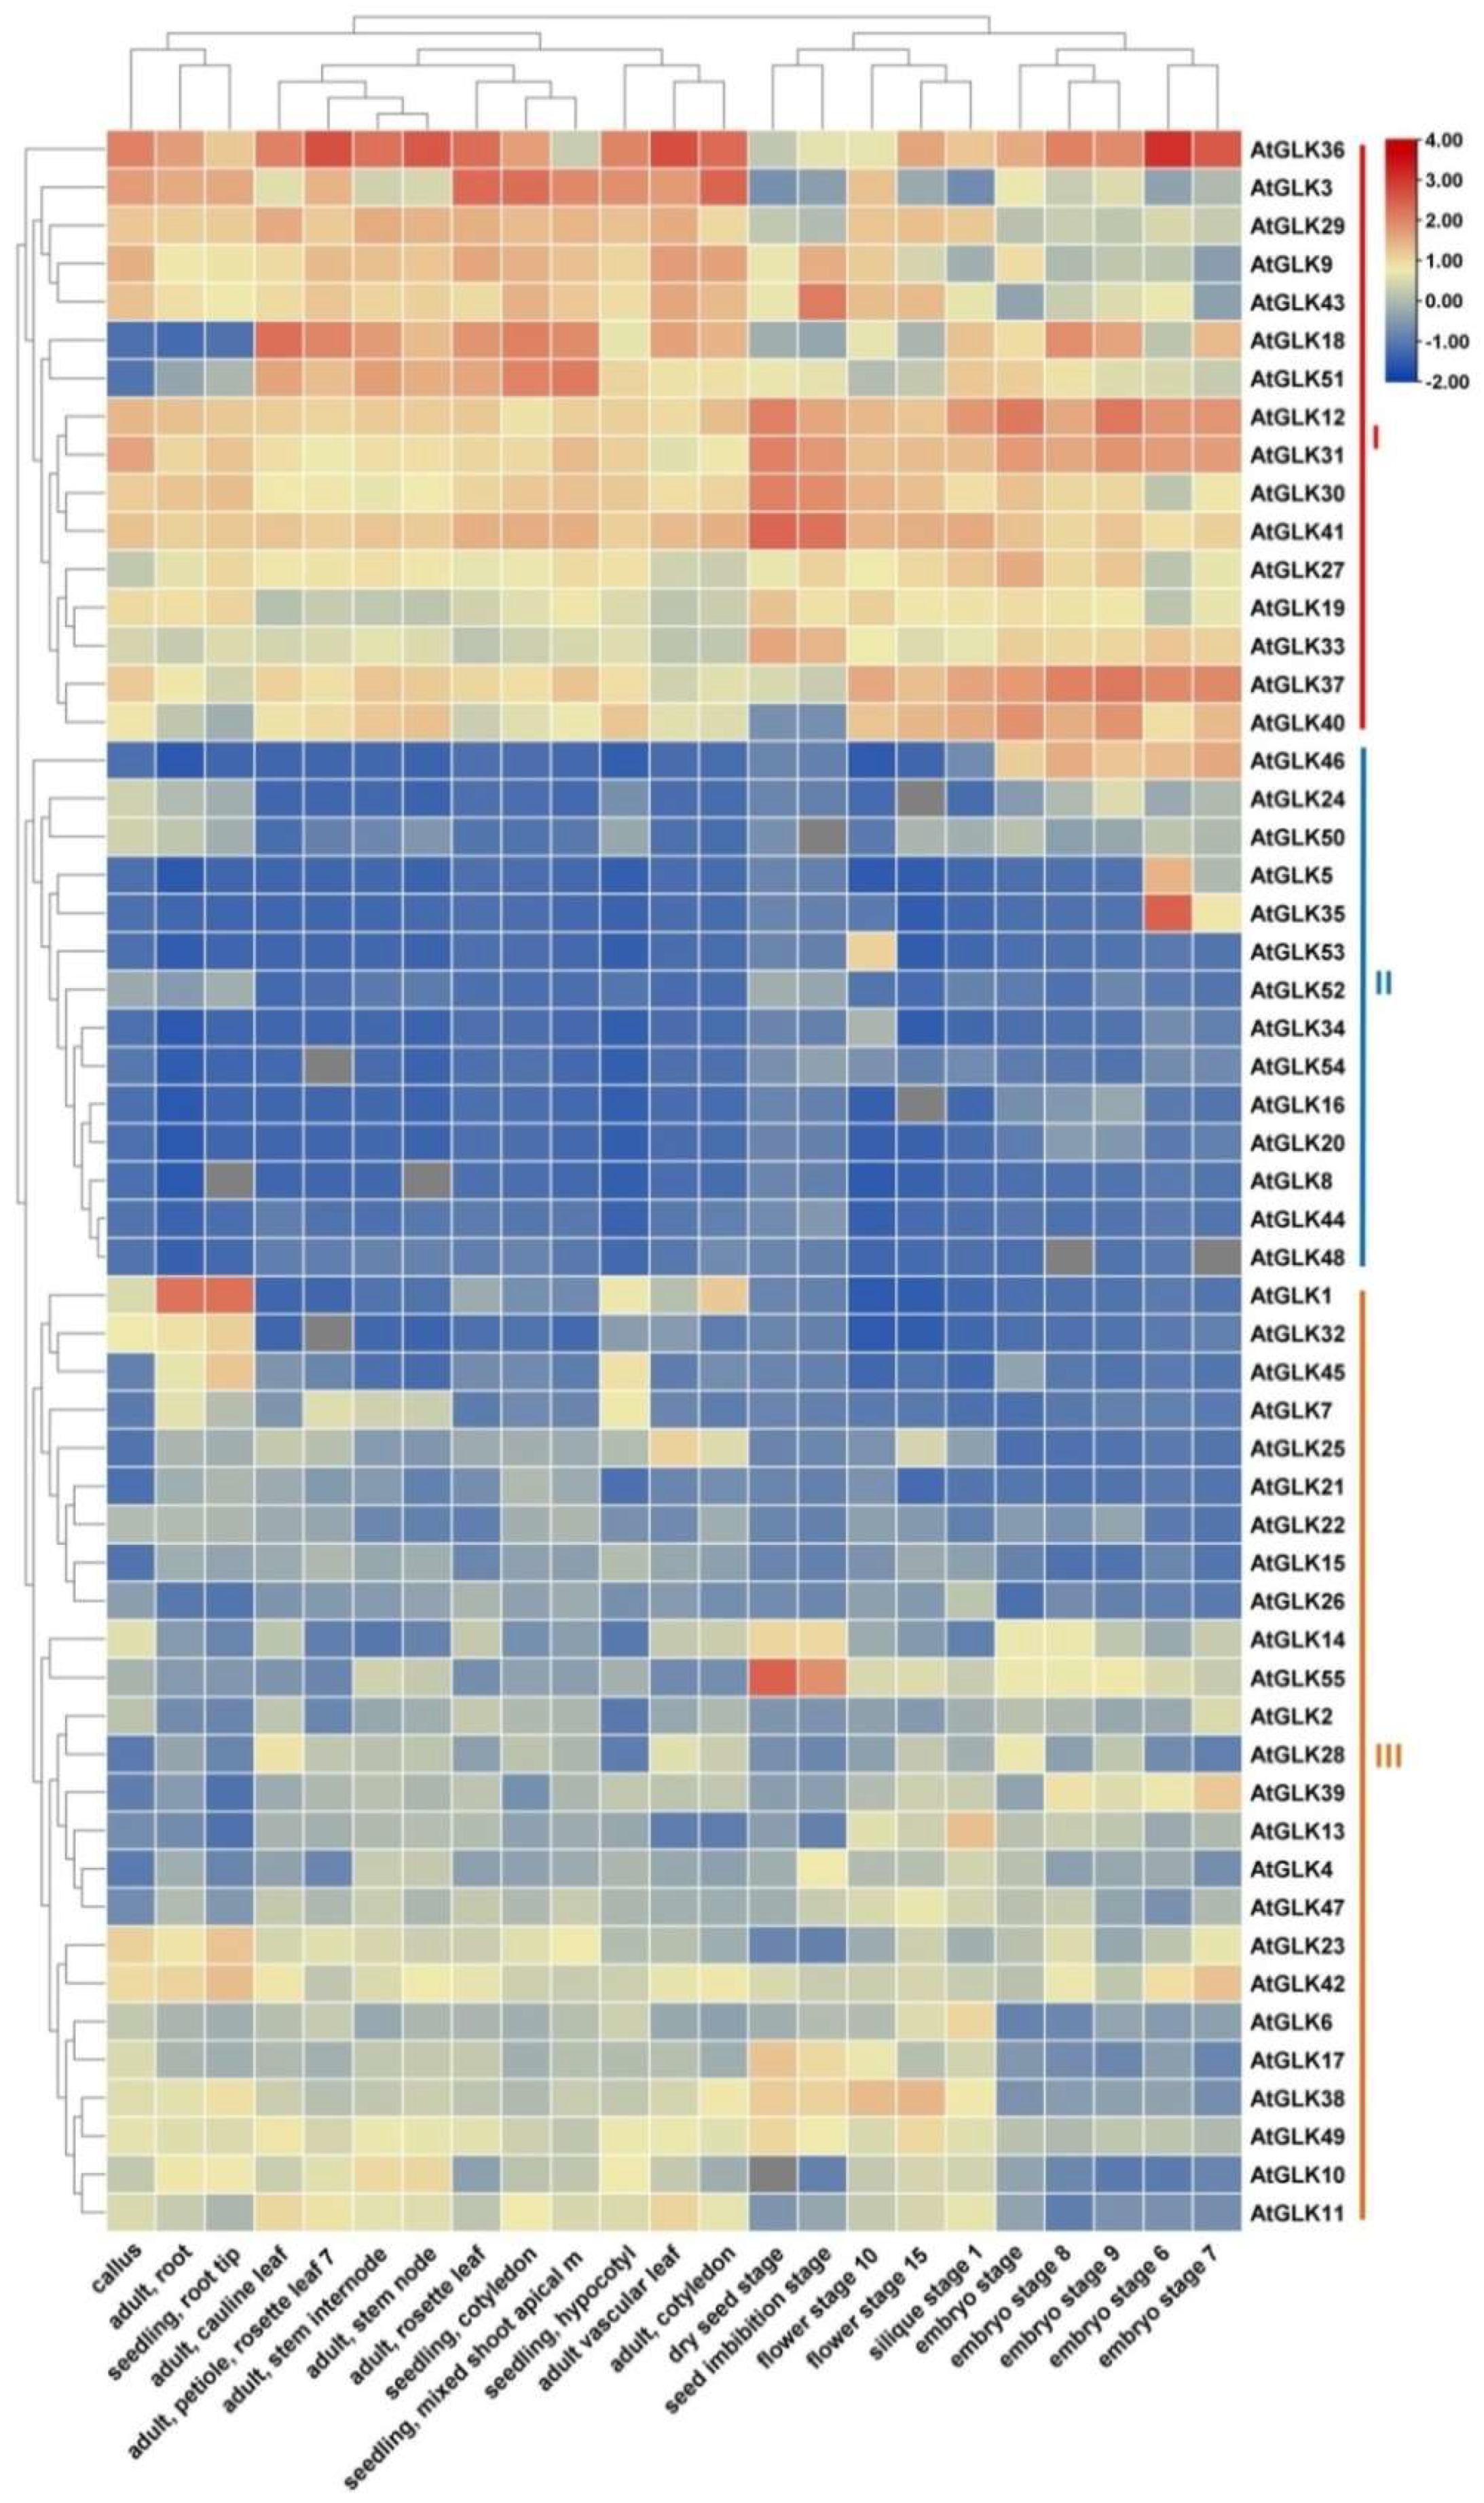
3.5. Expression Analysis of AtGLK Genes across Different Tissues

The Arabidopsis GLK gene expressions were examined at the transcript level using RNA-seq data from Arabidopsis tissue atlas accession number E-MTAB-7978 (https://www.ebi.ac.uk/arrayexpress/, accessed on 22 February 2022) [34]. The expression data (FPKM) were log2-transformed, based on which a clustered heatmap displaying the expression patterns of 55 AtGLK genes across different tissues was generated. The result showed that these 55 AtGLK genes were divided into three main groups with subgroups (Figure 3). The group I included 16 AtGLK genes mainly expressed in all tested tissues or organs with high expression levels. Group II includes 14 AtGLK genes and, relatively, all were either not or were very lowly expressed in any of the tested tissues, except for AtGLK5 and AtGLK35, which were preferentially expressed in embryo stage 6, although in other tissues, the expression was either very low or not expressed. Group III includes 25 genes selectively expressed in one or more tissues or organs with relatively low expression levels. However, AtGLK1 was highly expressed in adult root and root tip tissue, while AtGLK55 was preferentially expressed in the dry seed-stage and seed imbibition stage.

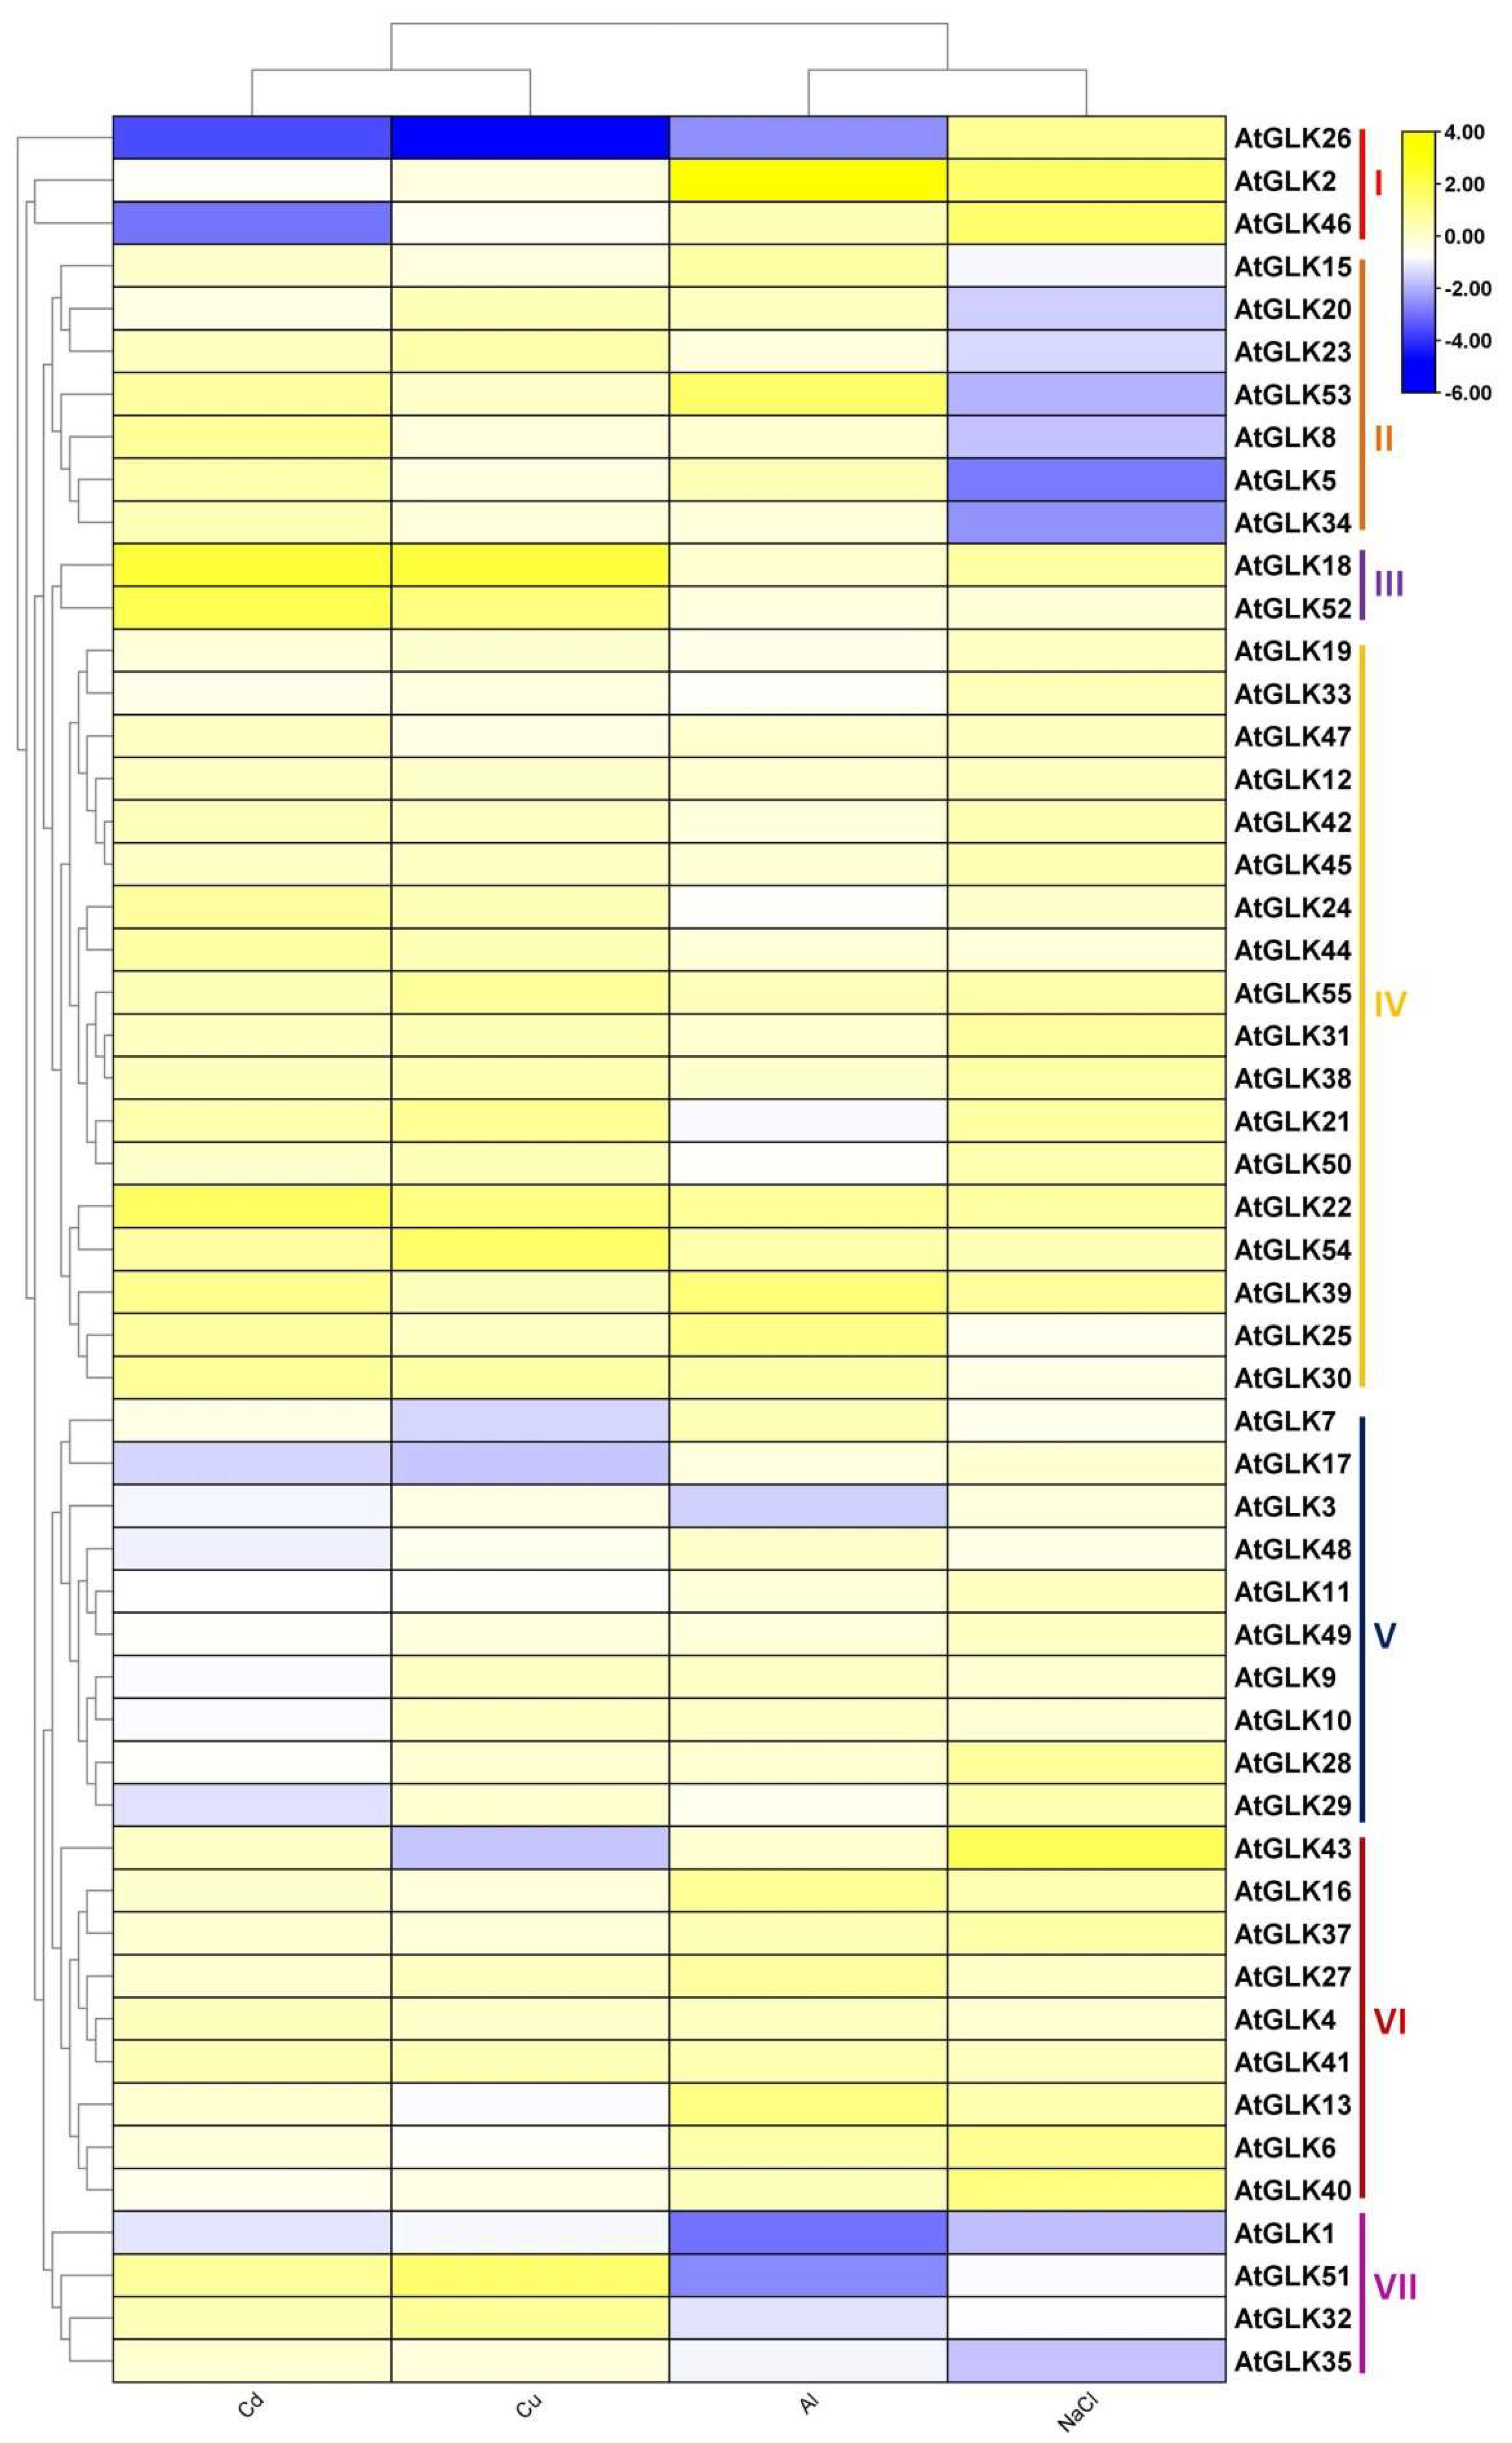
3.6. AtGLK Genes Expression in Response to Ions Stress

To elucidate AtGLK genes’ responses under different ion stresses (Aluminum (Al), cadmium (Cd), copper (Cu), and salt (NaCl)), AtGLK gene expression was analyzed using the AtGenExpress dataset available in the GEO dataset [36]. The available expression data of 50 AtGLK genes were divided into seven main groups with subgroups (Figure 4). Group I contains three AtGLK genes, all highly expressed in salt stress. Two genes were expressed in response to Al stress, while most AtGLK genes were repressed in response to Cd and Cu stress. Group II AtGLK genes were expressed in three stresses (Cd, Cu, and Al) although they were repressed in salt stress. Group III contains two AtGLK genes that are highly expressed in Cd and Cu, yet not in Al or salt stress. Most of the group IV genes are expressed under all stresses. Group V contains 10 AtGLK genes, and most expressed in salt and Al stress, yet repressed or not expressed in Cd or Cu stress. Group VI was more common under salt and Al stress than Cd and Cu stress. In group VII, most AtGLK genes were expressed in Cd and Cu, while repressed or not expressed in salt and Al stress.

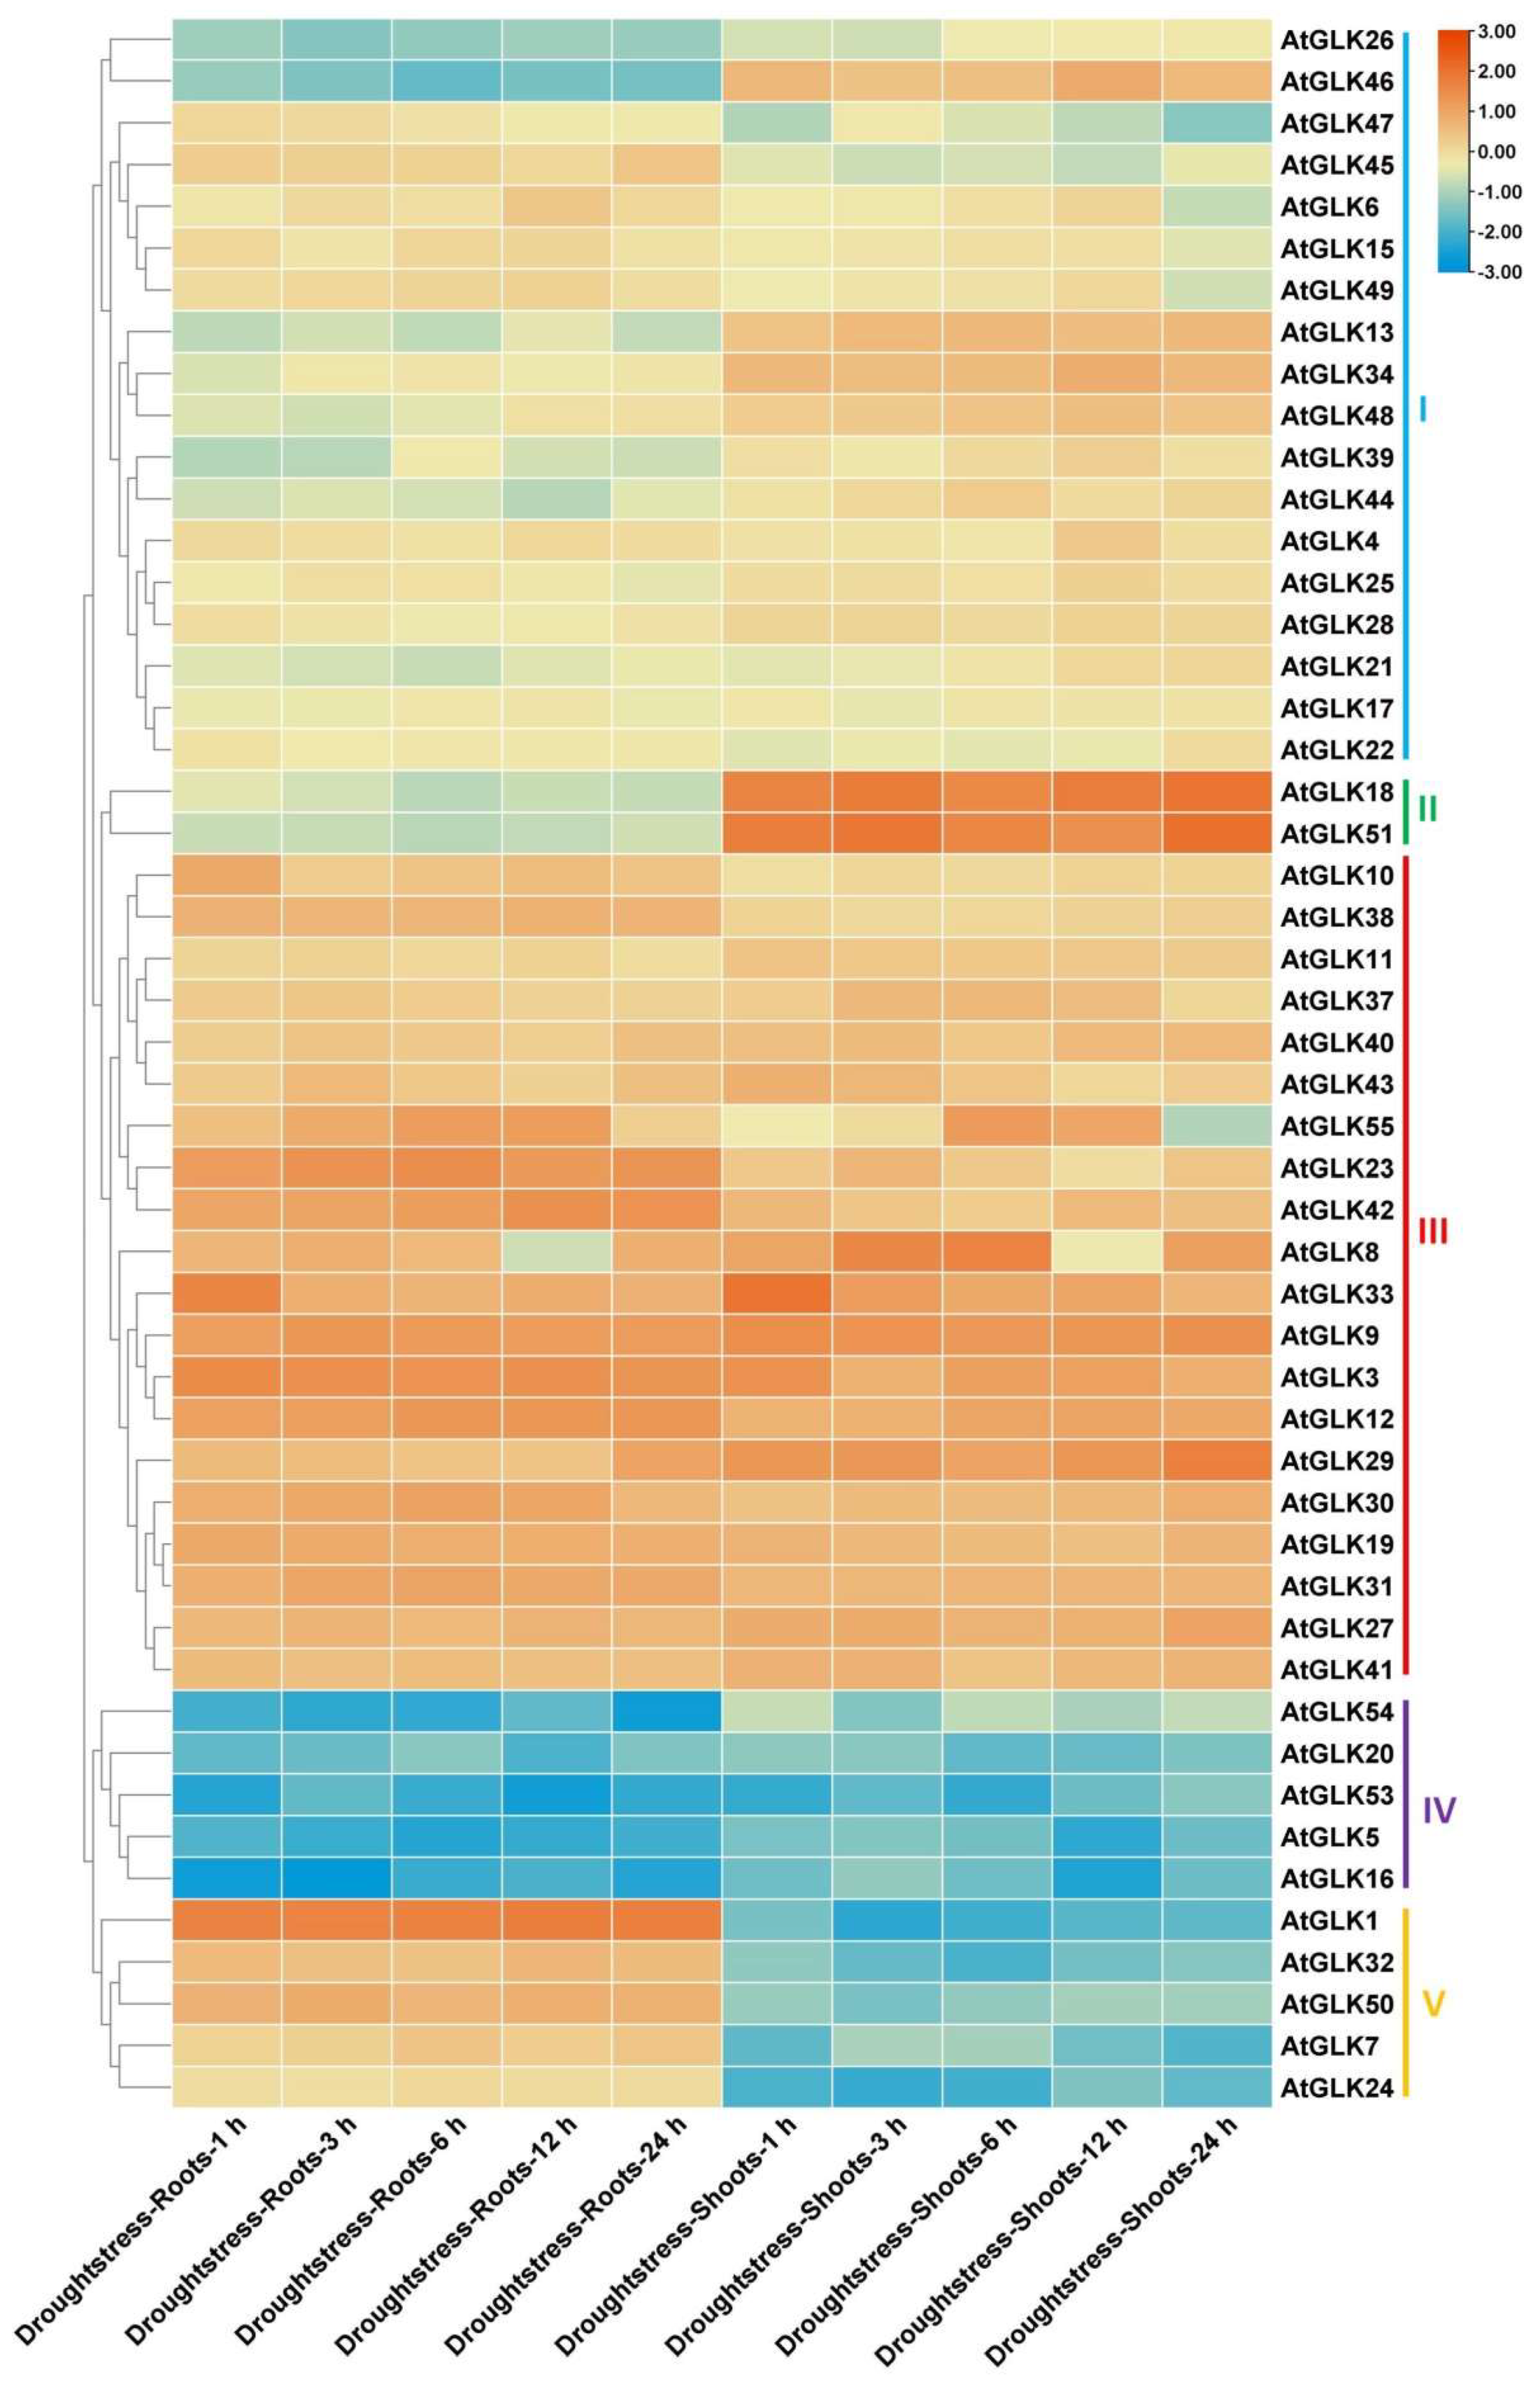
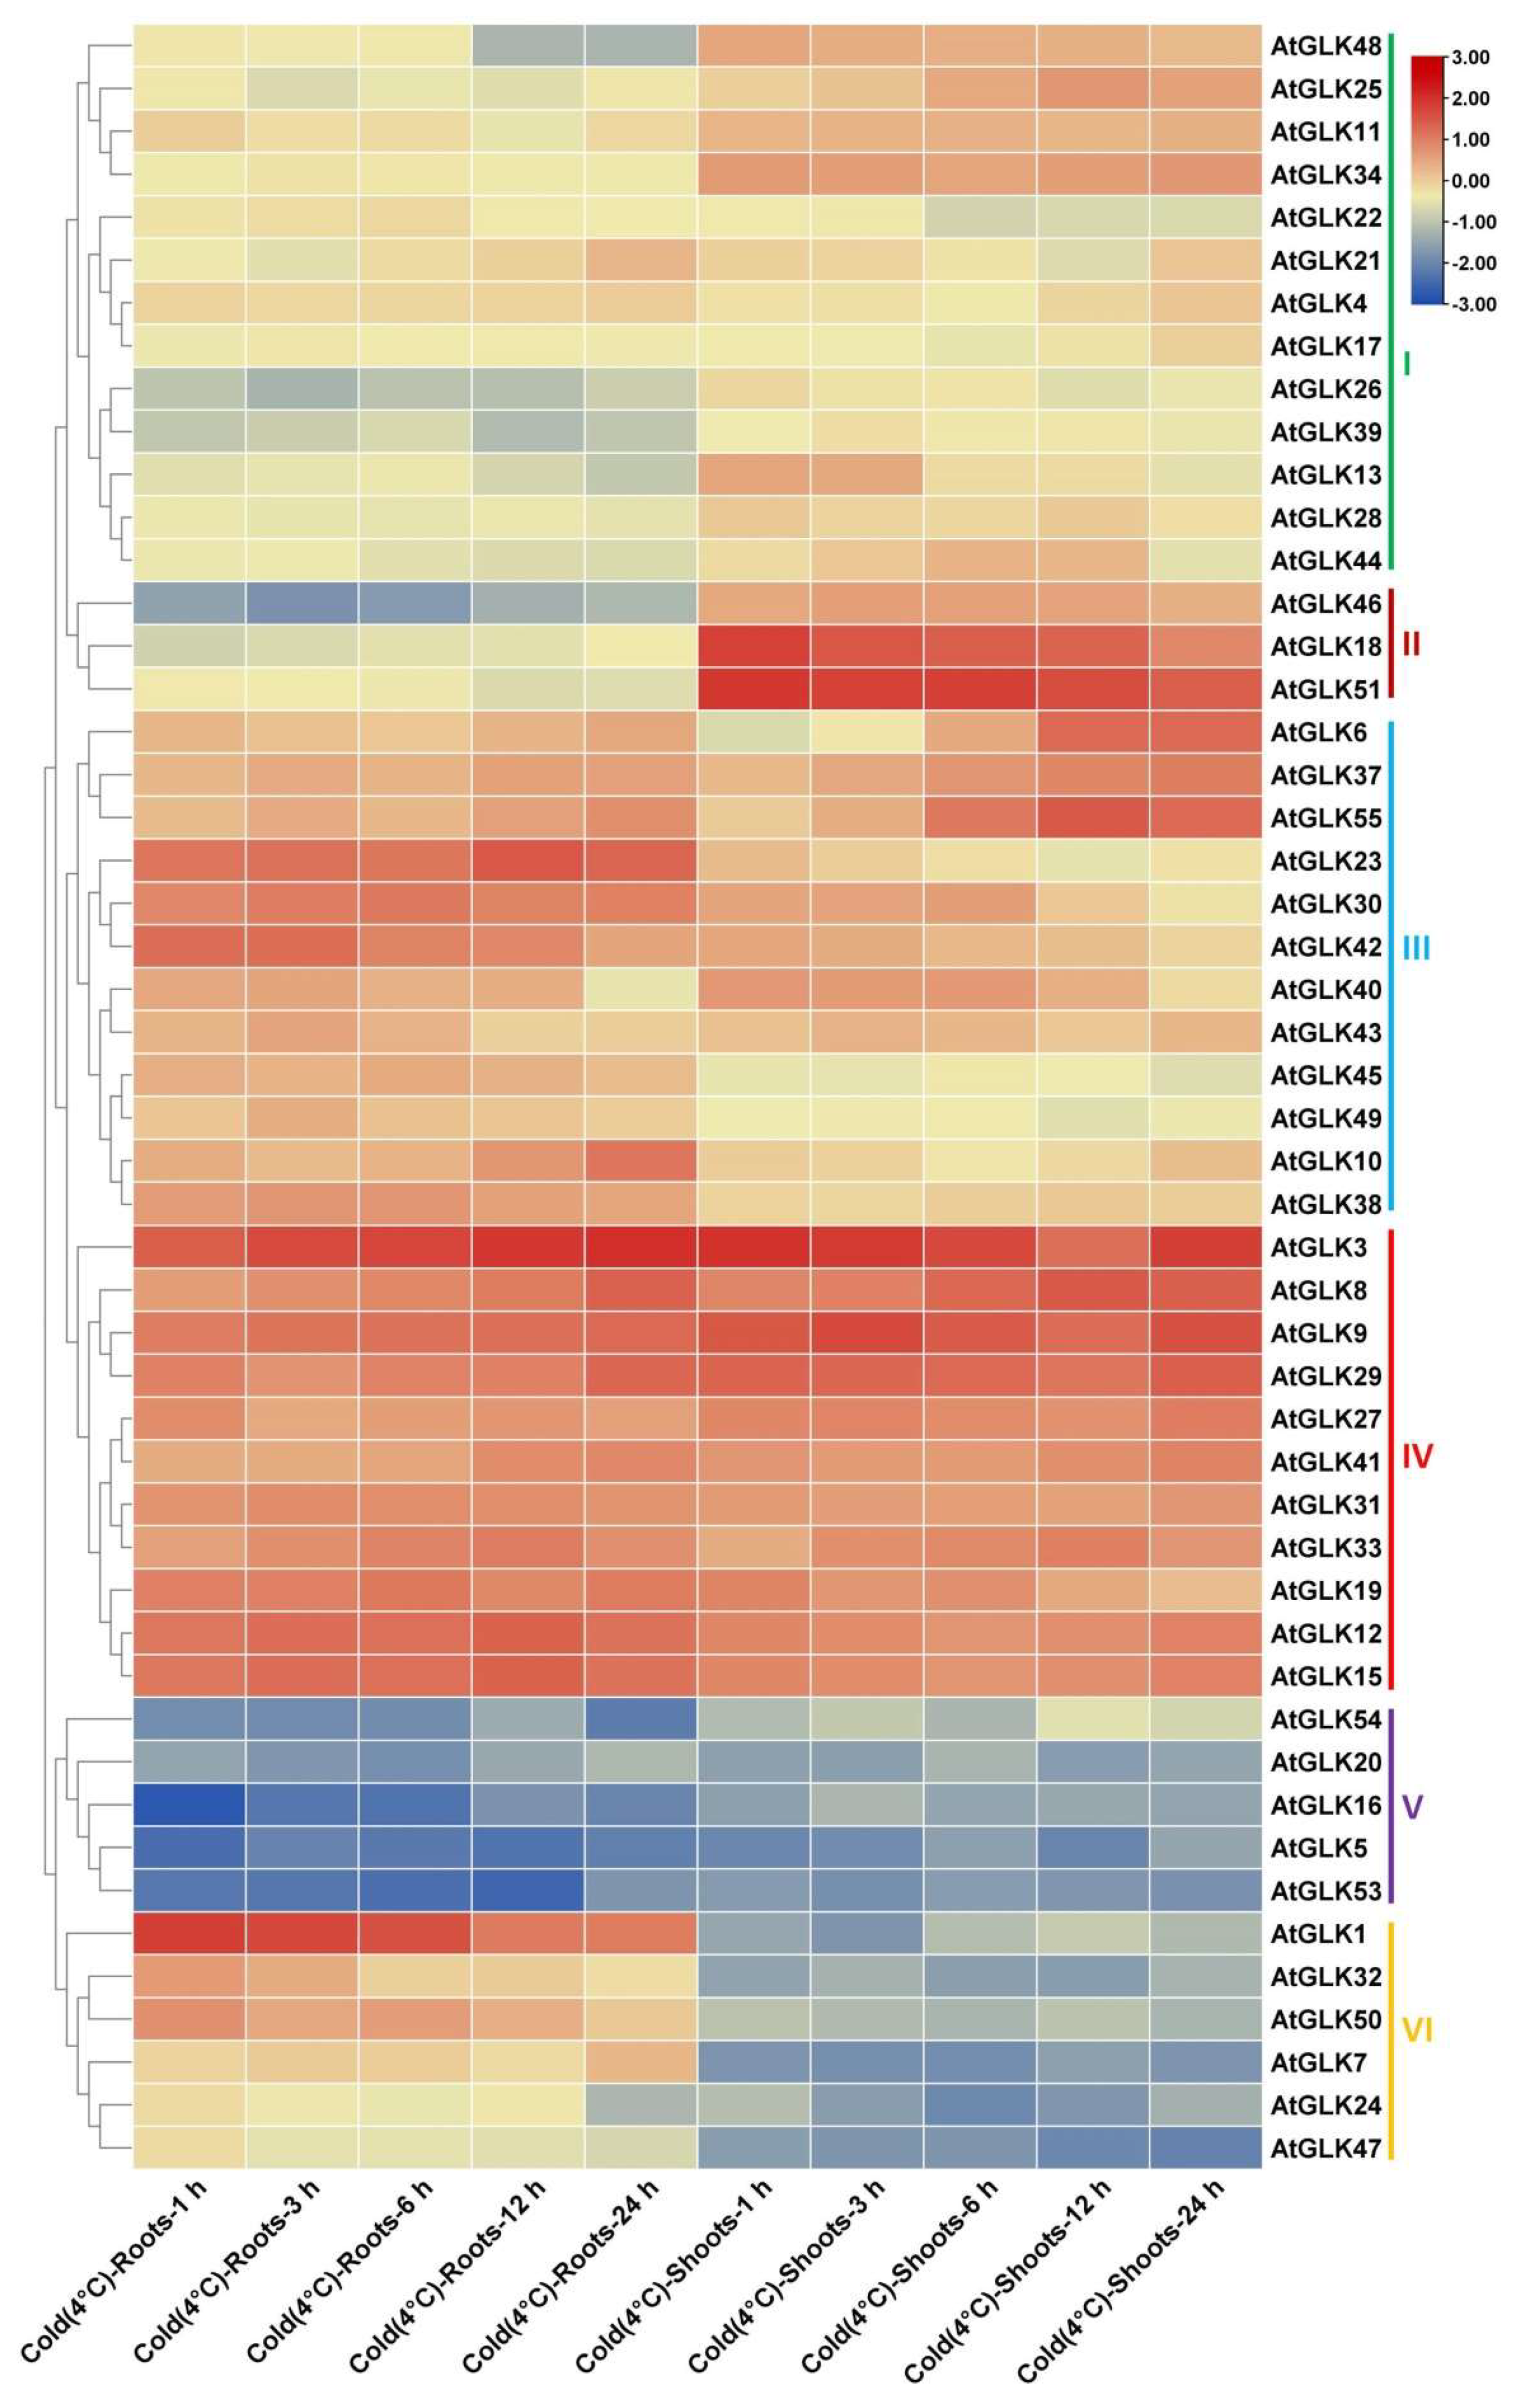
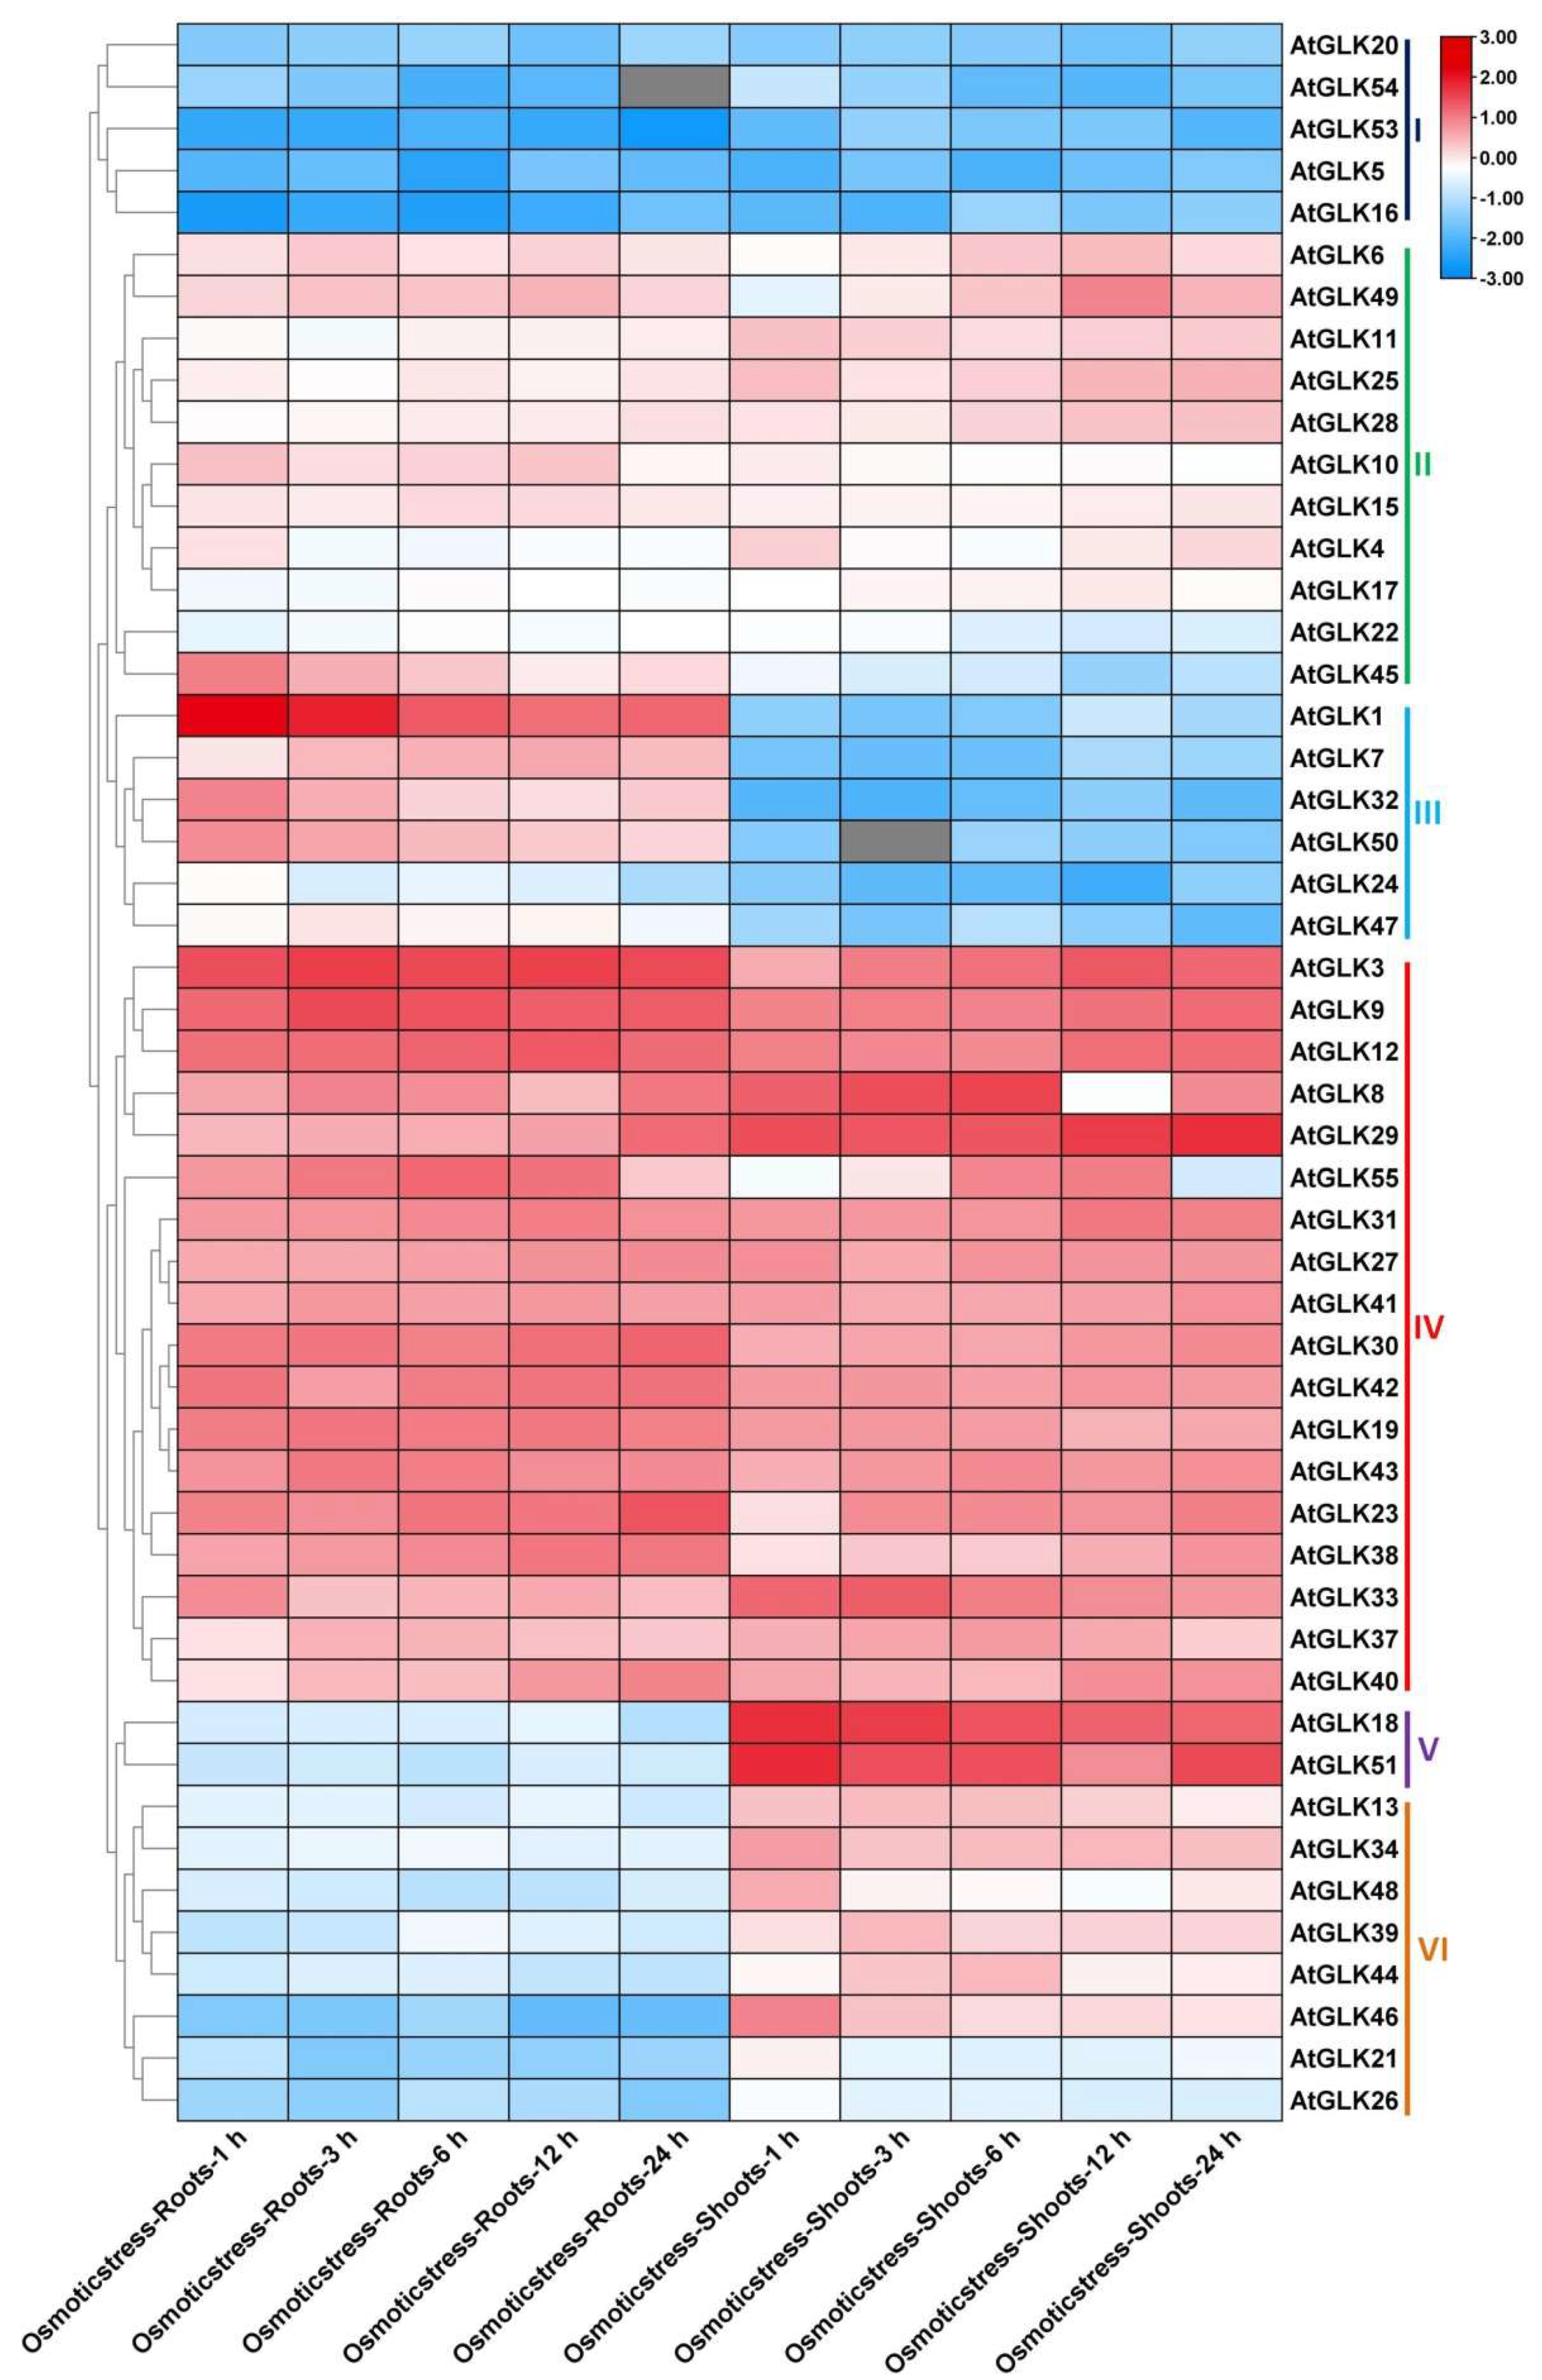
3.7. AtGLk Genes Expression under Drought, Cold, and Osmotic Stress

In order to investigate the potential role of AtGLKs genes under drought, cold, and osmotic stresses, we use the AtGenExpress dataset available in GEO [36]. In the case of drought stress treatment, the result showed that these 50 AtGLK genes were clustered into five major groups with subgroups (Figure 5). Group I includes 18 AtGLK genes, and most of them were more highly expressed in the shoot compared to the root. Group II contains two GLK genes specifically expressed in the shoot at all hour treatments, while group III includes 20 GLK genes. Most of the last genes were expressed at different hours of drought treatment in both the shoot and the root. Group IV was strongly repressed under different hours of treatments, in both organs while group V genes were highly expressed in the root while repressed in the shoot at different treatments.
In the case of cold stress treatment, 50 AtGLK genes were divided into six major groups with subgroups (Figure 6). Group 1 includes 13 AtGLK genes. Most of the genes were more highly expressed in the shoot versus the root at different times; Group II includes three genes, AtGLK18, AtGLK46 and AtGLK51, which were highly expressed in the shoot. Group III included 12 genes, and mostly all were more active in the root at all hours of treatment compared to the shoot, while group IV had 11 genes, and all genes were highly expressed in the root and shoot at different hours of cold stress treatment. The group V contains five genes that were repressed in root and shoot at all hours of treatment. Group VI includes six genes, which are specifically expressed in the root and repressed in the shoot at different hours of treatment.
In the case of osmotic stress treatment, the result revealed that the AtGLK genes were divided into six groups with subgroups (Figure 7). Group I contains five AtGLK genes repressed at root and shoot levels under osmotic stress conditions. Most group II genes had a deficient expression level in both the root and shoot under stress conditions. Group III contains seven AtGLK genes specifically expressed in the root at various stress levels. In group IV, almost all the AtGLK genes were highly expressed in root and shoot at different hours of treatment. Group V included two AtGLK genes highly expressed in the shoot at all hours of treatment, although not in the root, while group VI included eight AtGLK genes, and most of the genes were specifically expressed in the shoot at all hours of treatment.

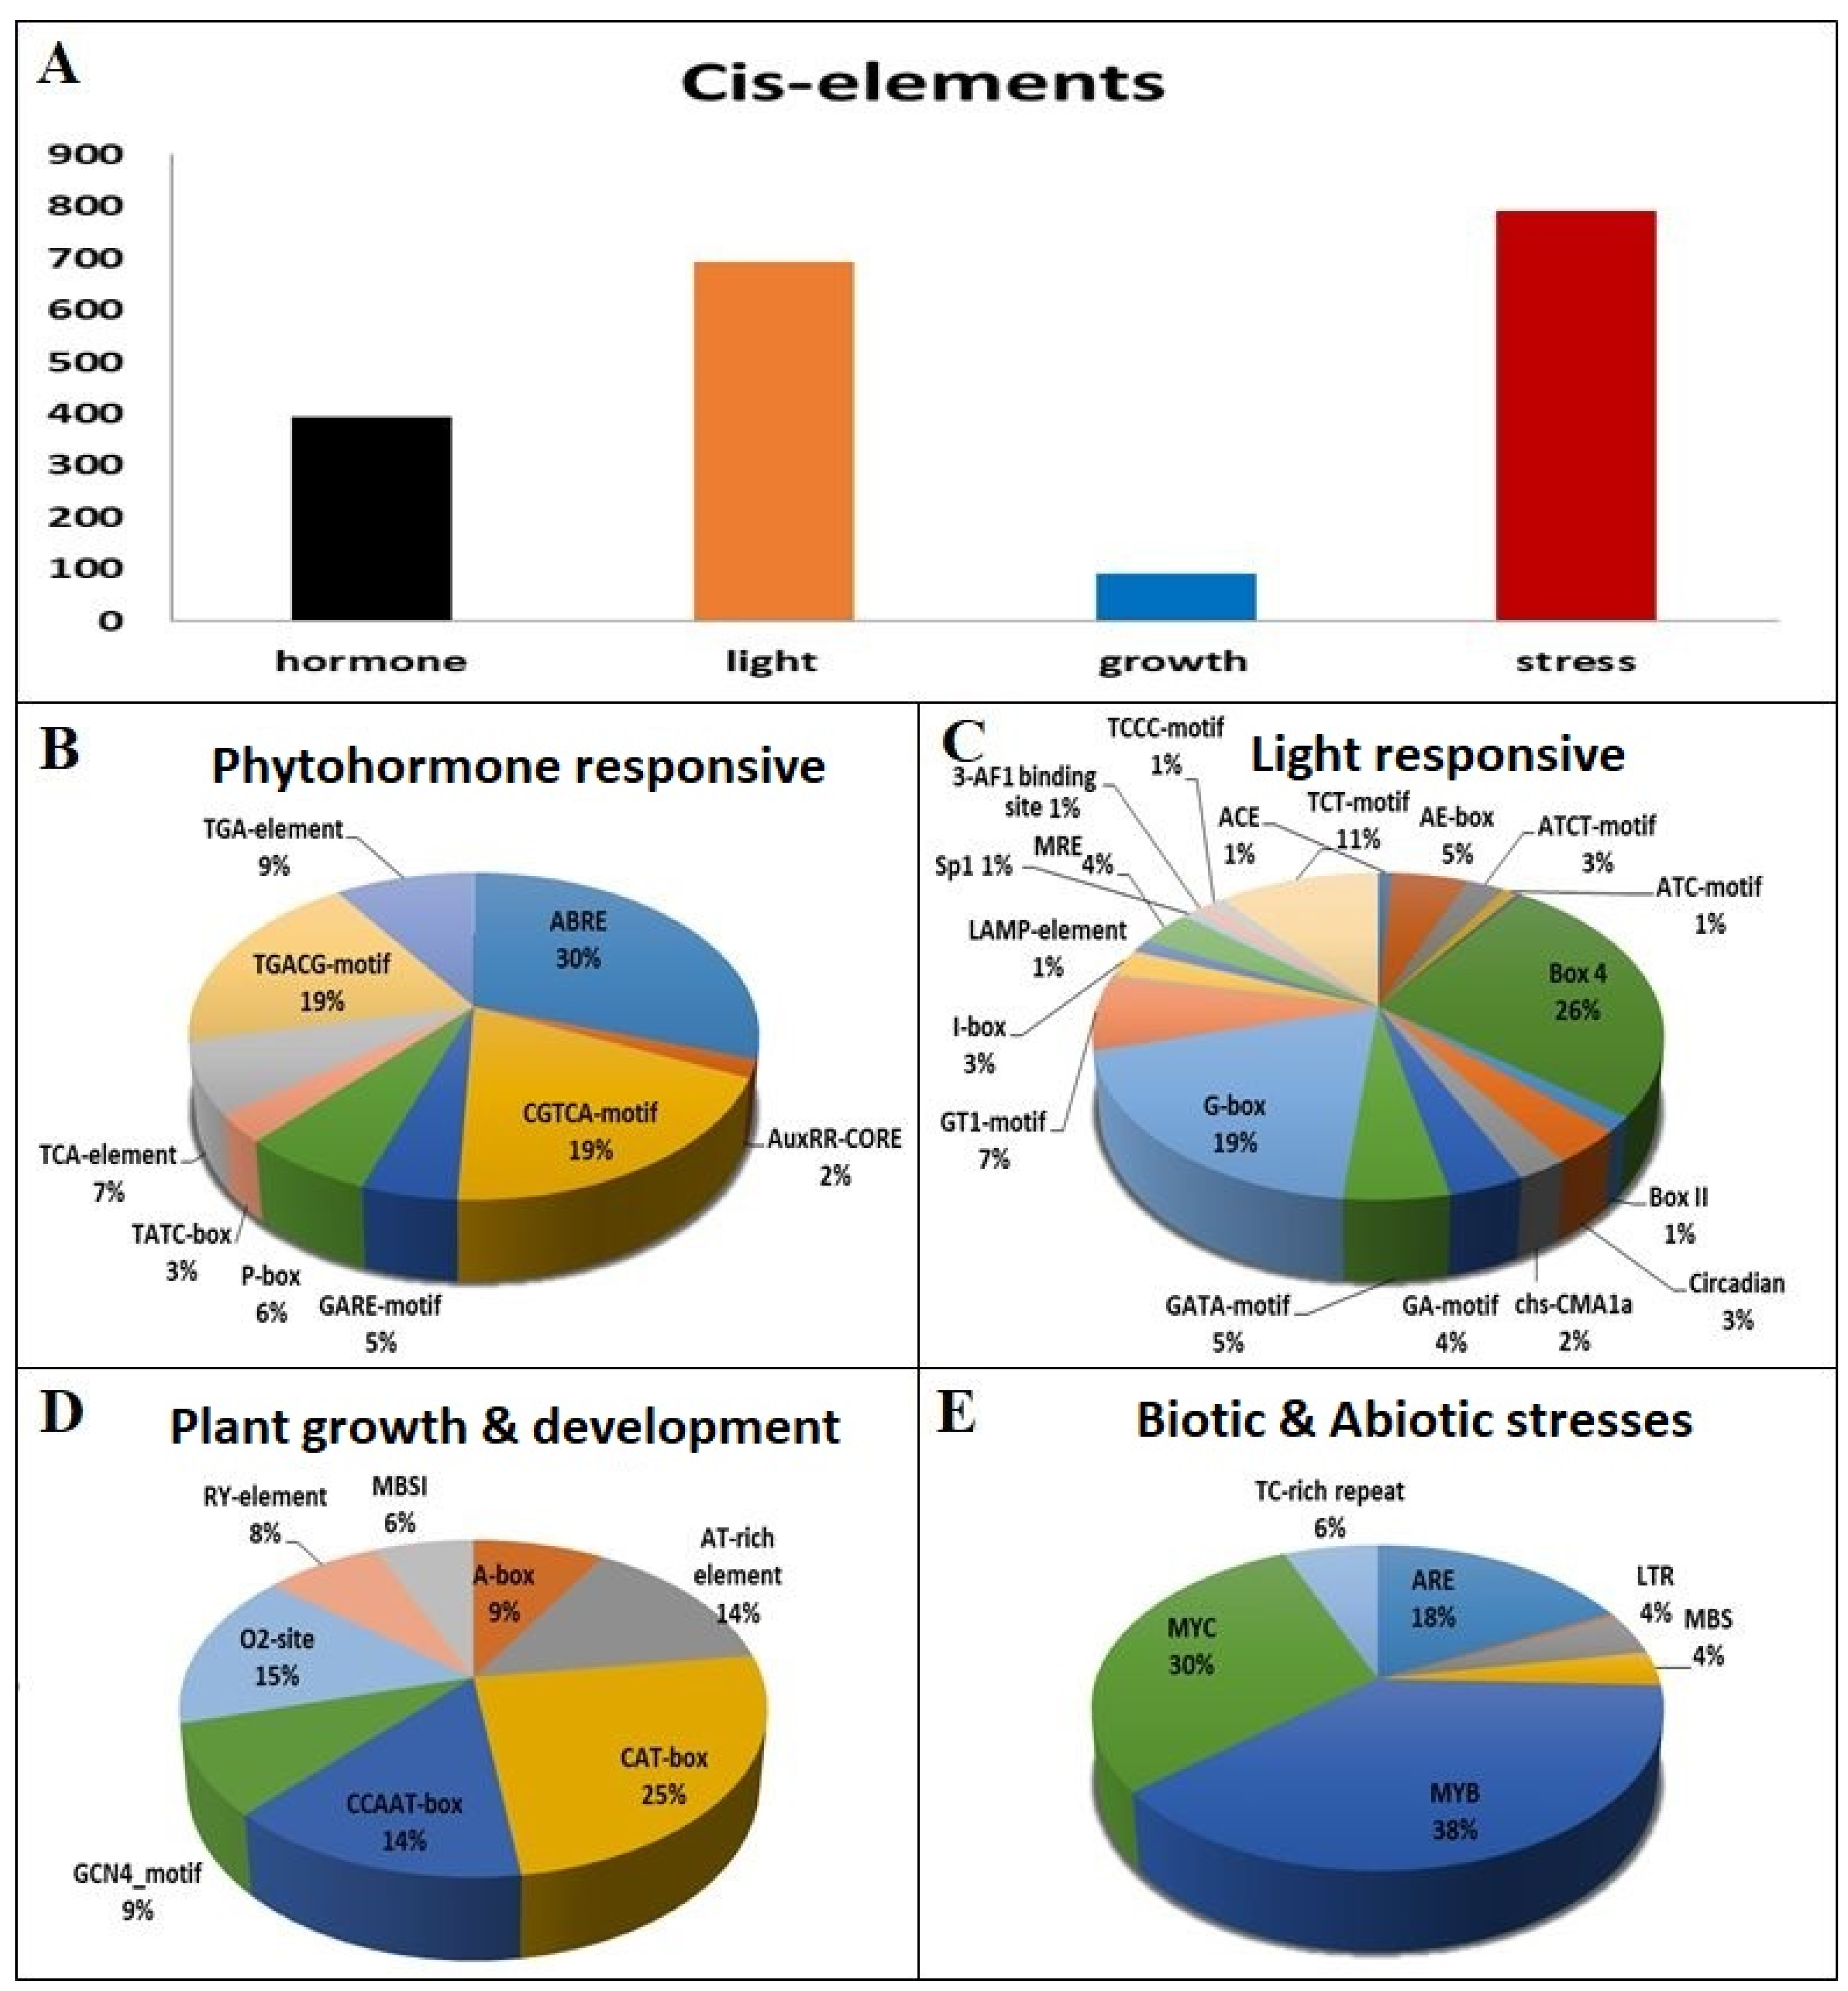
3.8. Putative Cis-Acting Elements of AtGLK Genes

The presence of cis-acting motifs in promoter regions is critical for downstream target gene expression and regulation via transcription factor interaction. Co-expressed genes may be mediated by the same transcription factors and can be recognized by the presence of specific cis-acting motifs in the promoter. Upstream 2-kb genomic sequences of the Arabidopsis GLK genes from TAIR databases were submitted to the PlantCARE database. A total of 1970 putative cis-acting elements were identified in the promoter regions of 55 AtGLK genes. All these identified cis-elements were classified into four groups based on their participation in various biological processes: phytohormone responsive (10), light-responsive (21), plant growth and development (eight), and stress-responsive (eight) (Table S4). Three phytohormone-regulatory elements (i.e., ABRE, TGACG, and CGTCA) involving abscisic acid, auxin signaling, and methyl jasmonate, respectively), three light-related elements (i.e., G-box, Box 4, and TCT motif), and three stress-related (i.e., ARE, MYB, and MYC) were identified with high numbers in the promoter regions of Arabidopsis GLK genes (Figure 8A–C,E). However, compared to the other three groups, plant developmental-related cis-acting elements were found at a very low frequency (Figure 8A).
In addition, the AtGLK genes in the same phylogenetic groups shared moderate similarity in their distribution of the cis-acting elements, reflecting the complex evolutionary relationship of the diverged AtGLK gene promoters (Figure 9, Table S4). Almost all of the identified cis-acting elements were randomly distributed in the promoter region of AtGLK gene groups. MYB (involved in drought, salt, and cold stresses) and MYC (involved in drought and ABA responsiveness) were found in all groups of AtGLK gene promoters [37,38]. In addition, all cluster groups except group VII gene promoters contained high numbers of absicisic asid (ABRE) and methyl jasmosmonate (MeJA) response elements (CGTCA-motif), TGACG-motif), implying that these genes are involved in the regulation of ABA and MeJA metabolic pathways [39]. The Gare-motifs (involved gibberellin-responsive) were more abundantly found in groups I and group III, while P-box elements (involved gibberellin-responsive) were preferentially present in group III and group VII gene promoters. These results suggest that the AtGLK genes play important roles in plant growth regulation and abiotic stress responses.
Furthermore, we have summarized the distribution of cis-elements of the promoter region of AtGLK genes in relation to expression pattern classification across different tissues (Figure 3, Table S5) and under various stresses, including ion stresses (Figure 4, Table S6), drought (Figure 5, Table S7), cold (Figure 6, Table S8), and osmotic stresses (Figure 7, Table S9). Almost all of the identified cis elements were randomly distributed in the promoter region of AtGLK genes. In the case of AtGLKs’ role in different tissues, the group I and group III genes contain high numbers of phytohormone, light-responsive, and plant development related elements compared to group II (Figure 3, Table S5), as these two groups of genes are constitutively expressed in one or more tissues or organs. In the case of AtGLK genes under various stresses, many stress-related cis elements were detected in the promoter region of most AtGLK genes, including ARE, MYB, MYC, MBS, ABRE, LTR, and TC-rich repeats, and were distributed randomly in different groups, while some particular genes contain high numbers of stress-responsive cis-elements in their promoter regions (Figure 4, Figure 5, Figure 6 and Figure 7, Tables S6–S9). The MYB has been identified as being involved in salt, drought, and cold stresses. MYC cis elements are involved in ABA and drought [39], and LTR is involved in low-temperature stress [40]. ABRE is involved in ABA and drought stress [41], which were detected in 30% of the AtGLKs gene promoters. TC-rich repeats also play an important role in plant defense and various stress responses [42]. The presence of different and high numbers of stress-related elements in the upstream of the AtGLK genes indicates that this family might be mainly involved in defense and stress response.

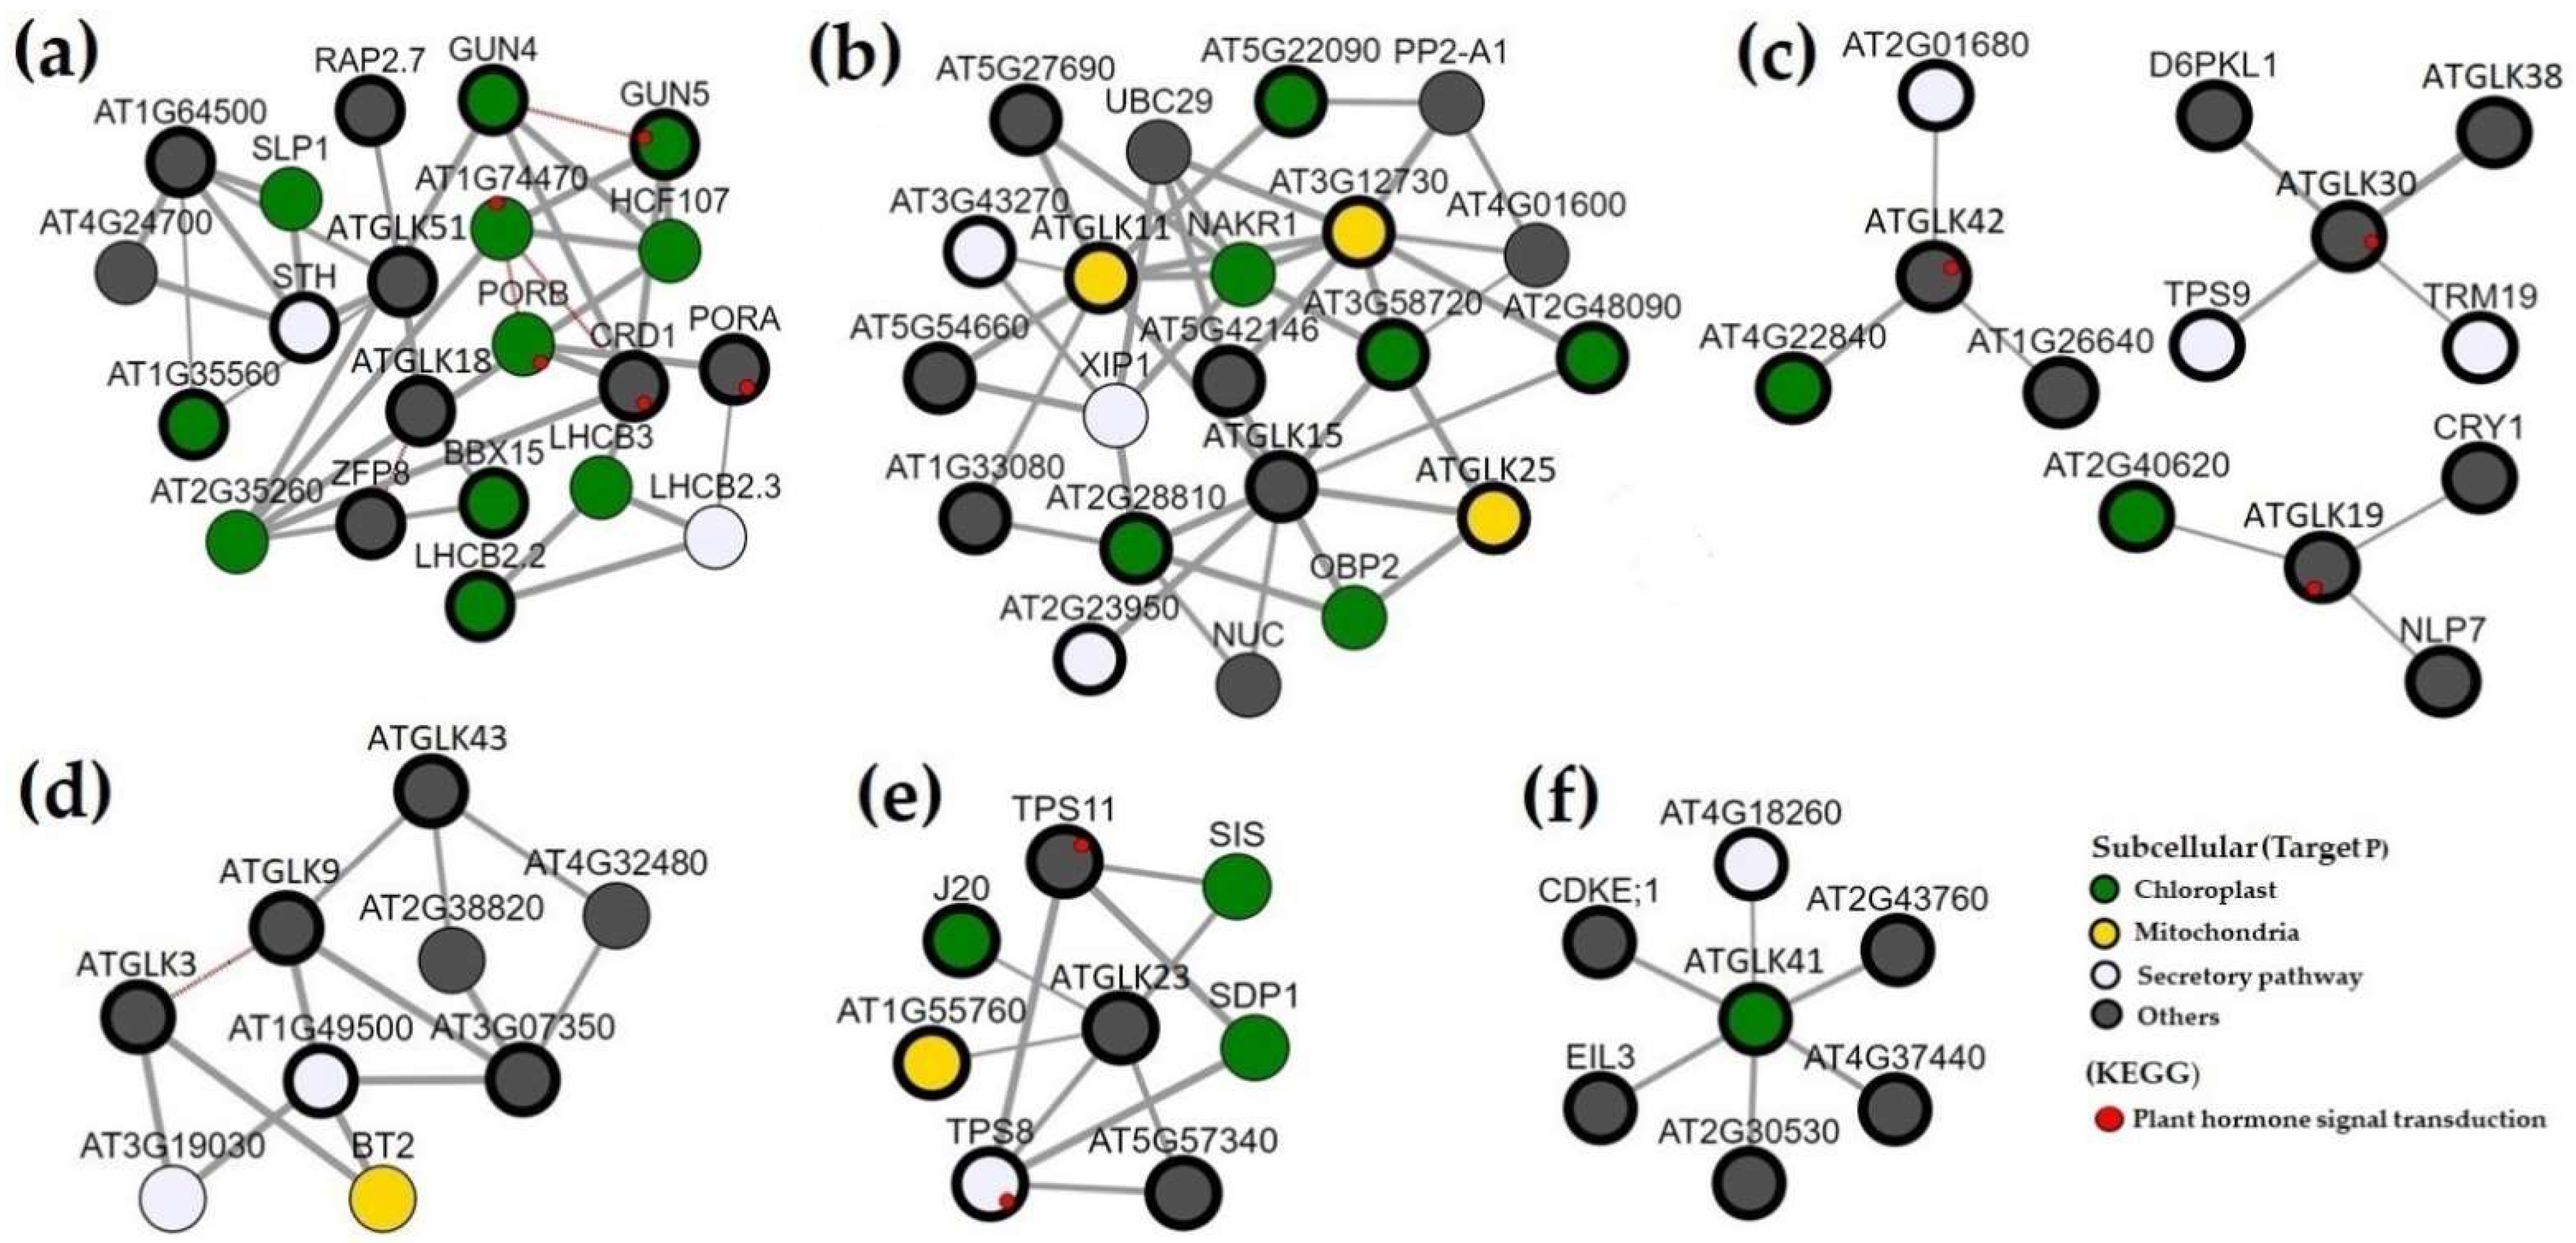
3.9. Co-expression Analyses and Functional Classification of the AtGLK Genes

Co-expression analysis was performed to further understand the functional factors involved in different biological processes. Therefore, 55 AtGLK genes were used for possible coordination of potential gene expression. A total of 65 genes were strongly co-expressed with 14 AtGLK genes by using the “CoExSearch” tool. Based on the analysis, different networks were generated by using Cytoscape to present the relationship between AtGLK genes and their co-expressed genes (Figure 10). Among these, 19 photosynthesis-related genes were strongly co-expressed with AtGLK genes (Figure 10a). In addition, 18 genes were related to flower development and formed a strong co-expression network with AtGLK genes (Figure 10b). Four AtGLK genes were strongly co-expressed with nine associated genes related to water deprivation (Figure 10c). Three AtGLK genes were strongly co-expressed with six genes related to stress responsiveness (Figure 10d). Furthermore, AtGLK23 was strongly co-expressed with seven genes related to cold stress (Figure 10e) and AtGLK41 was strongly co-expressed with six genes involved in phosphate ion deficiency responses (Figure 10f).
In addition, we further investigated the cis-acting elements in the promoter regions of co-expressed genes that could be involved in the co-expression networks (Table S10). Insightfully, almost all genes had significantly high ratios of G-box and CCAATC motifs in their promoter regions of co-expressed genes, clearly indicating the potential targets of ATGLK genes as such reported previously [43,44].

4. Discussion

The Golden2-Like transcription factor, which belongs to the GARP superfamily of Myb transcription factors, is found in various plant species [25,28] and is linked to many stresses. However, not been reported in the important model plant A. thaliana. In this study, we identified a total of 55 GLKs in the model plant A. thaliana, naming each gene based on its location on the chromosome. The Physio-Chemical properties of AtGLK revealed that the length of the sequence, molecular mass, and isoelectric point range was substantial. In the current study, all AtGLK proteins contained the Myb-DNA binding domain and other domains such as Myb CC LHEQLE, coiled-coil, and REC domains in addition to the Myb-DNA binding domain. The existence of multi-domain proteins in a species imply that these domains previously existed as distinct proteins, and combination of different domains showed their evolution for various functions.
The phylogenetic analysis revealed that AtGLK genes were clustered into seven groups. The existence of high bootstrap support on internal phylogenetic tree branches demonstrated the emergence of substantial probable homologous proteins from a common ancestor with the same functions. However, the low bootstrap does not support a specific bifurcation in the clad, and there is a chance that these proteins are less similar or unrelated, which may result in domains with various activities in the future. The average Ka/Ks ratio is less than one, showing a purifying selection pressure under Darwinian positive selection, suggesting that detrimental alleles are avoided through random mutation, stabilizing selection [45]. Overall, the study found that AtGLK duplication played a significant function in the evolution of Arabidopsis. The gene structures were globally conserved within a different group of phylogenetic classification, while 15 partially preserved motifs were detected in these GLK proteins as a similar number of motifs and organization was also found in cotton [27]. A gene ontology analysis was carried out, which classified protein functional characteristics into biological functions, cellular functions, and molecular processes. In the first biological functional category, the AtGLKs proteins have diverse roles in different developmental processes. In contrast, the total proteins have DNA-binding transcriptional activity functions in the molecular process. The predicted subcellular locations of Arabidopsis GLKs were mostly nuclear. However, some of them were located in the chloroplast (Table S3), as reported by their function in the growth and development of the chloroplast [14,15]. The presence of significant cis-regulatory elements of phytohormone related (ABRE, TGACG, and CGTCA), light-related (G-box, Box 4, and TCT), plant growth and development-related (AT-rich element, CAT-box, CCAAT-box), and stress-related (ARE, MYB, and MYC) elements of AtGLK genes promoter suggests that internal hormones and environmental signals can control the expression of these AtGLK genes, same as other reported in cotton [27] and tobacco plant [28].
Several studies revealed that AtGLK genes are transcription factors and play significant functions in plant development [9,15,16]. Our expression analysis indicated that 29% of the AtGLK genes were mainly expressed in almost all tested tissues, with relatively high expression levels. At the same time, some genes were also found to be expressed explicitly in one to three tissues or organs, demonstrating the gene family functional diversity in Arabidopsis plant development (Figure 3). Several AtGLK members with tissue-specifically expressed trends could be excellent target genes for more in-depth studies into their functions and potential applications in plant genetic improvement.
Plants are subjected to various types of severe environmental stresses (such as drought, cold, and osmotic stress), which affect photosynthesis and normal physiological metabolisms, eventually leading to plant death [46]. Overall, excess concentrations of metal ions are toxic to plant cells. Among them, cadmium and copper are highly toxic metal ions. Compared to other heavy metals, the As and Al are less toxic and exhibit inhibitory effects at high concentrations of NaCl [47]. Al+ ions seriously damage plant roots in acidic soil, exacerbate nutrient deficiency and enhance their sensitivity to drought condition [48]. Growth inhibition concerns roots and shoots due to inhibition of meristematic activities as ions have a negative role in the shoot production of crop plants [49,50]. To analyze AtGLK genes’ responses under different stresses (Al, Cd, Cu, and NaCl), their expressions were investigated (Figure 4) [37], and the result revealed that an excess of aluminum exposure preferentially expressed distinct and specific sets of genes such as AtGLK2, AtGLK39, and AtGLK53, whereas AtGLK1, AtGLK26, and AtGLK51 are strongly repressed. In the case of Cd+ treatment, it stimulates AtGLK18, AtGLK22, and AtGLK52 accumulation, whereas AtGLK26 and AtGLK46 are strongly repressed. Cu stimulates the level of AtGLK18, AtGLK22, AtGLK32, AtGLK51, AtGLK52, and AtGLK54, while AtGLK7, AtGLK17, AtGLK26, and AtGLK43 decrease the gene expression. In the case of NaCl stress treatment, it stimulates AtGLK2, AtGLK26, AtGLK43, and AtGLK46 with high levels of accumulation, whereas AtGLK5, AtGLK8, AtGLK20, AtGLK23, and AtGLK34 are strongly repressed. Further, the tentative function of AtGLK genes was investigated under drought, cold, and osmotic stresses at both root and shoot levels at different hours of treatment [36]. The drought stress has severely impacted crop yields. According to the World Food and Agriculture Organization, food output losses caused by drought have cost the world $30 billion over the last decade. It is critical to research the mechanisms of plant response to drought stress to make the best use of water resources [51]. In the case of drought stress treatment, the result showed that AtGLK genes were divided into five main groups with subgroups (Figure 5). Group III includes 40% of AtGLK genes expressed at different hours of drought treatment in both the shoot and the root. Similarly, most of the orthologous genes of group III in maize and cotton species were also shown to be involved in drought stress (Figure S1) [25,27]. Furthermore, in group I, 36% of AtGLK genes were highly expressed in the shoot compared to the root at different hours of treatment. However, group IV was strongly repressed under different hours of treatments, while group V was highly expressed in the root while repressed in the shoot at different treatments. Cold stress negatively impacts plant growth and development, such as impairing seed germination, delaying plant growth, preventing reproduction, lowering crop production and quality, and limiting species’ geographical distribution [52]. As a result, many crops are cold-sensitive and can only be grown in tropical or subtropical climates [53]. However, in cold stress, AtGLK genes were clustered into six major groups with subgroups (Figure 6), including Group I, where 26% of AtGLK genes were expressed in the shoot versus the root at different times. In contrast, in group III, 24% of genes were expressed in the root at all hours of treatment compared to the shoot, while in group IV, 22% of genes were highly expressed in the root and shoot at different hours of cold stress treatment, which was also supported by their orthologous GLK genes expressions in cotton and maize under cold stress treatment [25,27]. Group V contains five genes repressed in the root and shoot, and group VI was specifically expressed in the root and repressed in the shoot at different hours of treatment. Osmotic adjustment plays a crucial role in crop tolerance to a variety of non-biological stimuli, and plants may stabilize osmotic pressure within cells, increasing solutes in the cells, preventing water dispersion [54]. AtGLK genes were found to be clustered into six groups, with subgroups in osmotic stress (Figure 7). Under osmotic stress, group I, containing AtGLK genes, was repressed at the root and shoot levels. Group III contains seven AtGLK genes explicitly expressed in the root at various stress levels. Almost all of the AtGLK genes were highly expressed in the root and shoot of group IV at various treatment times. Group V contained two AtGLK genes that were significantly more expressed in the shoot than in the root at all hours of treatment, whereas group V1 contained eight AtGLK genes that were specifically expressed in the shoot at all hours of treatment. In general, two AtGLK genes, including AtGLK18, AtGLK51 were highly expressed in three stresses at different hours of treatment.

5. Conclusions

In conclusion, a total of 55 GLK genes were identified in Arabidopsis genomes. The full-length AtGLK genes were classified into six main groups by phylogenetic analysis. Analyses of gene structural organization, motifs analysis, and sequence conservation revealed that the AtGLK genes of different groups were well conserved in Arabidopsis. The Ka/Ks ratio analysis indicated that AtGLK gene members had experienced purifying selection during polyploidization, and their essential functions have remained largely unchanged. Promoter sequence analysis showed the presence of a high number of phytohormone-, light-, and stress-related elements in the promoters of GLK genes in Arabidopsis. Expression analysis indicated that most AtGLK genes were mainly expressed in all tested tissues. At the same time, some genes were also found to be expressed explicitly in one to three tissues or organs, demonstrating the gene family’s functional diversity in Arabidopsis plant growth and development. The expression profile of AtGLK genes in response to different ions, salt, drought, cold, and osmotic stress reveals that AtGLK gene members are extensively involved in metal ion transport and involved in drought, cold, and osmotic stress.

Supplementary Materials

The following supporting information can be downloaded at: https://www.mdpi.com/article/10.3390/d14030228/s1. Table S1: List of A. thaliana GLK protein genes and their related information. Table S2: Classification of A. thaliana GLK domain-containing proteins based on the presence or not and organization of additional domain(s). Table S3: Summary of gene ontology terms of A. thaliana GLK genes. Table S4: Putative cis-regulatory element analysis of the promoter region of A. thaliana GLK genes. Table S5: Distribution of cis-regulatory elements of the promoter region of AtGLK genes in relation to expression pattern classification across different tissues in Figure 3. Table S6: Distribution of cis-regulatory elements of the promoter region of AtGLK genes in relation to expression pattern classification under ionic stresses in Arabidopsis root as shown in Figure 4. Table S7: Distribution of cis-regulatory elements of the promoter region of AtGLK genes in relation to expression pattern classification under drought stress conditions in Figure 5. Table S8: Distribution of cis-regulatory elements of the promoter region of AtGLK genes in relation to expression pattern classification under cold stress conditions in Figure 6. Table S9: Distribution of cis-regulatory elements of the promoter region of AtGLK genes in relation to expression pattern classification under osmotic stress conditions in Figure 7. Table S10: Distribution of cis-regulatory elements in the promoter region of coexpressed genes with AtGLKs. Figure S1. Phylogenetic tree based on multiple sequence alignment of GLK proteins from Arabidopsis thaliana, Gossypium hirsutum, Nicotiana tabacum, and Zea mays.

Author Contributions

Conceptualization, L.G. and I.A.; methodology, I.A.; software, I.A.; validation, L.G., I.A., X.W. and Q.Y.; formal analysis, I.A.; investigation, I.A.; resources, L.G.; data curation, I.A.; writing—original draft preparation, I.A.; writing—review and editing, I.A.; visualization, L.G.; supervision, L.G.; project administration, L.G.; funding acquisition, L.G. All authors have read and agreed to the published version of the manuscript.

Funding

This research was funded by the start-up fund from South China Agricultural University (to L.G.).

Data Availability Statement

The data sets that support the conclusions of this article are included in this article.

Acknowledgments

The authors thank the participants in this study as well as the reviewers and the editors for their valuable comments and opinions.

Conflicts of Interest

The authors declare no conflict of interest.

References

  1. Suo, J.; Liang, X.; Pu, L.; Zhang, Y.; Xue, Y. Identification of GhMYB109 encoding a R2R3 MYB transcription factor that expressed specifically in fiber initials and elongating fibers of cotton (Gossypium hirsutum L.). Biochim. Biophys. Acta (BBA)-Gene Struct. Expr. 2003, 1630, 25–34. [Google Scholar] [CrossRef] [PubMed]
  2. Shin, D.H.; Choi, M.-G.; Kang, C.-S.; Park, C.-S.; Choi, S.-B.; Park, Y.-I. A wheat R2R3-MYB protein PURPLE PLANT1 (TaPL1) functions as a positive regulator of anthocyanin biosynthesis. Biochem. Biophys. Res. Commun. 2016, 469, 686–691. [Google Scholar] [CrossRef] [PubMed]
  3. Ramsay, N.A.; Glover, B.J. MYB–bHLH–WD40 protein complex and the evolution of cellular diversity. Trends Plant Sci. 2005, 10, 63–70. [Google Scholar] [CrossRef] [PubMed]
  4. Zaikina, E.A.; Rumyantsev, S.D.; Sarvarova, E.R.; Kuluev, B.R. Transcription factor genes involved in plant response to abiotic stress factors. EcoGen 2019, 17, 47–58. [Google Scholar] [CrossRef] [Green Version]
  5. Kasuga, M.; Liu, Q.; Miura, S.; Yamaguchi-Shinozaki, K.; Shinozaki, K. Improving plant drought, salt, and freezing tolerance by gene transfer of a single stress-inducible transcription factor. Nat. Biotechnol. 1999, 17, 287–291. [Google Scholar] [CrossRef]
  6. Xie, Z.; Nolan, T.M.; Jiang, H.; Yin, Y. AP2/ERF transcription factor regulatory networks in hormone and abiotic stress responses in Arabidopsis. Front. Plant Sci. 2019, 10, 228. [Google Scholar] [CrossRef] [Green Version]
  7. Ambawat, S.; Sharma, P.; Yadav, N.R.; Yadav, R.C. MYB transcription factor genes as regulators for plant responses: An overview. Physiol. Mol. Biol. Plants 2013, 19, 307–321. [Google Scholar] [CrossRef] [Green Version]
  8. Riechmann, J.L.; Heard, J.; Martin, G.; Reuber, L.; Jiang, C.-Z.; Keddie, J.; Adam, L.; Pineda, O.; Ratcliffe, O.; Samaha, R. Arabidopsis transcription factors: Genome-wide comparative analysis among eukaryotes. Science 2000, 290, 2105–2110. [Google Scholar] [CrossRef]
  9. Hall, L.N.; Rossini, L.; Cribb, L.; Langdale, J.A. GOLDEN 2: A novel transcriptional regulator of cellular differentiation in the maize leaf. Plant Cell 1998, 10, 925–936. [Google Scholar] [CrossRef] [Green Version]
  10. Rossini, L.; Cribb, L.; Martin, D.J.; Langdale, J.A. The maize golden2 gene defines a novel class of transcriptional regulators in plants. Plant Cell 2001, 13, 1231–1244. [Google Scholar] [CrossRef] [Green Version]
  11. Savitch, L.V.; Subramaniam, R.; Allard, G.C.; Singh, J. The GLK1 ‘regulon’encodes disease defense related proteins and confers resistance to Fusarium graminearum in Arabidopsis. Biochem. Biophys. Res. Commun. 2007, 359, 234–238. [Google Scholar] [CrossRef] [PubMed]
  12. Schreiber, K.J.; Nasmith, C.G.; Allard, G.; Singh, J.; Subramaniam, R.; Desveaux, D. Found in translation: High-throughput chemical screening in Arabidopsis thaliana identifies small molecules that reduce Fusarium head blight disease in wheat. Mol. Plant-Microbe Interact. 2011, 24, 640–648. [Google Scholar] [CrossRef] [PubMed]
  13. Murmu, J.; Wilton, M.; Allard, G.; Pandeya, R.; Desveaux, D.; Singh, J.; Subramaniam, R. A rabidopsis GOLDEN2-LIKE (GLK) transcription factors activate jasmonic acid (JA)-dependent disease susceptibility to the biotrophic pathogen Hyaloperonospora arabidopsidis, as well as JA-independent plant immunity against the necrotrophic pathogen Botrytis cinerea. Mol. Plant Pathol. 2014, 15, 174–184. [Google Scholar]
  14. Nagatoshi, Y.; Mitsuda, N.; Hayashi, M.; Inoue, S.-i.; Okuma, E.; Kubo, A.; Murata, Y.; Seo, M.; Saji, H.; Kinoshita, T. GOLDEN 2-LIKE transcription factors for chloroplast development affect ozone tolerance through the regulation of stomatal movement. Proc. Natl. Acad. Sci. USA 2016, 113, 4218–4223. [Google Scholar] [CrossRef] [Green Version]
  15. Fitter, D.W.; Martin, D.J.; Copley, M.J.; Scotland, R.W.; Langdale, J.A. GLK gene pairs regulate chloroplast development in diverse plant species. Plant J. 2002, 31, 713–727. [Google Scholar] [CrossRef] [PubMed] [Green Version]
  16. Yasumura, Y.; Moylan, E.C.; Langdale, J.A. A conserved transcription factor mediates nuclear control of organelle biogenesis in anciently diverged land plants. Plant Cell 2005, 17, 1894–1907. [Google Scholar] [CrossRef] [PubMed] [Green Version]
  17. Liu, D.; Zhao, D.; Li, X.; Zeng, Y. AtGLK2, an Arabidopsis GOLDEN2-LIKE transcription factor, positively regulates anthocyanin biosynthesis via AtHY5-mediated light signaling. Plant Growth Regul. 2021, 96, 79–90. [Google Scholar] [CrossRef]
  18. Powell, A.L.; Nguyen, C.V.; Hill, T.; Cheng, K.L.; Figueroa-Balderas, R.; Aktas, H.; Ashrafi, H.; Pons, C.; Fernández-Muñoz, R.; Vicente, A. Uniform ripening encodes a Golden 2-like transcription factor regulating tomato fruit chloroplast development. Science 2012, 336, 1711–1715. [Google Scholar] [CrossRef] [Green Version]
  19. Taketa, S.; Hattori, M.; Takami, T.; Himi, E.; Sakamoto, W. Mutations in a Golden2-like Gene Cause Reduced Seed Weight in Barley albino lemma 1 Mutants. Plant Cell Physiol. 2021, 62, 447–457. [Google Scholar] [CrossRef]
  20. Rauf, M.; Arif, M.; Dortay, H.; Matallana-Ramírez, L.P.; Waters, M.T.; Gil Nam, H.; Lim, P.O.; Mueller-Roeber, B.; Balazadeh, S. ORE1 balances leaf senescence against maintenance by antagonizing G2-like-mediated transcription. EMBO Rep. 2013, 14, 382–388. [Google Scholar] [CrossRef] [Green Version]
  21. Chen, M.; Ji, M.; Wen, B.; Liu, L.; Li, S.; Chen, X.; Gao, D.; Li, L. GOLDEN 2-LIKE Transcription Factors of Plants. Front. Plant Sci. 2016, 7, 1509. [Google Scholar] [CrossRef] [PubMed] [Green Version]
  22. Han, X.-Y.; Li, P.-X.; Zou, L.-J.; Tan, W.-r.; Zheng, T.; Zhang, D.-W.; Lin, H.-H. GOLDEN2-LIKE transcription factors coordinate the tolerance to Cucumber mosaic virus in Arabidopsis. Biochem. Biophys. Res. Commun. 2016, 477, 626–632. [Google Scholar] [CrossRef] [PubMed]
  23. Liu, J.; Mehari, T.; Xu, Y.; Umer, M.; Hou, Y.; Wang, Y.; Peng, R.; Wang, K.; Cai, X.; Zhou, Z. GhGLK1 a Key Candidate Gene From GARP Family Enhances Cold and Drought Stress Tolerance in Cotton. Front. Plant Sci. 2021, 12, 759312. [Google Scholar] [CrossRef]
  24. Nakamura, H.; Muramatsu, M.; Hakata, M.; Ueno, O.; Nagamura, Y.; Hirochika, H.; Takano, M.; Ichikawa, H. Ectopic overexpression of the transcription factor OsGLK1 induces chloroplast development in non-green rice cells. Plant Cell Physiol. 2009, 50, 1933–1949. [Google Scholar] [CrossRef] [Green Version]
  25. Liu, F.; Xu, Y.; Han, G.; Zhou, L.; Ali, A.; Zhu, S.; Li, X. Molecular evolution and genetic variation of G2-like transcription factor genes in maize. PLoS ONE 2016, 11, e0161763. [Google Scholar] [CrossRef]
  26. Junfang, L.; Jia, Z.; He, L.; Tingting, Z.; Jingfu, L. Research Progress of Plant GOLDEN2-like Transcription Factor. Mol. Plant Breed. 2017, 10, 3949–3956. [Google Scholar]
  27. Zhao, Z.; Shuang, J.; Li, Z.; Xiao, H.; Liu, Y.; Wang, T.; Wei, Y.; Hu, S.; Wan, S.; Peng, R. Identification of the Golden-2-like transcription factors gene family in Gossypium hirsutum. PeerJ 2021, 9, e12484. [Google Scholar] [CrossRef] [PubMed]
  28. Qin, M.; Zhang, B.; Gu, G.; Yuan, J.; Yang, X.; Yang, J.; Xie, X. Genome-Wide Analysis of the G2-like Transcription Factor Genes and Their Expression in Different Senescence Stages of Tobacco (Nicotiana tabacum L.). Front. Genet. 2021, 12, 626352. [Google Scholar] [CrossRef]
  29. Kumar, S.; Stecher, G.; Li, M.; Knyaz, C.; Tamura, K. MEGA X: Molecular evolutionary genetics analysis across computing platforms. Mol. Biol. Evol. 2018, 35, 1547. [Google Scholar] [CrossRef]
  30. Jones, D.T.; Taylor, W.R.; Thornton, J.M. The rapid generation of mutation data matrices from protein sequences. Bioinformatics 1992, 8, 275–282. [Google Scholar] [CrossRef]
  31. Obayashi, T.; Hayashi, S.; Saeki, M.; Ohta, H.; Kinoshita, K. ATTED-II provides coexpressed gene networks for Arabidopsis. Nucleic Acids Res. 2009, 37, D987–D991. [Google Scholar] [CrossRef] [PubMed] [Green Version]
  32. Goldman, N.; Yang, Z. A codon-based model of nucleotide substitution for protein-coding DNA sequences. Mol. Biol. Evol. 1994, 11, 725–736. [Google Scholar] [PubMed] [Green Version]
  33. Yang, Z.; Goldman, N.; Friday, A. Comparison of models for nucleotide substitution used in maximum-likelihood phylogenetic estimation. Mol. Biol. Evol. 1994, 11, 316–324. [Google Scholar] [PubMed] [Green Version]
  34. Suyama, M.; Torrents, D.; Bork, P. PAL2NAL: Robust conversion of protein sequence alignments into the corresponding codon alignments. Nucleic Acids Res. 2006, 34, W609–W612. [Google Scholar] [CrossRef] [PubMed] [Green Version]
  35. Mergner, J.; Frejno, M.; List, M.; Papacek, M.; Chen, X.; Chaudhary, A.; Samaras, P.; Richter, S.; Shikata, H.; Messerer, M. Mass-spectrometry-based draft of the Arabidopsis proteome. Nature 2020, 579, 409–414. [Google Scholar] [CrossRef] [PubMed]
  36. Kilian, J.; Whitehead, D.; Horak, J.; Wanke, D.; Weinl, S.; Batistic, O.; D’Angelo, C.; Bornberg-Bauer, E.; Kudla, J.; Harter, K. The AtGenExpress global stress expression data set: Protocols, evaluation and model data analysis of UV-B light, drought and cold stress responses. Plant J. 2007, 50, 347–363. [Google Scholar] [CrossRef] [PubMed]
  37. Zhao, C.-R.; Ikka, T.; Sawaki, Y.; Kobayashi, Y.; Suzuki, Y.; Hibino, T.; Sato, S.; Sakurai, N.; Shibata, D.; Koyama, H. Comparative transcriptomic characterization of aluminum, sodium chloride, cadmium and copper rhizotoxicities in Arabidopsis thaliana. BMC Plant Biol. 2009, 9, 32. [Google Scholar] [CrossRef] [Green Version]
  38. Dai, X.; Xu, Y.; Ma, Q.; Xu, W.; Wang, T.; Xue, Y.; Chong, K. Overexpression of an R1R2R3 MYB gene, OsMYB3R-2, increases tolerance to freezing, drought, and salt stress in transgenic Arabidopsis. Plant Physiol. 2007, 143, 1739–1751. [Google Scholar] [CrossRef] [Green Version]
  39. Onishi, M.; Tachi, H.; Kojima, T.; Shiraiwa, M.; Takahara, H. Molecular cloning and characterization of a novel salt-inducible gene encoding an acidic isoform of PR-5 protein in soybean (Glycine max [L.] Merr.). Plant Physiol. Biochem. 2006, 44, 574–580. [Google Scholar] [CrossRef]
  40. Maestrini, P.; Cavallini, A.; Rizzo, M.; Giordani, T.; Bernardi, R.; Durante, M.; Natali, L. Isolation and expression analysis of low temperature-induced genes in white poplar (Populus alba). J. Plant Physiol. 2009, 166, 1544–1556. [Google Scholar] [CrossRef]
  41. Manavella, P.A.; Dezar, C.A.; Ariel, F.D.; Chan, R.L. Two ABREs, two redundant root-specific and one W-box cis-acting elements are functional in the sunflower HAHB4 promoter. Plant Physiol. Biochem. 2008, 46, 860–867. [Google Scholar] [CrossRef] [PubMed]
  42. Banerjee, J.; Sahoo, D.K.; Dey, N.; Houtz, R.L.; Maiti, I.B. An intergenic region shared by At4g35985 and At4g35987 in Arabidopsis thaliana is a tissue specific and stress inducible bidirectional promoter analyzed in transgenic Arabidopsis and tobacco plants. PLoS ONE 2013, 8, e79622. [Google Scholar] [CrossRef] [Green Version]
  43. Waters, M.T.; Wang, P.; Korkaric, M.; Capper, R.G.; Saunders, N.J.; Langdale, J.A. GLK transcription factors coordinate expression of the photosynthetic apparatus in Arabidopsis. Plant Cell 2009, 21, 1109–1128. [Google Scholar] [CrossRef] [Green Version]
  44. Tamai, H.; Iwabuchi, M.; Meshi, T. Arabidopsis GARP transcriptional activators interact with the Pro-rich activation domain shared by G-box-binding bZIP factors. Plant Cell Physiol. 2002, 43, 99–107. [Google Scholar] [CrossRef] [PubMed] [Green Version]
  45. Tien, N.S.H.; Sabelis, M.W.; Egas, M. Inbreeding depression and purging in a haplodiploid: Gender-related effects. Heredity 2015, 114, 327–332. [Google Scholar] [CrossRef] [PubMed] [Green Version]
  46. Morales, F.; Ancín, M.; Fakhet, D.; González-Torralba, J.; Gámez, A.L.; Seminario, A.; Soba, D.; Ben Mariem, S.; Garriga, M.; Aranjuelo, I. Photosynthetic metabolism under stressful growth conditions as a bases for crop breeding and yield improvement. Plants 2020, 9, 88. [Google Scholar] [CrossRef] [Green Version]
  47. Arif, N.; Yadav, V.; Singh, S.; Singh, S.; Ahmad, P.; Mishra, R.K.; Sharma, S.; Tripathi, D.K.; Dubey, N.; Chauhan, D.K. Influence of high and low levels of plant-beneficial heavy metal ions on plant growth and development. Front. Environ. Sci. 2016, 4, 69. [Google Scholar] [CrossRef]
  48. Kochian, L.V.; Hoekenga, O.A.; Pineros, M.A. How do crop plants tolerate acid soils? Mechanisms of aluminum tolerance and phosphorous efficiency. Annu. Rev. Plant Biol. 2004, 55, 459–493. [Google Scholar] [CrossRef]
  49. Amaresan, N.; Murugesan, S.; Kumar, K.; Sankaranarayanan, A. Microbial Mitigation of Stress Response of Food Legumes; CRC Press: Boca Raton, FL, USA, 2020. [Google Scholar]
  50. Sharma, S.S.; Kumar, V.; Dietz, K.-J. Emerging trends in metalloid-dependent signaling in plants. Trends Plant Sci. 2021, 26, 452–471. [Google Scholar] [CrossRef]
  51. Zhang, W.; Xu, H.; Duan, X.; Hu, J.; Li, J.; Zhao, L.; Ma, Y. Characterizing the Leaf Transcriptome of Chrysanthemum rhombifolium (Ling et C. Shih), a Drought Resistant, Endemic Plant From China. Front. Genet. 2021, 12, 45. [Google Scholar] [CrossRef]
  52. Körner, C. Plant adaptation to cold climates. F1000Research 2016, 5. [Google Scholar] [CrossRef] [PubMed]
  53. Gong, Z.; Xiong, L.; Shi, H.; Yang, S.; Herrera-Estrella, L.R.; Xu, G.; Chao, D.-Y.; Li, J.; Wang, P.-Y.; Qin, F. Plant abiotic stress response and nutrient use efficiency. Sci. China Life Sci. 2020, 63, 635–674. [Google Scholar] [CrossRef] [PubMed]
  54. Evelin, H.; Devi, T.S.; Gupta, S.; Kapoor, R. Mitigation of salinity stress in plants by arbuscular mycorrhizal symbiosis: Current understanding and new challenges. Front. Plant Sci. 2019, 10, 470. [Google Scholar] [CrossRef] [PubMed] [Green Version]
Figure 1. Schematic diagram of Arabidopsis GLK gene structural organization and motifs composition. On the left, the Maximum Likelihood method (M.L) evolutionary tree, followed by the gene structure with exons-introns, shown as yellow color boxes and black lines. The left side of the picture is followed by the conserved motifs presented in various colors. Black lines indicate Non-conserved sequences.
Diversity 14 00228 g001
Figure 2. Distribution of 55 GLK genes on five chromosomes of Arabidopsis. The chromosome number (Chr1—Chr5) is indicated above each chromosome. The gene name and position (Mb) are indicated on different chromosomes. The positions of duplicated genes are linked with the dashed.
Diversity 14 00228 g002
Figure 3. Expression pattern of AtGLK genes in 23 various plant tissues or organs. The heatmap was constructed using the Arabidopsis tissue atlas accession number E-MTAB-7978 of Arabidopsis development (AtGenExpress Developmental Expression Atlas) defined by Schmid et al. [35]. The color scale at the bottom of the heatmap shows log2 transformed FPKM values. The 55 AtGLK genes were clustered according to the log2-transformed FPKM values. The types of tissues are presented on the bottom side. The gene names are presented in the right position in the heatmap. The expression scale highlights the relative expansion values and is presented at the right position of the heatmap.
Diversity 14 00228 g003
Figure 4. Expression analysis of AtGLK genes in response to ionic stresses in Arabidopsis root. Heatmap was generated from the experimental microarray data. Treatment and replicates were defined by Zhao et al. [37]. In the heatmap, three biological replicates’ intensity values were averaged and z-score transformed based on the control treatment. Control shows non-stressed roots. Yellow and blue color indicates high and low expression levels, respectively.
Diversity 14 00228 g004
Figure 5. The expression of AtGLK genes in roots and shoots under drought responses. Heatmap generated from microarray experiments. Treatments and replicate numbers were determined by Kilian et al. [36]. Two biological replicates’ intensity values were pooled and normalized following the control treatment (treatment/control) in the heatmap. Control roots and shoots represent non-stressed tissue. The brown and the blue intensities show high and low expression levels, respectively.
Diversity 14 00228 g005
Figure 6. The expression of AtGLK genes in roots and shoots under cold responses. Heatmap generated from microarray experiments. Treatments and replicate numbers were determined by Kilian et al. [36]. Two biological replicates’ intensity values were pooled and normalized following the control treatment (treatment/control) in the heatmap. Control roots and shoots represent non-stressed tissue. The red and the blue intensities show high and low expression levels, respectively.
Diversity 14 00228 g006
Figure 7. The expression of AtGLK genes in roots and shoots under osmotic responses. Heatmap generated from microarray experiments. Treatments and replicate numbers were determined by Kilian et al. [36]. Two biological replicates’ intensity values were pooled and normalized following the control treatment (treatment/control) in the heatmap. Control roots and shoots represent non-stressed tissue. The red and the blue intensities show high and low expression levels, respectively.
Diversity 14 00228 g007
Figure 8. The regulatory elements analysis of the Arabidopsis GLK gene promoters. The total number of cis-acting elements in a different category was shown with a different colored histogram (A). The identified cis-acting element in each category of Arabidopsis was represented by pie charts (BE).
Diversity 14 00228 g008
Figure 9. Schematic representation of important cis-elements in the promoter region of AtGLK genes in relation to the phylogenetic classification of their encoded AtGLK proteins. The different types of cis-elements were shown in different colors.
Diversity 14 00228 g009
Figure 10. Co-expression networks of AtGLK genes. Co-expression networks among AtGLK and photosynthesis related genes (a), flower development related genes (b), water deprivation related genes (c), stress responsive genes (d), cold stress responsive genes (e) and phosphate starvation related genes (f). The different colors of node represent the subcellular targets and pathways. The rich circle represents the most important known targets for AtGLKs, and the thickness of the edge represents the strength of interaction between the nodes.
Diversity 14 00228 g010
Table 1. The Ka, Ks, and Ka/Ks ratios of AtGLK gene pairs.
Gene PairIGene PairIIKSKAKa/KsPurifying Selection
AtGLK1AtGLK321.09840.29410.2677Yes
AtGLK2AtGLK140.81780.25920.3169Yes
AtGLK3AtGLK91.81480.30260.1667Yes
AtGLK17AtGLK411.2080.41480.3434Yes
AtGLK19AtGLK421.3850.23010.1662Yes
AtGLK27AtGLK441.48320.24020.1619Yes
AtGLK30AtGLK381.00020.22460.2246Yes
AtGLK33AtGLK551.42550.26910.1888Yes
Publisher’s Note: MDPI stays neutral with regard to jurisdictional claims in published maps and institutional affiliations.

