Article

Yeast and Lactic Acid Bacteria Dominate the Core Microbiome of Fermented ‘Hairy’ Tofu (Mao Tofu)

1
Plant Soil and Microbial Sciences, Michigan State University, 1066 Bogue St., East Lansing, MI 48824, USA
2
Department of Plant Protection, Shenyang Agricultural University, Shenyang 110866, China
3
The Germplasm Bank of Wild Species, Yunnan Key Laboratory for Fungal Diversity and Green Development, Kunming Institute of Botany, Chinese Academy of Sciences, Kunming 650201, China
*
Authors to whom correspondence should be addressed.
These authors contributed equally to this work.
Diversity 2022, 14(3), 207; https://doi.org/10.3390/d14030207
Submission received: 16 January 2022 / Revised: 1 March 2022 / Accepted: 8 March 2022 / Published: 11 March 2022
(This article belongs to the Special Issue The Hidden Fungal Diversity in Asia)

Abstract

:
The process of fermenting tofu extends back thousands of years and is an indispensable part of Chinese culture. Despite a cultural resurgence in fermented foods and interest in microbiomes, there is little knowledge on the microbial diversity represented in fermented ‘hairy’ tofu, known locally in China as Mao tofu. High-throughput metagenomic sequencing of the ITS, LSU and 16S rDNA was used to determine Mao tofu’s fungal and bacterial community diversity across four wet markets in Yunnan, China. The results show that hairy tofu in this region consists of around 170 fungal and 365 bacterial taxa, and that microbial taxa differ between markets. Diversity also differed based on the specific niche of the tofu block, comparing the outside rind-like niche to that of the inside of the tofu block. Machine learning random forest models were able to accurately classify both the market and niche of sample origin. An over-abundance of yeast and Geotrichum was found, and Mucor (Mucoromycota) was abundant in the outside rind-like niche, which consists of the visible ‘hairy’ mycelium. The majority of the bacterial OTUs belonged to Proteobacteria, Firmicutes, and Bacteroidetes, with Acinetobacter, Lactobacillus, Sphingobacterium and Flavobacterium the most abundant genera. Putative fungal pathogens of plants (Cercospora, Diaporthe, Fusarium) and animals (Metarhizium, Entomomortierella, Pyxidiophora, Candida, Clavispora) were also detected, as were putative bacterial pathogens identified as Legionella. Non-fungal eukaryotic taxa detected by LSU amplicon sequencing included soybean (Glycine max), Protozoa, Metazoa (e.g., Nematoda and Platyhelminthes), Rhizaria and Chromista, indicating that additional biodiversity exists in the hairy tofu microbiome.

1. Introduction

Soybean is an important crop with wide applications in livestock, fuel, and food technologies. Soybean has relatively high levels of protein, fiber, vitamins, minerals, and has a low amount of saturated fats [1]. Many well-known traditional foods are produced by fermenting soybeans, including soy sauces, soy cheese, soy yogurt, stinky tofu, and Mao tofu. Through fermentation, carbohydrates, proteins, and lipids from soybean are broken down and converted through microbial metabolism [2], which significantly increases the concentration of known beneficial compounds including isoflavones, antioxidant capacity, B vitamins, and gamma-aminobutyric acid levels [3]. Fermented soybean products have been shown to have anti-diabetic [4], antioxidant [5], anti-cancer [6,7], anti-inflammatory [8], and anti-hyperlipidemic [9] properties. Fermented tofu has also been shown to stimulate blood pressure [6,10], immunity [8], and neural activity [11], and is known to provide other health benefits.
Stinky tofu and Mao tofu are popular fermented soy products with cultural origins in China. Through fermentation, stinky tofu and Mao tofu develop a pungent odor and flavor [12]. Topically, stinky tofu has a smooth surface with a color that varies from golden to black, while Mao tofu is typically hairy in appearance, from the growth of fluffy white mycelia characteristic of zygomyceteous fungi. The fermentation principles of stinky tofu and Mao tofu are very different, and the manufacturing procedures can vary from region to region. Stinky tofu is made by soaking soybean curds in fermented stinky brine for a few hours to several days, whereas Mao tofu is made by exposing the curds to open-air without the addition of any microbiota or additional moisture [13].
Previous studies on the production of stinky tofu have shown that lactic acid bacteria (Lactobacillus, Leuconostoc, Streptococcus, etc.) and other species of bacteria play a dominant role in the fermentation [14,15,16,17,18]. The microbiology of Mao tofu is still not well-studied, but fungi are assumed to be particularly important in the fermentation of Mao tofu given their conspicuous fluffy nature. It has been hypothesized that the main causative fermenters of Mao tofu are Mucor spp. [13]. Fermentation of Mao tofu is predicted to be influenced by starting material inputs and environmental factors, including temperature, humidity, fermentation duration, and processing condition. However, despite its long history of production and consumption, there is a dearth of information on the composition and structure of the microbial communities associated with Mao tofu.
To address this, we studied 72 Mao tofu samples from four markets in Yunnan, China. We characterized the fungal and bacterial communities in the exterior and internal niche of Mao tofu through high-throughput metagenomic sequencing of the internal transcribed spacer (ITS), the large subunit (LSU) of the nuclear ribosomal DNA, and the 16S ribosomal RNA gene to test the hypotheses that: (i) there is a core group of microbial taxa in fermented tofu; (ii) microbial communities are structured by region or market; and (iii) microbial community diversity on the exterior of Mao tofu differs from that of the interior.

2. Material and Methods

2.1. Sampling

We sampled Mao tofu from four wet markets located across Kunming City (Ciba) and Jianshui City (Longjin, Wanyao, and New District) in Yunnan, China (Figure S1). From each market, three individual pieces of mature Mao tofu samples were purchased from three independent vendors, and from each piece of tofu we sampled both inside (internal) and outside (external) microbial niches. Physico-chemical parameters involved in the production of Mao tofu in each region differed, but we were not able to access these parameters directly in this study. A total of 72 samples, 36 for each niche, were analyzed here.

2.2. DNA Extraction, Amplification and NGS Library Preparation

Tofu samples were carried back to the lab from the market in sterile plastic bags and ~1 g of was collected from the outside of each piece and placed in a cetyl trimethylammonium bromide (CTAB) 4x DNA buffer. Samples were then carefully split open, and ~1 g of internal tofu was sampled with sterile forceps and placed in a different tube containing CTAB. DNA was extracted from samples through chloroform extraction, and then precipitated and washed with ethanol as previously described [19]. The fungal internal transcribed spacer (ITS) region of the ribosomal RNA (rRNA) was amplified with the ITS1F-ITS4 primer set [20,21]. ITS markers provide species-level identification in many cases, but may bias against organisms with long ITS sequences, such as those in the Mucoromycota and Zoopagomycota [22]. Therefore, the large subunit (LSU) region of ribosomal RNA (rRNA) was amplified with the primers LROR-LR3 [23] to target eukaryotes and as a second marker for fungi. Prokaryotic V4 region of the 16S rRNA was amplified with the primer 515F-806R [24]. Amplicon libraries were prepared as described in previous studies [19,25,26]. Amplicon libraries were sequenced on a MiSeq Illumina platform with v3 300 PE chemistry.

2.3. Bioinformatics

The raw data quality of ITS, LSU, and 16S read data was assessed by FastQC (http://www.bioinformatics.babraham.ac.uk/projects/fastqc/, accessed on 25 May 2020). For each dataset, sequences were then demultiplexed in QIIME according to barcode indices [27]. Subsequently, Illumina adapters and primers were trimmed off the reads with Cutadapt [28]. Reads were then filtered according to maximum expected errors = 0.5 for ITS, 1.0 for LSU, and 0.1 for 16S to account for different error rates obtained during each sequencing run. Conserved regions upstream (SSU) and downstream (5.8S) of ITS1 were removed as described previously [29]. Sequences were trimmed to lengths of 200 nucleotides for ITS and 250 bp for LSU and 16S [30,31]. Sequences were then de-replicated, singleton sequences were removed, and remaining sequences were used to create operational taxonomic units (OTUs) at 97% similarity threshold with the UPARSE algorithm [32].
Taxonomic assignments of OTUs were performed with the RDP Naïve Bayesian Classifier [33] against the 16S and LSU representative sequence releases for the 16S and LSU data, respectively, and with CONSTAX [34] against the UNITE (V.04.02.2020) fungal rDNA reference database [35] for ITS. Ambiguous taxonomy assignments were manually checked with the BLAST algorithm against the NCBI GenBank database [36] (https://www.ncbi.nlm.nih.gov/, accessed on 25 May 2020).

2.4. Statistical Analyses

The 16S, LSU, and ITS OTU tables, metadata, taxonomy, and reference sequences files were imported in the R statistical environment [37] and combined in phyloseq [38] as objects for the subsequent analysis. Datasets were then filtered, removing all sequences belonging to mitochondria, chloroplast, non-target organisms, and potential contaminants as detected by the decontam package [39]. Control samples were then removed from the datasets. Plots showing contaminant OTU frequency and histogram of sample libraries distribution are available in Figure S2. Rarefaction curves were calculated in vegan [40] using the function “rarecurve”. Observed OTU richness and the Shannon diversity index were calculated in vegan with the “specnumber” and “diversity” functions [40]. Shannon index [ H = i = 1 k p i l o g ( p i ) ] was then transformed into the Shannon equitability index ( E H = 1 H l o g ( k ) ), with k denoting the number of species (i.e., OTUs) and pi the proportional abundance of species i. This normalizes the Shannon index to a value between 0 and 1 with higher values indicating greater evenness.
We adopted random forest (RF) models to identify which OTUs across the ITS, LSU and 16S datasets differentiated markets and microbial niches. This was accomplished with the “randomforest” function in the randomForest R package [41]. Random forest models were optimized by testing different numbers of trees to reach the lowest and stable out-of-bag (OOB) error estimate possible, and the best mtry value (number of features randomly sampled from the entire pool for each tree at each split) with the “tuneRF” function in randomForest R package. We then generated a matrix of 1—proximity matrix and used it to build a multidimensional scaling (MDS) ordination (analog to PCoA) using the “cmdscale” function in the stats package to graphically show the prediction obtained with the RF model. The importance of features to differentiate sample groups was assessed by calculating the mean decrease accuracy of the model when a particular OTU is removed from the community. Significance of RF models was assessed using 999 permutations (RF models were repeated 999 times) with the “rf.significance” function in the rfUtilities R package [42]. Additionally, a taxon-group association analysis was used to assess the degree of correlation and significance of each OTU for the target group in relation to other groups and the overlap with the most important features for classification obtained with the RF models. An association analysis was performed with the function multipatt with the “r.g” parameter in the “indicspecies” R package [43].
Two components of β-diversity were assessed: (i) community structure, defined as the difference in multivariate space between samples and sample groups, and (ii) community dispersion, defined as the multivariate variance within each sample group. To visualize β-diversity, we first standardized the data by rescaling each OTU count to 0–1. In this way, each OTU was independent from the others and all OTUs had the same scale and different slope, which removed differences in sequencing depth caused by differing library sizes between taxa [44]. Second, we performed principal coordinate analysis (PCoA) on the Bray–Curtis distance matrix with the function “ordinate” in phyloseq [38]. A permutational multivariate analysis of variance (PERMANOVA) was used to test differences among a priori defined sample groups [45] with the functions “adonis” in the vegan R package. We used the “calc_pairwise_permanovas” function in the mctoolsr R package [46] to identify which groups were significantly different from others (calculate pairwise post hoc comparisons between factor levels). We used the “betadisper” function in vegan [40] to assess the amount of multivariate dispersions [47] around centroids.
A Procrustes analysis [48] was carried out in combination with a randomization test [49] and the “protest” function in vegan [40] to investigate the concordance between the fungal and bacterial communities, and to test whether ITS and LSU showed similar structure. Concordance represents similarity in β-diversity between two communities across samples or sample groups and can indicate co-occurrence or similar responses of both communities to environmental factors.
Heatmap trees were generated to visualize taxon relative abundance in different tofu niches with the function “plot_heat” in the metacoder [50] R package. For the LSU heat tree, 11 non-fungal OTUs were retained because of their biological and sanitary importance. All graphs were plotted using ggplot2 [51] and ggpubr [52] R packages.
Significant differences between factors were tested with non-parametric Kruskal–Wallis, pairwise Wilcoxon, and ANOVA-like permutation tests and p-value corrected for multiple comparisons (Bonferroni method), unless specified otherwise.

3. Results

3.1. Generating OTUs from MiSeq Data

After the demultiplexing step, we obtained a total of 6,518,019 ITS (fungal) sequence reads, along with 16,408,779 for LSU (eukaryotic/fungal), and 3,168,370 for 16S (bacterial) DNA markers, respectively. The six negative controls included in the MiSeq run had 0.22%, 0.02%, and 0.007% of the demultiplexed reads in the ITS, LSU, and 16S datasets, respectively. After removing non-target organisms, unclassified and contaminants OTUs (Figure S2), we obtained a total of 169, 167 and 365 OTUs for the ITS, LSU, and 16S libraries, distributed in 72 total samples. The ITS otu_table had 3,362,770 total counts with an average of 46,705.1 (±23,018.4 standard deviation) sequence reads per sample, the LSU otu_table had 8,596,493 counts and 119,395.7 ± 75,525.0, and the 16S otu_table had 2,459,152 counts and 34,154.9 ± 17,513.9 sequence reads per sample. We report cumulative read number for each marker divided by market (Figure S3). Non-fungal Eukaryota organisms from the LSU dataset were represented by 16 OTUs in total (46,825 counts and 793.6 ±1678.3 sequence reads).

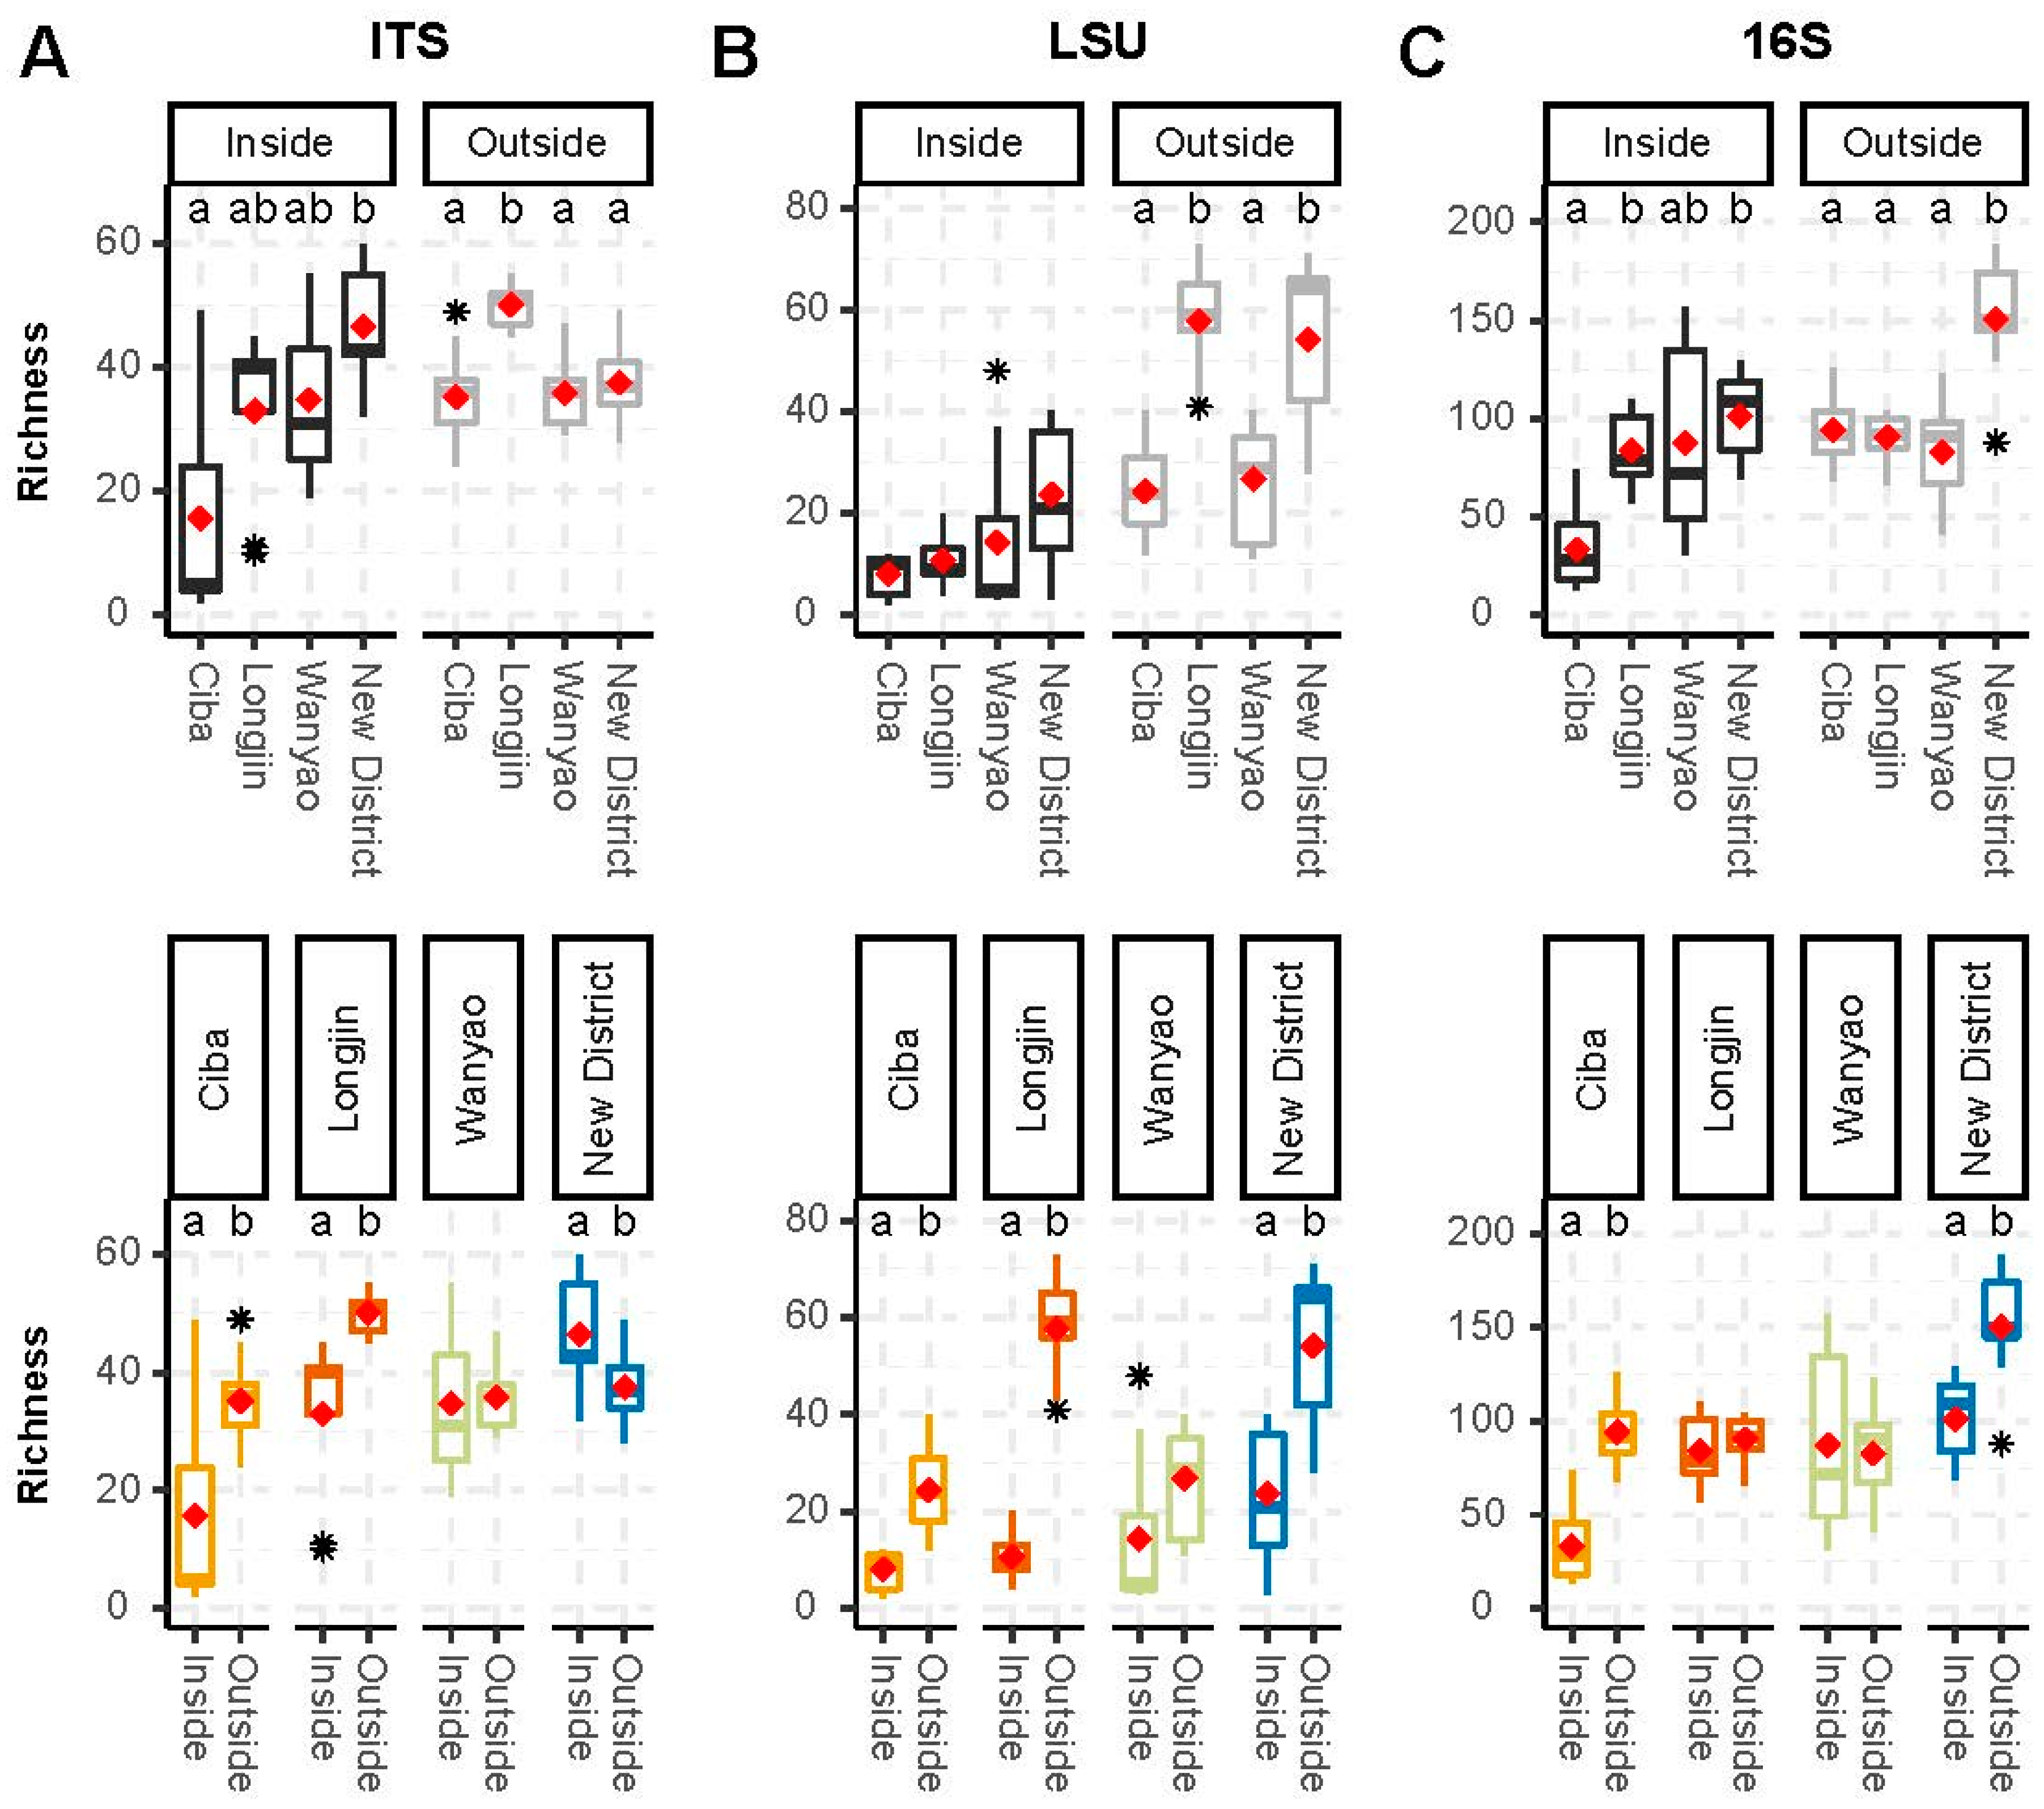
3.2. Alpha Diversity
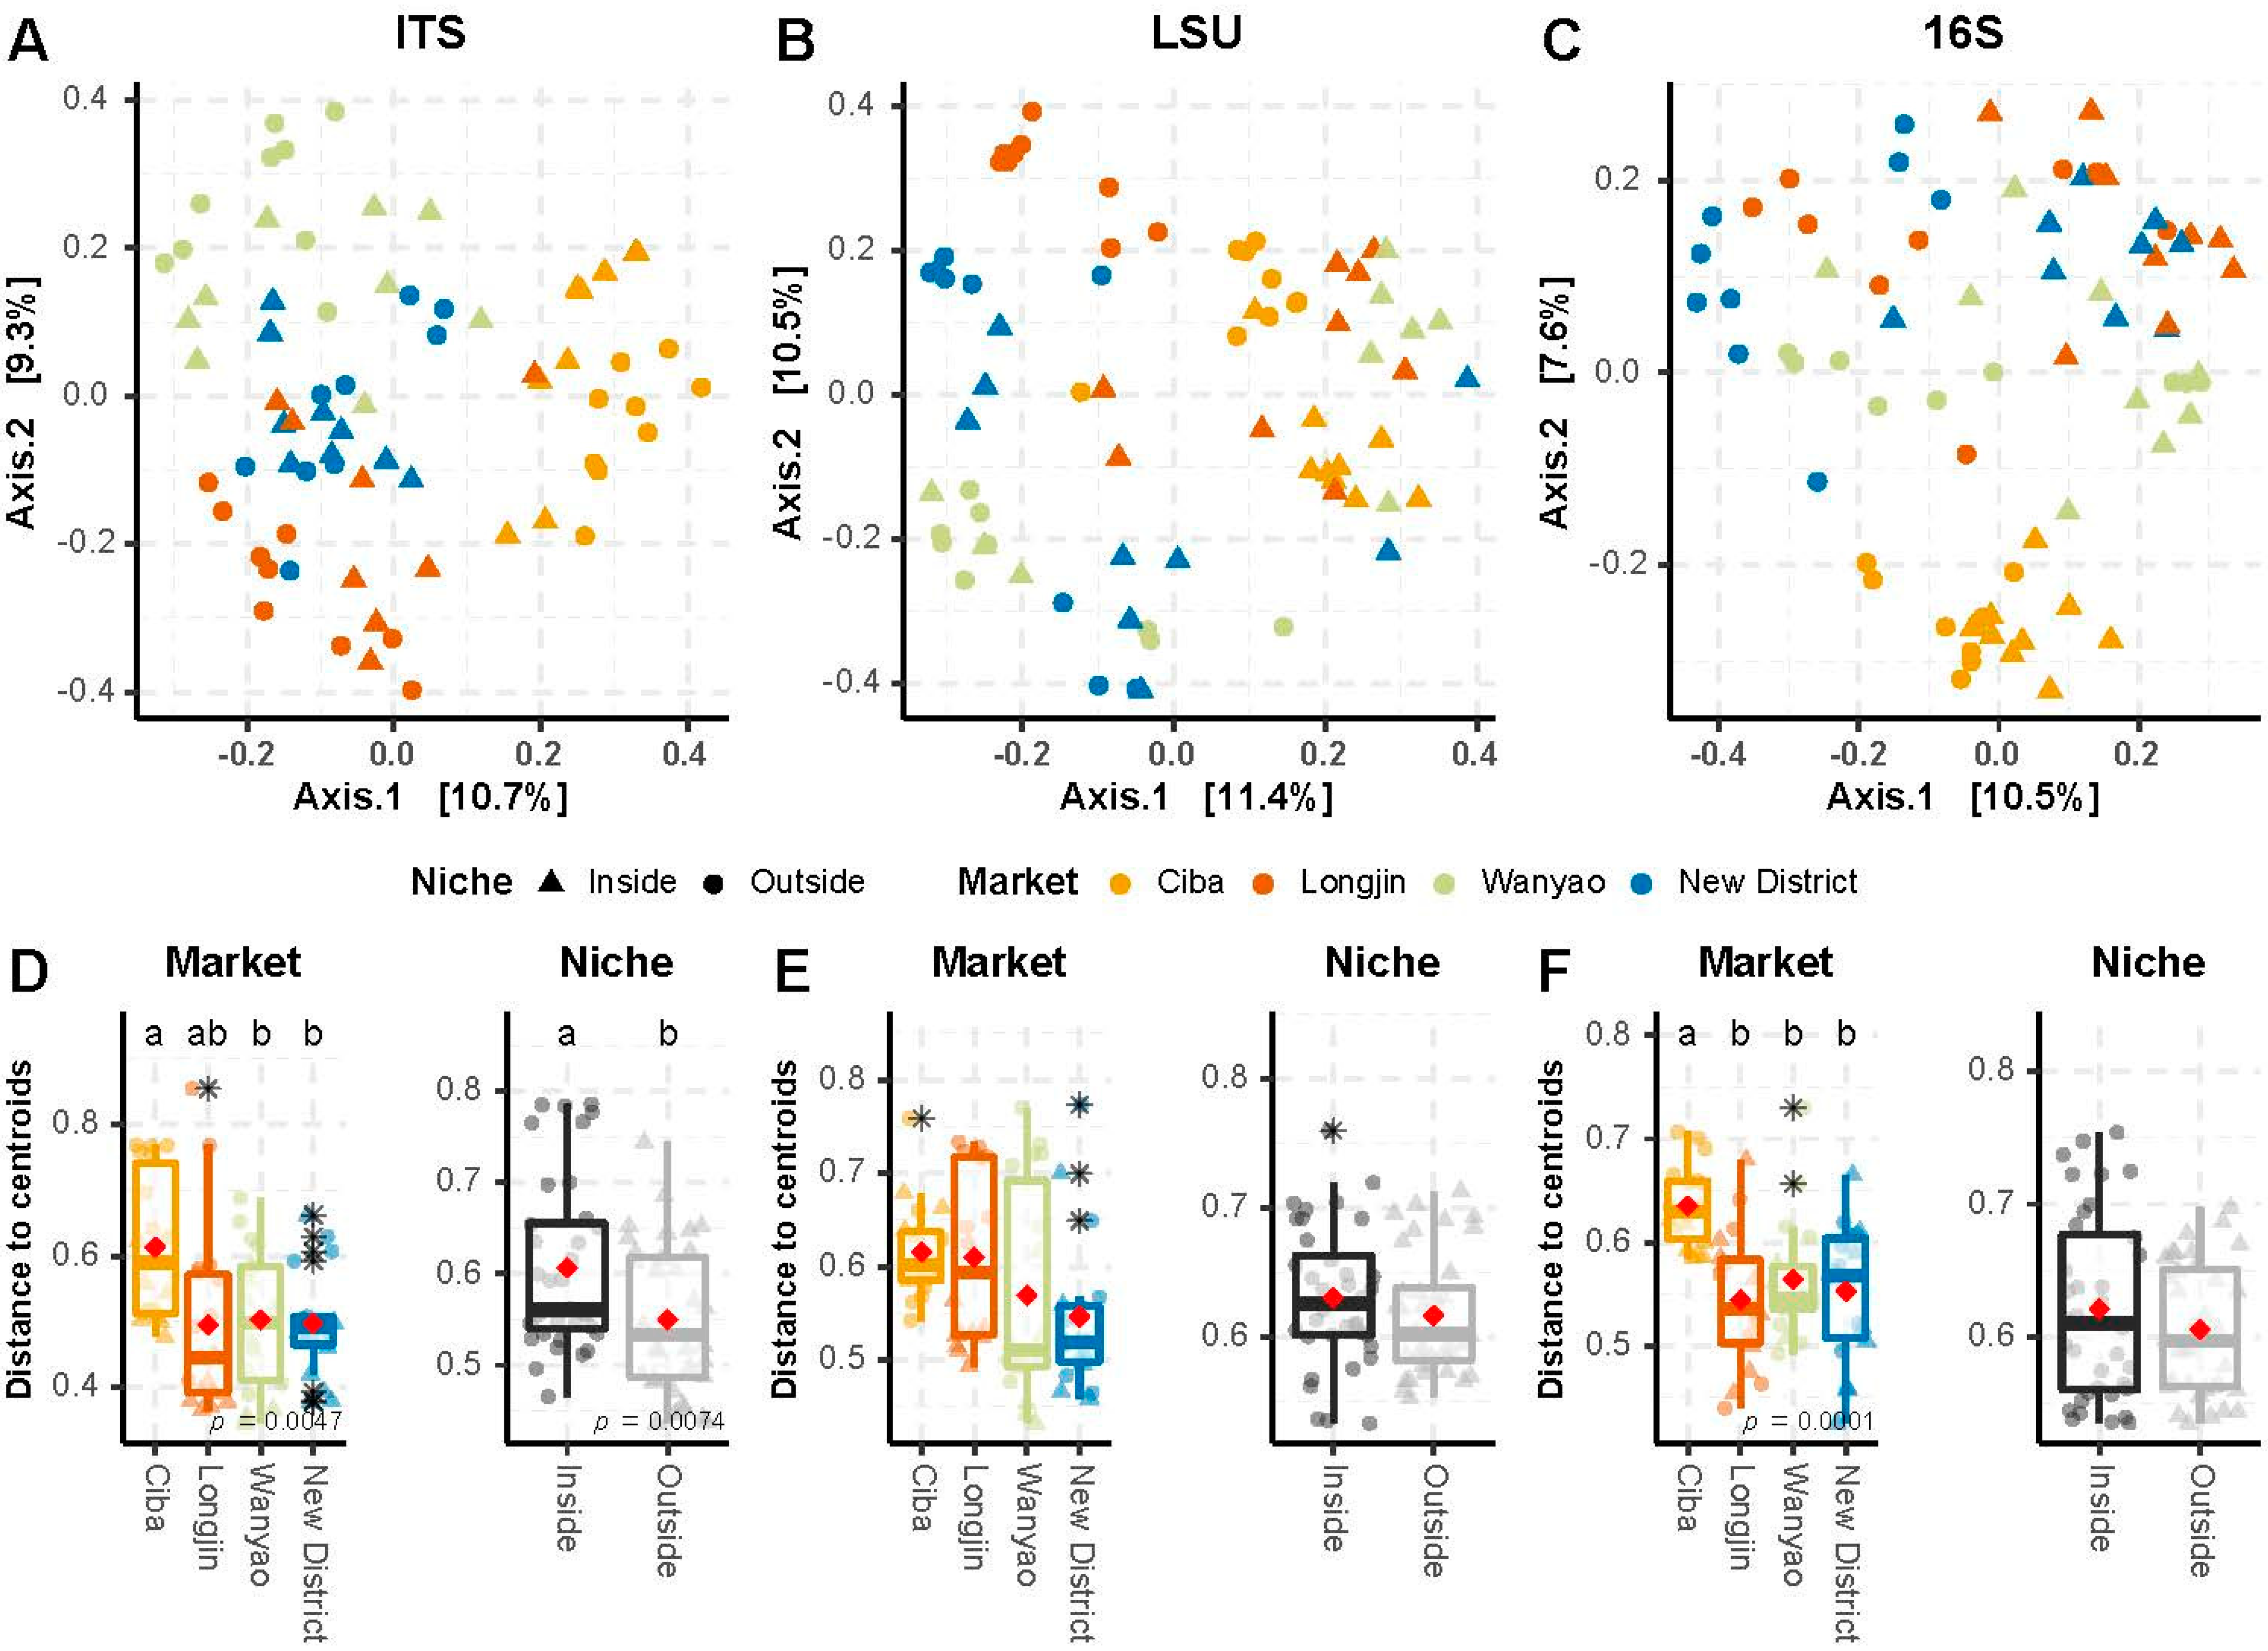
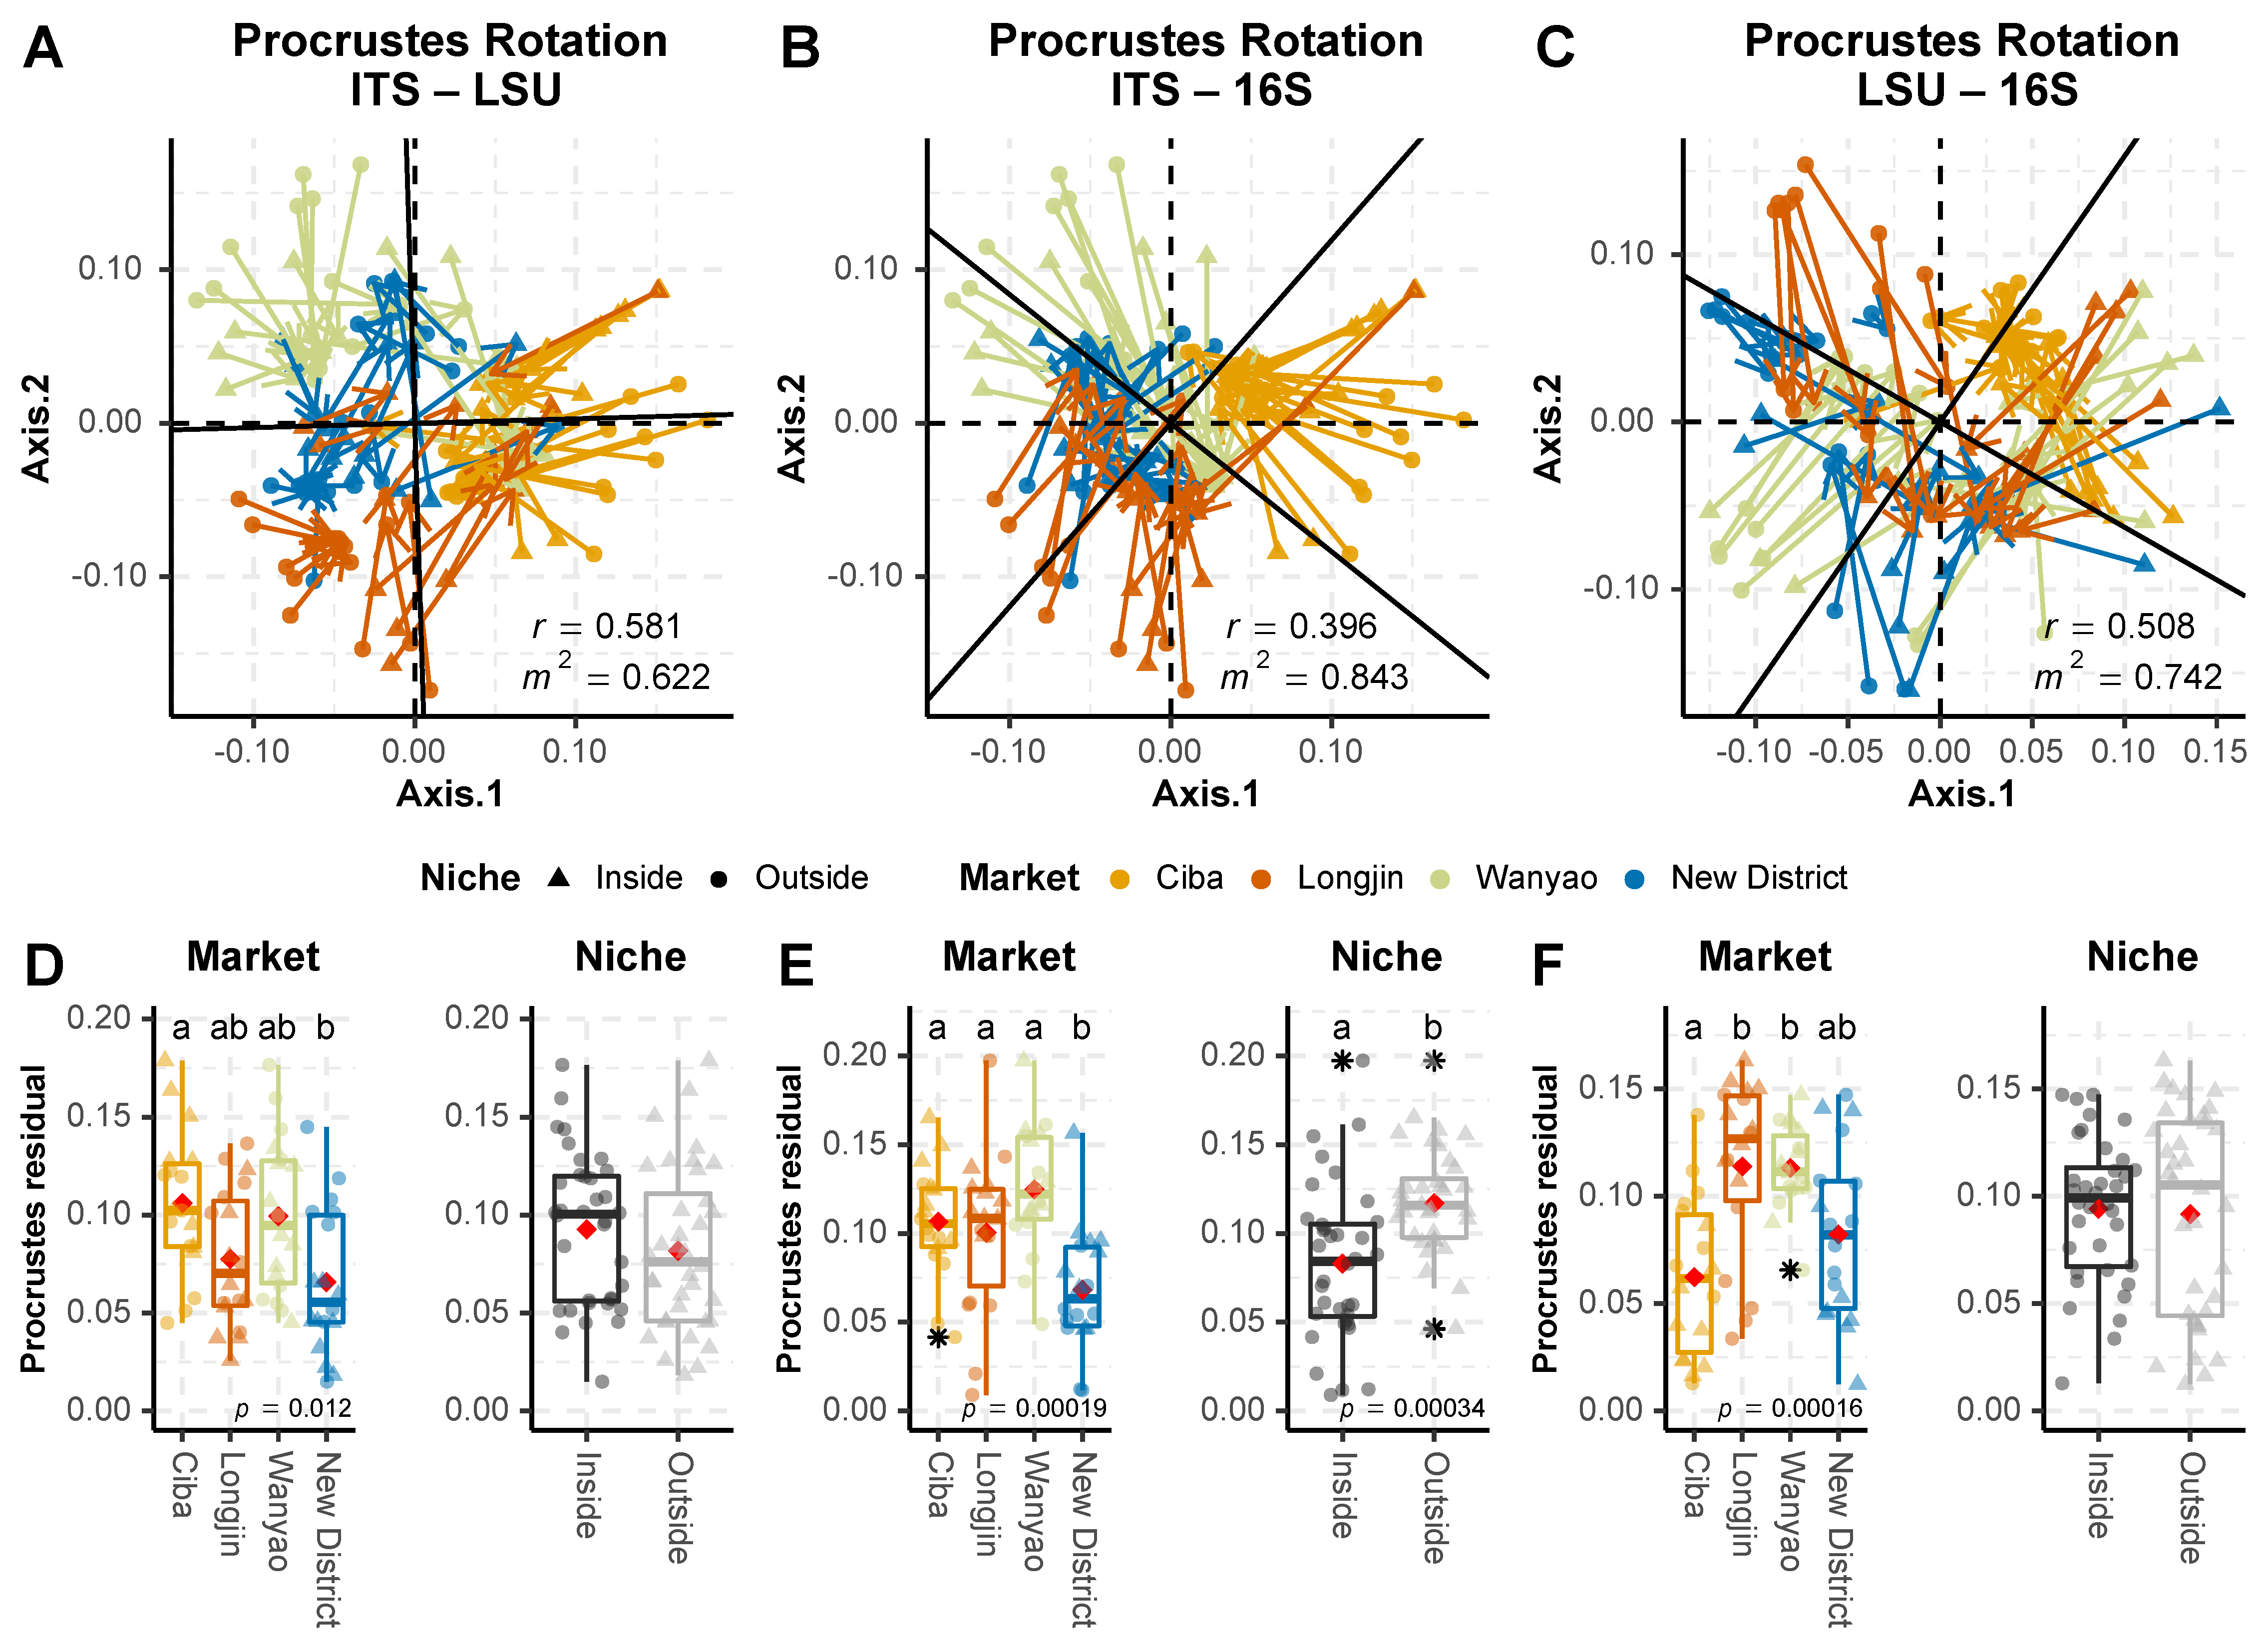
Rarefaction curves (Figure S4) showed that most of the samples were exhaustively sampled as OTU richness plateaued, but there were a few exceptions. In general, we detected significant differences in OTU richness across markets and niches (Figure 1). Across the different markets, the inside niche generally had significantly lower richness with respect to those on the outside niche with the exception of Wanyao (and also Longjin for 16S). The Ciba market had the lowest fungal (Figure 1A,B) and bacterial (Figure 1C) richness overall, while Mao tofu from Longjin and New District markets had significantly higher richness across all three DNA markers.
The Shannon equitability index (EH) showed no significant differences between markets in the inside niche for ITS, but the New District market had higher evenness than Ciba on the outside niche (Figure S5A). In contrast, the LSU (Figure S5B) and 16S (Figure S5C) data showed no significant differences between markets in the outside niche, but the Ciba and Lonjin samples showed higher evenness than other markets. No significant differences were present when comparing inside and outside niches within different markets (Figure S5A,B), with the exception of the New District market (Figure S5C) in the 16S dataset, where the inside niche had significantly higher evenness.

3.3. Beta Diversity

The PCoA ordinations show that samples from different markets cluster separately, primarily according to the market of origin, and secondarily according to the niche (Figure 2). The first axis, with the highest fraction of explained variance (10.5–11.4%), was clearly driven by differences in community structure between markets in the ITS data (Figure 2A) and niche in the LSU and 16S data (Figure 2B,C), although the pattern was less robust in the LSU data. Generally, samples from the Ciba market clustered closely together, and separate from those of other markets.
The results of PERMANOVA show that market, niche, and the interaction between these two factors are significant (p ≤ 0.01 after Bonferroni correction) factors in all three DNA marker datasets (Table 1). Market had the highest R2 in the ITS data (19.3%), followed by 16S (17.0%) and LSU (15.8%). The niche factor had an R2 of about 5% to 5.6% across markets, and the interaction factor varied from 7.9% to 10.2%, with the lowest value in the ITS dataset (Table 1). Group dispersion around centroids is another important layer of β-diversity, since it helps us to understand differences between samples within the same group. We found that samples from the Ciba market had higher and significantly different spread with respect to other markets in the ITS and 16S datasets (Figure 2D,F), while non-significant differences were found in the LSU dataset (Figure 2E). Again, samples from the inside niche were significantly more dispersed (less similar) than those of the outside niche in the ITS and LSU datasets (Figure 2D,E), but not in the 16S dataset (Figure 2F). Pairwise PERMANOVAs were not significant for market in any of the DNA markers, while inside and outside niches were significantly different in the LSU (R2 = 0.199, p-value = 0.042 after Bonferroni correction) and 16S (R2 = 0.192, p-value = 0.014 after Bonferroni correction) datasets.
Procrustes analysis found statistically significant (p = 0.0001, permutations = 9999) concordance (i.e., similarity in multivariate β-diversity or community structure) between the ITS and LSU (Figure 3A), ITS and 16S (Figure 3B), and LSU and 16S (Figure 3C) ordinations. ITS and LSU both target fungi and their ordinations had the highest correlation and the lowest m2, suggesting a high concordance between these markers. Although lower, ITS-16S and LSU-16S Procrustes rotations also showed high concordance, indicating co-occurrence or interdependence of these sets or organisms. Procrustes residual error plots (Figure 3D–F and Figure S6) allowed the identification of individual samples or sample groups that had the best concordance. For example, in the ITS-LSU Procrustes rotation, the New District samples had significantly lower mean residual (i.e., better fit) than those of Ciba, while Ciba was the market with the lowest mean residual in the 16S dataset. Interestingly, in the ITS-16S Procrustes rotation, the samples of the inside niche showed significantly lower residual than those of the outside niche (Figure 3F).

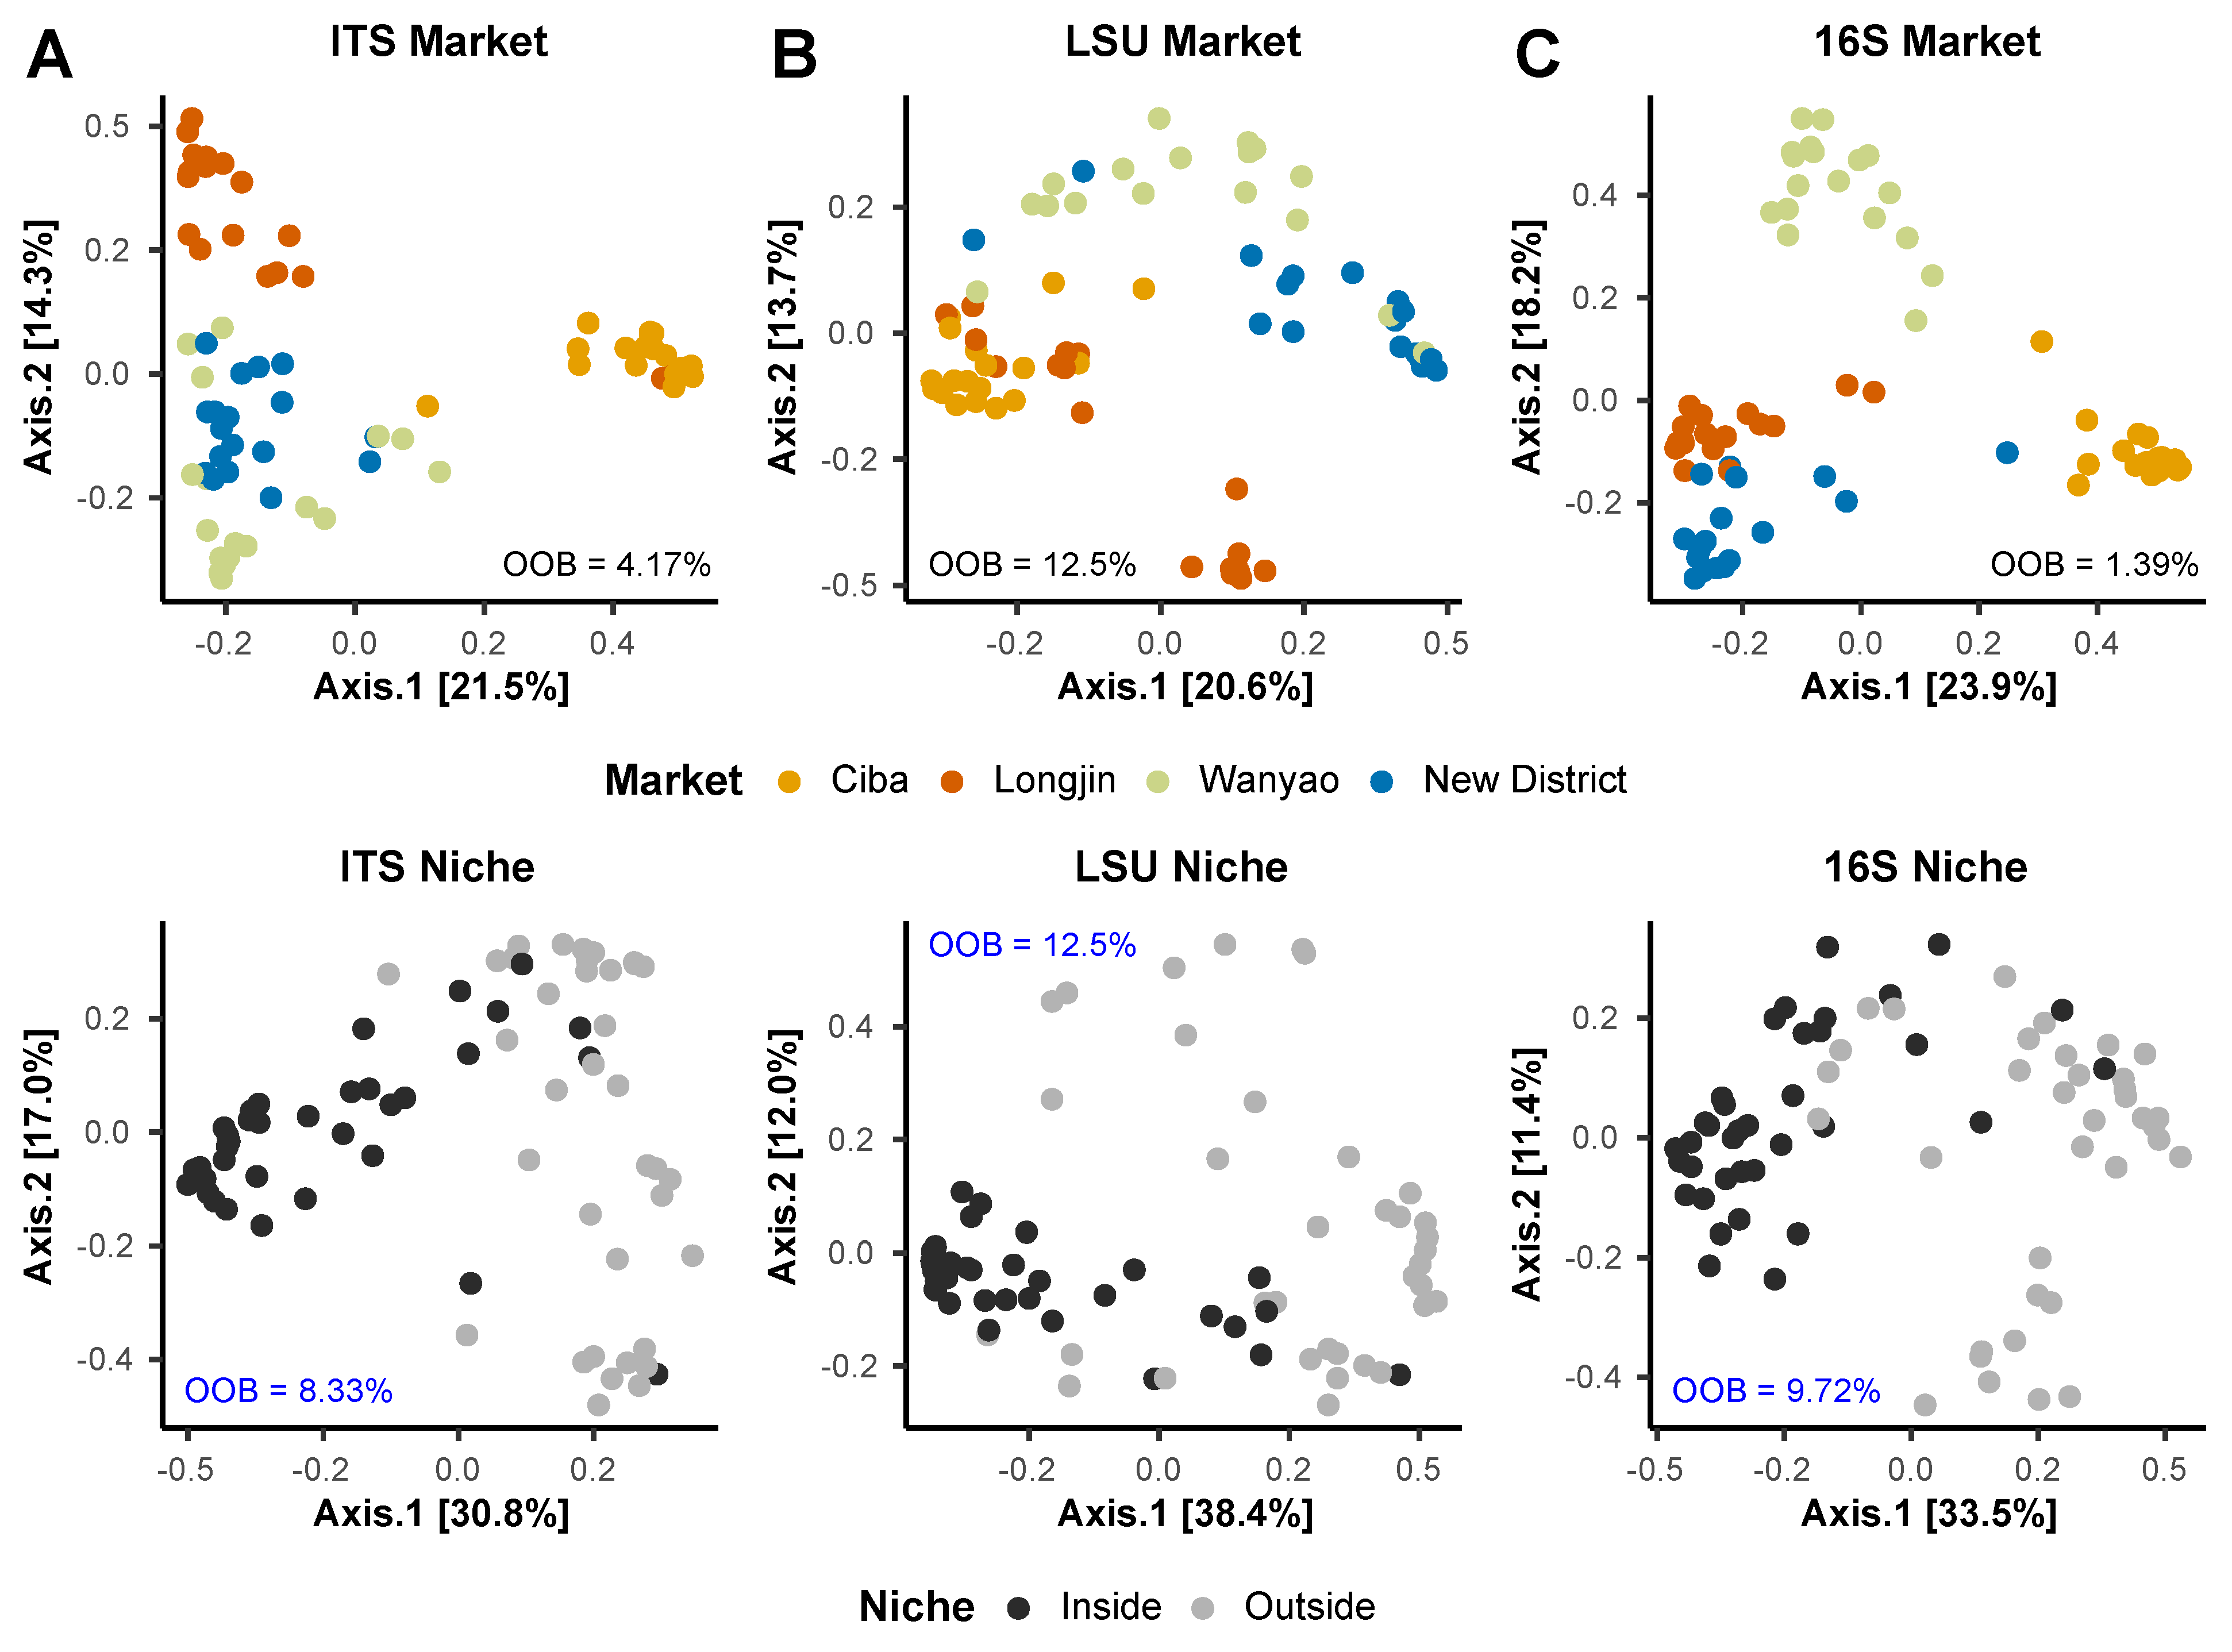
3.4. Random Forest Models and Indicator Taxa

We built very accurate random forest (RF) models to classify samples to a market or a tofu niche based on the high-throughput DNA marker data. A graphical visualization of model prediction accuracy was generated using a MDS ordination of the 1-proximity matrix and is reported in Figure 4. The out-of-bag (OOB) error rate estimate, whicht represents the amount of misclassification performed by the modes, was generally lower for market than niche. The best model was obtained for the 16S dataset for tofu prediction of the market of origin, where 9.61% of the predictions were correct (Figure 4C). Models obtained for the LSU dataset (Figure 4B) were not as good, but still 87.5% of the predictions were accurate. Models for the ITS data performed well, with 95.83% and 91.67% model accuracy for market and niche (Figure 4A).
We plotted the mean decrease accuracy of the top 20 OTUs for each RF model to identify how much the RF model accuracy decreases if we drop a variable from the model (Figure 5). Additionally, we included the r.g correlation value (with 0.05 after fdr correction) of each of the 20 OTUs to a sample group. The most important OTUs for classification in the ITS (Figure 5A) and LSU (Figure 5B) RF models differed. In particular, the most predictive OTUs in the ITS dataset markets were classified as Lachancea sp. (FOTU_12), Candida tropicalis (FOTU_14), Diutina catenulata (FOTU_7), and in the LSU dataset the most predictive OTUs were Trichosporon sp. (EOTU_4), Mucor sp. (EOTU_9), and Torulaspora sp. (EOTU_3). Similarly, the OTUs contributing the highest mean decrease accuracy for ITS were Candida sp. (FOTU_124), Geotrichum candidum (FOTU_163), and Clavispora lusitaniae (FOTU_43) and for LSU were Saturnispora sp. (EOTU_5), Debaryomyces sp. (EOTU_12), and Candida sp. (EOTU_2). Lactobacillus mucosae (BOTU_33), Acinetobacter sp. (BOTU_16), and Weissella sp. (BOTU_5) for the markets, and Acetobacter sp. (BOTU_15), Enterococcus sp. (BOTU_12), and Corynebacterium sp. (BOTU_125) for niches were the top OTUs in the 16S dataset (Figure 5C). Most of the highly important OTUs for classification were correlated to the Longjin or Ciba market in the ITS dataset, and to Wanyao, Longjin and New District in the LSU dataset.

3.5. Microbial Diversity and Composition

Fungal and bacterial taxonomic diversity as well as core taxa (defined as taxa shared across > 90% of the samples) of Mao tofu were visualized through heatmap trees (Figure 6) with an emphasis on the inside niche (i.e., colored nodes).
The ITS dataset showed a dominance of Ascomycota (78.9% relative abundance) with respect to Basidiomycota (16.7%) and Mucoromycota (3.4%). Geotrichum was the most abundant genus (17.2%), followed by Trichosporon (8.0%), Pichia (7.7%), Clavispora (6.3%), Dipodascus (5.7%), and Candida (5.6%). These genera were also core taxa in the overall dataset and present in >80% (n = 28–31) of the samples in the inside niche (Figure 6A) together with Apiotichum that showed high frequency (79.2%) but low abundance (1.4%). Geotrichum candidum (16.5) and Clavispora lusitaniae (5.4%), Lachancea sp. (2.3%) and Diutina catenulata (1.4%) were present with high frequency in Wanyao and New District but not so in Ciba and Lonjin, demonstrating their power for classifying these markets through the RF models (see Figure 4A). Mucor, which is expected to be present in hairy tofu, was in low abundance (1.1%) and low frequency (26.3% of the total samples and 30.6% of the inside samples). Other interesting taxa included plant and insect pathogens, such as Fusarium (0.6%), Epicoccum (0.3%), Alternaria, (1.6%) Metarhizium (0.3%), Entomortierella (0.7%), all with low frequencies (1.4–15.3%) across samples.
The LSU dataset (Figure 6B) was also composed mostly of Ascomycota (60.1%) and Basidiomycota (14.6%), but with a larger proportion of Mucoromycota (7.7%). Mucor was abundant (5.6%) and frequent (present in the 72.2% of the total samples, 58.3% in the inside samples, and 86.1% in the outside samples) with respect to the ITS data. Other core genera included Geotrichum (10.7%), Torulaspora (8.8%), Trichosporon (5.5%), Pichia (4.5%), and Candida (4.2%), with frequencies above 80% in the whole dataset and part of the top taxa for market classification in the RF models (See Figure 5B). Several plant pathogen- and insect-associated fungi were detected with LSU, including Cladosporium (0.4%), Wallemia (0.4%), Acremonium (0.2%), Fusarium (0.1%) and Cercospora sojina (0.1%), an actual soybean pathogen, all with low frequencies (1.4–4.2% overall), and mostly in the outside niche. One out in the Entomortierella (1.1%) genus and one in the Laboulbeniomycetes (0.1%) were also present in the outside niche and the New District market. Many non-fungal taxa of interest were detected in the LSU data. For example, soybean (Glycine max (0.2%)) and other Plantae (1.5%) and Protozoa (0.7%) were represented with 9.7% frequency, Metazoa (8.4%) were represented with 44% frequency, Nematoda (0.5%) were represented with 11.1% frequency, Platyhelminthes (6.3%) were represented with 29% frequency (44.4 in the outside niche), Chromista (1.5%) were represented with 15.3% frequency and Rhizaria (2.7%) were represented with 56.9% frequency (86.1% in the inside niche).
Proteobacteria (34.7%), Firmicutes (33.5%), Bacteroidetes (15.4%) and Actinobacteria (8.5%) were abundant in the 16S dataset (Figure 5C). Core genera included Lactobacillus (10.7%), present in all samples; Leuconostoc (3.2%), with 98.6% frequency; Dysgonomonas (3.1%), with 69% frequency overall and 25 samples in the inside niche; Acinetobacter (2.9%), with 93.1% frequency; Sphingobacterium (2.4%), with 87% frequency overall and present in 28 samples in the inside niche; and Flavobacterium (2.2%), with 61.1% frequency and in 23 samples in the inside niche. The bacterial OTUs with the highest mean decrease accuracy in the RF models to predict market and niche were Acinetobacter, Lactobacillus mucosae (0.1%), with 29.1% frequency; Weissella (1.4%), with 98.6% frequency; Enterococcus (0.9%), with 94.4% frequency; and Corynebacterium (0.9%), with 69.4% frequency overall. One out belonging to Legionella (0.01%) was detected in the outside niche of the New District market.

4. Discussion

Mao tofu is a fermented food that is deeply rooted in traditional Chinese cuisine and has been consumed for hundreds of years [53,54]. Yet, prior to this study, there were few data available on the microbial diversity associated with this traditional fermented food. Our high-throughput amplicon sequencing results from three rDNA loci demonstrate that the fungal and bacterial diversity of Mao tofu differs between markets, and between the inside and outside rind-like niche of Mao tofu samples.
Given that the common name ‘hairy tofu’ is in reference to the zygomyceteous fungal mycelium that grows from the external surface of this fermented food, we were particularly interested in the fungal community in this study. We found that Mao tofu is composed of Ascomycota (varying from 60.1–78.9%), Basidiomycota (14.6–16.7%) and Mucoromycota (3.4–7.7%) taxa. Perhaps unsurprisingly, fungal communities in Mao tofu were over-represented by yeasts. Mucor was particularly abundant in our tofu samples from the LSU dataset compared to the ITS, especially in the outside niche where most of the mycelium develops as a rind-like community. This was not surprising, since ITS is known to bias against basal fungal lineages that have longer ITS sequence lengths [22], and given that the ITS1F primer has multiple internal mismatches to nearly all taxa in the subphylum Mucoromycotina [55]. As shown previously, Mucor impacts the quality of the final product through proteolytic processes and release of nutrients, impacting the texture and flavor of Mao tofu [13,56].
Yeasts belonging to Tremellomycetes and Saccharomycetes included most of the core members of Mao tofu. The dimorphic species Geotrichum candidum was the most abundant OTU (10.7–16.5%), and was shared across almost all samples in the ITS dataset. This yeast is present in soil and decaying plant debris, but has also been identified as one of the main components of the microflora of soft cheeses such as camembert and semi-fresh goat’s and ewe’s milk cheese [57,58]. Comparative genomic studies of yeasts in the Saccharomycetales have shown that G. candidum has retained in its genome a set of cellulases that can be used to break down cellulose in the environment. This may explain the ecological ability of G. candidum to grow on cellulose-rich plant-derived material such as fermented soybean curds [13,59]. Other yeasts, such as Clavispora, Candida, Dipodascus, Pichia, Torulaspora, Diutina, and Trichosporon, were also abundant and frequent both inside and outside Mao tofu. Most of these taxa are also components of the cheese microbiome [60], as well as other fermented tofu products including stinky tofu [12] and Tempeh [61]. Interestingly, some of the non-Saccharomyces taxa detected have been proposed as potential mixed starters given their beneficial activities for the production of fermented foods and beverages. For example, they increase acidity and improve the primary and secondary aroma of wines [62,63,64], and can influence foam stability and flavor in beers [65]. Others have been considered to be contaminants of dairy products [66,67]. Yeasts are known to have shorter ITS rDNA amplicon length, while Mucoromycota generally have longer than average ITS rDNA lengths [22]. Given the bias of Illumina sequencing, it is possible that yeasts are over-represented and Mucoromycota are under-represented in ITS datasets. LSU datasets are expected to show less bias to amplicon length.
Bacterial communities associated with Mao tofu were dominated by Proteobacteria, Firmicutes, and Bacteroidota (83.6% total). Within these groups, lactic acid bacteria belonging to Lactobacillus and Leuconostoc were present in almost all samples regardless of the niche. These bacteria are generally common in fermented foods and are already reported for soybean-based fermented products [59,68]. Although Lactobacillus, Enterococcus and Bifidobacterium are considered probiotic microorganisms due to their antimicrobial and antioxidant properties, radical scavenging and peptide production activities [59], there is still debate as to their effects on gastrointestinal health and disease in humans [61].
Next-generation sequencing techniques are known to be sensitive to DNA traces and allow the detection of extracellular DNA from dead microorganisms that persist in soil for weeks to years [69]. Still, we found it noteworthy that we detected potential fungal pathogens of soybean (e.g., Epicoccum, Cercospora, Acremonium, Fusarium) and insects (e.g., Entomortierella, Metarhizium, Laboulbeniomycetes) in Mao tofu samples. For example, Cercospora sojina, the agent of the Frogeye leaf spot disease, often overwinters in soybean residue and seeds, while Metarhizium anisopliae is an entomopathogen that has a wide host range [70,71,72]. These fungi may have been in the soybean material used, or present during the production or sale of Mao tofu. We also detected flatworms (i.e., Platyhelminthes), roundworms (i.e., Nematoda) and potentially harmful bacteria (i.e., Legionella), mostly in the outside niche.
In terms of broader microbial diversity patterns, we found that the internal niche had significantly lower richness than the outside rind-like niche. β-diversity was primarily driven by the geographic location (i.e., the market) in all the selected DNA markers. The market component explained a higher variance (from 15.8% to 19.3%) in the data with respect to the niche (from 5.0% to 5.7%). However, these two factors are linked as shown by the important variance explained by the market:niche interaction (from 7.9% to 10.2%), depriving us of the ability to assess their importance as main factors. Site-specific variation can be explained by the existence of market-specific microbiomes, similar to that which has been shown for cheese-making plants [73], or by general environmental variations due to geographic distance, as shown for bacterial communities in fermented meat products [74]. Yet, cheeses made in geographically distant parts of the world can have strikingly similar rind communities if similar environmental conditions are maintained [75].
In the Mao tofu blocks sampled, we found a lower number of reads in the samples from the inside niche compared to the outside, reflecting a lower amount of microbial DNA template, rather than biased sequencing results. This pattern was consistent across all three of the investigated molecular markers. Samples from the internal niche had a significantly better fit in the Procrustes rotation, meaning that both bacteria and fungi were exposed to similar environmental conditions in the internal niche, regardless of the market, and represent the core microbiome of Mao tofu. The internal niche may be a more confined environment, less subjected to random changes and allochthonous inputs. The microbial communities of the inside niches are likely linked to the production processes and microbes living on tofu, tools and surfaces [73]. Microbes may be adapted, selected, and possibly domesticated to the different tofu niches, similar to that which has been demonstrated in the fermentation of cheese and wine [76,77].
Microbiome data have been used to predict the geographical origin of grapes [78], to distinguish soybean under organic, no-till, and conventional management [79], and even in the identification of human body niches and disease states [80]. Our random forest models showed high accuracy in the classification of samples belonging to different markets (1.39–4.17% OOB error estimate) and niches (8.33–12.5%), demonstrating that microbiomes have utility for determining provincial origin of fermented foods. Several taxa that showed the highest mean decrease in accuracy (top important OTUs for classification) were also group indicators (OTUs highly correlated with samples groups).

5. Conclusions

In this study, we found that Mao tofu diversity of both fungal and bacterial communities varied across geographical gradients and niche, with strong and significant interaction between the two factors. It is noteworthy that several taxa abundant in Mao tofu overlap with those of other fermented foods, including cheese. ITS, LSU and 16S OTUs and machine learning models were used to accurately predict both the market of origin and whether samples were taken from the inside or the outside of the tofu block. The presence of diverse non-target eukaryotes further illuminates the complex microbiology of fermented foods. Similar to the cheese microbiome, we suspect that most fungi and bacteria comprising Mao tofu are culturable. Culture-based studies, coupled with -omics based technologies, can further inform the microbial ecology of fermented tofu and specific microbial interactions and functions. Additional research efforts may involve the characterization of the culturable communities within Mao tofu together with a physiochemical analysis of biochemical traits associated with Mao tofu in different markets and production systems.

Supplementary Materials

The following supporting information can be downloaded at: https://www.mdpi.com/article/10.3390/d14030207/s1, Figures S1–S6 (File S1), R scripts (File S2), ITS, LSU, and 16S otu_table.txt files with taxonomic classifications (Files S3, S4 and S5), metadata file (File S6), ITS, LSU, and 16S OTU representative sequences (Files S7, S8, and S9), are also provided as supporting information and available at https://github.com/Gian77/Scientific-Papers-R-Code.

Author Contributions

G.M.N.B.: Methodology, Software, Formal analysis, Validation, Data curation, Supervision, Writing—Original draft preparation, Writing—Reviewing and Editing; X.W.: Methodology, Software, Data curation, Resources, Writing—Original draft preparation, Investigation, Writing—Reviewing and Editing; L.Z.: Sampling, Photography, Wet lab; G.B.: Conceptualization, Methodology, Validation, Supervision, Project administration, Funding acquisition, Investigation, Writing—Original draft preparation, Writing—Reviewing and Editing; F.Y.: Conceptualization, Supervision, Project administration, Funding acquisition, Reviewing and Editing. All authors have read and agreed to the published version of the manuscript.

Funding

This research was funded by United States National Science Foundation DEB 1737898 and United States Department of Agriculture MICL02416 to GB, and Chinese Academy of Sciences science and technology supported poverty alleviation project KFJ-FP-20190 awarded to Yu Fuqiang. Xinxin Wang was supported by the China Scholarship Council.

Institutional Review Board Statement

Not applicable.

Data Availability Statement

Raw sequence reads have been deposited to the Sequence Read Archive [81] with links to BioProject accession number PRJNA661071 in the NCBI BioProject database (https://www.ncbi.nlm.nih.gov/bioproject/).

Acknowledgments

We are grateful to Hong Ling for part of the sample collecting.

Conflicts of Interest

The authors declare no conflict of interest.

References

  1. Jayachandran, M.; Xu, B. An Insight into the Health Benefits of Fermented Soy Products. Food Chem. 2019, 271, 362–371. [Google Scholar] [CrossRef] [PubMed]
  2. Jang, C.H.; Park, C.S.; Lim, J.K.; Kim, J.H.; Kwon, D.Y.; Kim, Y.S. Metabolism of Isoflavone Derivatives during Manufacturing of Traditional Meju and Doenjang. Food Sci. Biotechnol. 2008, 17, 442–445. [Google Scholar]
  3. Xu, L.; Cai, W.X.; Xu, B.J. A Systematic Assesment on Vitamins (B2, B12) and GABA Profiles in Fermented Soy Products Marketed in China. J. Food Processing Preserv. 2017, 41, e13126. [Google Scholar] [CrossRef]
  4. Kim, D.-J.; Jeong, Y.-J.; Kwon, J.-H.; Moon, K.-D.; Kim, H.-J.; Jeon, S.-M.; Lee, M.-K.; Park, Y.B.; Choi, M.-S. Beneficial Effect of Chungkukjang on Regulating Blood Glucose and Pancreatic Beta-Cell Functions in C75BL/KsJ-Db/db Mice. J. Med. Food 2008, 11, 215–223. [Google Scholar] [CrossRef]
  5. Yoon, G.-A.; Park, S. Antioxidant Action of Soy Isoflavones on Oxidative Stress and Antioxidant Enzyme Activities in Exercised Rats. Nutr. Res. Pract. 2014, 8, 618–624. [Google Scholar] [CrossRef] [PubMed] [Green Version]
  6. Pisani, P.; Parkin, D.M.; Bray, F.; Ferlay, J. Estimates of the Worldwide Mortality from 25 Cancers in 1990. Int. J. Cancer 1999, 83, 18–29. [Google Scholar] [CrossRef]
  7. Zhu, Y.; Wang, A.; Liu, M.C.; Zwart, A.; Lee, R.Y.; Gallagher, A.; Wang, Y.; Miller, W.R.; Dixon, J.M.; Clarke, R. Estrogen Receptor Alpha Positive Breast Tumors and Breast Cancer Cell Lines Share Similarities in Their Transcriptome Data Structures. Int. J. Oncol. 2006, 29, 1581–1589. [Google Scholar] [CrossRef] [PubMed] [Green Version]
  8. Lee, S.-M.; Kim, Y.; Choi, H.J.; Choi, J.; Yi, Y.; Yoon, S. Soy Milk Suppresses Cholesterol-Induced Inflammatory Gene Expression and Improves the Fatty Acid Profile in the Skin of SD Rats. Biochem. Biophys. Res. Commun. 2013, 430, 202–207. [Google Scholar] [CrossRef] [PubMed]
  9. Ren, N.N.; Chen, H.J.; Li, Y.; Mcgowan, G.W.; Lin, Y.G. A clinical study on the effect of nattokinase on carotid artery atherosclerosis and hyperlipidaemia. Zhonghua Yi Xue Za Zhi 2017, 97, 2038–2042. [Google Scholar] [PubMed]
  10. Tsai, J.S.; Lin, Y.S.; Pan, B.S.; Chen, T.J. Antihypertensive Peptides and γ-Aminobutyric Acid from Prozyme 6 Facilitated Lactic Acid Bacteria Fermentation of Soymilk. Process Biochem. 2006, 41, 1282–1288. [Google Scholar] [CrossRef]
  11. Kang, S.J.; Seo, J.Y.; Cho, K.M.; Lee, C.K.; Kim, J.H.; Kim, J.-S. Antioxidant and Neuroprotective Effects of Doenjang Prepared with Rhizopus, Pichia, and Bacillus. Prev. Nutr. Food Sci. 2016, 21, 221–226. [Google Scholar] [CrossRef]
  12. Gu, J.; Liu, T.; Sadiq, F.A.; Yang, H.; Yuan, L.; Zhang, G.; He, G. Biogenic Amines Content and Assessment of Bacterial and Fungal Diversity in Stinky Tofu—A Traditional Fermented Soy Curd. LWT 2018, 88, 26–34. [Google Scholar] [CrossRef]
  13. Zhao, X.; Zheng, X. A Primary Study on Texture Modification and Proteolysis of Mao-Tofu during Fermentation. Afr. J. Biotechnol. 2009, 8, 2294–2300. [Google Scholar]
  14. Liang, H.; Deng, L.; Lin, H. Distribution, Functions and Applications of Lactic Acid Bacteria in Traditional Fermented Soybean Foods. Food Sci. 2013, 34, 381–385. [Google Scholar]
  15. Chao, S.-H.; Tomii, Y.; Sasamoto, M.; Fujimoto, J.; Tsai, Y.-C.; Watanabe, K. Lactobacillus Capillatus Sp. Nov., a Motile Bacterium Isolated from Stinky Tofu Brine. Int. J. Syst. Evol. Microbiol. 2008, 58, 2555–2559. [Google Scholar] [CrossRef] [PubMed]
  16. Yu, Z.; Hu, H.; Li, L. Analysis of Microbial Flora in the Steep Juice of Zhejiang Shaoxing Stinky Tofu. Sci. Technol. Food Ind. 2012, 33, 183–187. [Google Scholar]
  17. Chao, S.-H.; Tomii, Y.; Watanabe, K.; Tsai, Y.-C. Diversity of Lactic Acid Bacteria in Fermented Brines Used to Make Stinky Tofu. Int. J. Food Microbiol. 2008, 123, 134–141. [Google Scholar] [CrossRef] [PubMed]
  18. Sun, G.P.; Zhang, X.J.; Wang, Y.; Wang, D.; Xie, J.L. The Investigation of Bacteria Diversity in Stinky Tofu Brine. Xiandai Shipin Keji 2010, 26, 1087–1091. [Google Scholar]
  19. Benucci, G.M.N.; Longley, R.; Zhang, P.; Zhao, Q.; Bonito, G.; Yu, F. Microbial Communities Associated with the Black Morel Cultivated in Greenhouses. PeerJ 2019, 7, e7744. [Google Scholar] [CrossRef] [PubMed] [Green Version]
  20. White, T.J.; Bruns, T.; Lee, S.; Taylor, J. Amplification and direct sequencing of fungal ribosomal rna genes for phylogenetics. In PCR Protocols; Elsevier: Amsterdam, The Netherlands, 1990; pp. 315–322. [Google Scholar]
  21. Gardes, M.; Bruns, T.D. ITS Primers with Enhanced Specificity for Basidiomycetes--Application to the Identification of Mycorrhizae and Rusts. Mol. Ecol. 1993, 2, 113–118. [Google Scholar] [CrossRef]
  22. Reynolds, N.K.; Benny, G.L.; Ho, H.-M.; Hou, Y.-H.; Crous, P.W.; Smith, M.E. Phylogenetic and Morphological Analyses of the Mycoparasitic Genus Piptocephalis. Mycologia 2019, 111, 54–68. [Google Scholar] [CrossRef]
  23. Hopple, J.S.; Vilgalys, R. Phylogenetic Relationships among Coprinoid Taxa and Allies Based on Data from Restriction Site Mapping of Nuclear rDNA. Mycologia 1994, 86, 96–107. [Google Scholar] [CrossRef]
  24. Caporaso, J.G.; Lauber, C.L.; Walters, W.A.; Berg-Lyons, D.; Lozupone, C.A.; Turnbaugh, P.J.; Fierer, N.; Knight, R. Global Patterns of 16S rRNA Diversity at a Depth of Millions of Sequences per Sample. Proc. Natl. Acad. Sci. USA 2010, 108 (Suppl. 1), 4516–4522. [Google Scholar] [CrossRef] [PubMed] [Green Version]
  25. Longley, R.; Benucci, G.M.N.; Mills, G.; Bonito, G. Fungal and Bacterial Community Dynamics in Substrates during the Cultivation of Morels (Morchella Rufobrunnea) Indoors. FEMS Microbiol. Lett. 2019, 366, fnz215. [Google Scholar] [CrossRef] [PubMed]
  26. Noel, Z.A.; Chang, H.-X.; Chilvers, M.I. Variation in Soybean Rhizosphere Oomycete Communities from Michigan Fields with Contrasting Disease Pressures. Appl. Soil Ecol. 2020, 150, 103435. [Google Scholar] [CrossRef]
  27. Caporaso, G.J.; Kuczynski, J.; Stombaugh, J.; Bittinger, K.; Bushman, F.D.; Costello, E.K.; Fierer, N.; Peña, A.G.; Goodrich, J.K.; Gordon, J.I.; et al. QIIME Allows Analysis of High-Throughput Community Sequencing Data. Nat. Methods 2010, 7, 335–336. [Google Scholar] [CrossRef] [PubMed] [Green Version]
  28. Martin, M. Cutadapt Removes Adapter Sequences from High-Throughput Sequencing Reads. EMBnet J. 2011, 17, 10. [Google Scholar] [CrossRef]
  29. Benucci, G.M.N.; Rennick, B.; Bonito, G. Patient Propagules: Do Soil Archives Preserve the Legacy of Fungal and Prokaryotic Communities? PLoS ONE 2020, 15, e0237368. [Google Scholar] [CrossRef] [PubMed]
  30. Edgar, R.C.; Flyvbjerg, H. Error Filtering, Pair Assembly and Error Correction for next-Generation Sequencing Reads. Bioinformatics 2015, 31, 3476–3482. [Google Scholar] [CrossRef] [Green Version]
  31. Edgar, R. UCHIME2: Improved Chimera Prediction for Amplicon Sequencing. BioRxiv 2016, 074252. [Google Scholar] [CrossRef] [Green Version]
  32. Edgar, R.C. UPARSE: Highly Accurate OTU Sequences from Microbial Amplicon Reads. Nat. Methods 2013, 10, 996–998. [Google Scholar] [CrossRef] [PubMed]
  33. Wang, Q.; Garrity, G.M.; Tiedje, J.M.; Cole, J.R. Naive Bayesian Classifier for Rapid Assignment of rRNA Sequences into the New Bacterial Taxonomy. Appl. Environ. Microbiol. 2007, 73, 5261–5267. [Google Scholar] [CrossRef] [PubMed] [Green Version]
  34. Gdanetz, K.; Benucci, G.M.N.; Vande Pol, N.; Bonito, G. CONSTAX: A Tool for Improved Taxonomic Resolution of Environmental Fungal ITS Sequences. BMC Bioinform. 2017, 18, 538. [Google Scholar] [CrossRef] [PubMed] [Green Version]
  35. Abarenkov, K.; Zirk, A.; Piirmann, T.; Pöhönen, R.; Ivanov, F.; Nilsson, R.H.; Kõljalg, U. UNITE General FASTA Release for Eukaryotes Version 04.02.2020; UNITE Community: London, UK, 2020. [Google Scholar] [CrossRef]
  36. Clark, K.; Karsch-Mizrachi, I.; Lipman, D.J.; Ostell, J.; Sayers, E.W. GenBank. Nucleic Acids Res. 2016, 44, D67–D72. [Google Scholar] [CrossRef] [PubMed] [Green Version]
  37. R Core Team. R: A Language and Environment for Statistical Computing; R Foundation for Statistical Computing: Vienna, Austria; Available online: https://www.R-project.org/ (accessed on 12 May 2020).
  38. McMurdie, P.J.; Holmes, S. Waste Not, Want Not: Why Rarefying Microbiome Data Is Inadmissible. PLoS Comput. Biol. 2014, 10, e1003531. [Google Scholar] [CrossRef] [PubMed] [Green Version]
  39. Davis, N.M.; Proctor, D.M.; Holmes, S.P.; Relman, D.A.; Callahan, B.J. Simple Statistical Identification and Removal of Contaminant Sequences in Marker-Gene and Metagenomics Data. Microbiome 2018, 6, 226. [Google Scholar] [CrossRef] [Green Version]
  40. Oksanen, J.; Blanchet, F.G.; Friendly, M.; Kindt, R.; Legendre, P.; McGlinn, D.; Minchin, P.R.; O’Hara, R.B.; Simpson, G.L.; Solymos, P.; et al. Vegan: Community Ecology Package, R Package Version 2.5-6. 2019. Available online: https://rdrr.io/cran/vegan/ (accessed on 12 May 2020).
  41. Liaw, A.; Wiener, M. Classification and Regression by randomForest. R News 2002, 2, 18–22. [Google Scholar]
  42. Murphy, M.A.; Evans, J.S.; Storfer, A. Quantifying Bufo Boreas Connectivity in Yellowstone National Park with Landscape Genetics. Ecology 2010, 91, 252–261. [Google Scholar] [CrossRef] [Green Version]
  43. De Cáceres, M.; Legendre, P.; Moretti, M. Improving Indicator Species Analysis by Combining Groups of Sites. Oikos 2010, 119, 1674–1684. [Google Scholar] [CrossRef]
  44. Weiss, S.; Xu, Z.Z.; Peddada, S.; Amir, A.; Bittinger, K.; Gonzalez, A.; Lozupone, C.; Zaneveld, J.R.; Vázquez-Baeza, Y.; Birmingham, A.; et al. Normalization and Microbial Differential Abundance Strategies Depend upon Data Characteristics. Microbiome 2017, 5, 27. [Google Scholar] [CrossRef] [Green Version]
  45. Anderson, M.J. A New Method for Non-Parametric Multivariate Analysis of Variance. Austral Ecol. 2001, 26, 32–46. [Google Scholar]
  46. Leff, W.J. Mctoolsr: Microbial Community Data Analysis Tools. R package Version 0.1.1.2. Available online: https://github.com/leffj/mctoolsr (accessed on 26 May 2020). [CrossRef]
  47. Anderson, M.J.; Ellingsen, K.E.; McArdle, B.H. Multivariate Dispersion as a Measure of Beta Diversity. Ecol. Lett. 2006, 9, 683–693. [Google Scholar] [CrossRef] [PubMed]
  48. Gower, J.C. Generalized Procrustes Analysis. Psychometrika 1975, 40, 33–51. [Google Scholar] [CrossRef]
  49. Jackson, D.A. PROTEST: A PROcrustean Randomization TEST of Community Environment Concordance. Écoscience 1995, 2, 297–303. [Google Scholar] [CrossRef]
  50. Foster, Z.S.L.; Sharpton, T.J.; Grünwald, N.J. Metacoder: An R Package for Visualization and Manipulation of Community Taxonomic Diversity Data. PLoS Comput. Biol. 2017, 13, e1005404. [Google Scholar] [CrossRef] [PubMed] [Green Version]
  51. Wickham, H. Ggplot2: Elegant Graphics for Data Analysis; Springer: New York, NY, USA, 2016; Available online: https://ggplot2.tidyverse.org (accessed on 12 May 2020).
  52. Kassambara, A. Ggpubr: “Ggplot2” Based Publication Ready Plots. R Package Version 0.4.0. Available online: https://CRAN.R-project.org/package=ggpubr (accessed on 25 May 2020).
  53. Yan, S.; Liu, H.; Zhang, J.; Tong, Q. Lactobacillus Delbrueckii Is the Key Functional Microorganism of Natural Fermented Tofu Sour Water Involved in the Traditional Coagulation of Chinese Huizhou Mao-Tofu. LWT 2020, 131, 109706. [Google Scholar] [CrossRef]
  54. He, G.-Q.; Liu, T.-J.; Sadiq, F.A.; Gu, J.-S.; Zhang, G.-H. Insights into the Microbial Diversity and Community Dynamics of Chinese Traditional Fermented Foods from Using High-Throughput Sequencing Approaches. J. Zhejiang Univ. Sci. B 2017, 18, 289–302. [Google Scholar] [CrossRef]
  55. Tedersoo, L.; Lindahl, B. Fungal Identification Biases in Microbiome Projects. Environ. Microbiol. Rep. 2016, 8, 774–779. [Google Scholar] [CrossRef]
  56. Zhang, N.; Zhao, X.-H. Study of Mucor Spp. in Semi-Hard Cheese Ripening. J. Food Sci. Technol. 2010, 47, 613–619. [Google Scholar] [CrossRef] [Green Version]
  57. Morel, G.; Sterck, L.; Swennen, D.; Marcet-Houben, M.; Onesime, D.; Levasseur, A.; Jacques, N.; Mallet, S.; Couloux, A.; Labadie, K.; et al. Differential Gene Retention as an Evolutionary Mechanism to Generate Biodiversity and Adaptation in Yeasts. Sci. Rep. 2015, 5, 11571. [Google Scholar] [CrossRef]
  58. Boutrou, R.; Guéguen, M. Interests in Geotrichum Candidum for Cheese Technology. Int. J. Food Microbiol. 2005, 102, 1–20. [Google Scholar] [CrossRef]
  59. Tamang, J.P.; Shin, D.-H.; Jung, S.-J.; Chae, S.-W. Functional Properties of Microorganisms in Fermented Foods. Front. Microbiol. 2016, 7, 578. [Google Scholar] [CrossRef] [Green Version]
  60. Büchl, N.R.; Seiler, H. Yeasts and Molds|Yeasts in Milk and Dairy Products; Encyclopedia of Dairy Sciences; Elsevier Ltd.: Amsterdam, The Netherlands, 2011; pp. 744–753. [Google Scholar]
  61. Dimidi, E.; Cox, S.R.; Rossi, M.; Whelan, K. Fermented Foods: Definitions and Characteristics, Impact on the Gut Microbiota and Effects on Gastrointestinal Health and Disease. Nutrients 2019, 11, 1806. [Google Scholar] [CrossRef] [Green Version]
  62. Padilla, B.; Gil, J.V.; Manzanares, P. Past and Future of Non-Saccharomyces Yeasts: From Spoilage Microorganisms to Biotechnological Tools for Improving Wine Aroma Complexity. Front. Microbiol. 2016, 7, 411. [Google Scholar] [CrossRef] [PubMed] [Green Version]
  63. Van Breda, V.; Jolly, N.; van Wyk, J. Characterisation of Commercial and Natural Torulaspora Delbrueckii Wine Yeast Strains. Int. J. Food Microbiol. 2013, 163, 80–88. [Google Scholar] [CrossRef]
  64. Combina, M.; Elía, A.; Mercado, L.; Catania, C.; Ganga, A.; Martinez, C. Dynamics of Indigenous Yeast Populations during Spontaneous Fermentation of Wines from Mendoza, Argentina. Int. J. Food Microbiol. 2005, 99, 237–243. [Google Scholar] [CrossRef]
  65. Michel, M.; Kopecká, J.; Meier-Dörnberg, T.; Zarnkow, M.; Jacob, F.; Hutzler, M. Screening for New Brewing Yeasts in the Non-Saccharomyces Sector with Torulaspora Delbrueckii as Model. Yeast 2016, 33, 129–144. [Google Scholar] [CrossRef] [Green Version]
  66. O’Brien, C.E.; McCarthy, C.G.P.; Walshe, A.E.; Shaw, D.R.; Sumski, D.A.; Krassowski, T.; Fitzpatrick, D.A.; Butler, G. Genome Analysis of the Yeast Diutina Catenulata, a Member of the Debaryomycetaceae/Metschnikowiaceae (CTG-Ser) Clade. PLoS ONE 2018, 13, e0198957. [Google Scholar]
  67. Delavenne, E.; Mounier, J.; Asmani, K.; Jany, J.-L.; Barbier, G.; Le Blay, G. Fungal Diversity in Cow, Goat and Ewe Milk. Int. J. Food Microbiol. 2011, 151, 247–251. [Google Scholar] [CrossRef]
  68. Fei, Y.; Li, L.; Chen, L.; Zheng, Y.; Yu, B. High-Throughput Sequencing and Culture-Based Approaches to Analyze Microbial Diversity Associated with Chemical Changes in Naturally Fermented Tofu Whey, a Traditional Chinese Tofu-Coagulant. Food Microbiol. 2018, 76, 69–77. [Google Scholar] [CrossRef] [PubMed]
  69. Carini, P.; Marsden, P.J.; Leff, J.W.; Morgan, E.E.; Strickland, M.S.; Fierer, N. Relic DNA Is Abundant in Soil and Obscures Estimates of Soil Microbial Diversity. Nat. Microbiol. 2016, 2, 16242. [Google Scholar] [CrossRef] [PubMed]
  70. Zimmermann, G. The Entomopathogenic fungusMetarhizium Anisopliaeand Its Potential as a Biocontrol Agent. Pestic. Sci. 1993, 37, 375–379. [Google Scholar] [CrossRef]
  71. Wrather, A.; Shannon, G.; Balardin, R.; Carregal, L.; Escobar, R.; Gupta, G.K.; Ma, Z.; Morel, W.; Ploper, D.; Tenuta, A. Effect of Diseases on Soybean Yield in the Top Eight Producing Countries in 2006. Plant Health Prog. 2010, 11, 29. [Google Scholar] [CrossRef] [Green Version]
  72. Chen, W.; Gray, L.E.; Kurle, J.E.; Grau, C.R. Specific Detection ofPhialophora gregataandPlectosporium Tabacinumin Infected Soybean Plants Using Polymerase Chain Reaction. Mol. Ecol. 1999, 8, 871–877. [Google Scholar] [CrossRef]
  73. Bokulich, N.A.; Mills, D.A. Facility-Specific “House” Microbiome Drives Microbial Landscapes of Artisan Cheesemaking Plants. Appl. Environ. Microbiol. 2013, 79, 5214–5223. [Google Scholar] [CrossRef] [Green Version]
  74. Van Reckem, E.; Geeraerts, W.; Charmpi, C.; Van der Veken, D.; De Vuyst, L.; Leroy, F. Exploring the Link Between the Geographical Origin of European Fermented Foods and the Diversity of Their Bacterial Communities: The Case of Fermented Meats. Front. Microbiol. 2019, 10, 2302. [Google Scholar] [CrossRef]
  75. Wolfe, B.E.; Button, J.E.; Santarelli, M.; Dutton, R.J. Cheese Rind Communities Provide Tractable Systems for in Situ and in Vitro Studies of Microbial Diversity. Cell 2014, 158, 422–433. [Google Scholar] [CrossRef] [Green Version]
  76. Almeida, P.; Barbosa, R.; Zalar, P.; Imanishi, Y.; Shimizu, K.; Turchetti, B.; Legras, J.-L.; Serra, M.; Dequin, S.; Couloux, A.; et al. A Population Genomics Insight into the Mediterranean Origins of Wine Yeast Domestication. Mol. Ecol. 2015, 24, 5412–5427. [Google Scholar] [CrossRef]
  77. Dumas, E.; Feurtey, A.; Rodríguez de la Vega, R.C.; Le Prieur, S.; Snirc, A.; Coton, M.; Thierry, A.; Coton, E.; Le Piver, M.; Roueyre, D.; et al. Independent Domestication Events in the Blue-Cheese Fungus Penicillium Roqueforti. Mol. Ecol. 2020, 29, 2639–2660. [Google Scholar] [CrossRef] [Green Version]
  78. Mezzasalma, V.; Sandionigi, A.; Guzzetti, L.; Galimberti, A.; Grando, M.S.; Tardaguila, J.; Labra, M. Geographical and Cultivar Features Differentiate Grape Microbiota in Northern Italy and Spain Vineyards. Front. Microbiol. 2018, 9, 946. [Google Scholar] [CrossRef]
  79. Longley, R.; Noel, Z.A.; Benucci, G.M.N.; Chilvers, M.I.; Trail, F.; Bonito, G. Crop Management Impacts the Soybean (Glycine Max) Microbiome. Front. Microbiol. 2020, 11, 1116. [Google Scholar] [CrossRef] [PubMed]
  80. Statnikov, A.; Henaff, M.; Narendra, V.; Konganti, K.; Li, Z.; Yang, L.; Pei, Z.; Blaser, M.J.; Aliferis, C.F.; Alekseyenko, A.V. A Comprehensive Evaluation of Multicategory Classification Methods for Microbiomic Data. Microbiome 2013, 1, 11. [Google Scholar] [CrossRef] [PubMed]
  81. Leinonen, R.; Sugawara, H.; Shumway, M.; International Nucleotide Sequence Database Collaboration. The Sequence Read Archive. Nucleic Acids Res. 2011, 39, D19–D21. [Google Scholar] [CrossRef] [PubMed] [Green Version]
Figure 1. Boxplot of observed species richness for ITS (A), LSU (B), and 16S (C) rDNA markers data sets microbial communities. Data are shown for the niche sampled (inside vs. outside of the tofu sample) for each of the four markets sampled. Red diamonds represent the mean of the distribution. Letters, when present, represent pairwise Wilcoxon tests among groups after a Kruskal–Wallis test (p ≤ 0.05 after Bonferroni adjustment). Outliers are marked with an asterisk (*).
Diversity 14 00207 g001
Figure 2. Principal coordinate analysis (PCoA) ordinations and sample distance from group centroids (dispersion) distributions for the two factors assesses (market and niche). Model significance was tested using ANOVA-like permutation test (permutations = 9999) and p-values adjusted using the Bonferroni method. Letters, when present, represent pairwise permutation tests. Data are shown for ITS (A,D), LSU (B,E) and 16S (C,F) rDNA markers. Outliers are marked with an asterisk (*). Red diamonds represent the mean of the distribution.
Diversity 14 00207 g002
Figure 3. Procrustes plots for (A) ITS and LSU ordinations, (B) ITS and 16S ordinations, and (C) LSU and 16S ordinations. Each sample is represented by two points, connected by an arrow; the arrow starts at the target community and points toward the rotated community. M2 represents the Procrustes sum of squares and r represents the correlation in a symmetric Procrustes rotation ( r = ( 1 m 2 ) ). Tests were run using 9999 permutations. The distribution of Procrustes residuals for each of the comparisons and both market and niche (sample from external or internal part of tofu) is shown in (DF). Letters, when present, represent pairwise Wilcoxon tests among groups after a Kruskal–Wallis test (p ≤ 0.05 after Bonferroni adjustment). Outliers are marked with an asterisk (*). Red diamonds represent the mean of the distribution.
Diversity 14 00207 g003
Figure 4. Metric multidimensional scaling (MDS) ordinations of random forest models 1-proximity matrix to visualize accuracy of market and niche sample classification in the (A) ITS dataset, (B) LSU dataset, and (C) 16S dataset. Samples that cluster within the wrong groups may represent misclassifications.
Diversity 14 00207 g004
Figure 5. Top 20 OTUs with the highest mean decrease accuracy obtained in the random forest models for the (A) ITS, the (B) LSU, and (C) 16S rDNA marker datasets. Significant (with p ≤ 0.05 after fdr correction) correlations (i.e., r.g. value) with samples of different markets or niches (sample from external or internal part of tofu) are reported within each bar, while colors specify the sample groups that OTUs are correlated with.
Diversity 14 00207 g005
Figure 6. Heatmap abundance trees to visualize tofu microbial composition according the (A) ITS, the (B) LSU, and (C) 16S metagenomic marker datasets. The plot shows the number of samples from the inside niche (sampled from the inside of the tofu) that have counts (i.e., sequence reads) for each taxon as the color of each taxon. Core taxa have darker colors, while grey represents taxa that were absent in samples from the inside niche. The number of OTUs assigned to each taxon in the overall dataset is represented by the node size.
Diversity 14 00207 g006
Table 1. Results from permutational multivariate analysis of variance (PERMANOVA) of ITS, LSU and 16S rDNA for market (Ciba, Longjin, Wanyao, New District) and tofu niche (inside vs. outside of the tofu sample) as well as their interaction (market:niche) are shown. All p-values were adjusted using the Bonferroni method.
FactorITSLSU16S
DfF-ValueR2p-ValueDfF-ValueR2p-ValueDfF-ValueR2p-Value
Market36.0700.1930.000334.8910.1580.000335.4230.1700.0003
Niche14.7080.0500.000315.2440.0570.000315.4200.0570.0003
Market:Niche32.5020.0790.000332.9340.0950.000333.2600.1020.0003
Residuals64 0.678 62 0.690 64 0.670
Total71 1.000 69 1.000 71 1.000
Publisher’s Note: MDPI stays neutral with regard to jurisdictional claims in published maps and institutional affiliations.

