Article

Effects of Landscape and Local Factors on the Diversity of Flower-Visitor Groups under an Urbanization Gradient, a Case Study in Wuhan, China

1
College of Horticulture & Forestry Sciences, Hubei Engineering Technology Research Center for Forestry Information, Huazhong Agricultural University, Wuhan 430070, China
2
Wuhan Dijiao Park Management Office, Garden and Forestry Bureau of Jiang’an District, Wuhan 430014, China
3
Institute of Wetland Research, Chinese Academy of Forestry, Beijing 100091, China
4
Co-Innovation Center for Sustainable Forestry in Southern China, College of Biology and the Environment, Nanjing Forestry University, Nanjing 210037, China
5
The National Wetland Ecosystem Field Station of Taihu Lake, National Forestry Administration, Suzhou 215107, China
6
Department of Ecology and Evolutionary Biology, University of California, Irvine, CA 92697-2525, USA
*
Author to whom correspondence should be addressed.
Diversity 2022, 14(3), 208; https://doi.org/10.3390/d14030208
Submission received: 25 January 2022 / Revised: 10 March 2022 / Accepted: 10 March 2022 / Published: 11 March 2022
(This article belongs to the Special Issue Ecology, Evolution and Diversity of Plants)

Abstract

:
Urbanization is one of the primary forces driving worldwide pollinator decline. Moderate urban expansion with appropriate green space planning can help in maintaining pollinator diversity and pollination service. We investigated the relative effects of landscape and local factors on the diversity of flower-visitor functional groups in a moderately urbanized city, Wuhan, located in central China. We found that the proportion of impervious surface had no significant effect on the number of visitations, but it was negatively associated with the diversity of flower-visitor groups. The number of visitations by Halictidae and Lepidoptera correlated positively with local flower density and flowering plant species richness, respectively. Flowering plant species richness was also positively correlated with the diversity of flower-visitor groups. The proportion of green space was negatively associated with the visitation number of Muscidae and the overall diversity of flower-visitor groups, revealing the potential influence of green space quality on pollinator assemblage. The pollination networks under three urbanization levels (with a total of 11 flower visitor groups and 43 plant species) were asymmetric, highly nested, and generalized. The suburb sites contained the highest diversity of interactions. Core flowering plants (Oenothera speciosa, Coreopsis grandiflora and Cyanus segetum) are exotic species with attractive flowers. Improving green space quality (high flower density and flowering plant species richness) and using attractive native flowering plants (Nandina domestica, Rosa chinensis, Astragalus sinicus, Cirsium arvense var. integrifolium, and Zabelia biflora) would enhance the function of urban green space to maintain pollinator diversity and ecosystem stability.

1. Introduction

The sustainable development of human societies relies on ecosystem services provided by nature, among which pollination service is vital and vulnerable [1]. Pollinators, such as bees, butterflies, and hoverflies have declined globally [2,3,4,5,6]. Flying insects in the nature reserves of Germany have declined by more than 75% during 1989–2016 [7]. The relative abundance of four bumblebee species in North America has decreased by 96% from 1980s to 2009 [8]. The primary factors causing large-scale pollinator decline include habitat loss and fragmentation, agricultural intensification, use of agricultural chemicals, pathogen infestation, invasive alien species, climate change, light pollution, and their collective interactions [8,9,10,11].
Urbanization is a dynamic process involving dramatic and continuous changes in land use, including a decrease in bare land, an increase in the area covered by impervious surfaces, and the loss of natural vegetation [10,12,13]. In general, urbanization causes habitat loss and reduces the habitat suitability of pollinators, and consequently reduces the abundance and diversity of pollinators [14,15,16,17]. However, some studies have found that moderate urban expansion or artificial land-use may increase the number of certain pollinators and their pollination services. Landscape heterogeneity is improved at the landscape level, resulting in diverse habitat types for different pollinator groups [18]. On the other hand, urban green spaces can provide suitable alternative habitats and food sources for pollinators [19,20]. Some studies have shown that floricultural suburban gardens contribute more to bumblebee population growth and nesting than agro-ecosystems or other rural landscapes [21,22,23]. Gardens with high flower diversity and density are considered to be pollinator-friendly [24]. To increase the local nectar resources, the cutting frequency of the green space should be reduced, in order to retain herb and shrub layers [25]. Therefore, suitable urbanized areas may play an important role in pollinator conservation.
At the landscape scale, residual semi-natural habitats in urban environments can serve as habitats and shelters for pollinators [26]. The impact of urban environments on insects is largely determined by the number and distribution of semi-natural habitats such as green spaces, lawns, hedges, and so forth [25]. Urban night light may directly affect the nocturnal pollinators and pollination networks, and indirectly affect the diurnal pollinators. Artificial night light disturbs nocturnal pollination and reduces plant reproduction, which also provide food resources for diurnal pollinators [27]. On the other hand, the night light may decrease nectar depletion by nocturnal pollinators and favor foraging by diurnal pollinators [28]. At the local scale, vegetation type and abundance of flower resources affects the habitat suitability and food availability for pollinators. For example, a high abundance and species richness of flowering plants can provide nectar and other food resources in different seasons, which can help maintain high pollinator diversity [20,29]. The plant species differ markedly in their attractiveness to pollinators [30,31], and species of Origanum, Agastache, Lavandula, and Nepeta were reported to be highly attractive [30]. Pollinators differ in their preference of floral traits [32], so the species of flowering plants also affects the pollinator assemblage. Therefore, studies of both landscape factors and local factors in moderately urbanized areas can help reveal the impact of urbanization on pollinator diversity and provide guidance in the planning of urban green spaces.
In this study, we investigated the effects of landscape factors and local factors driven by urbanization on the diversity of flower visitors in urban and suburban green spaces in Wuhan, central China. The objectives of this study were: (1) to investigate the effects of landscape factors (percentage of impervious surface, percentage of green space, and night light intensity) and local factors (species richness of flowering plants, and flower density) on the abundance and diversity of flower-visitor groups; (2) to investigate the effects of urbanization level on interaction between plants and flower-visitor groups, and clarify the key plant species that may play an important role in maintaining urban pollinator diversity.

2. Materials and Methods
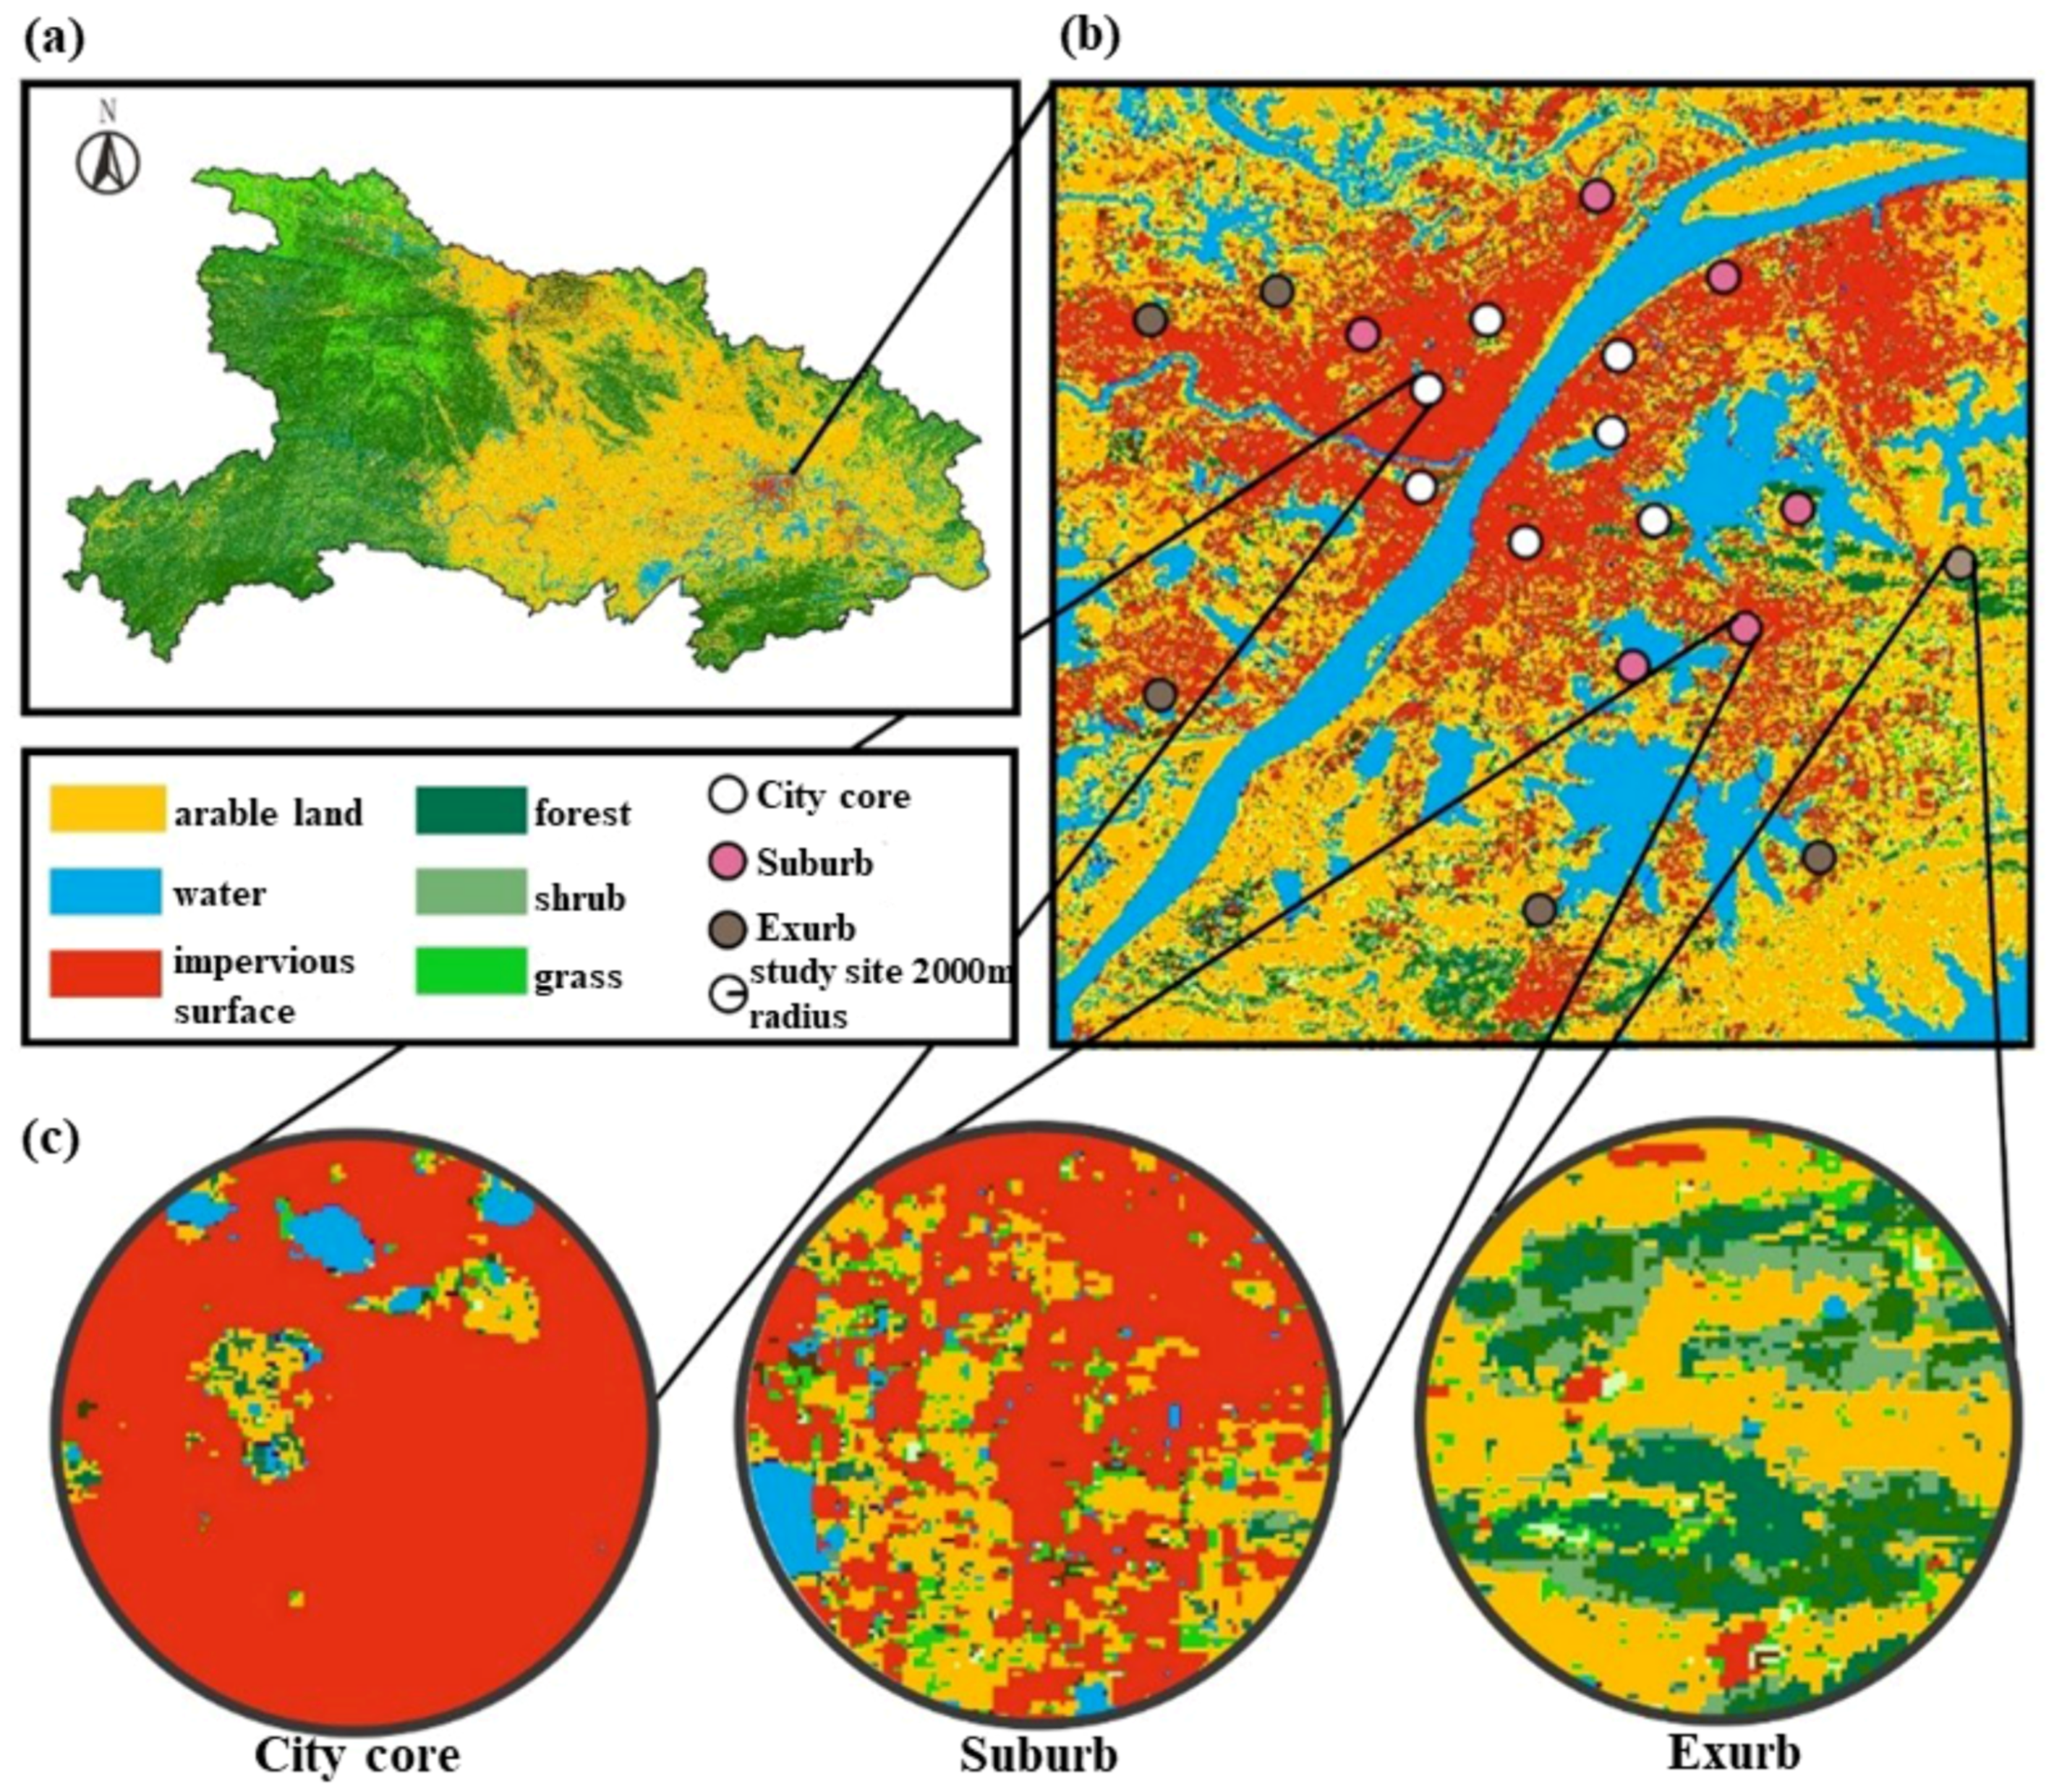
2.1. Study Area

The study system we surveyed was located in Wuhan City (113°41′–115°05′ E, 29°58′–31°22′ N, ranging between 19.2 and 873.7 m in elevation and with a total area of 856,915 hectares) in Hubei Province, central China. This is one of the most rapidly growing cities in central China, where urban and arable areas have largely expanded over natural vegetation. According to Wuhan’s General Plan for Land Use (2006–2020), construction land was expected to reach 185,000 ha, accounting for 21.58% of total land area in 2020 [33].
Field investigations were conducted from May to July in 2019 at 19 independent sites in urban parks, covering an urbanization gradient. The study sites were selected on the basis of the proportion of impervious surfaces around the park within a 2000 m radius (Table A1, Figure 1), using Google satellite imagery 2016 and Hubei land cover maps (resolution of 30 m) [34]. We used 2000 m as the research scale of landscape variables for the following reasons. Firstly, some flower-visitors are capable of flying long distances, for example, the foraging flight of bumblebee workers is greater than 1 km and their maximum measurement reaches approximately 2 km [35]. Consequently, the habitat and resource that pollinators can reach cannot be evaluated at a small scale, and the effects of impervious space on the pollinator abundance are more apparent on a larger scale [36]. Secondly, the area of urban parks usually exceeds 100 hectares (for example, the area of Shizishan Parkland is 495 hectares, and the area of Wuhan Garden Expo Park is 213.8 hectares). We excluded the park area in calculation of impervious surface, because the parks with large squares and pavements usually lead to overestimation of urbanization level in their settings, especially for exurb parks. The water cover was excluded in the calculation of land cover composition following the approach used by Xie et al. (2017) [37]. Study sites were situated at least 3 km from each other. In keeping with McKinney‘s categorization of urban landscapes [38], the “City core” represented the area in which the impervious surfaces were greater than 80%, in the “Suburb” the impervious area was between 50 and 80%, and the impervious surface cover of the “Exurb” comprised sites with less than 50% coverage.

2.2. Landscape Variables

We calculated the proportion of green space within a 2000 m radius (excluding areas covered by water) around the study sites (Table 1 and Table A1). Green space included parklands, protective green space, affiliated green space, regional green space, and other categories of non-developed settings.
The night light data were obtained from remote sensing images by the Luojia No. 1 night remote sensing satellite and have a resolution of 130 m. The average night light intensity within a 2000 m radius around the sites was calculated using Arcmap software (Version:10.6.1) (Table 1 and Table A1).

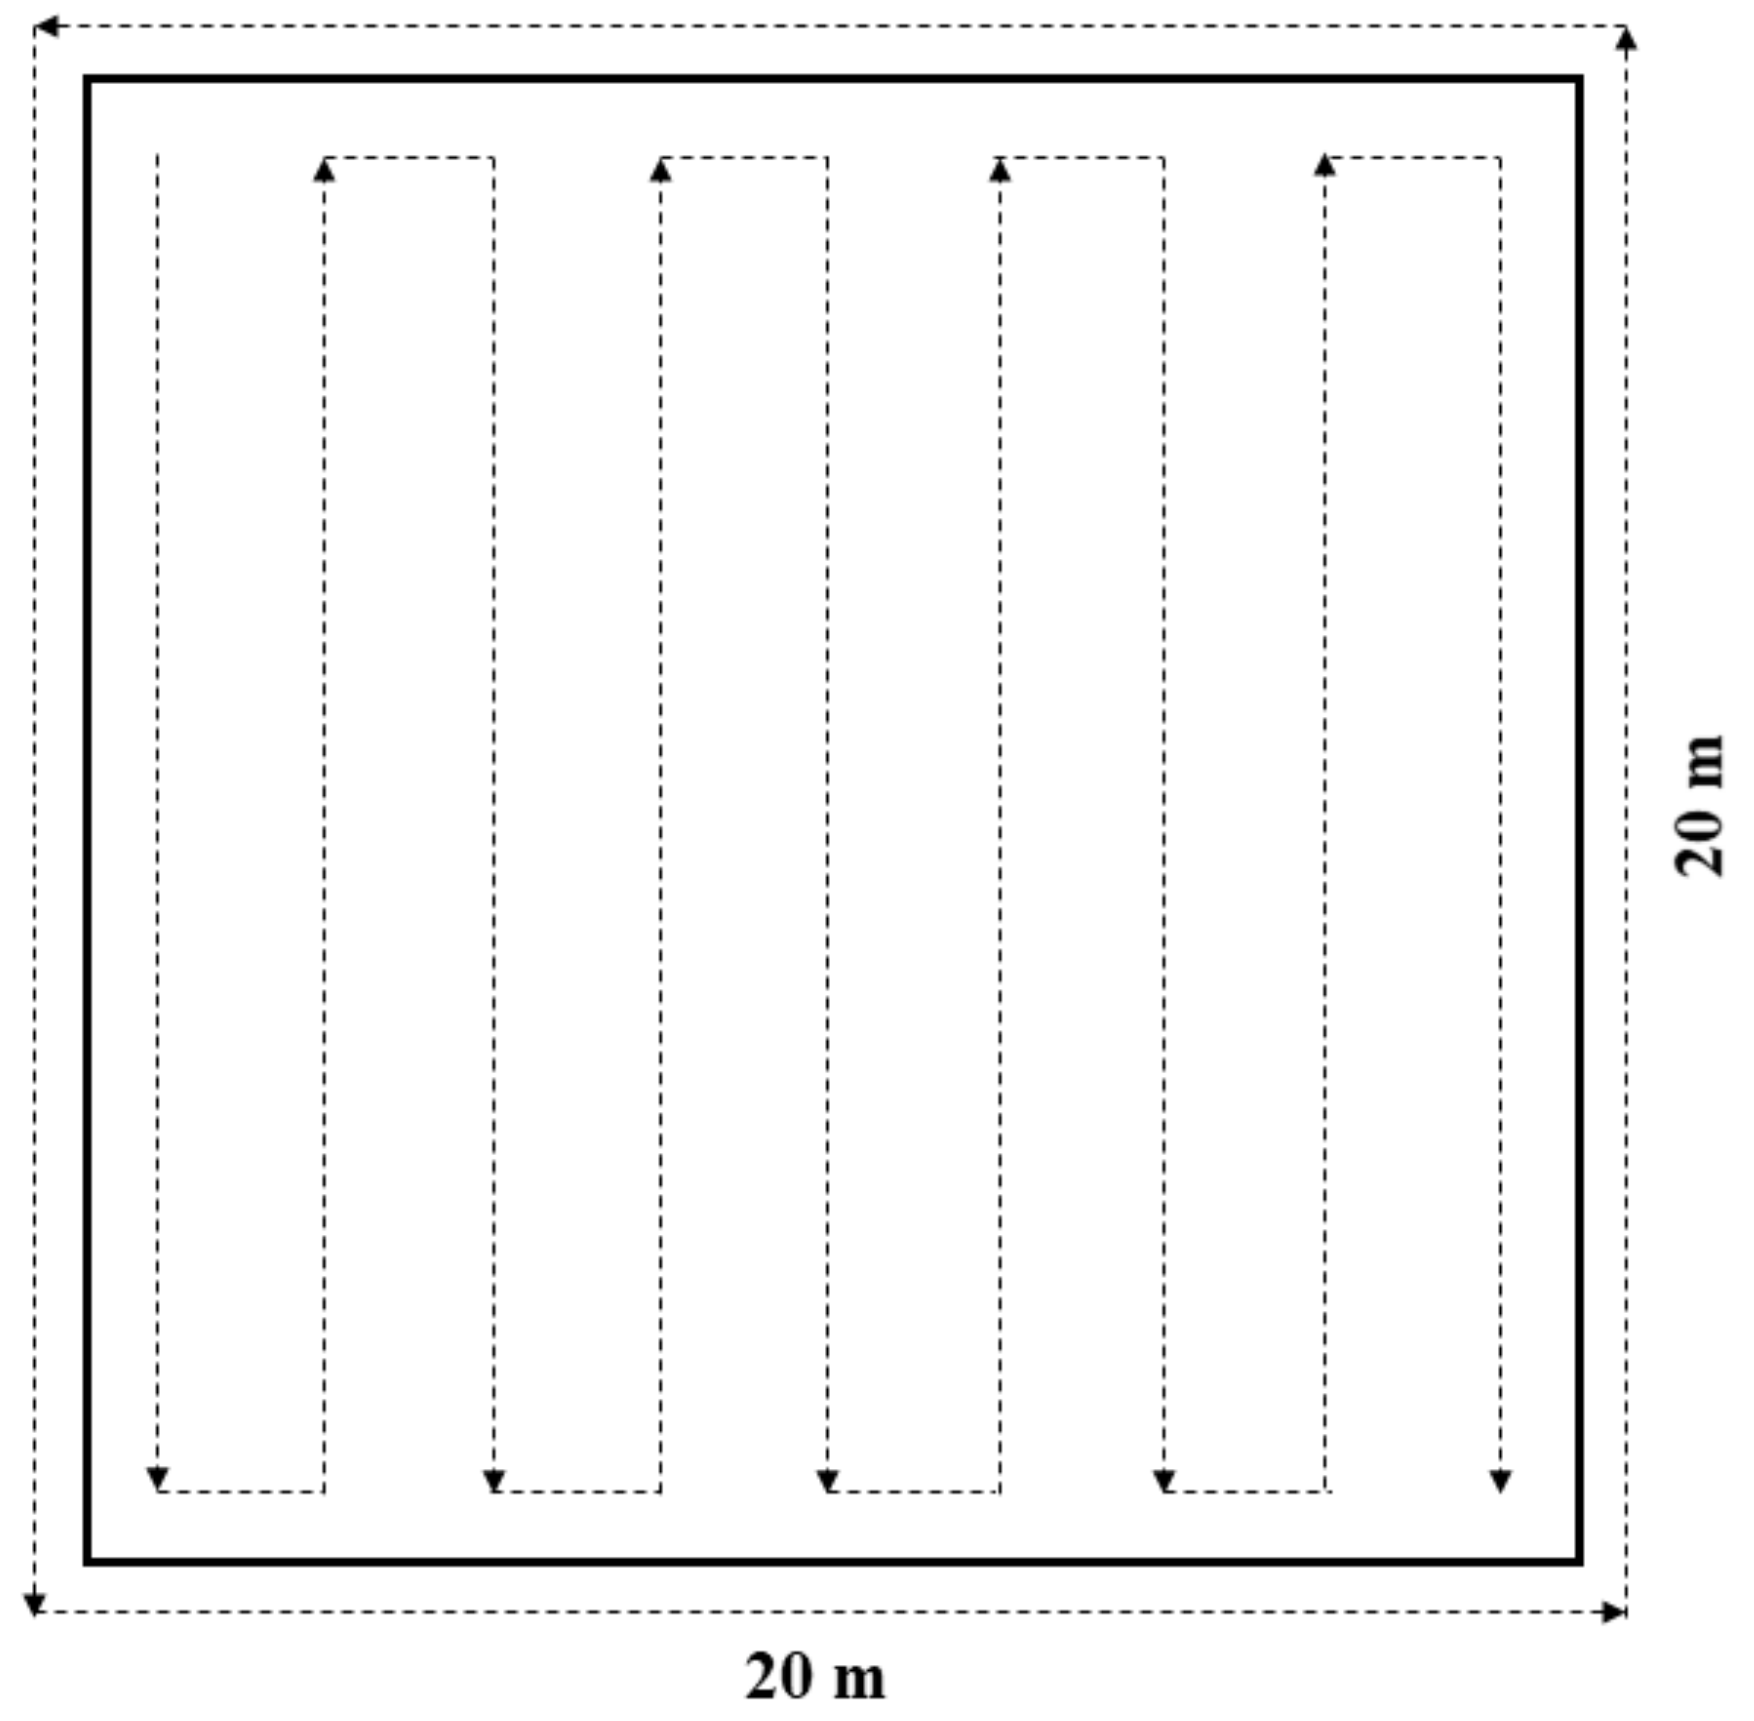
2.3. Local Floral Resources and Flower-Visitors

At each site we selected a representative 20 × 20 m plot in which the floral resources were relatively abundant, and the level of human disturbance was low or absent. We conducted surveys between 1000 and 1700 h on sunny and calm days. Three survey rounds were performed in each site once a month.
Before our observations of flower-visitors, we recorded flowering plant species richness and the density of flowers (the number of flowers per meter squared) in each plot. The density of flowers was sampled in 10 randomly selected 1 × 1 m plots. The number of flowers were counted according to the procedure described by Gong and Huang (2009) [32]. Single flower plants (e.g., Oenothera speciosa) and plants with clustered florets in their inflorescence (e.g., Trifolium repens and composites) were counted as single floral units. For inflorescences with wide and sparse florets that can be visited independently by pollinators (e.g., Althaea rosea and Oxalis articulate), each floret was counted as a floral unit. Flowering trees higher than 2 m were not included because of the difficulty in surveying their flowers. The anemophilous flowers were not included.
In the 20 × 20 m plots, we recorded flower-visitors and visited plant species using line-transect methodology. We counted and recorded visits to flowers within 1 m of each side of the transect and 1 m in front of the observer at a steady walking speed. For each survey round, the transect was positioned across the 20 × 20 m plot and proceeded for 2 km (Figure 2). Due to the difficulty of species identification in the field, the flower-visitors were identified to genus (Apis spp., Anthophora spp.), family (Halictidae, Vespidae, Syrphidae), or order level (Lepidoptera, Coleoptera). To avoid interference with insect visitations, we caught individuals for further identification using a hand net as the survey round was completed. The flower visitors were transferred to separate vials and stored at −80 °C. Further identification was conducted utilizing DNA sequence comparisons (COI-KC and ITS2) based upon insect leg tissue samples (Supplementary Material Table S1). The insect specimens were deposited in the lab of College of Horticulture & Forestry Sciences, Huazhong Agricultural University. The flower-visitors were classified into 11 functional groups: honeybee (Apis cerana, A. dorsata, A. mellifera, A. nuluensis), Anthophora spp., common wasp (Vespidae and Ichneumonidae), Halictidae (Lasioglossum seillean), Muscidae and Tachinidae (Musca domestica, Drino inconspicua), Lepidoptera (Euxoa castanea, Gonepteryx cleopatra, Graphium sarpedon, Parnara batta, Pseudozizeeria maha, etc.), Orthoptera (Oedipodidae), Coleoptera (Dytiscus semisulcatus), Odonata, ant (Formicidae), and Syrphidae (Episyrphus balteatus, Eristalis tenax, Sphaerophoria philanthus) (Supplementary Material Table S1). The functional groups were classified according to the insect body size and visiting behavior, for example, the short-tongued honeybee, long-tongued and large-sized bee (Anthophora spp.), solitary bee (Halictidae), long-tongued butterfly, and moth. We used Shannon’s diversity index (H) to estimate the diversity of flower-visitor groups for each sample plot during each survey.
H = P i × ln P i
Pi: the percentage of visits by each flower-visitor group to total visits.
Due to revegetation and plant replacement in green space areas, there were four times when there were no flowering plants present in the sample sites (Shouyi Cultural Park and Simeitang Park in the second round, Shizishan Parkland and Dijiao Park in the third round). The sites without flowering plants in the survey round were excluded from analysis.

2.4. Data Analysis

We examined the effect of the proportion of impervious surface, proportion of green space, night light intensity, local flower density, flowering plant species richness, and the sampling time (May, June, and July) on the number of visits by flower-visitors and the diversity of flower-visitor groups during each survey round, using the generalized linear mixed model (GLMM). The study site was included as a random effect. Variance inflation factors (VIFs) were checked to ensure that the factors met the assumption of independence. None of the factors had VIFs greater than 4, so the factors could be included independently in the model [31].
The number of visits by flower-visitor groups (discrete data with a large variance) were analyzed with a negative binomial distribution (with log link) [39]. We examined the number of visits by all groups and also by the main visitor groups (honeybee, Halictidae, Muscidae, Lepidoptera). Honeybees are extremely abundant and widely distributed, and may drive the results. To address this possibility, we also analyzed the number of visits with honeybees excluded. The diversity of flower-visitor functional groups was analyzed with a normal distribution.
To illustrate the effect of urbanization level on the interaction between flowering plants and flower-visitor groups, we applied the Shannon’s diversity index of interactions (Pi was calculated as the proportion of interactions) for each urbanization level. We also investigated the pollination networks for the three urbanization levels using R software (Version:4.0.3, ‘bipartite’ package).

3. Results

3.1. Survey Results

In total, we recorded 4115 floral visits on 53 plant species. The honeybees made 2534 visits and accounted for 61.58% of the total visitation, followed by Halictidae (625 visits, 15.19%), Lepidoptera (449 visits, 10.91%), and Muscidae and Tachinidae (335 visits, 8.14%). Other groups, including Formicidae (92 visits), Anthophora spp. (35 visits), Coleoptera (17 visits), Syrphidae (15 visits), Vespidae and Ichneumonidae (6 visits), Odonata (5 visits), and Orthoptera (2 visits), accounted for less than 5% of the total visits.
The study sites supported a diverse array of flowering plant species. We observed 53 plant species across 28 plant families. The most common plant families were the Asteraceae (13 species) and Leguminosae (4 species). Thirty-one plant species were exotic, of which nine species were invasive, including Trifolium repens, Erigeron annuus, Trifolium pratense, Oenothera biennis, Veronica persica, Daucus carota, Geranium carolinianum, Silybum marianum, and Zephyranthes carinata (Table A2) [40,41]. Each site contained a mean of 2.84 (±2.59) species of flowering plant during each round. The density of flowers ranged from 0.4 to 535.6 flower/m2. The most common flowering plant species was Rosa chinensis, which was found in six sites, followed by Oenothera speciosa (five sites), Erigeron annuus (five sites), Trifolium repens L. (four sites), Coreopsis grandiflora (four sites), Cosmos bipinnatus (four sites), Oxalis articulata (four sites), and Veronica persica (four sites) (Table A2).
In this survey, a few plant species received the most visits (such as Oenothera speciosa, Coreopsis grandiflora, Centaurea cyanus, and Oxalis articulata). However, no visitor groups were observed for 10 plant species, Weigela florida, Plantago depressa, Geranium carolinianum, Salvia miltiorrhiza, Silybum marianum, Oxalis corniculate, Ophiopogon japonicus, Platycodon grandiflorus, Canna indica, and Zephyranthes carinata. These species were rare, found in only one survey site and in one survey round.

3.2. Factors Influencing the Number of Visits by Flower-Visitor Groups

The sampling time significantly affected the number of visits by all groups during each survey round (GLMM, F2,45 = 3.365, p = 0.043; Table 2). Visits by all groups were significantly higher in May (133.17 ± 125.00) than in June (54.80 ± 63.58) and July (41.53 ± 52.09) (Figure 3a).
None of the factors affected the number of visits when honeybees were excluded from the analysis (Table 2).
The number of visits by honeybees was significantly affected by the sampling time (GLMM, F2,45 = 7.554, p = 0.001; Table 2). During each survey round, honeybee visitations were significantly higher in May (104.17 ± 117.52) than that in June (26.00 ± 38.75) and July (9.27 ± 14.069). The visitation number did not differ between June and July (Figure 3c).
Visits by Halictidae were positively correlated with the flower density (GLMM, fixed coefficient = 0.040, F1,45 = 47.175, p < 0.001; Table 2).
Visits by Lepidoptera were positively associated with flowering plant species richness (GLMM, fixed coefficient = 0.298, F1,45 = 6.317, p = 0.016; Table 2).
Visits by Muscidae were affected by the sampling time (GLMM, F2,45 = 10.366, p < 0.001; Table 2, Figure 3f). During each round, the Muscidae made significantly more visits in May (13.56 ± 19.986), followed by June (4.35 ± 7.46), making least visits in July (1.27 ± 2.915) (Figure 2). The number of visits by Muscidae was negatively associated with the proportion of green space (GLMM, fixed coefficient = −5.384, F1,45 = 4.393, p = 0.042; Table 2).

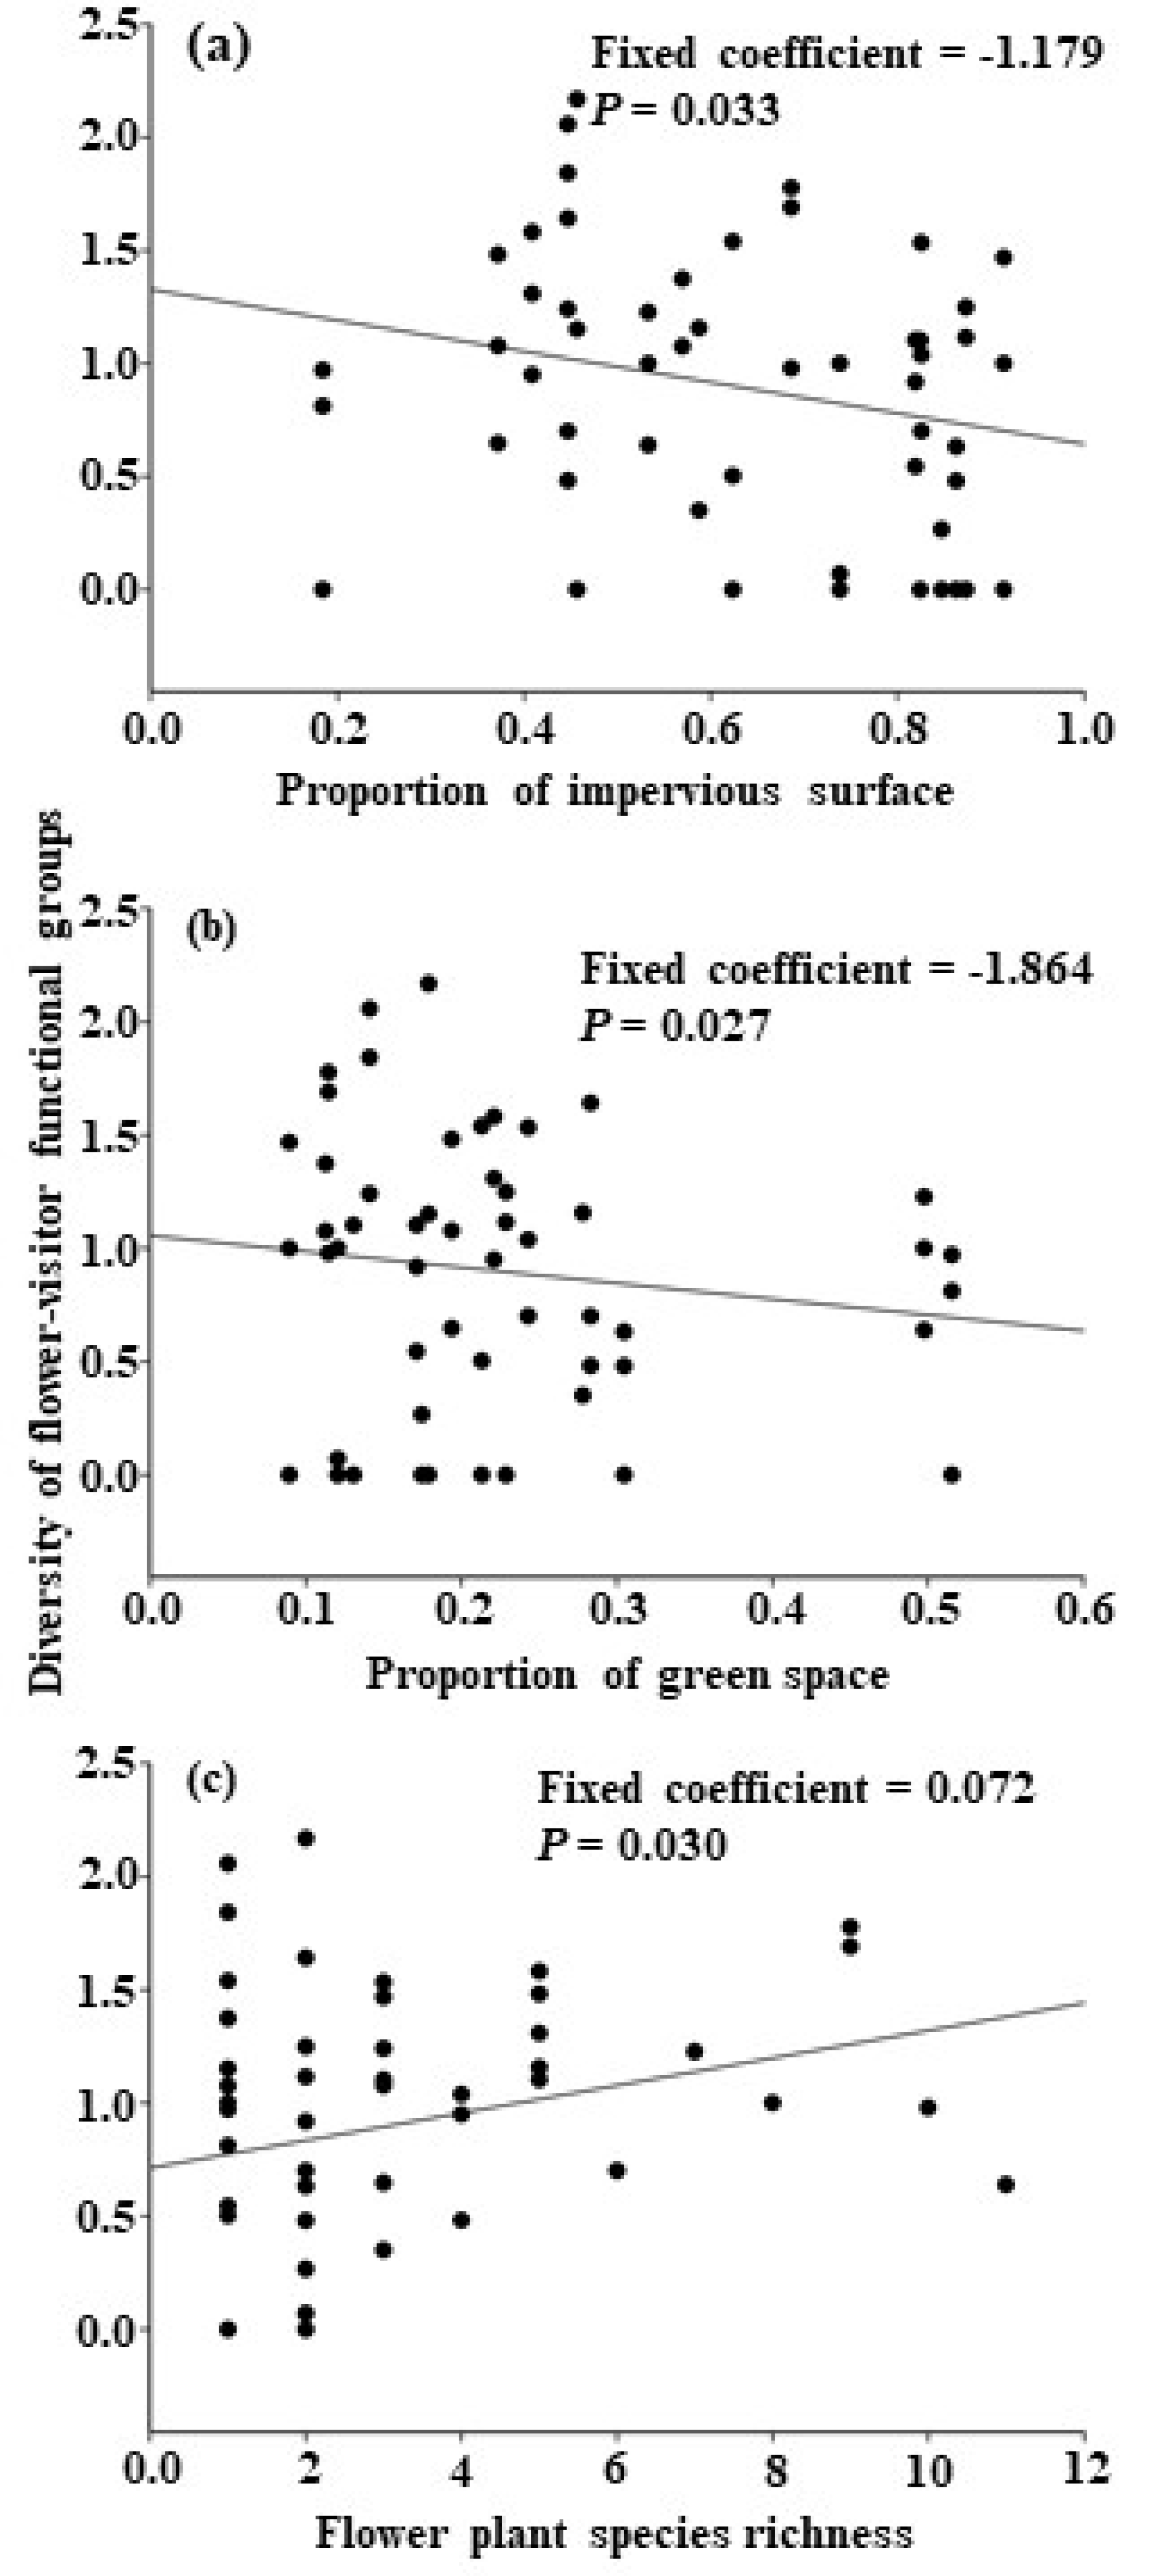
3.3. Factors Influencing the Composition and Diversity of Flower-Visitor Groups

There were six, ten, and eight functional groups of flower-visitors recorded in the City core, Suburb, and Exurb sites, respectively. Honeybees, Halictidae, Lepidoptera, Muscidae, and Tachinidae occurred under the three urbanization levels. Orthoptera only occurred in Suburb sites. Vespidae and Ichneumonidae were only found in Exurb sites. The visitor groups that appeared in City core sites were also recorded in the Suburb and Exurb sites.
The diversity of flower-visitor functional groups during each survey was negatively associated with the proportion of impervious surface and proportion of green space (GLMM, proportion of impervious surface, fixed coefficient = −1.179, F1,45 = 4.847, p = 0.033; proportion of green space, fixed coefficient = −1.864, F1,45 = 5.223, p = 0.027; Table 3, Figure 4a,b). The diversity of flower-visitor groups was positively correlated with the species richness of flowering plant (GLMM, fixed coefficient = 0.072, F1,45 = 5.005, p = 0.030; Table 3, Figure 4c).

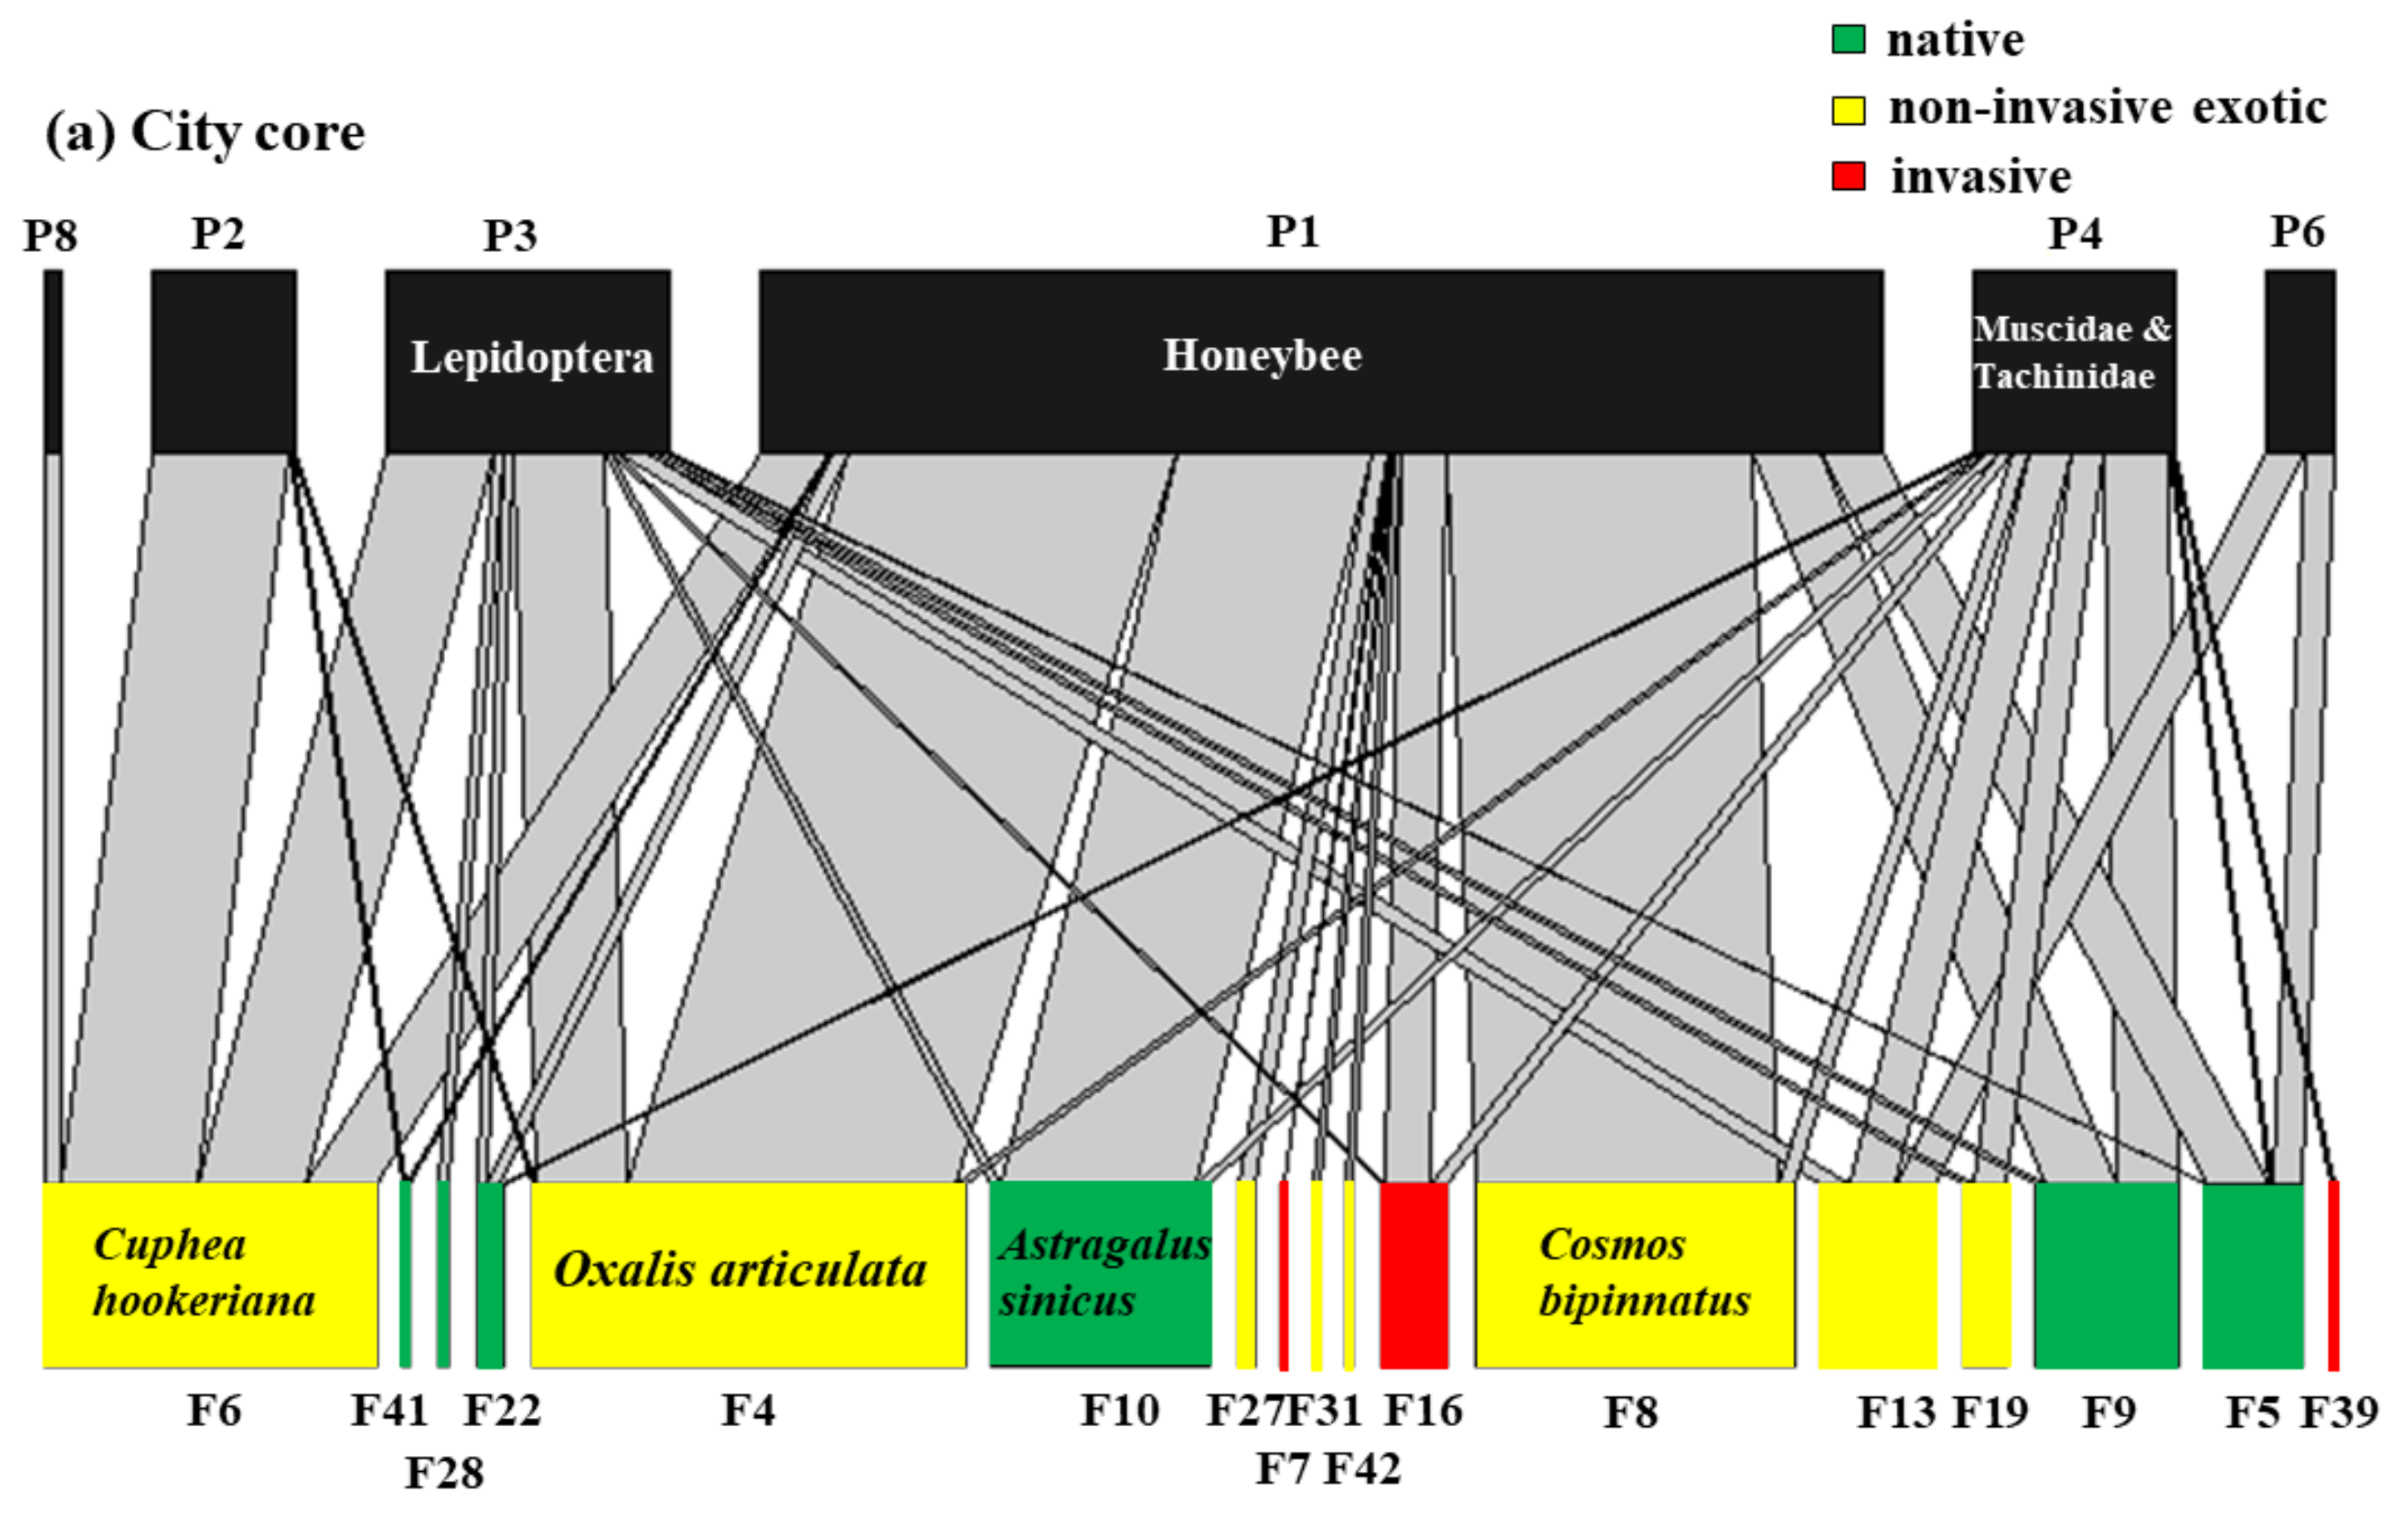
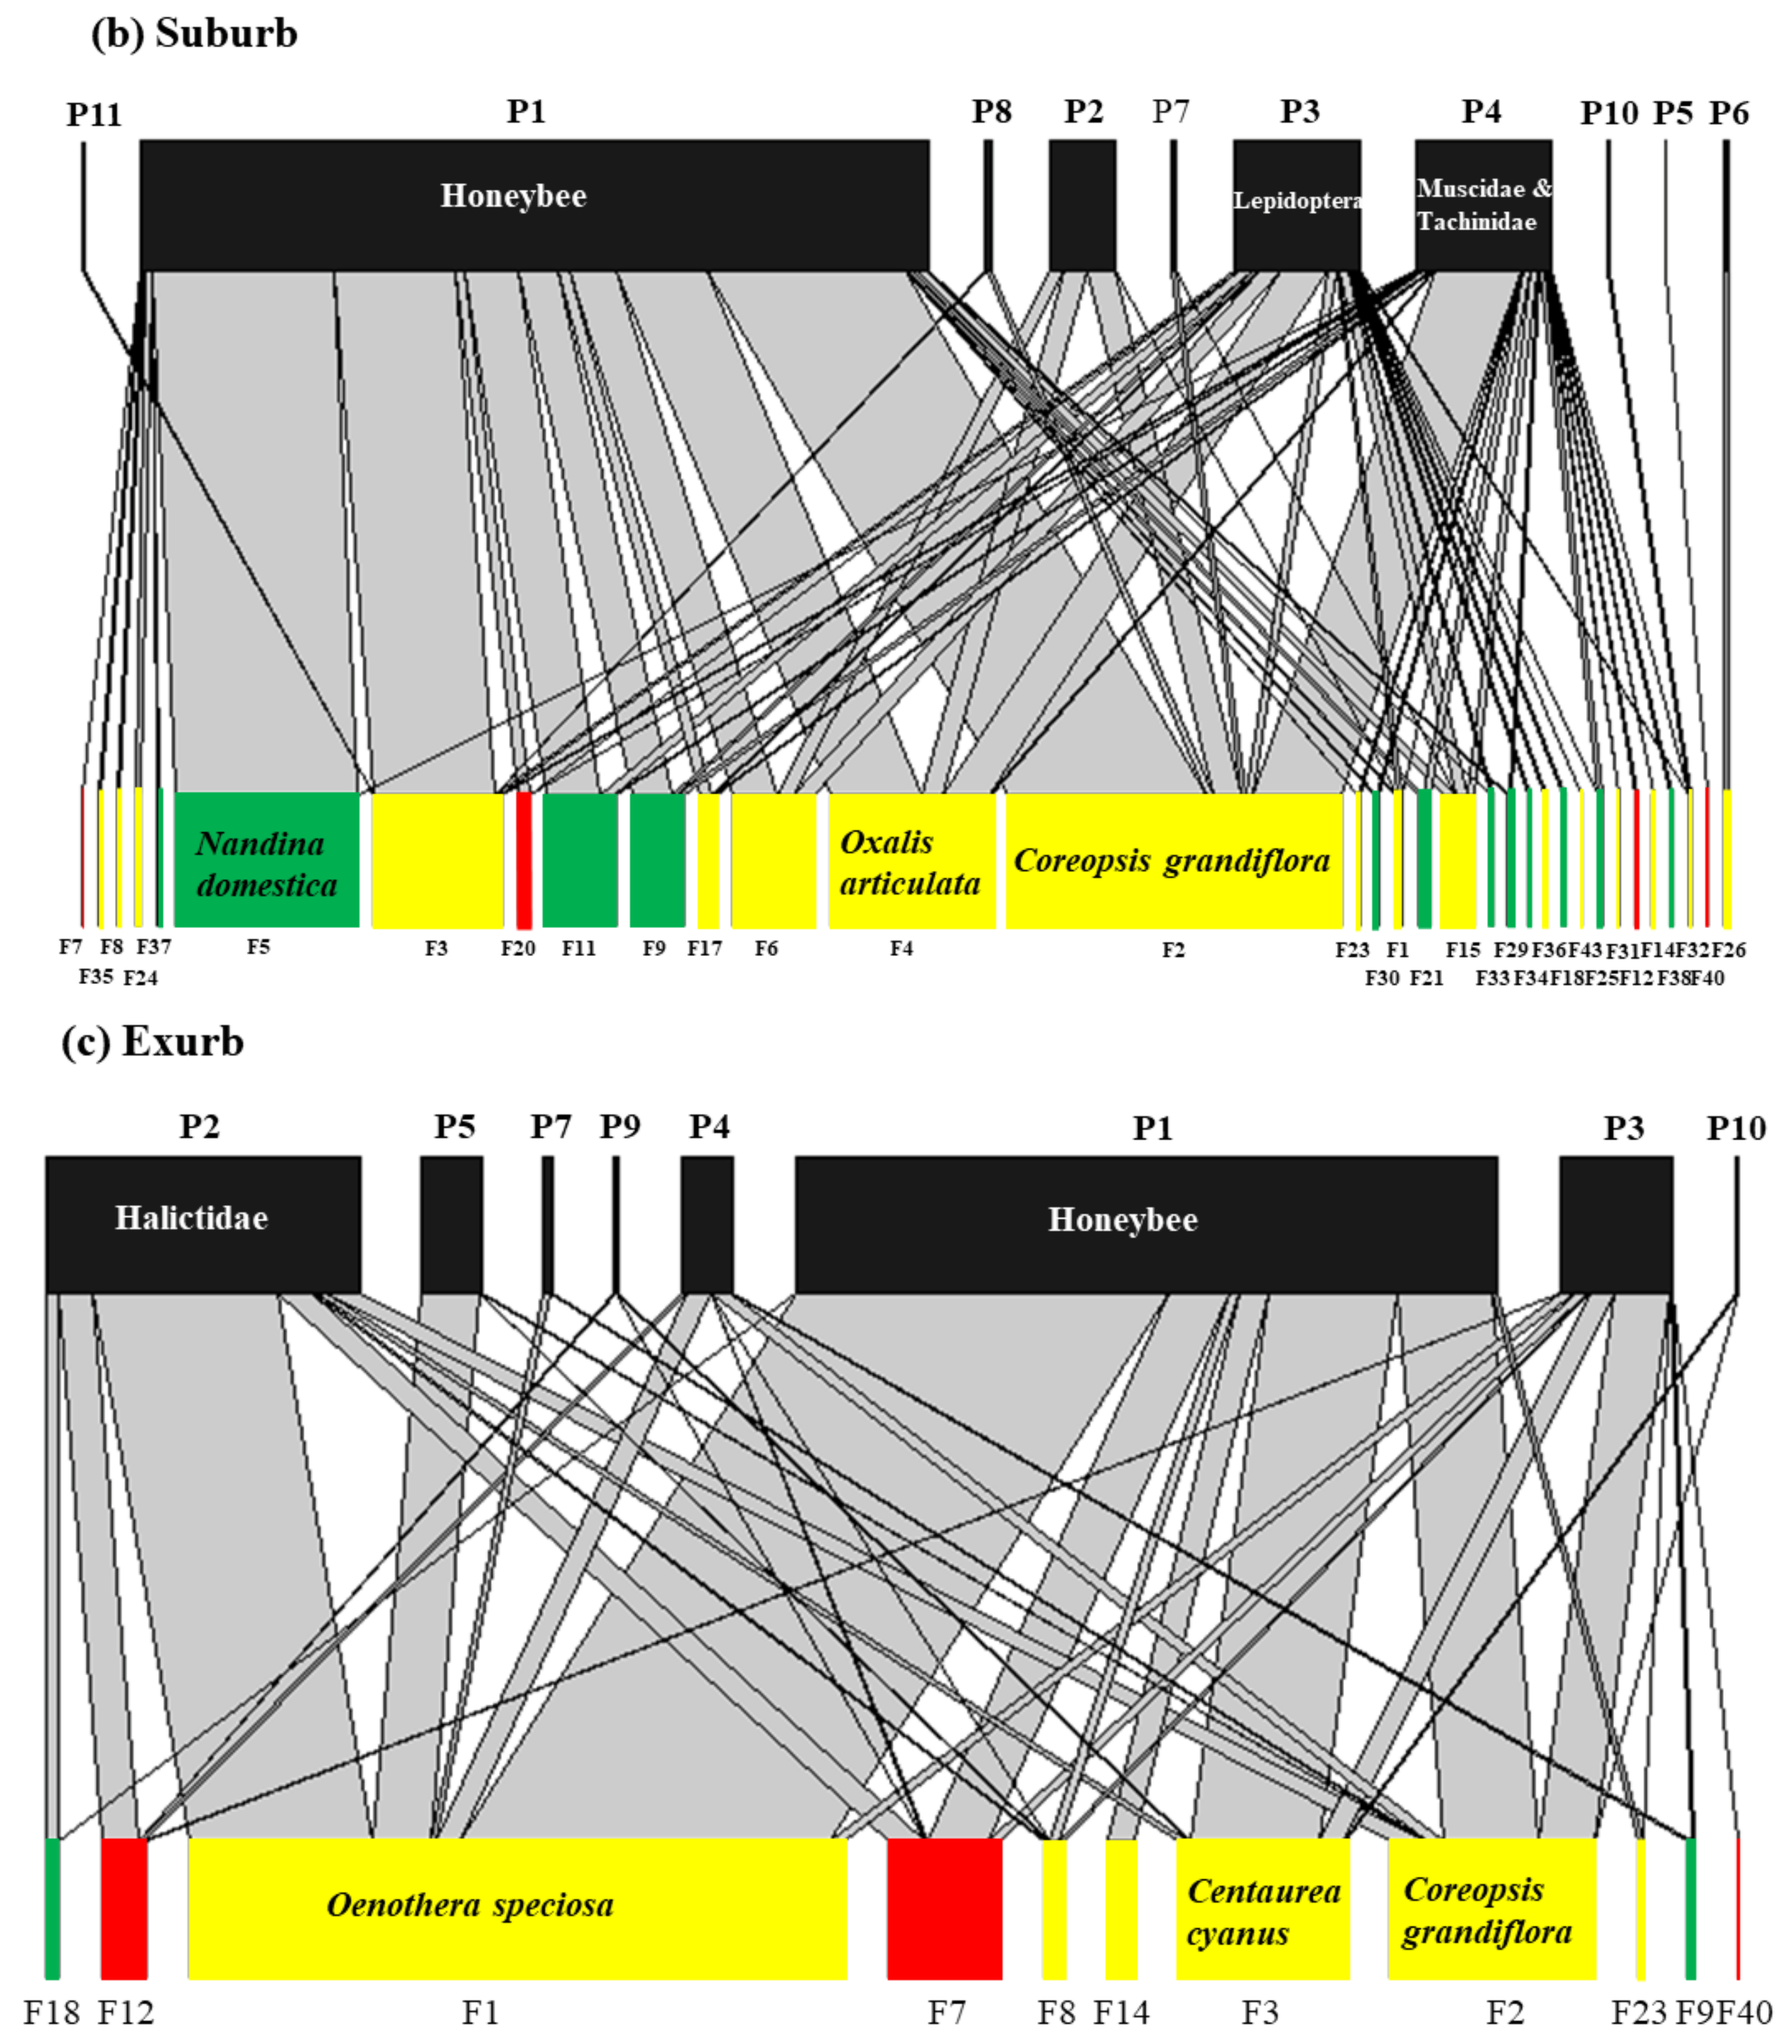
3.4. The Interaction between Flowering Plants and Flower-Visitor Groups under Three Urbanization Levels

The Shannon’s diversity index results of interactions in the City core, Suburb, and Exurb sites were 2.8235, 2.9426, and 2.5174, respectively. The Suburb sites contained the most flower-visitor groups (10 groups) and flowering plant species (34 species), and it had the highest diversity of interactions.
The pollination networks were constructed for three urbanization levels, with a total of 11 flower-visitor groups (P1–P11) and 43 plant species which received visits (F1~F43) (Figure 5, Table 4, Table A2 and Table A3). For the City core, Suburb, and Exurb sites, the Connectance (calculated as the abundance of links/abundance of potential links) was 0.31, 0.21, and 0.38, respectively, indicating that some potential links may have not been observed, especially at the Suburb sites (Table 4). The nestedness of the pollination network (calculated as (100-T)/100, T referring to the matrix temperature) was 0.89, 0.95, and 0.88 for three urbanization levels, indicating that the pollination networks were highly nested (Table 4). The pollination networks were highly generalized. The most connected visitor groups were honeybees, Lepidoptera and Muscidae associated with 30, 29, and 28 plant species, respectively (Table A3). The most connected plant species were Coreopsis grandiflora and Centaurea cyanus, which were visited by eight groups. The most connected native plant species was Nandina domestica, which received visits by four groups, followed by Rosa chinensis, Astragalus sinicus, Cirsium arvense var. integrifolium, Zabelia biflora, and Medicago falcata, which were visited by three visitor groups (Table 5).

4. Discussion

4.1. Effects of the Proportion of Impervious Surface to Flower-Visitor Groups

The results show that the proportion of impervious surface has no significant effect on the number of visits by flower-visitor groups (Table 2). Studies have reported that pollinators tend to prefer (semi-) natural habitats [42], but the visitor groups respond differently to urbanization. Social bees such as honeybees have different individuals specialized for pollen and nectar collection [43,44], and they are more likely to respond to the different spatial and temporal distribution of flower resources. The solitary bees experience landscapes at small scales [45,46], and may be particularly affected by landscape intensification and changing habitat [47]. The number of visits by other groups (Halictidae, Lepidoptera, Muscidae, Formicidae, etc.) was relatively less. The honeybee was the most abundant, and potentially drove the results.
The composition of flower-visitor groups differed in the three urbanization levels. The number of flower-visitor groups was the least in City core, where Vespidae and Ichneumonidae, Formicidae, Coleoptera, Odonata, and Orthoptera were not recorded. Since Vespidae, Formicidae, and Orthoptera are usually omnipresent and are as abundant in cities as in exurbs, this likely indicates a lack of detection due to low sampling effort in the study sites. The diversity of visitor groups negatively correlated with the proportion of impervious surface (Table 3, Figure 4a). This trend is consistent with previous studies. Abbate et al. (2019) found that species richness and diversity of bees were lower in highly urbanized areas [48]. Burdine and McCluney (2019) determined that bee diversity decreased as the proportion of impervious surface increased [49]. Collado et al. (2019) compared species richness and diversity of bees in natural habitats with those in urban core areas and found that natural habitat was better able to maintain bee diversity [42]. Persson et al. (2020) determined that the species richness of wild bees was decreased in densely built-up areas [50]. Our approach of categorizing flower-visitors to functional groups has limitations in clarifying the effect of urbanization on pollinator species, and thus may hardly be compared with findings of previous studies at species level. More studies at a species level would better clarify how different genera or species react to urbanization.

4.2. Effects of Proportion of Green Space on Flower-Visitor Groups

The proportion of green space caused no significant effect on visitation by honeybees, Halictidae, and Lepidoptera, but, contrary to previous studies, it was negatively associated with the number of visits by Muscidae and reduced the diversity of flower-visitor groups (Table 2 and Table 3, Figure 4b). Green space is usually considered to be one of the important habitats for pollinators, and a high proportion of green space can significantly increase the number of pollinators [51,52]. However, studies also found that visitation by honeybees did not decrease as the distance between the study site and semi-natural habitat increased [53,54]. This was likely due to the wider foraging range available and a better adaptation to environmental change [53]. Honeybees were abundant and may have driven the results. Additionally, the low detection of visits by Halictidae, Lepidoptera, and other rare visitor groups increases the difficulty of analyzing the effect of the proportion of green space at our sample sites. The visits by Muscidae and the diversity of flower-visitor groups were negatively associated with the proportion of green space. The probable reason is that, in addition to the size or proportion of green space, the quality of green space also has a significant impact on pollinator visitation. Artificial green space in the city mainly exists in the form of park and residential green space, and only functions as a habitat connector or as temporary habitat. By contrast, natural habitat can better accommodate pollinators as their long-term habitat [42]. Various studies have investigated on how to enhance the habitat value of urban green space. First, ‘Pollinator friendly gardens’, with high flower diversity, abundance, and density, are considered to have a positive impact of maintaining pollinator diversity [24,55]. Second, as the pollinators diverge in active season, the selection of pollinator-attractive flowering plants should consider both the flowering period of plants and the seasonal activity of pollinators [31]. Third, management measures also play important role in pollinator conservation, including reducing the cutting frequency of meadows, retaining wide herbaceous margins and shrub layers with high nectar resources, and avoiding excessive growth in hedgerow height to reduce the barrier effect [25].

4.3. Effects of Night Light Intensity on Flower-Visitors

Night light intensity is caused by the level of urbanization and the magnitude of human activities, and it also has a significantly negative impact on nocturnal pollinators such as moths [56]. The artificial night lights reduce nocturnal pollination and the reproduction of plants. Diurnal pollinators also forage on these plants for food resource, so the effect of night light may extend through the plant–pollination network, and the diurnal pollinators are affected in the long run [27]. In this study, the night light intensity had no significant effect on the number of visits or the diversity of flower-visitor groups (Table 2 and Table 3). This may be due to that no nocturnal pollinators were included in our study. In addition, the regeneration of flowering plants is frequent in urban parks, so the reproduction of certain plant species can’t cause long-term effects on plant–pollinator interactions.

4.4. Effects of Local Flower Density and Flowering Plant Richness to Flower-Visitor Groups

Flower density and the species richness of flowering plants generally have positive effects on pollination, such as increasing pollinator visits [57], and diversity [19,58,59]. In this study, flower density positively correlated with the number of visits by Halictidae (Table 2). Flowering plant species richness was positively associated with the number of visits by Lepidoptera and the diversity of flower-visitor functional groups (Table 2 and Table 3, Figure 4c). Diverse plant resources provide food and nesting resources for more pollinator groups. Studies have shown that high plant species richness has a positive effect on maintaining butterfly species richness due to their rapid response to changes in flowering plant abundance and species richness [60].

4.5. Effects of Urbanization Level on Flowering Plant–Visitor Group Interactions and Core Species

Suburb sites exhibited the highest diversity of interactions. However, the Suburb sites also contained high number of flower-visitor groups and plant species, and because of this, it is possible that some potential links may have been missed (Table 4). Among the three urbanization levels, the pollination networks were asymmetric, highly nested, and generalized. When compared with natural habitats and arable land, the urban areas are occupied by more generalists, which are supported by a higher number of plant species [61].
Core functional groups of flower-visitors (honeybee, Halictidae, Lepidoptera, and Muscidae) contribute the most links (Table A3). Core flowering plants (Oenothera speciosa, Coreopsis grandiflora, Centaurea cyanus, and Oxalis articulata) are exotic plant species and occurred at five, four, three, and four sites, respectively (Table A2). In the urban green space, flower-visitors may adapt and forage on exotic flowering plants, which somewhat enhances pollinator diversity by providing nectar or pollen at certain seasons, when native plants are not actively in flowering period [31,62,63]. However, the presence of attractive exotic and horticulturally modified flowering plants may displace endemic plants that pollinators are adapted to, and compete with native plants for pollinators, thus altering the plant–pollinator network [64,65,66]. The native plant species, Nandina domestica, Rosa chinensis, Astragalus sinicus, Cirsium arvense var. integrifolium, and Zabelia biflora, were relatively attractive to a diversity of visitor groups (Table 5). The use of these native flowering plants can help maintain the stability of flower–pollinator network and mitigate the negative effects of urbanization.

4.6. Effects of Sampling Month to Flower-Visitor Groups

The survey covered three months, during which the plant species, richness, and flower density changed with the seasonal climate. There are significant seasonal differences in the activity of various pollinator groups. Maintaining a diverse set of flower-visitor groups can help meet the pollination needs of different flowering plants.

5. Conclusions

This study has some limitations: Firstly, the approach of identifying flower-visitors to broad taxonomic levels (mostly genus or family) rather than species was inadequate for clarifying the responses of different flower-visitor species to urbanization. The conservation status of different flower-visitor species was ignored. Secondly, most of the interactions were between the abundant plant species and main flower-visitor groups, which are widely distributed and generalized. The sampling effort was not adequate to assess the flower-visitor assemblage of less abundant plants, as well as the effect of urbanization on rare and specialized flower-visitors. Thirdly, in the field survey of flower-visitors, transects in the plot were close, so the same individual may have been counted twice or more. To ensure data independence, transects should ideally be linear.
This study provides suggestions for the planning of urban green spaces and provides a theoretical reference for local vegetation configurations. Improvement of the quality of green spaces (high plant species richness, and flower density) and the use of attractive native flowering plants (such as Nandina domestica, Rosa chinensis, Astragalus sinicus, Cirsium arvense var. integrifolium, and Zabelia biflora) can help to reduce the negative effects of city expansion on pollinator diversity, and enhancing the function of urban green space in sustaining biodiversity and ecosystem stability.

Supplementary Materials

The following supporting information can be downloaded at: https://www.mdpi.com/article/10.3390/d14030208/s1, Table S1: Species list of flower-visitors according to DNA sequence comparisons; Table S2: The visits and diversity of flower-visitors; Table S3: The interaction between plants and flower-visitor groups under three urbanization levels.

Author Contributions

Development of the idea, H.W.; data collection, M.H., N.R. and H.J.; data analysis, M.H., Z.H. and Y.D.; writing-original draft preparation, M.H.; writing-review and editing, H.W., X.L. and P.A.B.; supervision of the project, D.X. All authors have read and agreed to the published version of the manuscript.

Funding

This research was funded by the National Natural Science Foundation of China, grant number 31600189, 32071683.

Institutional Review Board Statement

Not applicable.

Informed Consent Statement

Not applicable.

Data Availability Statement

Data is contained within the supplementary material.

Conflicts of Interest

The authors declare no conflict of interest.

Appendix A

Table A1. Information of Study Sites.
Study SiteLatitudeLongitudeProportion of Impervious SurfaceProportion of GreenspaceAverage Night Light Intensity (DN)
City core
Jiefang Park30.6091114.291187.35%22.87%45141
Shahu Park30.5758114.341681.95%17.13%50630
Luojiashan Parkland30.5379114.356186.32%30.47%30709
Lianhuahu Park30.5517114.274182.58%24.29%38430
Shouyi Cultural Park30.5433114.300684.75%17.45%45896
Zhongshan Park30.5858114.267491.42%8.93%45881
Simeitang Park30.5965114.331382.46%13.07%47913
Suburb
Shizishan Parkland30.4750114.338058.76%27.81%25860
Houxianghe Park30.6115114.248268.63%11.45%47191
Heping Park30.6369114.381462.38%21.31%28522
Wuhan Botanical Garden30.5483114.416053.32%49.76%10606
Dijiao Park30.6655114.333156.96%11.27%21320
Guanshan Holland Park30.4964114.392773.86%12.05%27054
Exurb
Wuhan Garden Expo Park30.6209114.215644.67%28.30%38582
Shimenfeng Park30.5166114.473518.43%51.55%16231
Canglongdao Wetland Park30.4069114.418837.20%19.38%21667
Jiangxia Central Park30.3796114.315944.67%14.10%24925
Zhuyehai Park30.6237114.160745.68%17.89%29033
Tanghu Park30.4727114.155640.86%22.10%22490
Note: Proportion of impervious surface was calculated within a 2000 m radius (excluding water cover) around the parks. Proportion of green space was calculated within a 2000 m radius (excluding water cover) around the study sites. DN refers to digital number of pixel brightness.
Table A2. List of Surveyed Plant Species.
FamilySpeciesRegion of OriginStatusDistribution SitesCode in Pollination Network
AmaryllidaceaeTulbaghia violacea Harv.South Africanon-invasive exoticSuburb (Houxianghe Park, Wuhan Botanical Garden)F36
AmaryllidaceaeZephyranthes carinata HerbertSouth AmericainvasiveSuburb (Wuhan Botanical Garden)F53
AraceaeAcorus calamus L.ChinanativeSuburb (Wuhan Botanical Garden)F34
AsteraceaeCarthamus tinctorius L.Central Asianon-invasive exoticSuburb (Wuhan Botanical Garden)F35
AsteraceaeCentaurea cyanus L.Europe, Russia, north Americanon-invasive exoticSuburb, Exurb (Shizishan Parkland, Wuhan Botanical Garden, Canglongdao Wetland Park)F3
AsteraceaeCirsium arvense var. integrifolium Wimm. & Grab.East and north AsianativeSuburb (Wuhan Botanical Garden)F11
AsteraceaeCoreopsis grandiflora Hogg ex Sw.Americanon-invasive exoticSuburb, Exurb (Houxianghe Park, Dijiao Park, Jiangxia Central Park, Tanghu Park)F2
AsteraceaeCosmos bipinnatus Cav.Mexiconon-invasive exoticCity, Suburb, Exurb (Shouyi Cultural Park, Shizishan Parkland, Houxianghe Park, Wuhan Garden Expo Park)F8
AsteraceaeErigeron annuus (L.) Pers.North AmericainvasiveCity, Suburb, Exurb (Jiefang Park, Houxianghe Park, Canglongdao Wetland Park, Jiangxia Central Park, Tanghu Park)F12
AsteraceaeEuryops pectinatus (L.) Cass.South Africanon-invasive exoticSuburb (Houxianghe Park)F17
AsteraceaeHelianthus annuus L.North Americanon-invasive exoticSuburb (Houxianghe Park)F26
AsteraceaeLeucanthemum vulgare Lam.West Europenon-invasive exoticSuburb, Exurb (Houxianghe Park, Jiangxia Central Park)F15
AsteraceaeSanvitalia procumbens Lam.Mexiconon-invasive exoticSuburb, Exurb (Shizishan Parkland, Canglongdao Wetland Park)F23
AsteraceaeSilybum marianum (L.) Gaertn.Europe, Mediterranean, north Africa, central AsiainvasiveSuburb (Wuhan Botanical Garden)F48
AsteraceaeTagetes erecta L.Mexiconon-invasive exoticCity, Suburb (Shouyi Cultural Park, Houxianghe Park)F31
AsteraceaeTaraxacum mongolicum Hand.-Mazz.China, north Korea, Mongolia, RussianativeCity (Shahu Park, Lianhuahu Park)F28
BerberidaceaeNandina domestica Thunb.ChinanativeCity, Suburb (Jiefang Park, Lianhuahu Park, Guanshan Holland Park)F5
CampanulaceaePlatycodon grandiflorus (Jacq.) A. DC.East and north AsianativeSuburb (Wuhan Botanical Garden)F51
CannaceaeCanna indica L.Japannon-invasive exoticSuburb (Wuhan Botanical Garden)F52
CaprifoliaceaeWeigela florida (Bunge) A. DC.China, japan, india, americanativeCity (Shahu Park)F44
CaprifoliaceaeZabelia biflora (Turcz.) MakinoChina, koreanativeSuburb, Exurb (Wuhan Botanical Garden, Tanghu Park)F18
CaryophyllaceaeDianthus chinensis L.ChinanativeSuburb (Houxianghe Park)F29
CaryophyllaceaeVaccaria hispanica (Miller) RauschertEurope, asianativeSuburb (Shizishan Parkland)F38
CrassulaceaeSedum lineare Thunb.China, japan, vietnamnativeSuburb (Houxianghe Park)F25
CruciferaeOrychophragmus violaceus (Linnaeus) O. E. SchulzChina, north KoreanativeSuburb (Shizishan Parkland)F37
GeraniaceaeGeranium carolinianum L.AmericainvasiveCity (Lianhuahu Park)F46
LamiaceaeSalvia miltiorrhiza BungeChina, japannativeSuburb (Wuhan Botanical Garden)F47
LamiaceaeScutellaria barbata D. DonIndia, nepal, myanmar, laos, thailandnon-invasive exoticCity (Shouyi Cultural Park)F42
LeguminosaeAstragalus sinicus L.ChinanativeCity (Luojiashan Parkland)F10
LeguminosaeMedicago falcata L.ChinanativeCity (Shahu Park, Luojiashan Parkland, Lianhuahu Park)F22
LeguminosaeTrifolium pratense L.Central EuropeinvasiveCity (Shahu Park)F16
LeguminosaeTrifolium repens L.Europe, north AfricainvasiveCity, Suburb, Exurb (Simeitang Park, Houxianghe Park, Zhuyehai Park, Tanghu Park)F7
LiliaceaeHemerocallis fulva (L.) L.China, south EuropenativeSuburb (Wuhan Botanical Garden)F33
LiliaceaeOphiopogon japonicus (L. f.) Ker-Gawl.China, japan, vietnam, indianativeCity (Shahu Park)F50
LythraceaeCuphea hookeriana Walp.Mexiconon-invasive exoticCity, Suburb (Lianhuahu Park, Houxianghe Park)F6
MalvaceaeAlcea rosea LinnaeusChinanativeSuburb (Wuhan Botanical Garden)F30
OleaceaeLigustrum sinense Lour.ChinanativeSuburb (Houxianghe Park)F21
OnagraceaeOenothera biennis L.North AmericainvasiveSuburb (Wuhan Botanical Garden)F20
OnagraceaeOenothera speciosa Nutt.Americanon-invasive exoticSuburb, Exurb (Shizishan Parkland, Wuhan Botanical Garden, Wuhan Garden Expo Park, Zhuyehai Park, Tanghu Park)F1
OxalidaceaeOxalis articulata SavignySouth Americanon-invasive exoticCity, Suburb (Shahu Park, Lianhuahu Park, Simeitang Park, Wuhan Botanical GardenF4
OxalidaceaeOxalis corniculata L.Temperate and subtropical Asia, Europe, Mediterranean, north AmericanativeCity (Lianhuahu Park)F49
PapaveraceaePapaver rhoeas L.Europenon-invasive exoticSuburb, Exurb (Shizishan Parkland, Wuhan Garden Expo Park, Canglongdao Wetland Park)F14
PlantaginaceaePlantago depressa Willd.China, north Korea, Russia, KazakhstannativeExurb (Canglongdao Wetland Park)F45
PlantaginaceaeVeronica persica Poir.Western Asia, EuropeinvasiveCity, Suburb, Exurb (Lianhuahu Park, Simeitang Park, Wuhan Botanical Garden, Wuhan Garden Expo Park)F39
PortulacaceaePortulaca grandiflora Hook.Brazilnon-invasive exoticCity (Shouyi Cultural Park)F27
RosaceaeKerria japonica (L.) DC.China, japannativeCity (Lianhuahu Park)F41
RosaceaeRosa chinensis Jacq.ChinanativeCity, Suburb, Exurb (Jiefang Park, Zhongshan Park, Houxianghe Park, Heping Park, Guanshan Holland Park, Shimenfeng Park)F9
SaxifragaceaeHeuchera micrantha DouglasCenral americanon-invasive exoticSuburb (Houxianghe Park)F43
SolanaceaePetunia × atkinsiana D. Don ex LoudonSouth Americanon-invasive exoticCity (Zhongshan ParkF19
UmbelliferaeCoriandrum sativum L.Mediterraneannon-invasive exoticSuburb (Wuhan Botanical Garden)F24
UmbelliferaeDaucus carota L.EuropeinvasiveSuburb, Exurb (Wuhan Botanical Garden, Canglongdao Wetland Park)F40
VerbenaceaeGlandularia × hybrida (Groenland & Rümpler) G. L.Nesom & PruskiPanama, honduras, venezuelanon-invasive exoticSuburb (Houxianghe Park)F32
ViolaceaeViola cornuta Desf.Europenon-invasive exoticCity (Zhongshan Park)F13
Table A3. Code and Links of Flower-Visitor Functional Groups in Pollination Network.
Code in NetworkFunctional GroupsNumber of LinksNumber of Linked Plant SpeciesNormalised Degree
P1Honeybee2534300.6977
P2Halictidae625100.2326
P3Lepidoptera449290.6744
P4Muscidae and Tachinidae335280.6512
P5Formicidae9240.0930
P6Anthophora spp.3530.0698
P7Coleoptera1730.0698
P8Syrphidae1530.0698
P9Vespidae and Ichneumonidae630.0698
P10Odonata530.0698
P11Orthoptera210.0233

References

  1. Garibaldi, L.A.; Steffan-Dewenter, I.; Winfree, R.; Aizen, M.A.; Bommarco, R.; Cunningham, S.A.; Kremen, C.; Carvalheiro, L.G.; Harder, L.D.; Afik, O.; et al. Wild Pollinators Enhance Fruit Set of Crops Regardless of Honey Bee Abundance. Science 2013, 339, 1608–1611. [Google Scholar] [CrossRef] [PubMed]
  2. Goulson, D.; Lye, G.C.; Darvill, B. Decline and Conservation of Bumble Bees. Annu. Rev. Ѐntomol. 2008, 53, 191–208. [Google Scholar] [CrossRef] [PubMed]
  3. Bartomeus, I.; Ascher, J.S.; Gibbs, J.; Danforth, B.N.; Wagner, D.L.; Hedtke, S.M.; Winfree, R. Historical changes in northeastern US bee pollinators related to shared ecological traits. Proc. Natl. Acad. Sci. USA 2013, 110, 4656–4660. [Google Scholar] [CrossRef] [PubMed] [Green Version]
  4. Carvalheiro, L.G.; Kunin, W.E.; Keil, P.; Aguirre-Gutiérrez, J.; Ellis, W.N.; Fox, R.; Groom, Q.; Hennekens, S.; Van Landuyt, W.; Maes, D.; et al. Species richness declines and biotic homogenisation have slowed down for NW-European pollinators and plants. Ecol. Lett. 2013, 16, 870–878. [Google Scholar] [CrossRef] [PubMed] [Green Version]
  5. Goulson, D.; Nicholls, E.; Botías, C.; Rotheray, E.L. Bee declines driven by combined stress from parasites, pesticides, and lack of flowers. Science 2015, 347, 1255957. [Google Scholar] [CrossRef] [PubMed]
  6. Johansson, V.; Gustafsson, L.; Andersson, P.; Hylander, K. Fewer butterflies and a different composition of bees, wasps and hoverflies on recently burned compared to unburned clear-cuts, regardless of burn severity. For. Ecol. Manag. 2020, 463, 118033. [Google Scholar] [CrossRef]
  7. Hallmann, C.A.; Sorg, M.; Jongejans, E.; Siepel, H.; Hofland, N.; Schwan, H.; Stenmans, W.; Müller, A.; Sumser, H.; Hörren, T.; et al. More than 75 percent decline over 27 years in total flying insect biomass in protected areas. PLoS ONE 2017, 12, e0185809. [Google Scholar] [CrossRef] [Green Version]
  8. Cameron, S.A.; Lozier, J.D.; Strange, J.P.; Koch, J.B.; Cordes, N.; Solter, L.F.; Griswold, T.L. Patterns of widespread decline in North American bumble bees. Proc. Natl. Acad. Sci. USA 2011, 108, 662–667. [Google Scholar] [CrossRef] [Green Version]
  9. Potts, S.G.; Biesmeijer, J.C.; Kremen, C.; Neumann, P.; Schweiger, O.; Kunin, W.E. Global pollinator declines: Trends, impacts and drivers. Trends Ecol. Evol. 2010, 25, 345–353. [Google Scholar] [CrossRef]
  10. González-Varo, J.P.; Biesmeijer, J.C.; Bommarco, R.; Potts, S.G.; Schweiger, O.; Smith, H.G.; Steffan-Dewenter, I.; Szentgyörgyi, H.; Woyciechowski, M.; Vilà, M. Combined effects of global change pressures on animal-mediated pollination. Trends Ecol. Evol. 2013, 28, 524–530. [Google Scholar] [CrossRef] [Green Version]
  11. Wagner, D.L.; Van Driesche, R.G. Threats Posed to Rare or Endangered Insects by Invasions of Nonnative Species. Annu. Rev. Ѐntomol. 2010, 55, 547–568. [Google Scholar] [CrossRef] [PubMed]
  12. Ahrné, K.; Bengtsson, J.; Elmqvist, T. Bumble Bees (Bombus spp.) along a gradient of increasing urbanization. PLoS ONE 2009, 4, 1–9. [Google Scholar] [CrossRef] [PubMed] [Green Version]
  13. Wang, M.; Li, J.; Kuang, S.; He, Y.; Chen, G.; Huang, Y.; Song, C.; Anderson, P.; Łowicki, D. Plant Diversity along the Urban-Rural Gradient and Its Relationship with Urbanization Degree in Shanghai, China. Forests 2020, 11, 171. [Google Scholar] [CrossRef] [Green Version]
  14. McKinney, M.L. Urbanization, Biodiversity, and Conservation. Bioscience 2002, 52, 883–888. [Google Scholar] [CrossRef]
  15. Tscharntke, T.; Klein, A.M.; Kruess, A.; Steffan-Dewenter, I.; Thies, C. Landscape perspectives on agricultural intensification and biodiversity—Ecosystem service management. Ecol. Lett. 2005, 8, 857–874. [Google Scholar] [CrossRef]
  16. Geslin, B.; Gauzens, B.; Thébault, E.; Dajoz, I. Plant Pollinator Networks along a Gradient of Urbanisation. PLoS ONE 2013, 8, e63421. [Google Scholar] [CrossRef]
  17. Fortel, L.; Henry, M.; Guilbaud, L.; Guirao, A.L.; Kuhlmann, M.; Mouret, H.; Rollin, O.; Vaissière, B.E. Decreasing Abundance, Increasing Diversity and Changing Structure of the Wild Bee Community (Hymenoptera: Anthophila) along an Urbanization Gradient. PLoS ONE 2014, 9, e104679. [Google Scholar] [CrossRef]
  18. Winfree, R.; Aguilar, R.; Vázquez, D.P.; Lebuhn, G.; Aizen, M.A. A meta-analysis of bees’ responses to anthropogenic disturbance. Ecology 2009, 90, 2068–2076. [Google Scholar] [CrossRef] [PubMed]
  19. Hausmann, S.L.; Petermann, J.; Rolff, J. Wild bees as pollinators of city trees. Insect Conserv. Divers. 2016, 9, 97–107. [Google Scholar] [CrossRef]
  20. Theodorou, P.; Radzeviciute, R.; Settele, J.; Schweiger, O.; Murray, T.E.; Paxton, R.J. Pollination services enhanced with urbanization despite increasing pollinator parasitism. Proc. R. Soc. B Boil. Sci. 2016, 283, 20160561. [Google Scholar] [CrossRef] [Green Version]
  21. Goulson, D.; Hughes, W.; Derwent, L.C.; Stout, J. Colony growth of the bumblebee, Bombus terrestris, in improved and conventional agricultural and suburban habitats. Oecologia 2002, 130, 267–273. [Google Scholar] [CrossRef] [PubMed]
  22. Osborne, J.L.; Martin, A.P.; Shortall, C.R.; Todd, A.D.; Goulson, D.; Knight, M.E.; Hale, R.J.; Sanderson, R.A. Quantifying and comparing bumblebee nest densities in gardens and countryside habitats. J. Appl. Ecol. 2008, 45, 784–792. [Google Scholar] [CrossRef]
  23. Goulson, D.; Lepais, O.; O’Connor, S.; Osborne, J.L.; Sanderson, R.A.; Cussans, J.; Goffe, L.; Darvill, B. Effects of land use at a landscape scale on bumblebee nest density and survival. J. Appl. Ecol. 2010, 47, 1207–1215. [Google Scholar] [CrossRef] [Green Version]
  24. Majewska, A.A.; Altizer, S. Planting gardens to support insect pollinators. Conserv. Biol. 2018, 34, 15–25. [Google Scholar] [CrossRef]
  25. Luppi, M.; Dondina, O.; Orioli, V.; Bani, L. Local and landscape drivers of butterfly richness and abundance in a human-dominated area. Agric. Ecosyst. Environ. 2018, 254, 138–148. [Google Scholar] [CrossRef]
  26. Bubová, T.; Vrabec, V.; Kulma, M.; Nowicki, P. Land management impacts on European butterflies of conservation concern: A review. J. Insect Conserv. 2015, 19, 805–821. [Google Scholar] [CrossRef] [Green Version]
  27. Knop, E.; Zoller, L.; Ryser, R.; Gerpe, C.; Hörler, M.; Fontaine, C. Artificial light at night as a new threat to pollination. Nat. 2017, 548, 206–209. [Google Scholar] [CrossRef]
  28. Giavi, S.; Fontaine, C.; Knop, E. Impact of artificial light at night on diurnal plant-pollinator interactions. Nat. Commun. 2021, 12, 1690. [Google Scholar] [CrossRef]
  29. Venjakob, C.; Klein, A.-M.; Ebeling, A.; Tscharntke, T.; Scherber, C. Plant diversity increases spatio-temporal niche complementarity in plant-pollinator interactions. Ecol. Evol. 2016, 6, 2249–2261. [Google Scholar] [CrossRef] [Green Version]
  30. Garbuzov, M.; Ratnieks, F.L.W. Quantifying variation among garden plants in attractiveness to bees and other flower-visiting insects. Funct. Ecol. 2014, 28, 364–374. [Google Scholar] [CrossRef]
  31. Tasker, P.; Reid, C.; Young, A.D.; Threlfall, C.G.; Latty, T. If you plant it, they will come: Quantifying attractiveness of exotic plants for winter-active flower visitors in community gardens. Urban Ecosyst. 2020, 23, 345–354. [Google Scholar] [CrossRef]
  32. Gong, Y.-B.; Huang, S.-Q. Temporal stability of pollinator preference in an alpine plant community and its implications for the evolution of floral traits. Oecologia 2011, 166, 671–680. [Google Scholar] [CrossRef] [PubMed]
  33. Wuhan Natural Resources and Planning Bureau. Wuhan’s General Plan for Land Use (2006–2020). 2011. Available online: http://zrzyhgh.wuhan.gov.cn/ (accessed on 20 January 2022).
  34. Gong, P.; Liu, H.; Zhang, M.; Li, C.; Wang, J.; Huang, H.; Clinton, N.; Ji, L.; Li, W.; Bai, Y.; et al. Stable classification with limited sample: Transferring a 30-m resolution sample set collected in 2015 to mapping 10-m resolution global land cover in 2017. Sci. Bull. 2019, 64, 370–373. [Google Scholar] [CrossRef] [Green Version]
  35. Hagen, M.; Wikelski, M.; Kissling, W.D. Space Use of Bumblebees (Bombus spp.) Revealed by Radio-Tracking. PLoS ONE 2011, 6, e19997. [Google Scholar] [CrossRef] [PubMed]
  36. Glaum, P.; Simao, M.-C.; Vaidya, C.; Fitch, G.; Iuliano, B. Big city Bombus: Using natural history and land-use history to find significant environmental drivers in bumble-bee declines in urban development. R. Soc. Open Sci. 2017, 4, 170156. [Google Scholar] [CrossRef] [Green Version]
  37. Xie, Q.J.; Chen, K.L.; Jin, G. Quantifying urbanization and its impact on urban heat island effect in Wuhan. Sci. Surv. Mapp. 2017, 42, 71–76+87. (In Chinese) [Google Scholar]
  38. McKinney, M.L. Effects of urbanization on species richness: A review of plants and animals. Urban Ecosyst. 2008, 11, 161–176. [Google Scholar] [CrossRef]
  39. Baldock, K.C.R.; Goddard, M.; Hicks, D.M.; Kunin, W.E.; Mitschunas, N.; Osgathorpe, L.M.; Potts, S.G.; Robertson, K.M.; Scott, A.V.; Stone, G.; et al. Where is the UK’s pollinator biodiversity? The importance of urban areas for flower-visiting insects. Proc. R. Soc. B Boil. Sci. 2015, 282, 20142849. [Google Scholar] [CrossRef] [Green Version]
  40. Catalogue of Life. Available online: https://www.catalogueoflife.org/ (accessed on 20 January 2022).
  41. Invasive Alien Species of China (ISAC). Available online: https://www.plantplus.cn/ias/protlist (accessed on 20 January 2022).
  42. Collado, M.Á.; Sol, D.; Bartomeus, I. Bees use anthropogenic habitats despite strong natural habitat preferences. Divers. Distrib. 2019, 25, 924–935. [Google Scholar] [CrossRef] [Green Version]
  43. Ollerton, J.; Waser, N.M. Plant-Pollinator Interactions: From Specialization to Generalization; University of Chicago Press: Chicago, IL, USA, 2006. [Google Scholar]
  44. Klein, S.; Pasquaretta, C.; He, X.J.; Perry, C.; Søvik, E.; Devaud, J.-M.; Barron, A.B.; Lihoreau, M. Honey bees increase their foraging performance and frequency of pollen trips through experience. Sci. Rep. 2019, 9, 6778. [Google Scholar] [CrossRef]
  45. Gathmann, A.; Tscharntke, T. Foraging ranges of solitary bees. J. Anim. Ecol. 2002, 71, 757–764. [Google Scholar] [CrossRef]
  46. Zurbuchen, A.; Cheesman, S.; Klaiber, J.; Müller, A.; Hein, S.; Dorn, S. Long foraging distances impose high costs on offspring production in solitary bees. J. Anim. Ecol. 2010, 79, 674–681. [Google Scholar] [CrossRef]
  47. Le Féon, V.; Schermann-Legionnet, A.; Delettre, Y.; Aviron, S.; Billeter, R.; Bugter, R.; Hendrickx, F.; Burel, F. Intensification of agriculture, landscape composition and wild bee communities: A large scale study in four European countries. Agric. Ecosyst. Environ. 2010, 137, 143–150. [Google Scholar] [CrossRef]
  48. Abbate, A.; Campbell, J.W.; Kimmel, C.B.; Kern, W.H. Urban development decreases bee abundance and diversity within coastal dune systems. Glob. Ecol. Conserv. 2019, 20, e00711. [Google Scholar] [CrossRef]
  49. Burdine, J.D.; McCluney, K.E. Interactive effects of urbanization and local habitat characteristics influence bee communities and flower visitation rates. Oecologia 2019, 190, 715–723. [Google Scholar] [CrossRef]
  50. Persson, A.S.; Ekroos, J.; Olsson, P.; Smith, H.G. Wild bees and hoverflies respond differently to urbanisation, human population density and urban form. Landsc. Urban Plan. 2020, 204, 103901. [Google Scholar] [CrossRef]
  51. Kratschmer, S.; Pachinger, B.; Schwantzer, M.; Paredes, D.; Guernion, M.; Burel, F.; Nicolai, A.; Strauss, P.; Bauer, T.; Kriechbaum, M.; et al. Tillage intensity or landscape features: What matters most for wild bee diversity in vineyards? Agric. Ecosyst. Environ. 2018, 266, 142–152. [Google Scholar] [CrossRef]
  52. Beyer, N.; Gabriel, D.; Kirsch, F.; Schulz-Kesting, K.; Dauber, J.; Westphal, C. Functional groups of wild bees respond differently to faba bean Vicia faba L. cultivation at landscape scale. J. Appl. Ecol. 2020, 57, 2499–2508. [Google Scholar] [CrossRef]
  53. Garibaldi, L.A.; Steffan-Dewenter, I.; Kremen, C.; Morales, J.M.; Bommarco, R.; Cunningham, S.; Carvalheiro, L.G.; Chacoff, N.P.; Dudenhöffer, J.-H.; Greenleaf, S.S.; et al. Stability of pollination services decreases with isolation from natural areas despite honey bee visits. Ecol. Lett. 2011, 14, 1062–1072. [Google Scholar] [CrossRef]
  54. Rader, R.; Bartomeus, I.; Garibaldi, L.A.; Garratt, M.P.D.; Howlett, B.G.; Winfree, R.; Cunningham, S.A.; Mayfield, M.M.; Arthur, A.D.; Andersson, G.K.S.; et al. Non-bee insects are important contributors to global crop pollination. Proc. Natl. Acad. Sci. USA 2016, 113, 146–151. [Google Scholar] [CrossRef] [Green Version]
  55. Threlfall, C.G.; Walker, K.; Williams, N.S.; Hahs, A.K.; Mata, L.; Stork, N.; Livesley, S.J. The conservation value of urban green space habitats for Australian native bee communities. Biol. Conserv. 2015, 187, 240–248. [Google Scholar] [CrossRef]
  56. MacGregor, C.J.; Pocock, M.J.O.; Fox, R.; Evans, D.M. Pollination by nocturnal L epidoptera, and the effects of light pollution: A review. Ecol. Ѐntomol. 2015, 40, 187–198. [Google Scholar] [CrossRef] [PubMed] [Green Version]
  57. Ghazoul, J. Floral diversity and the facilitation of pollination. J. Ecol. 2006, 94, 295–304. [Google Scholar] [CrossRef]
  58. Blaauw, B.R.; Isaacs, R. Larger patches of diverse floral resources increase insect pollinator density, diversity, and their pollination of native wildflowers. Basic Appl. Ecol. 2014, 15, 701–711. [Google Scholar] [CrossRef]
  59. Vrdoljak, S.M.; Samways, M.J.; Simaika, J.P. Pollinator conservation at the local scale: Flower density, diversity and community structure increase flower visiting insect activity to mixed floral stands. J. Insect Conserv. 2016, 20, 711–721. [Google Scholar] [CrossRef]
  60. Myers, M.C.; Hoksch, B.J.; Mason, J.T. Butterfly response to floral resources during early establishment at a heterogeneous prairie biomass production site in Iowa, USA. J. Insect Conserv. 2012, 16, 457–472. [Google Scholar] [CrossRef]
  61. Theodorou, P.; Albig, K.; Radzeviciute, R.; Settele, J.; Schweiger, O.; Murray, T.E.; Paxton, R. The structure of flower visitor networks in relation to pollination across an agricultural to urban gradient. Funct. Ecol. 2017, 31, 838–847. [Google Scholar] [CrossRef]
  62. Senapathi, D.; Goddard, M.; Kunin, W.E.; Baldock, K.C.R. Landscape impacts on pollinator communities in temperate systems: Evidence and knowledge gaps. Funct. Ecol. 2017, 31, 26–37. [Google Scholar] [CrossRef] [Green Version]
  63. Stelzer, R.J.; Chittka, L.; Carlton, M.; Ings, T.C. Winter Active Bumblebees (Bombus terrestris) Achieve High Foraging Rates in Urban Britain. PLoS ONE 2010, 5, e9559. [Google Scholar] [CrossRef] [Green Version]
  64. Grass, I.; Berens, D.G.; Peter, F.; Farwig, N. Additive effects of exotic plant abundance and land-use intensity on plant–pollinator interactions. Oecologia 2013, 173, 913–923. [Google Scholar] [CrossRef]
  65. Stout, J.C.; Tiedeken, E.J. Direct interactions between invasive plants and native pollinators: Evidence, impacts and approaches. Funct. Ecol. 2017, 31, 38–46. [Google Scholar] [CrossRef] [Green Version]
  66. Hansen, S.; Roets, F.; Seymour, C.L.; Thébault, E.; Van Veen, F.F.; Pryke, J.S. Alien plants have greater impact than habitat fragmentation on native insect flower visitation networks. Divers. Distrib. 2018, 24, 58–68. [Google Scholar] [CrossRef] [Green Version]
Figure 1. Location of the study sites. (a) The location of Wuhan City in Hubei Province, central China. (b) The location of 19 study sites in Wuhan. (c) The categories of urbanization level based on the proportion of impervious surface.
Diversity 14 00208 g001
Figure 2. Transect route of flower-visitor survey.
Diversity 14 00208 g002
Figure 3. The effects of sampling time on the number of visits by (a) All flower visitors, (b) Non-honeybee visitors, (c) Honeybee, (d) Halictidae, (e) Lepidoptera, (f) Muscidae. Boxes with different capital letters indicate significant differences among three sampling months according to GLMMs (p < 0.05).
Diversity 14 00208 g003
Figure 4. The correlation between diversity of flower-visitor functional groups and (a) Proportion of impervious surface, (b) Proportion of green space, (c) Flower plant species richness according to GLMMs.
Diversity 14 00208 g004
Figure 5. Visualization of the pollination networks of (a) City core, (b) Suburb, and (c) Exurb. The width of the lines connecting species is scaled to the number of links. Refer to Table A2 and Table A3 for the code of plant species and flower-visitor groups in network.
Diversity 14 00208 g005aDiversity 14 00208 g005b
Table 1. Description of landscape and local factors.
FactorScaleDescriptionLevel
Proportion of impervious surfacer = 2000 mProportion of impervious surface around the park, as an indicator of urbanization levelContinuous variable, 0–100%
Proportion of green spacer = 2000 mProportion of green space around the study site, including parkland, protective green space, affiliated green space, regional green space, and other typesContinuous variable, 0–100%
Night light intensityr = 2000 mAverage brightness of night light around the sitesContinuous variable
Density of flowers20 m × 20 m plotNumber of flowers per m2Continuous variable
Species richness of flowering plant20 m × 20 m plotNumber of flowering plant speciesDiscrete variable
Sampling time The month of field surveyNominal variable, May, June, July
Table 2. Effects of fixed factors on the number of visits by flower-visitor groups (GLMMs).
TermFactorFixed CoefficientFp
All flower-visitorsProportion of impervious surface−1.5790.6660.419
Sampling time3.3650.043 *
Proportion of green space−2.5560.7720.384
Night light intensity<−0.0010.1760.677
Local flower density0.0010.1550.696
Flowering plant species richness0.1542.0010.164
Non-honeybee visitorsProportion of impervious surface−2.3091.4100.241
Sampling time0.3380.715
Proportion of green space−4.4992.3720.131
Night light intensity<−0.0010.5300.471
Local flower density0.0031.0210.318
Flowering plant species richness0.1862.9130.095
HoneybeeProportion of impervious surface−2.0671.7220.196
Sampling time7.5540.001 ***
Proportion of green space0.2500.0110.917
Night light intensity<0.0010.1210.730
Local flower density−0.0010.0370.848
Flowering plant species richness0.1191.6010.212
HalictidaeProportion of impervious surface1.1210.1520.699
Sampling time1.2880.286
Proportion of green space−1.6070.1340.716
Night light intensity<−0.0010.0430.837
Local flower density0.00447.175<0.001 ***
Flowering plant species richness−0.1160.4480.507
LepidopteraProportion of impervious surface−1.1080.2650.609
Sampling time0.5250.595
Proportion of green space−3.4001.1010.300
Night light intensity<−0.0010.6410.428
Local flower density0.0041.6730.202
Flowering plant species richness0.2986.3170.016 *
MuscidaeProportion of impervious surface−1.0230.3480.558
Sampling time10.366<0.001 ***
Proportion of green space−5.3844.3930.042 *
Night light intensity<−0.0012.0870.155
Local flower density0.0020.3640.549
Flowering plant species richness−0.0050.0030.956
Note: * p < 0.05, *** p < 0.01.
Table 3. Effects of fixed factors on the diversity of flower-visitor functional group (GLMM).
FactorFixed CoefficientFp
Proportion of impervious surface−1.1794.8470.033 *
Sampling time0.1720.842
Proportion of green space−1.8645.2230.027 *
Night light intensity<0.0010.0080.929
Local flower density<0.0010.1990.658
Flowering plant species richness0.0725.0050.030 *
Note: * p < 0.05, *** p < 0.01.
Table 4. Metrics of pollination networks of three urbanization levels.
MetricsCitySuburbExurbTotal
Functional groups of flower-visitors610811
Plant Species18341343
Links754143319284115
Max links of flower-visitor groups46299410782534
Max links of plants17742010091018
Abundance of links397040117
Abundance of potential links126340104473
Connectance0.310.210.380.24
Matrix temperature10.805.1612.126.25
Nestedness0.890.950.880.94
Table 5. Code and links of native plant species in pollination network.
Code in NetworkPlant SpeciesNumber of LinksNumber of Linked Pollinator GroupsNormalized Degree
F5Nandina domestica26940.3636
F9Rosa chinensis13530.2727
F10Astragalus sinicus8930.2727
F11Cirsium arvense var. integrifolium8730.2727
F18Zabelia biflora1930.2727
F21Ligustrum sinense1420.1818
F22Medicago falcata1230.2727
F25Sedum lineare720.1818
F28Taraxacum mongolicum410.0909
F29Dianthus chinensis420.1818
F30Alcea rosea Linnaeus420.1818
F33Hemerocallis fulva320.1818
F34Acorus calamus310.0909
F37Orychophragmus violaceus210.0909
F38Vaccaria hispanica210.0909
F41Kerria japonica220.1818
Publisher’s Note: MDPI stays neutral with regard to jurisdictional claims in published maps and institutional affiliations.

