

Plant Diversity along an Urbanization Gradient of a Tropical City
 ,
,
Abstract
: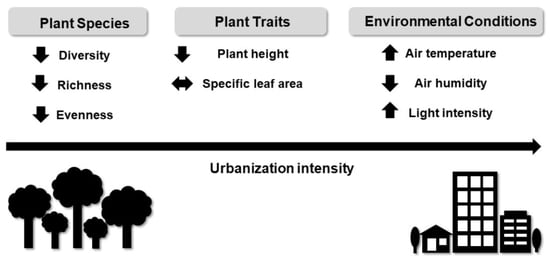
1. Introduction
2. Materials and Methods
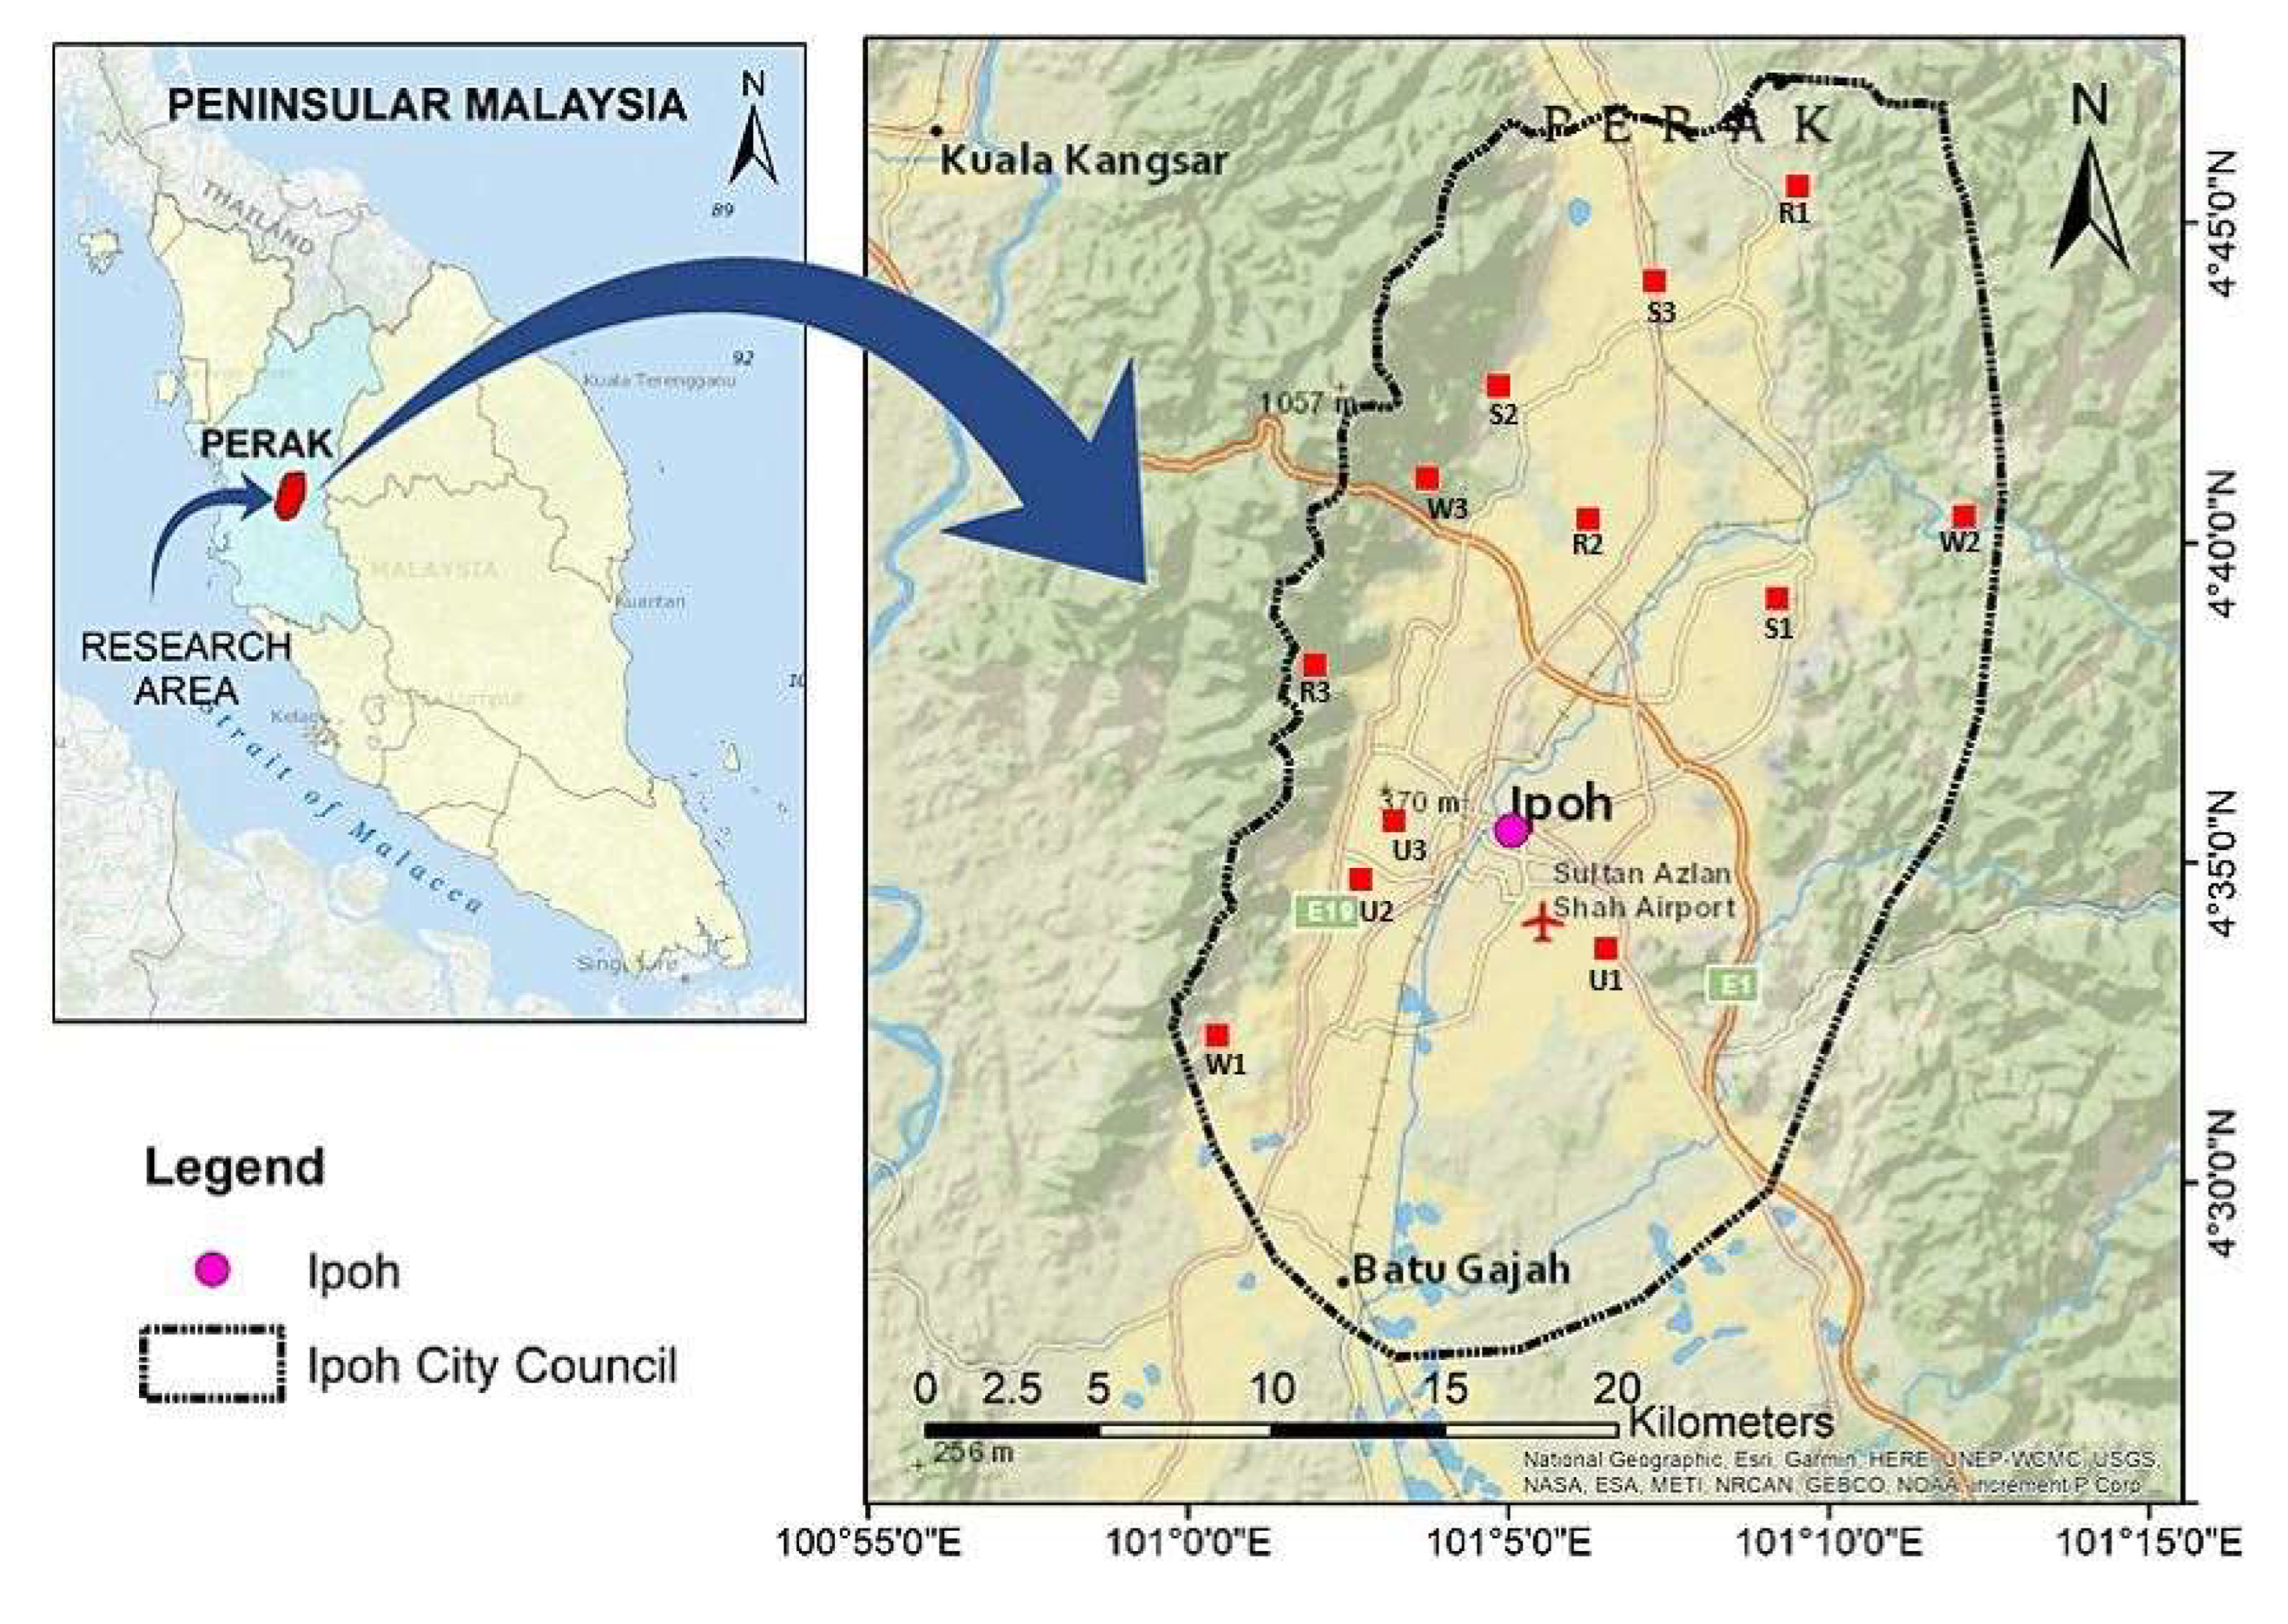
2.1. Study Area
2.2. Urbanization Intensity Quantification
2.3. Field Sampling
2.4. Plant Traits
2.5. Environmental Conditions
2.6. Plant Species Richness, Diversity and Evenness along the Urbanization Gradient
2.6.1. Species Richness
2.6.2. Species Diversity
2.6.3. Species Evenness
2.7. Statistical Analysis
3. Results
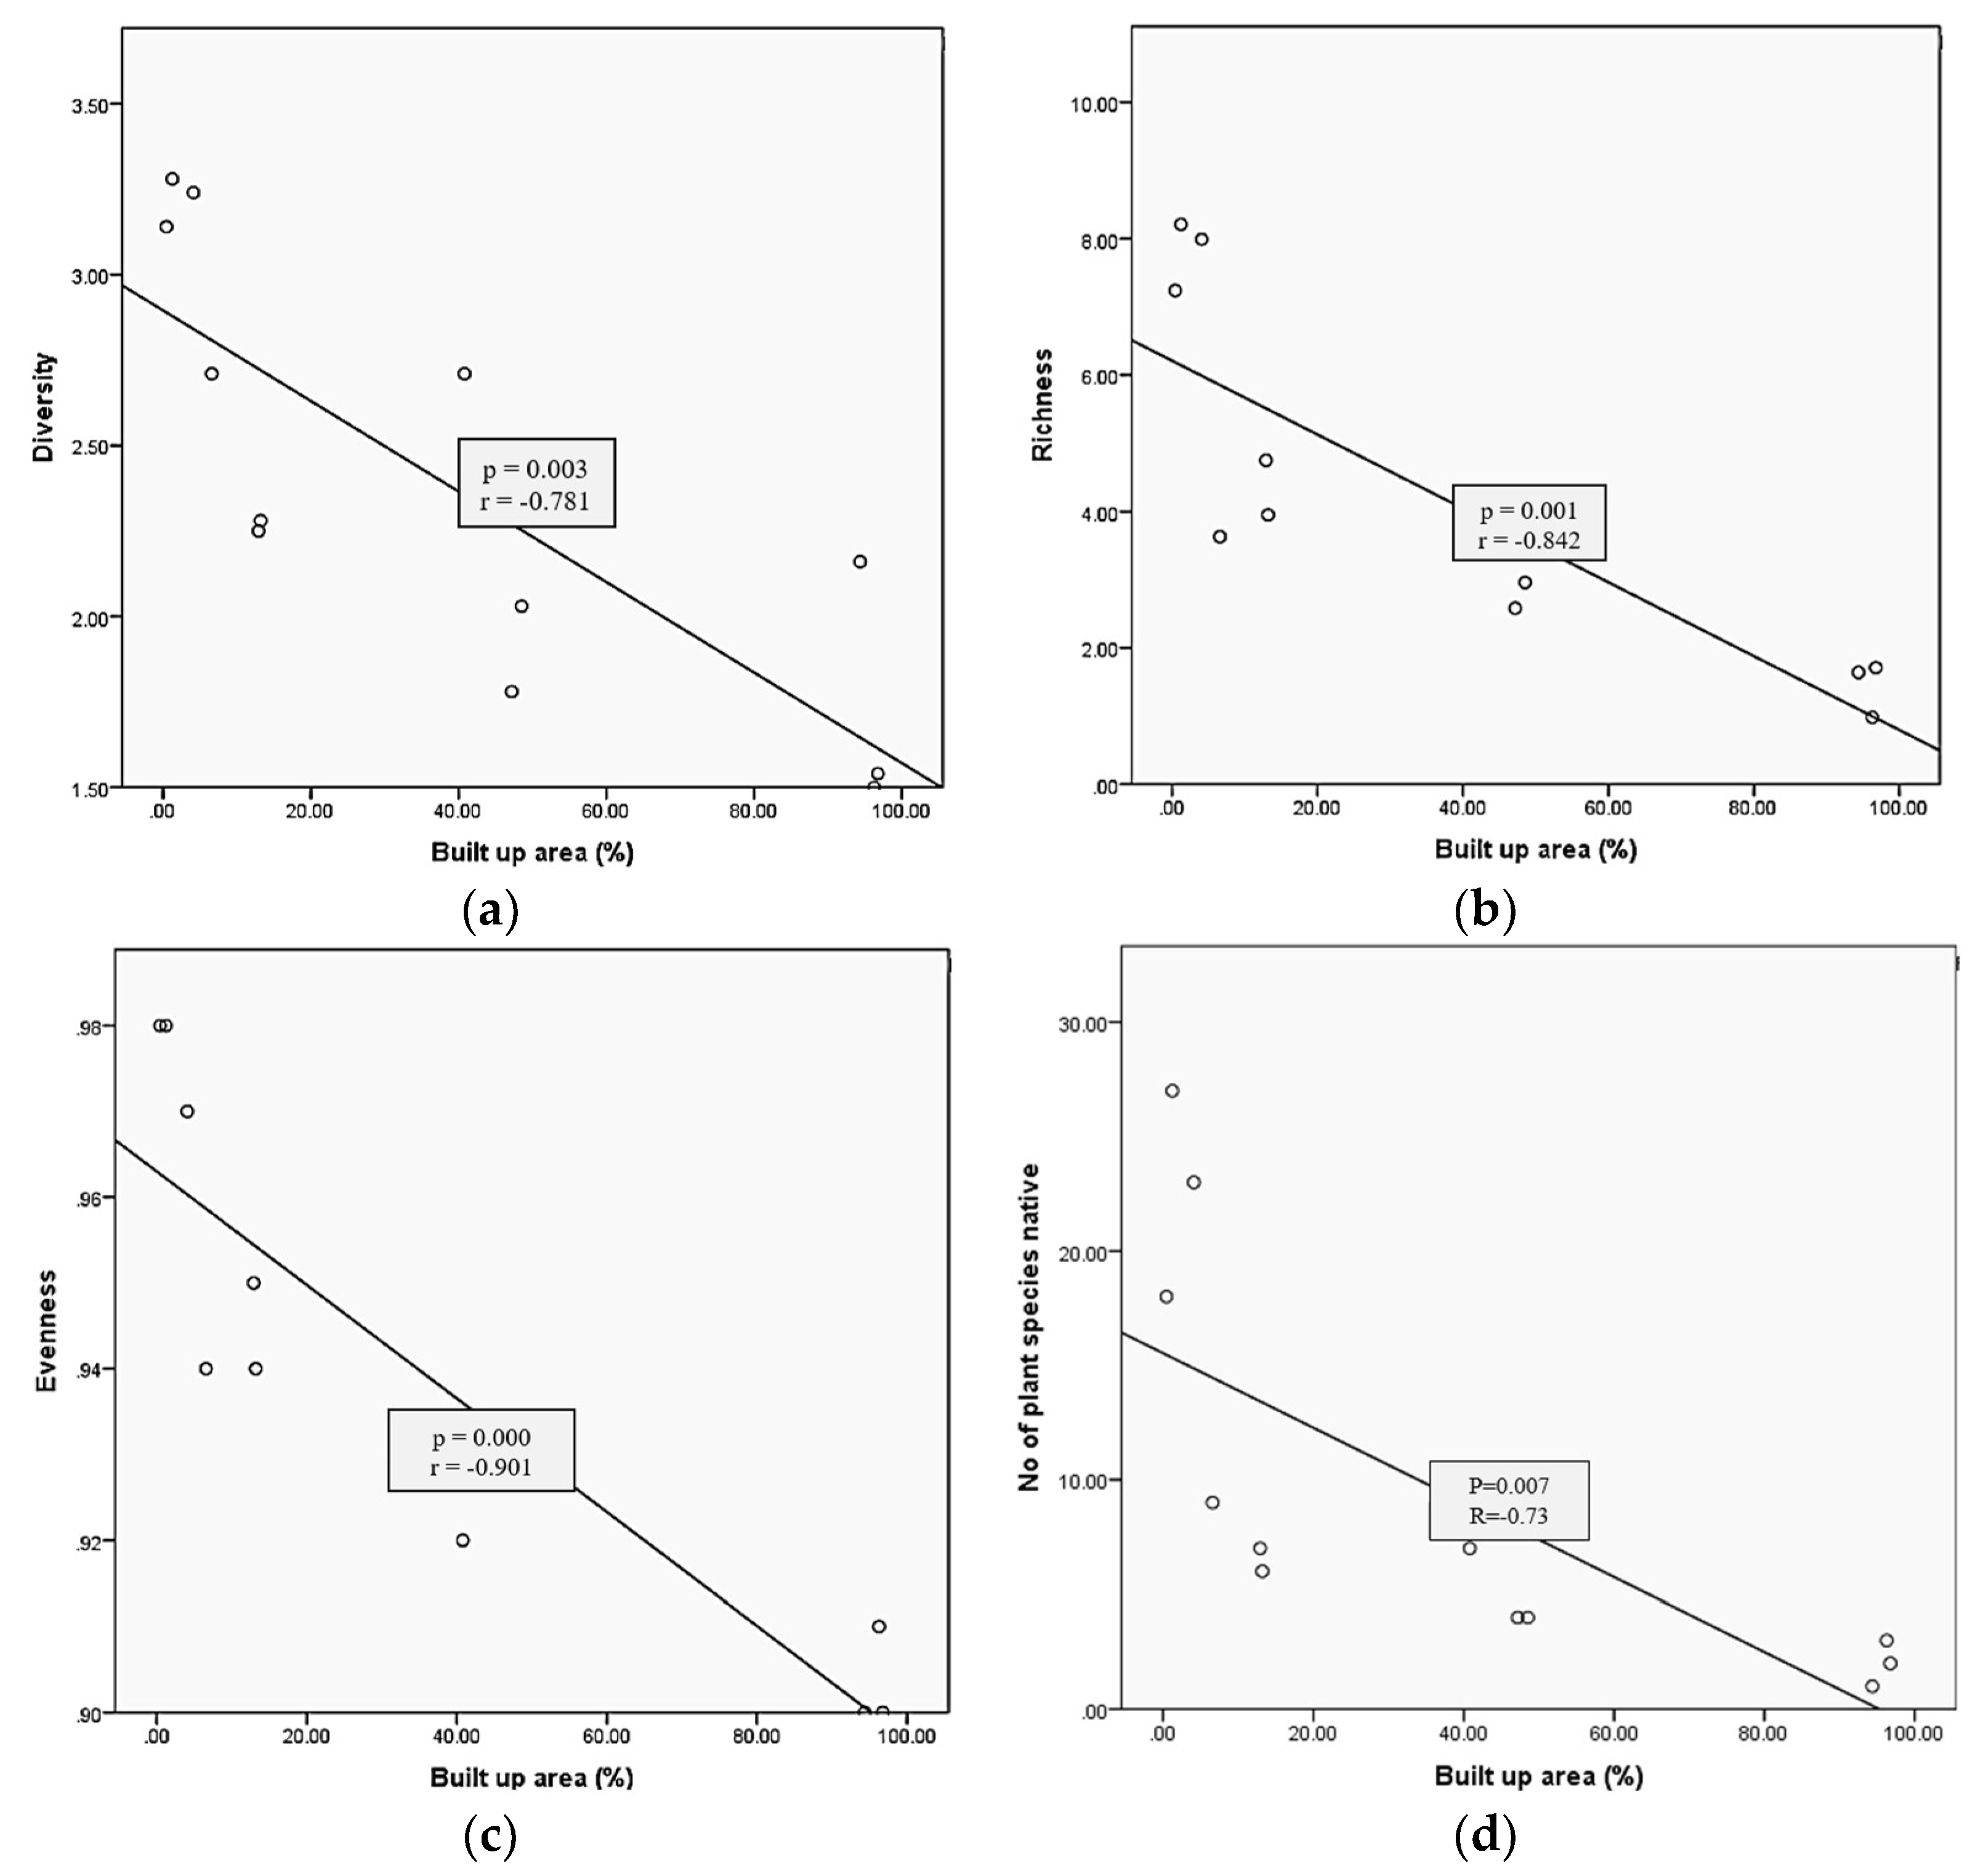
3.1. Relationship between Urbanization and Plant Diversity, Richness, and Evenness
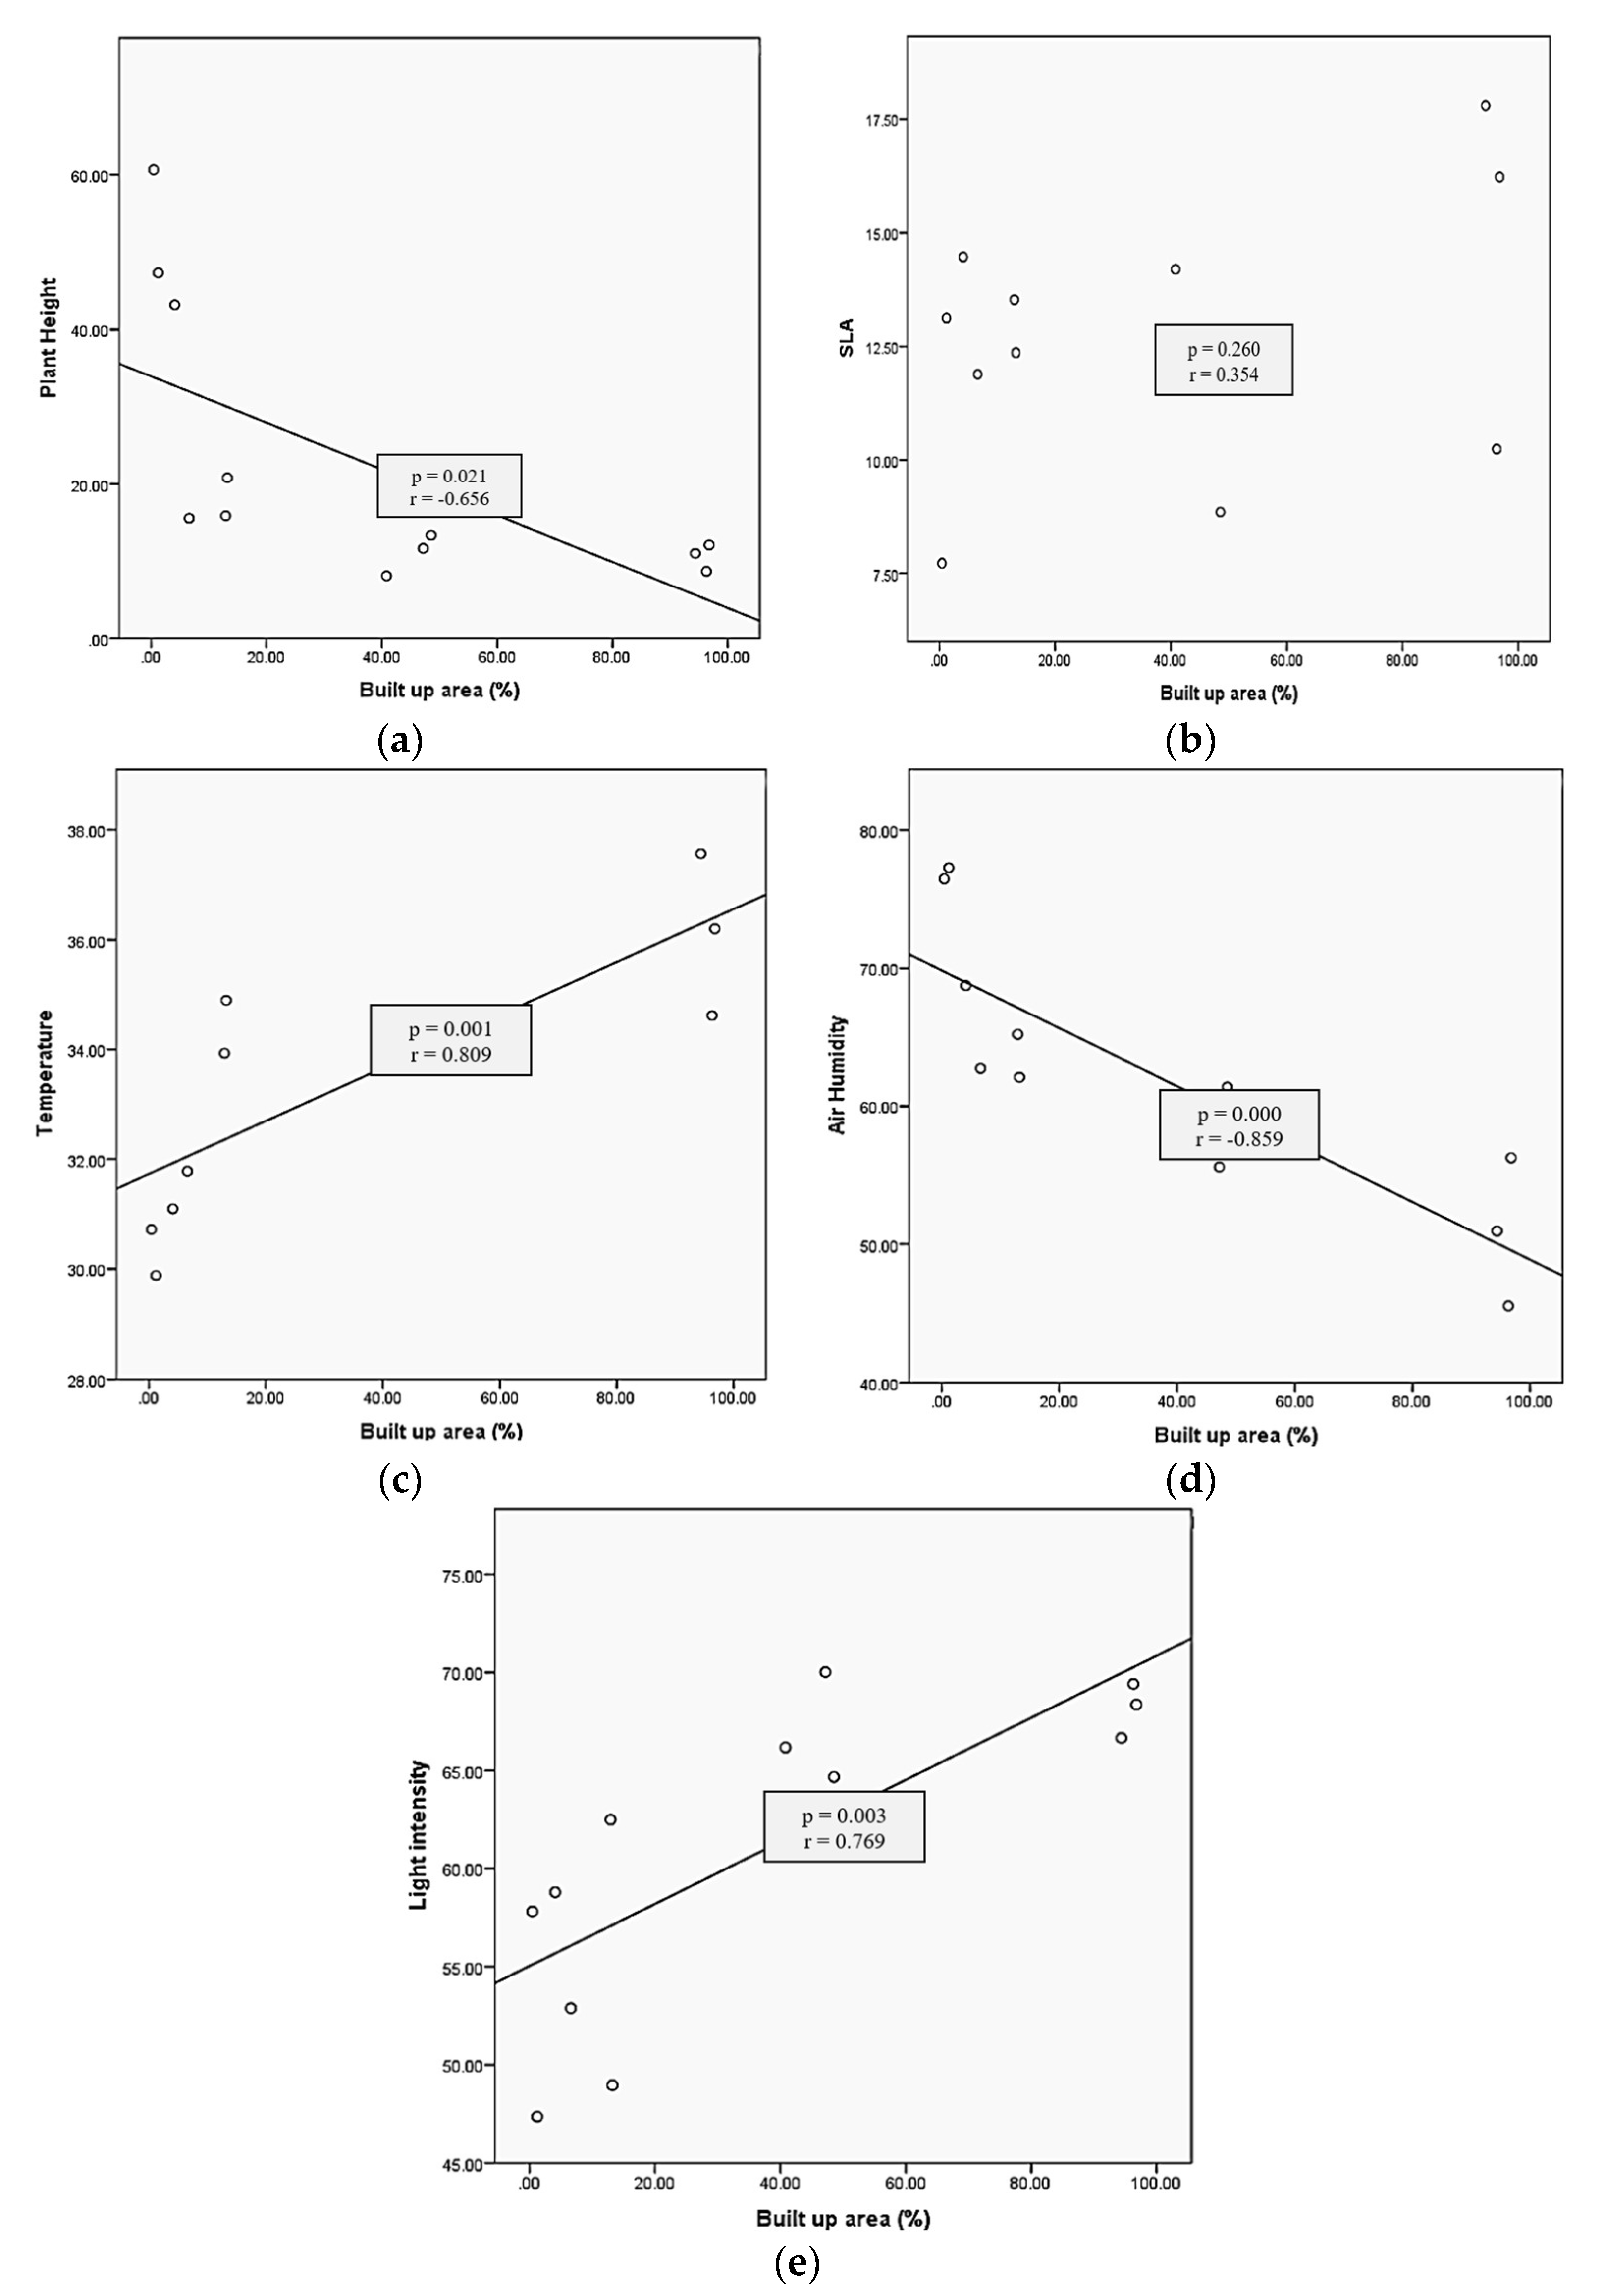
3.2. Relationship between Urbanization with Plant Traits and Environmental Conditions
4. Discussion
4.1. Effect of Urbanization on Plant Diversity
4.2. Changes in Plant Functional Traits along Urbanization Gradient
4.3. Environmental Impacts on Filtering Diversity Species
5. Conclusions
Supplementary Materials
Author Contributions
Funding
Institutional Review Board Statement
Data Availability Statement
Acknowledgments
Conflicts of Interest
References
- Ali, R.; Bakhsh, K.; Yasin, M.A. Impact of urbanization on CO2 emissions in emerging economy: Evidence from Pakistan. Sustain. Cities Soc. 2019, 48, 101553. [Google Scholar] [CrossRef]
- Zhao, S.; Shi, X.M.; Niu, Y.F. Evaluation of the overall level of new urbanization in Hebei province based on factor analysis and GIS. Asian Agric. Res. 2014, 6, 44–49. [Google Scholar]
- Song, G.; Wang, J.; Han, T.; Wang, Q.; Ren, H.; Zhu, H.; Hui, D. Changes in plant functional traits and their relationships with environmental factors along an urban-rural gradient in Guangzhou, China. Ecol. Indic. 2019, 106, 105558. [Google Scholar] [CrossRef]
- Petersen, T.K.; Speed, J.D.M.; Grøtan, V.; Austrheim, G. Competitors and ruderals go to town: Plant community composition and function along an urbanisation gradient. Nord. J. Bot. 2021, 39, njb.03026. [Google Scholar] [CrossRef]
- Trisos, C.H.; Merow, C.; Pigot, A.L. The projected timing of abrupt ecological disruption from climate change. Nature 2020, 580, 496–501. [Google Scholar] [CrossRef] [PubMed]
- Yang, J.; Li, S.; Lu, H. Quantitative Influence of Land-Use Changes and Urban Expansion Intensity on Landscape Pattern in Qingdao, China: Implications for Urban Sustainability. Sustainability 2019, 11, 6174. [Google Scholar] [CrossRef] [Green Version]
- Kadeba, A.; Nacoulma, B.M.I.; Ouedraogo, A.; Bachmann, Y.; Thiombiano, A.; Schmidt, M.; Boussim, J.I. Land cover change and plants diversity in the Sahel: A case study from northern Burkina Faso. Ann. For. Res. 2015, 58, 109. [Google Scholar] [CrossRef] [Green Version]
- Cheng, F.; Liu, S.; Hou, X.; Wu, X.; Dong, S.; Coxixo, A. The effects of urbanization on ecosystem services for biodiversity conservation in southernmost Yunnan Province, Southwest China. J. Geogr. Sci. 2019, 29, 1159–1178. [Google Scholar] [CrossRef] [Green Version]
- Zisadza-Gandiwa, P.; Mango, L.; Gandiwa, E.; Goza, D.; Parakasingwa, C.; Chinoitezvi, E.; Muvengwi, J. Variation in woody vegetation structure and composition in a semi-arid savanna of Southern Zimbabwe. Int. J. Biodivers. Conserv. 2013, 5, 71–77. [Google Scholar]
- Ikyaagba, T.E.; Tee, T.N.; Dagba, B.I.; Ancha, U.P.; Ngibo, K.D.; Tume, C. Tree composition and distribution in Federal University of Agriculturema Kurdi, Nigeria. J. Res. For. Wildl. Environ. 2015, 7, 147–157. [Google Scholar]
- Bowler, D.E.; Buyung-Ali, L.; Knight, T.M.; Pullin, A.S. Urban greening to cool towns and cities: A systematic review of the empirical evidence. Landsc. Urban Plan. 2010, 97, 147–155. [Google Scholar] [CrossRef]
- Abhijith, K.V.; Kumar, P.; Gallagher, J.; McNabola, A.; Baldauf, R.; Pilla, F. Air pollution abatement performances of green infrastructure in open road and built-Up street canyon environments—A review. Atmos. Environ. 2017, 162, 71–86. [Google Scholar] [CrossRef]
- Wolf, K.L.; Robbins, A.S.T. Metro nature, environmental health, and economic value. Environ. Health Perspect. 2015, 123, 390. [Google Scholar] [CrossRef] [PubMed]
- Guitart, D.; Pickering, C.; Bryne, J. Past results and future directions in urban community gardens research. Urban For. Urban Green. 2012, 11, 364–373. [Google Scholar] [CrossRef] [Green Version]
- Botzat, A.; Fisher, L.K.; Kowarik, I. Unexploited opportunities in understanding live able and biodiverse cities. A review on urban biodiversity perception and valuation. Glob. Environ. Chang. 2016, 39, 220–233. [Google Scholar] [CrossRef]
- Aronson, M.F.J.; Handel, S.N.; La Puma, I.P.; Clemants, S.E. Urbanization promotes non-native woody species and diverse plant assemblages in the New York metropolitan region. Urban Ecosyst. 2015, 18, 31–45. [Google Scholar] [CrossRef]
- Wang, M.; Li, J.; Kuang, S.; He, Y.; Chen, G.; Huang, Y.; Łowicki, D. Plant Diversity along the Urban–Rural Gradient and Its Relationship with Urbanization Degree in Shanghai, China. Forests 2020, 11, 171. [Google Scholar] [CrossRef] [Green Version]
- Čeplová, N.; Kalusová, V.; Lososová, Z. Effects of settlement size, urban heat island and habitat type on urban plant biodiversity. Landsc. Urban Plan. 2017, 159, 15–22. [Google Scholar] [CrossRef]
- Jha, R.K.; Nölke, N.; Diwakara, B.N.; Tewari, V.P.; Kleinn, C. Differences in tree species diversity along the rural-urban gradient in Bengaluru, India. Urban For. Urban Green. 2019, 46, 126464. [Google Scholar] [CrossRef]
- Blouin, D.; Pellerin, S.; Poulin, M. Increase in non-native species richness leads to biotic homogenization in vacant lots of a highly urbanized landscape. Urban Ecosyst. 2019, 22, 879–892. [Google Scholar] [CrossRef]
- Godefroid, S.; Koedam, N. Distribution pattern of the flora in a peri-urban forest: An effect of the city–forest ecotone. Landsc. Urban Plan. 2003, 65, 169–185. [Google Scholar] [CrossRef]
- Ranta, P.; Viljanen, V. Vascular plants along an urban-rural gradient in the city of Tampere, Finland. Urban Ecosyst. 2011, 14, 361–376. [Google Scholar] [CrossRef]
- Zerbe, S. Biodiversity in Berlin and its potential for nature conservation. Landsc. Urban Plan. 2003, 62, 139–148. [Google Scholar] [CrossRef]
- Yan, Z.; Teng, M.; He, W.; Liu, A.; Li, Y.; Wang, P. Impervious surface area is a key predictor for urban plant diversity in a city undergone rapid urbanization. Sci. Total Environ. 2019, 650, 335–342. [Google Scholar] [CrossRef] [PubMed]
- Vakhlamova, T.; Rusterholz, H.-P.; Kanibolotskaya, Y.; Baur, B. Changes in plant diversity along an urban–rural gradient in an expanding city in Kazakhstan, Western Siberia. Landsc. Urban Plan. 2014, 132, 111–120. [Google Scholar] [CrossRef]
- Cameron, G.N.; Culley, T.M.; Kolbe, S.E.; Miller, A.I.; Matter, S.F. Effects of urbanization on herbaceous forest vegetation: The relative impacts of soil, geography, forest composition, human access, and an invasive shrub. Urban Ecosyst. 2015, 18, 1051–1069. [Google Scholar] [CrossRef]
- Albrecht, H.; Haider, S. Species diversity and life history traits in calcareous grasslands vary along an urbanization gradient. Biodivers. Conserv. 2013, 22, 2243–2267. [Google Scholar] [CrossRef]
- Melliger, R.L.; Braschler, B.; Rusterholz, H.-P.; Baur, B. Diverse effects of degree of urbanisation and forest size on species richness and functional diversity of plants, and ground surface-active ants and spiders. PLoS ONE 2018, 13, e0199245. [Google Scholar] [CrossRef] [PubMed]
- Tian, Z.; Song, K.; Da, L. Distribution patterns and traits of weed communities along an urban-rural gradient under rapid urbanization in Shanghai, China: Weed communities on urban-rural gradient. Weed Biol. Manag. 2015, 15, 27–41. [Google Scholar] [CrossRef]
- Yang, J.; Li, X.; Li, S.; Liang, H.; Lu, H. The woody plant diversity and landscape pattern of fine-resolution urban forest along a distance gradient from points of interest in Qingdao. Ecol. Indic. 2021, 122, 107326. [Google Scholar] [CrossRef]
- Rahmad, Z.B.; Akomolafe, G.F. Distribution, Diversity and Abundance of Ferns in a Tropical University Campus. Pertanika J. Trop. Agric. Sci. 2018, 41, 1875–1887. [Google Scholar]
- Suratman, M.N. Tree Species Diversity and Forest Stand Structure of Pahang National Park, Malaysia. Biodivers. Enrich. A Divers. World 2012, 19, 45–56. [Google Scholar]
- Onrizal, O.; Ismail, S.N.; Mansor, M. Diversity of plant community at Gunung Ledang, Malaysia. In Proceedings of the International Conference on Agriculture, Environment, and Food Security 2018, Medan, Indonesia, 24–25 October 2018. IOP Conference Series: Earth and Environmental Science, 2019. [Google Scholar]
- Ghollasimood, S.; Hanum, I.F.; Nazre, M.; Kamziah, A.K.; Awang Noor, A.G. Vascular Plant Composition and Diversity of a Coastal Hill Forest in Perak, Malaysia. J. Agric. Sci. 2011, 3, 111. [Google Scholar] [CrossRef] [Green Version]
- Nabilla, F.; Devi, K.K.; Siong, H.C. Analysis of fragmented green spaces in kuala lumpur, Malaysia. Chem. Eng. Trans. 2019, 72, 457–462. [Google Scholar]
- Kanniah, K.D. Quantifying green cover change for sustainable urban planning: A case of Kuala Lumpur, Malaysia. Urban For. Urban Green. 2017, 27, 287–304. [Google Scholar] [CrossRef]
- Kanniah, K.D.; Ho, C.S. Urban Forest cover change and sustainability of malaysian cities. Chem. Eng. Trans. 2017, 56, 673–678. [Google Scholar]
- Kleyer, M. Enhancing landscape planning: Vegetation-mediated ecosystem services predicted by plant traits. Landsc. Urban Plan. 2021, 215, 104220. [Google Scholar] [CrossRef]
- Palma, E.; Catford, J.A.; Corlett, R.T.; Duncan, R.P.; Hahs, A.K.; McCarthy, M.A.; McDonnell, M.J.; Thompson, K.; Williams, N.S.G.; Vesk, P.A. Functional trait changes in the floras of 11 cities across the globe in response to urbanization. Ecography 2017, 40, 875–886. [Google Scholar] [CrossRef]
- Funk, J.L.; Larson, J.E.; Ames, G.M.; Butterfield, B.J.; Cavender-Bares, J.; Firn, J.; Wright, J. Revisiting the Holy Grail: Using plant functional traits to understand ecological processes: Plant functional traits. Biol. Rev. 2017, 92, 1156–1173. [Google Scholar] [CrossRef]
- van Grunsven, L.; Benson, M. Urban Development in Malaysia: Towards A New Systems Paradigm. Urban Policy Ser. 2020. Available online: www.thinkcity.com.my/wuf10 (accessed on 20 November 2022).
- Wan Mohd Jaafar, W.S.; Abdul Maulud, K.N.; Muhmad Kamarulzaman, A.M.; Raihan, A.; Md Sah, S.; Ahmad, A.; Razzaq Khan, W. The Influence of Deforestation on Land Surface Temperature—A Case Study of Perak and Kedah, Malaysia. Forests 2020, 11, 670. [Google Scholar] [CrossRef]
- Wong, K.M. Plant endemism patterns in Borneo and Malay Peninsula and Patterns of Plant Endemism and Rarity in Borneo and the Malay Peninsula. For. Res. Cent. 1998, 139–169. [Google Scholar]
- Ashton, P.S. Plant conservation in the Malaysian region. Malay. Nat. Soc. 1992, 86–93. [Google Scholar]
- Razak, H.A.; Wahid, N.B.A.; Latif, M.T. Anionic Surfactants and Traffic Related Emission from an Urban Area of Perak, Malaysia. Arch. Environ. Contam. Toxicol. 2019, 77, 587–593. [Google Scholar] [CrossRef]
- Marzluff, J.M.; Bowman, R. Avian Ecology and Conservation in an Urbanizing World; Donnelly, R., Ed.; Kluwer Academic: Boston, MA, USA; Springer: Berlin/Heidelberg, Germany, 2001; p. 581. [Google Scholar]
- Yang, T.-R.; Lam, T.Y.; Su, S.-H. A simulation study on the effects of plot size and shape on sampling plant species composition for biodiversity management. J. Sustain. For. 2019, 38, 116–129. [Google Scholar] [CrossRef]
- Pérez-Harguindeguy, N.; Díaz, S.; Garnier, E.; Lavorel, S.; Poorter, H.; Jaureguiberry, P.; Cornelissen, J.H.C. Corrigendum to: New handbook for standardised measurement of plant functional traits worldwide. Aust. J. Bot. 2016, 64, 715. [Google Scholar] [CrossRef] [Green Version]
- Cochard, A.; Pithon, J.; Braud, F.; Beaujouan, V.; Bulot, A.; Daniel, H. Intraspecific trait variation in grassland plant communities along urban-rural gradients. Urban Ecosyst. 2019, 22, 583–591. [Google Scholar] [CrossRef]
- Li, H.; Meng, H.; He, R.; Lei, Y.; Guo, Y.; Ernest, A.; Tian, G. Analysis of Cooling and Humidification Effects of Different Coverage Types in Small Green Spaces (SGS) in the Context of Urban Homogenization: A Case of HAU Campus Green Spaces in Summer in Zhengzhou, China. Atmosphere 2020, 11, 862. [Google Scholar] [CrossRef]
- Gatto, E.; Buccolieri, R.; Aarrevaara, E.; Ippolito, F.; Emmanuel, R.; Perronace, L.; Santiago, J.L. Impact of Urban Vegetation on Outdoor Thermal Comfort: Comparison between a Mediterranean City (Lecce, Italy) and a Northern European City (Lahti, Finland). Forests 2020, 11, 228. [Google Scholar] [CrossRef] [Green Version]
- Huang, L.; Chen, H.; Ren, H.; Wang, J.; Guo, Q. Effect of urbanization on the structure and functional traits of remnant subtropical evergreen broad-leaved forests in South China. Environ. Monit. Assess. 2013, 185, 5003–5018. [Google Scholar] [CrossRef]
- Magurran, A.E. Ecological Diversity and Its Measurement; Princeton University Press: Princeton, NJ, USA, 1988. [Google Scholar]
- Shannon, C.E.; Weiner, V. A Mathematical Theory of Communication University Press. Ill. Urban 1949, 5, 101–107. [Google Scholar]
- Atsbeha, G.; Demissew, S.; Woldu, Z.; Edwards, S. Floristic composition of herbaceous flowering plant species in Lalay and Tahtay Michew districts, central zone of Tigray, Ethiopia. Afr. J. Ecol. Ecosyst. 2015, 2, 159–169. [Google Scholar]
- Turner, I.M. A catalogue of the vascular plants of Malaya. Gard. Bull. (Singap.) 1995, 47, 346. [Google Scholar]
- McKinney, M.L. Urbanization as a major cause of biotic homogenization. Biol. Conserv. 2006, 127, 247–260. [Google Scholar] [CrossRef]
- Fahrig, L.; Baudry, J.; Brotons, L.; Burel, F.G.; Crist, T.O.; Fuller, R.J.; Martin, J.-L. Functional landscape heterogeneity and animal biodiversity in agricultural landscapes: Heterogeneity and biodiversity. Ecol. Lett. 2011, 14, 101–112. [Google Scholar] [CrossRef] [PubMed]
- Jentsch, A.; Steinbauer, M.J.; Alt, M.; Retzer, V.; Buhk, C.; Beierkuhnlein, C. A systematic approach to relate plant-species diversity to land use diversity across landscapes. Landsc. Urban Plan. 2012, 107, 236–244. [Google Scholar] [CrossRef]
- Huang, Y.; Chen, Y.; He, Y.-J.; Wang, M.; Kuang, S.-J.; Chen, G.-J.; Li, J.-X. Effects of socioeconomic factors on urban plant diversity of residential areas in Shanghai, China. J. Appl. Ecol. 2019, 30, 3403–3410. [Google Scholar]
- Aronson, M.F.J.; La Sorte, F.A.; Nilon, C.H.; Katti, M.; Goddard, M.A.; Lepczyk, C.A.; Winter, M. A global analysis of the impacts of urbanization on bird and plant diversity reveals key anthropogenic drivers. Proc. R. Soc. B Biol. Sci. 2014, 281, 20133330. [Google Scholar] [CrossRef] [PubMed]
- Uchiyama, Y.; Kohsaka, R. Spatio-temporal Analysis of Biodiversity, Land-use Mix and Human Population in a Socio-ecological Production Landscape: A Case Study in the Hokuriku Region, Japan. Procedia Eng. 2017, 198, 219–226. [Google Scholar] [CrossRef]
- Lee, C.; Jitaree, W. Structural Change and Urbanization: The Case of Peninsular Malaysia. Thail. World Econ. 2019, 37, 26–38. [Google Scholar]
- Hosni, A.T.; Teriman, S.; Adnan, N.A.; Kamar, M.A.A. Time Series Analysis of Land Cover Using Remote Sensing Technology. J. Comput. Theor. Nanosci. 2020, 17, 902–910. [Google Scholar] [CrossRef]
- McKinney, M.L. Urbanization, Biodiversity, and Conservation. BioScience 2002, 52, 883. [Google Scholar] [CrossRef]
- Peng, Y.; Liu, X. Research progress in effects of urbanization on plant biodiversity. Biodivers. Sci. 2007, 15, 558. [Google Scholar]
- Yuan, Z.; Xu, J.; Wang, Y.; Yan, B. Analyzing the influence of land use/land cover change on landscape pattern and ecosystem services in the Poyang Lake Region, China. Environ. Sci. Pollut. Res. 2021, 28, 27193–27206. [Google Scholar] [CrossRef] [PubMed]
- Li, X.; Jia, B.; Zhang, W.; Ma, J.; Liu, X. Woody plant diversity spatial patterns and the effects of urbanization in Beijing, China. Urban For. Urban Green. 2020, 56, 126873. [Google Scholar] [CrossRef]
- Butchart, S.H.M.; Walpole, M.; Collen, B.; van Strien, A.; Scharlemann, J.P.W.; Almond, R.E.A.; Watson, R. Global Biodiversity: Indicators of Recent Declines. Science 2010, 328, 1164–1168. [Google Scholar] [CrossRef] [PubMed]
- Rosenfield, M.F.; Müller, S.C. Plant Traits Rather than Species Richness Explain Ecological Processes in Subtropical Forests. Ecosystems 2020, 23, 52–66. [Google Scholar] [CrossRef]
- Zirbel, C.R.; Bassett, T.; Grman, E.; Brudvig, L.A. Plant functional traits and environmental conditions shape community assembly and ecosystem functioning during restoration. J. Appl. Ecol. 2017, 54, 1070–1079. [Google Scholar] [CrossRef] [Green Version]
- Morris, K.I.; Chan, A.; Morris, K.J.K.; Ooi, M.C.; Oozeer, M.Y.; Abakr, Y.A.; Nadzir, M.S.M. and Mohammed, I.Y. Urbanisation and urban climate of a tropical conurbation, Klang Valley, Malaysia. Urban Clim. 2017, 19, 54–71. [Google Scholar] [CrossRef]
- Saha, S.; Saha, A.; Das, M.; Saha, A.; Sarkar, R.; Das, A. Analyzing spatial relationship between land use/land cover (LULC) and land surface temperature (LST) of three urban agglomerations (UAs) of Eastern India. Remote Sens. Appl. Soc. Environ. 2021, 22, 100507. [Google Scholar] [CrossRef]
- Lüttge, U.; Buckeridge, M. Trees: Structure and function and the challenges of urbanization. Trees 2020, 1–8. [Google Scholar] [CrossRef] [Green Version]
- Hatfield, J.L.; Prueger, J.H. Temperature extremes: Effect on plant growth and development. Weather Clim. Extrem. 2015, 10, 4–10. [Google Scholar] [CrossRef] [Green Version]
- Williams, N.S.G.; Hahs, A.K.; Vesk, P.A. Urbanisation, plant traits and the composition of urban floras. Perspect. Plant Ecol. Evol. Syst. 2015, 17, 78–86. [Google Scholar] [CrossRef]
- Gong, H.; Gao, J. Soil and climatic drivers of plant SLA (specific leaf area). Glob. Ecol. Conserv. 2019, 20, e00696. [Google Scholar] [CrossRef]
- Vallet, J.; Daniel, H.; Beaujouan, V.; Rozé, F.; Pavoine, S. Using biological traits to assess how urbanization filters plant species of small woodlands: Biological traits to assess how urbanization filters plant species. Appl. Veg. Sci. 2010, 13, 412–424. [Google Scholar] [CrossRef]
- Dwyer, J.M.; Hobbs, R.J.; Mayfield, M.M. Specific leaf area responses to environmental gradients through space and time. Ecology 2014, 95, 399–410. [Google Scholar] [CrossRef]
- Gauld, J.H.; Robertson, J.S. Soils and Their Related Plant Communities on the Dalradian Limestone of Some Sites in Central Perthshire, Scotland. J. Ecol. 1985, 73, 91. [Google Scholar] [CrossRef]
- Zakaria, R.; Nizam, M.S.; Faridah, H. Association of Tree Communities with Soil Properties in a Semi Deciduous Forest of Perlis, Peninsular Malaysia. BIOTROPIA-Southeast Asian J. Trop. Biol. 2020, 27, 69–79. [Google Scholar]
- Doan, V.Q.; Kusaka, H. Projections of urban climate in the 2050s in a fast-growing city in Southeast Asia: The greater Ho Chi Minh City metropolitan area, Vietnam. Int. J. Climatol. 2018, 38, 4155–4171. [Google Scholar] [CrossRef]
- Kubota, T.; Lee, H.S.; Trihamdani, A.R.; Phuong, T.T.T.; Tanaka, T.; Matsuo, K. Impacts of land use changes from the Hanoi Master Plan 2030 on urban heat islands: Part 1. Cooling effects of proposed green strategies. Sustain. Cities Soc. 2017, 32, 295–317. [Google Scholar] [CrossRef]
- Grimm, N.B.; Faeth, S.H.; Golubiewski, N.E.; Redman, C.L.; Wu, J.; Bai, X.; Briggs, J.M. Global change and the ecology of cities. Science 2008, 319, 756–760. [Google Scholar] [CrossRef] [Green Version]
- Ciceu, A.; Popa, I.; Leca, S.; Pitar, D.; Chivulescu, S.; Badea, O. Climate change effects on tree growth from Romanian forest monitoring Level II plots. Sci. Total Environ. 2020, 698, 134129. [Google Scholar] [CrossRef] [PubMed]
- Schwoertzig, E.; Poulin, N.; Hardion, L.; Trémolières, M. Plant ecological traits highlight the effects of landscape on riparian plant communities along an urban–rural gradient. Ecol. Indic. 2016, 61, 568–576. [Google Scholar] [CrossRef]
- Lososová, Z.; Tichý, L.; Divíšek, J.; Čeplová, N.; Danihelka, J.; Dřevojan, P.; Fajmon, K.; Kalníková, V.; Kalusová, V.; Novák, P.; et al. Projecting potential future shifts in species composition of European urban plant communities. Divers. Distrib. 2018, 24, 765–775. [Google Scholar] [CrossRef] [Green Version]
- Zhang, L.; Yang, L.; Zohner, C.M.; Crowther, T.W.; Li, M.; Shen, F.; Guo, M.; Qin, J.; Yao, L.; Zhou, C. Direct and indirect impacts of urbanization on vegetation growth across the world’s cities. Sci. Adv. 2022, 8, eabo0095. [Google Scholar] [CrossRef]
- Nelson, S.C. Morinda citrifolia (noni), Ver 4, Species Profiles for Pacifc Island Agroforestry; Permanent Agricultural Resources: Holualoa, HI, USA, 2006; pp. 1–13. [Google Scholar]
- Francis, J.K. Wildland Shrubs of the United States and Its Territories: Thamnic Descriptions, Volume 1; General Technical Report IITF-GTR-26; US Department of Agriculture, Forest Service, International Institute of Tropical Forestry, US Department of Agriculture, Forest Service, Rocky Mountain Research Station: Fort Collins, CO, USA, 2004; 830p.
- Rojas-Sandoval, J. Morinda citrifolia (Indian mulberry); Invasive Species Compendium: Wallingford, UK, 2020. [Google Scholar]
- Bally, I.S.E. Mangifera indica (mango); Species Profiles for Pacific Psland Agroforestry: Mareeba, Australia, 2006; pp. 1–25. [Google Scholar]
- Derese, S.; Guantai, E.M.; Souaibou, Y.; Kuete, V. Mangifera indica L. (Anacardiaceae). In Medicinal Spices and Vegetables from Africa; Academic Press: Cambridge, MA, USA, 2017; pp. 451–483. [Google Scholar]
- Hung, T.; Dang, N.; Dat, N. Methanol extract from Vietnamese Caesalpinia sappan induces apoptosis in HeLa cells. Biol. Res. 2014, 47, 20. [Google Scholar] [CrossRef] [PubMed] [Green Version]
- Walentowski, H.; Falk, W.; Mette, T.; Kunz, J.; Bräuning, A.; Meinardus, C.; Zang, C.; Sutcliffe, L.M.E.; Leuschner, C. Assessing future suitability of tree species under climate change by multiple methods: A case study in southern Germany. Ann. For. Res. 2017, 60, 101–126. [Google Scholar] [CrossRef]
- Purwaningsih; Kintamani, E. The Diversity of Shorea spp. (Meranti) at Some Habitats in Indonesia. IOP Conf. Ser. Earth Environ. Sci. 2018, 197, 012034. [Google Scholar] [CrossRef]


| No. | Family | Plant Species | Abundance | Nativity Status | |||
|---|---|---|---|---|---|---|---|
| U | S | R | W | ||||
| 1 | Anacardiaceae | Buchanania arborescens (Blume) Blume | 31 | N | |||
| 2 | Anacardiaceae | Mangifera indica L. | 55 | 62 | 71 | 102 | A |
| 3 | Anacardiaceae | Swintonia floribunda Griff. | 26 | N | |||
| 4 | Annonaceae | Monocarpia marginalis (Scheff.) J. Sinclair | 17 | N | |||
| 5 | Annonaceae | Polyalthia cauliflora Hook.f. & Thomson | 35 | N | |||
| 6 | Apocynaceae | Alstonia angustiloba Miq. | 7 | N | |||
| 7 | Apocynaceae | Alstonia spatulata Blume | 76 | N | |||
| 8 | Apocynaceae | Plumeria alba L. | 7 | A | |||
| 9 | Araliaceae | Arthrophyllum diversifolium Blume | 47 | N | |||
| 10 | Asteraceae | Chromolaena odorata (L.) R. M. King & H. Rob. | 17 | A | |||
| 11 | Bignoniaceae | Tabebuia rosea (Bertol.) DC. | 10 | 21 | A | ||
| 12 | Calophyllaceae | Mesua ferrea L. | 28 | N | |||
| 13 | Cannabaceae | Trema tomentosa (Roxb.) Hara | 28 | N | |||
| 14 | Caricaceae | Carica papaya L. | 11 | 12 | A | ||
| 15 | Celastraceae | Salacia maingayi M. A. Lawson | 41 | N | |||
| 16 | Combretaceae | Terminalia mantaly H. Perrier | 8 | 11 | A | ||
| 17 | Dipterocarpaceae | Dipterocarpus oblongifolius Blume | 28 | N | |||
| 18 | Dipterocarpaceae | Shorea bracteolata Dyer | 17 | N | |||
| 19 | Dipterocarpaceae | Shorea hopeifolia (F.Heim) Symington | 39 | N | |||
| 20 | Dipterocarpaceae | Shorea multiflora (Burck) Symington | 17 | N | |||
| 21 | Euphorbiaceae | Hura crepitans L. | 22 | 27 | A | ||
| 22 | Euphorbiaceae | Hevea brasiliensis (Willd. ex A.Juss.) Müll.Arg. | 58 | 98 | A | ||
| 23 | Euphorbiaceae | Macaranga denticulata (Blume) Müll.Arg. | 6 | N | |||
| 24 | Euphorbiaceae | Macaranga tanarius (L.) Müll. Arg. | 13 | 101 | 67 | A | |
| 25 | Euphorbiaceae | Mallotus muticus (Müll. Arg.) Airy Shaw | 13 | 28 | N | ||
| 26 | Euphorbiaceae | Microdesmis caseariifolia Planch. ex Hook. | 29 | N | |||
| 27 | Fabaceae | Adenanthera pavonina L. | 33 | 14 | N | ||
| 28 | Fabaceae | Acacia auriculiformis A. Cunn. ex Benth. | 35 | 38 | 48 | A | |
| 29 | Fabaceae | Acacia mangium Willd. | 41 | 35 | A | ||
| 30 | Fabaceae | Aganope thyrsiflora (Benth.) Polhill | 28 | N | |||
| 31 | Fabaceae | Bauhinia purpurea L. | 18 | A | |||
| 32 | Fabaceae | Caesalpinia sappan L. | 12 | A | |||
| 33 | Fabaceae | Millettia pinnata (L.) Panigrahi | 33 | N | |||
| 34 | Fabaceae | Parkia speciosa Hassk. | 10 | N | |||
| 35 | Fabaceae | Samanea saman (Jacq.) Merr. | 15 | A | |||
| 36 | Guttiferae | Garcinia mangostana L. | 24 | 33 | N | ||
| 37 | Hypericaceae | Cratoxylum formosum (Jack) Benth. & Hook.f. ex Dyer | 27 | N | |||
| 38 | Hypericaceae | Cratoxylum maingayi Dyer | 24 | N | |||
| 39 | Ixonanthaceae | Ixonanthes icosandra Jack | 30 | N | |||
| 40 | Ixonanthaceae | Ixonanthes reticulata Jack | 16 | N | |||
| 41 | Lamiaceae | Vitex pinnata L. | 26 | N | |||
| 42 | Lauraceae | Beilschmiedia perakensis Gamble | 47 | N | |||
| 43 | Lauraceae | Cinnamomum javanicum Blume | 20 | N | |||
| 44 | Lauraceae | Cinnamomum iners Reinw. ex Blume | 42 | 53 | N | ||
| 45 | Lauraceae | Cinnamomum verum J.Presl | 31 | A | |||
| 46 | Lecythidaceae | Barringtonia racemosa (L.) Spreng. | 29 | N | |||
| 47 | Malvaceae | Durio zibethinus Murray | 13 | 70 | 43 | N | |
| 48 | Malvaceae | Hibiscus rosa-sinensis L. | 8 | A | |||
| 49 | Malvaceae | Microcos tomentosa Sm. | 15 | 22 | 39 | A | |
| 50 | Melastomataceae | Pternandra coerulescens Jack | 37 | N | |||
| 51 | Meliaceae | Azadirachta indica A.Juss. | 8 | 11 | A | ||
| 52 | Meliaceae | Sandoricum koetjape Merr. | 23 | N | |||
| 53 | Meliaceae | Swietenia macrophylla G.King | 40 | A | |||
| 54 | Moraceae | Artocarpus elasticus Reinw. ex Blume | 12 | N | |||
| 55 | Moraceae | Artocarpus heterophyllus Lam. | 5 | 19 | 27 | A | |
| 56 | Moraceae | Artocarpus integer (Thunb.) Merr. | 46 | 98 | N | ||
| 57 | Moraceae | Ficus aurata (Miq.) Miq. | 35 | 47 | N | ||
| 58 | Moraceae | Ficus benjamina L. | 6 | 22 | N | ||
| 59 | Moraceae | Ficus elastica Roxb. ex Hornem. | 16 | N | |||
| 60 | Moraceae | Ficus hispida L.fil. | 41 | 29 | N | ||
| 61 | Moraceae | Ficus magnoliifolia Blume | 21 | N | |||
| 62 | Moraceae | Ficus racemosa L. | 23 | N | |||
| 63 | Moraceae | Ficus religiosa L. | 16 | 22 | N | ||
| 64 | Moraceae | Ficus sinuata Thunb. | 28 | N | |||
| 65 | Moraceae | Streblus elongatus (Miq.) Corner | 92 | N | |||
| 66 | Moringaceae | Moringa oleifera Lam. | 9 | A | |||
| 67 | Muntingiaceae | Muntingia calabura L. | 33 | 39 | A | ||
| 68 | Myrtaceae | Syzygium aqueum (Burm.fil.) Alston | 7 | 32 | N | ||
| 69 | Myrtaceae | Syzygium grande (Wight) Walp. | 31 | 39 | N | ||
| 70 | Myrtaceae | Syzygium myrtifolium Walp. | 29 | N | |||
| 71 | Myrtaceae | Syzygium valdevenosum (Duthie) Merr. & Perry | 25 | N | |||
| 72 | Myrtaceae | Syzygium zeylanicum (L.) DC. | 25 | N | |||
| 73 | Olacaceae | Ochanostachys amentacea Mast. | 61 | N | |||
| 74 | Opiliaceae | Champereia manillana (Blume) Merr. | 24 | N | |||
| 75 | Ochnaceae | Ochna kirkii Oliv. | 8 | A | |||
| 76 | Oxalidaceae | Sarcotheca griffithii (Planch. ex Hook.fil.) Hallier fil. | 19 | N | |||
| 77 | Passifloraceae | Paropsia vareciformis (Griff.) Mast. | 25 | N | |||
| 78 | Pentaphylacaceae | Eurya acuminata DC. | 39 | N | |||
| 79 | Phyllanthaceae | Antidesma cuspidatum Müll.Arg. | 22 | N | |||
| 80 | Phyllanthaceae | Aporosa penangensis (Ridl.) Airy Shaw | 19 | N | |||
| 81 | Phyllanthaceae | Aporosa symplocoides (Hook.f.) Gage | 20 | N | |||
| 82 | Phyllanthaceae | Baccaurea parviflora (Müll.Arg.) Müll.Arg. | 34 | N | |||
| 83 | Phyllanthaceae | Commersonia bartramia (L.) Merr. | 13 | A | |||
| 84 | Polygalaceae | Xanthophyllum affine Korth. ex Miq. | 30 | N | |||
| 85 | Rhamnaceae | Ziziphus mauritiana Lam. | 21 | N | |||
| 86 | Rhizophoraceae | Pellacalyx saccardianus Scort. | 33 | N | |||
| 87 | Rubiaceae | Aidia densiflora (Wall.) Masam. | 7 | N | |||
| 88 | Rubiaceae | Morinda citrifolia L. | 15 | 22 | 25 | N | |
| 89 | Rubiaceae | Morinda elliptica (Hook.f.) Ridl. | 28 | N | |||
| 90 | Rubiaceae | Pertusadina eurhyncha (Miq.) Ridsdale | 19 | N | |||
| 91 | Sapindaceae | Nephelium lappaceum L. | 25 | 50 | N | ||
| 92 | Sapindaceae | Pometia pinnata J.R.Forst. & G.Forst. | 29 | A | |||
| 93 | Sapotaceae | Mimusops elengi L. | 35 | N | |||
| 94 | Sapotaceae | Palaquium gutta (Hook.) Baill. | 60 | N | |||
| 95 | Symplocaceae | Symplocos cochinchinensis (Lour.) Moore | 33 | N | |||
| 96 | Ulmaceae | Gironniera nervosa Planch. | 38 | N | |||
| Urban | Suburban | Rural | Wildland | |
|---|---|---|---|---|
| Number of species | 19 | 28 | 36 | 79 |
| Number of native species | 6 | 15 | 22 | 68 |
| Number of non-native species | 13 | 13 | 14 | 11 |
| Number of individuals | 219 | 412 | 902 | 2472 |
| Number of families | 11 | 13 | 16 | 35 |
| Shannon, H′ | 2.38 | 2.95 | 3.10 | 4.11 |
| Evenness, J | 0.90 | 0.93 | 0.95 | 0.97 |
| Margalef’s, Dmg | 2.41 | 3.49 | 3.68 | 8.58 |
| Urbanization Setting | Mean Difference (I-J) | Std. Error | Sig. | |
|---|---|---|---|---|
| I | J | |||
| Wildland | Rural | 15.33333 | 2.10819 | 0.000 * |
| Suburban | 17.66667 | 2.10819 | 0.000 * | |
| Urban | 20.66667 | 2.10819 | 0.000 * | |
| Rural | Suburban | 2.33333 | 2.10819 | 0.696 |
| Urban | 5.33333 | 2.10819 | 0.129 | |
| Suburban | Urban | 3.00000 | 2.10819 | 0.521 |
Publisher’s Note: MDPI stays neutral with regard to jurisdictional claims in published maps and institutional affiliations. |
© 2022 by the authors. Licensee MDPI, Basel, Switzerland. This article is an open access article distributed under the terms and conditions of the Creative Commons Attribution (CC BY) license (https://creativecommons.org/licenses/by/4.0/).
Share and Cite
Alue, B.A.; Salleh Hudin, N.; Mohamed, F.; Mat Said, Z.; Ismail, K. Plant Diversity along an Urbanization Gradient of a Tropical City. Diversity 2022, 14, 1024. https://doi.org/10.3390/d14121024
Alue BA, Salleh Hudin N, Mohamed F, Mat Said Z, Ismail K. Plant Diversity along an Urbanization Gradient of a Tropical City. Diversity. 2022; 14(12):1024. https://doi.org/10.3390/d14121024
Chicago/Turabian StyleAlue, Balqis Aqila, Noraine Salleh Hudin, Fatimah Mohamed, Zahid Mat Said, and Kamarul Ismail. 2022. "Plant Diversity along an Urbanization Gradient of a Tropical City" Diversity 14, no. 12: 1024. https://doi.org/10.3390/d14121024