Article

Ecological Distribution Patterns and Indicator Species Analysis of Climber Plants in Changa Manga Forest Plantation

1
Department of Botany, University of Okara, Okara 56300, Pakistan
2
Department of Ethnobotany, Institute of Botany, Ilia State University, 0105 Tbilisi, Georgia
3
Staatliches Museum für Naturkunde, Erbprinzenstrasse 13, 76135 Karlsruhe, Germany
4
Department of Botany, University of the Punjab, Lahore 54870, Pakistan
5
Department of Agricultural Engineering, College of Food and Agriculture Sciences, King Saud University, Riyadh 11451, Saudi Arabia
6
Plant Production Department, College of Food and Agriculture Sciences, King Saud University, Riyadh 11451, Saudi Arabia
7
Department of Agricultural Extension and Rural Society, College of Food and Agriculture Sciences, King Saud University, Riyadh 11451, Saudi Arabia
8
Department of Geography, Environmental Management, and Energy Studies, University of Johannesburg, APK Campus, Johannesburg 2006, South Africa
*
Author to whom correspondence should be addressed.
Diversity 2022, 14(11), 988; https://doi.org/10.3390/d14110988
Submission received: 10 September 2022 / Revised: 12 November 2022 / Accepted: 13 November 2022 / Published: 16 November 2022

Abstract

:
Climbing plants have an important role in forest communities and ecosystems. Despite the significance of the climbers in ecosystems, most of the previous research work in Pakistan has been concentrated on trees, shrubs, and herbs, with little attention paid to climbing plants. The current study investigated the ecology of climbers and the influence of soil characteristics on diversity, richness, and indicator species distribution in the Changa Manga Forest Plantation, Punjab, Pakistan. Field surveys were carried out between 2020 and 2021, with the data gathered using a random sample approach for ordination and cluster analysis of each plant species and edaphic data from sample plots. We reported a total of 29 climber species belonging to 23 genera and 9 families from the area. The Convolvulaceae family was the most prevalent, followed by Apocynaceae and Cucurbitaceae. Herbaceous climbers were the typical life form (70% species) and species showed peak flowering during the months of August and September. The multivariate analysis and cluster analysis grouped the climbers into four distinct communities based on the indicator species, representing filtering of the species pool in the studied area. Canonical Correspondence Analysis (CCA) results showed that soil factors had a significant influence (p ≤ 0.002) on the climbers’ diversity and distribution pattern. Our research contributes to a deeper understanding of climbing plant ecology in response to soil variables, with immediate consequences for policy and practice in this Himalayan region, as well as research insights for neighboring Himalayan regions and elsewhere in the world.

1. Introduction

Climbing plants are important contributors to plant communities because they have an impact on ecosystem processes, habitat heterogeneity, and vegetation structural diversity [1], as well as ecosystem services such as carbon sequestration [1]. In fact, trees and climbers compete for subterranean resources such as soil, water, and nutrients. By reducing light and below-ground resources, climbers significantly lower tree survival, fecundity, recruitment, and growth [2,3,4]. In tropical forests, climbers can account for about 25% of woody stem density and up to 44% of woody species diversity, thus providing a vital food source for wildlife and affording canopy-to-canopy access for arboreal animals through physically connecting trees [5,6,7]. Climbers are plants with flexible, thin, and quickly growing axes that have a variety of attachment types. They can quickly ascend to the topmost layers of a forest while sparing support tissues and preventing sliding or falling [5,8]. Climbing plants are common in tropical and temperate regions; however, in tropical rainforests their number and diversity of species and climbing strategies are outstanding [9,10,11]. They play an integral ecological role in nutrient cycling and forest dynamics, and thus establish an important tropic level within an ecosystem, but there have been few studies on them [6,7,9,12]. Climbers (lianas) are crucial for many areas of forest functioning, including pollination patterns, dispersal, and phenological systems, as well as providing a variety of resources and protecting biological diversity [3].
Climbing plants normally rely on host trees for physical support, although the climbing style and appropriate support differs significantly amongst functional categories of climbers. Climbing modes are usually divided into various categories, i.e., tendrils are vegetative organs generated from leaves or stems that can only climb narrow supports [7]. Twiners’ spiraling around the host tree stem necessitates a relatively significant energy expenditure in their growth. They have a larger maximum diameter than tendril climbers (about 10 cm) [9]. Hook and scrambler climbers cling to supporting trees with hooks and thorns. Understory root-climbers cling to a host trunk with the help of adventitious roots [6,8,9]. Similarly, environmental gradients that affect the distribution of other plant species, such as soil moisture, seasonality, light, topography, rainfall, and soil fertility, also affect the growth of climbing species [13]. In forests and open spaces, there are significant differences in the variety and abundance of the liana species.
Understanding the patterns of ecological traits can help us to better understand how a particular region’s flora functions. The phenotypic characteristics serve as a reliable indicator for determining the ecological health of a specific region, because they reflect the current ecological conditions and active evolutionary processes [8]. Similarly, phenological studies, such as research on many other temporal and spatial characteristics, are essential for comprehending how species and communities interact. The length and timing of flowering, as well as temporal and spatial variations in flower production in response to different environmental gradients, are all tracked by phenological studies of flowering [6,12].
Over the past two decades, scientists have discovered patterns in liana abundance and distribution across a variety of habitats, and have been investigating the underlying causes of these patterns [3,5]. No significant research contribution has yet been carried out on climber distribution in Pakistan, apart from [12], which explored the climber diversity from Murree Forests. A variety of studies documented the diversity and distribution of climbers, e.g., in Africa [14,15,16], South America [17,18], Central America [19], and Asia [13,20,21,22,23,24,25,26]. In Pakistan, the majority of prior studies largely concentrated on trees and shrubs, with little attention paid to climbing plants despite the diverse functions of climber plants in ecosystems [27]. Climber species, on the other hand, have been overlooked by most studies. In order to understand forest plant biodiversity, it is critical to incorporate climbers into forest studies. As a result, the current study attempted to: (I) evaluate the composition and diversity of climbers in the study area; (II) to analyze the flowering phenology of recorded climber plants; (III) to study the role of soil properties on the distribution pattern of climber plants in the study area through a multivariate approach; and (IV) to identify key indicator climber species for improved monitoring of forests and ecological restoration forest plantations in Pakistan’s semi-arid environment.

2. Materials and Methods
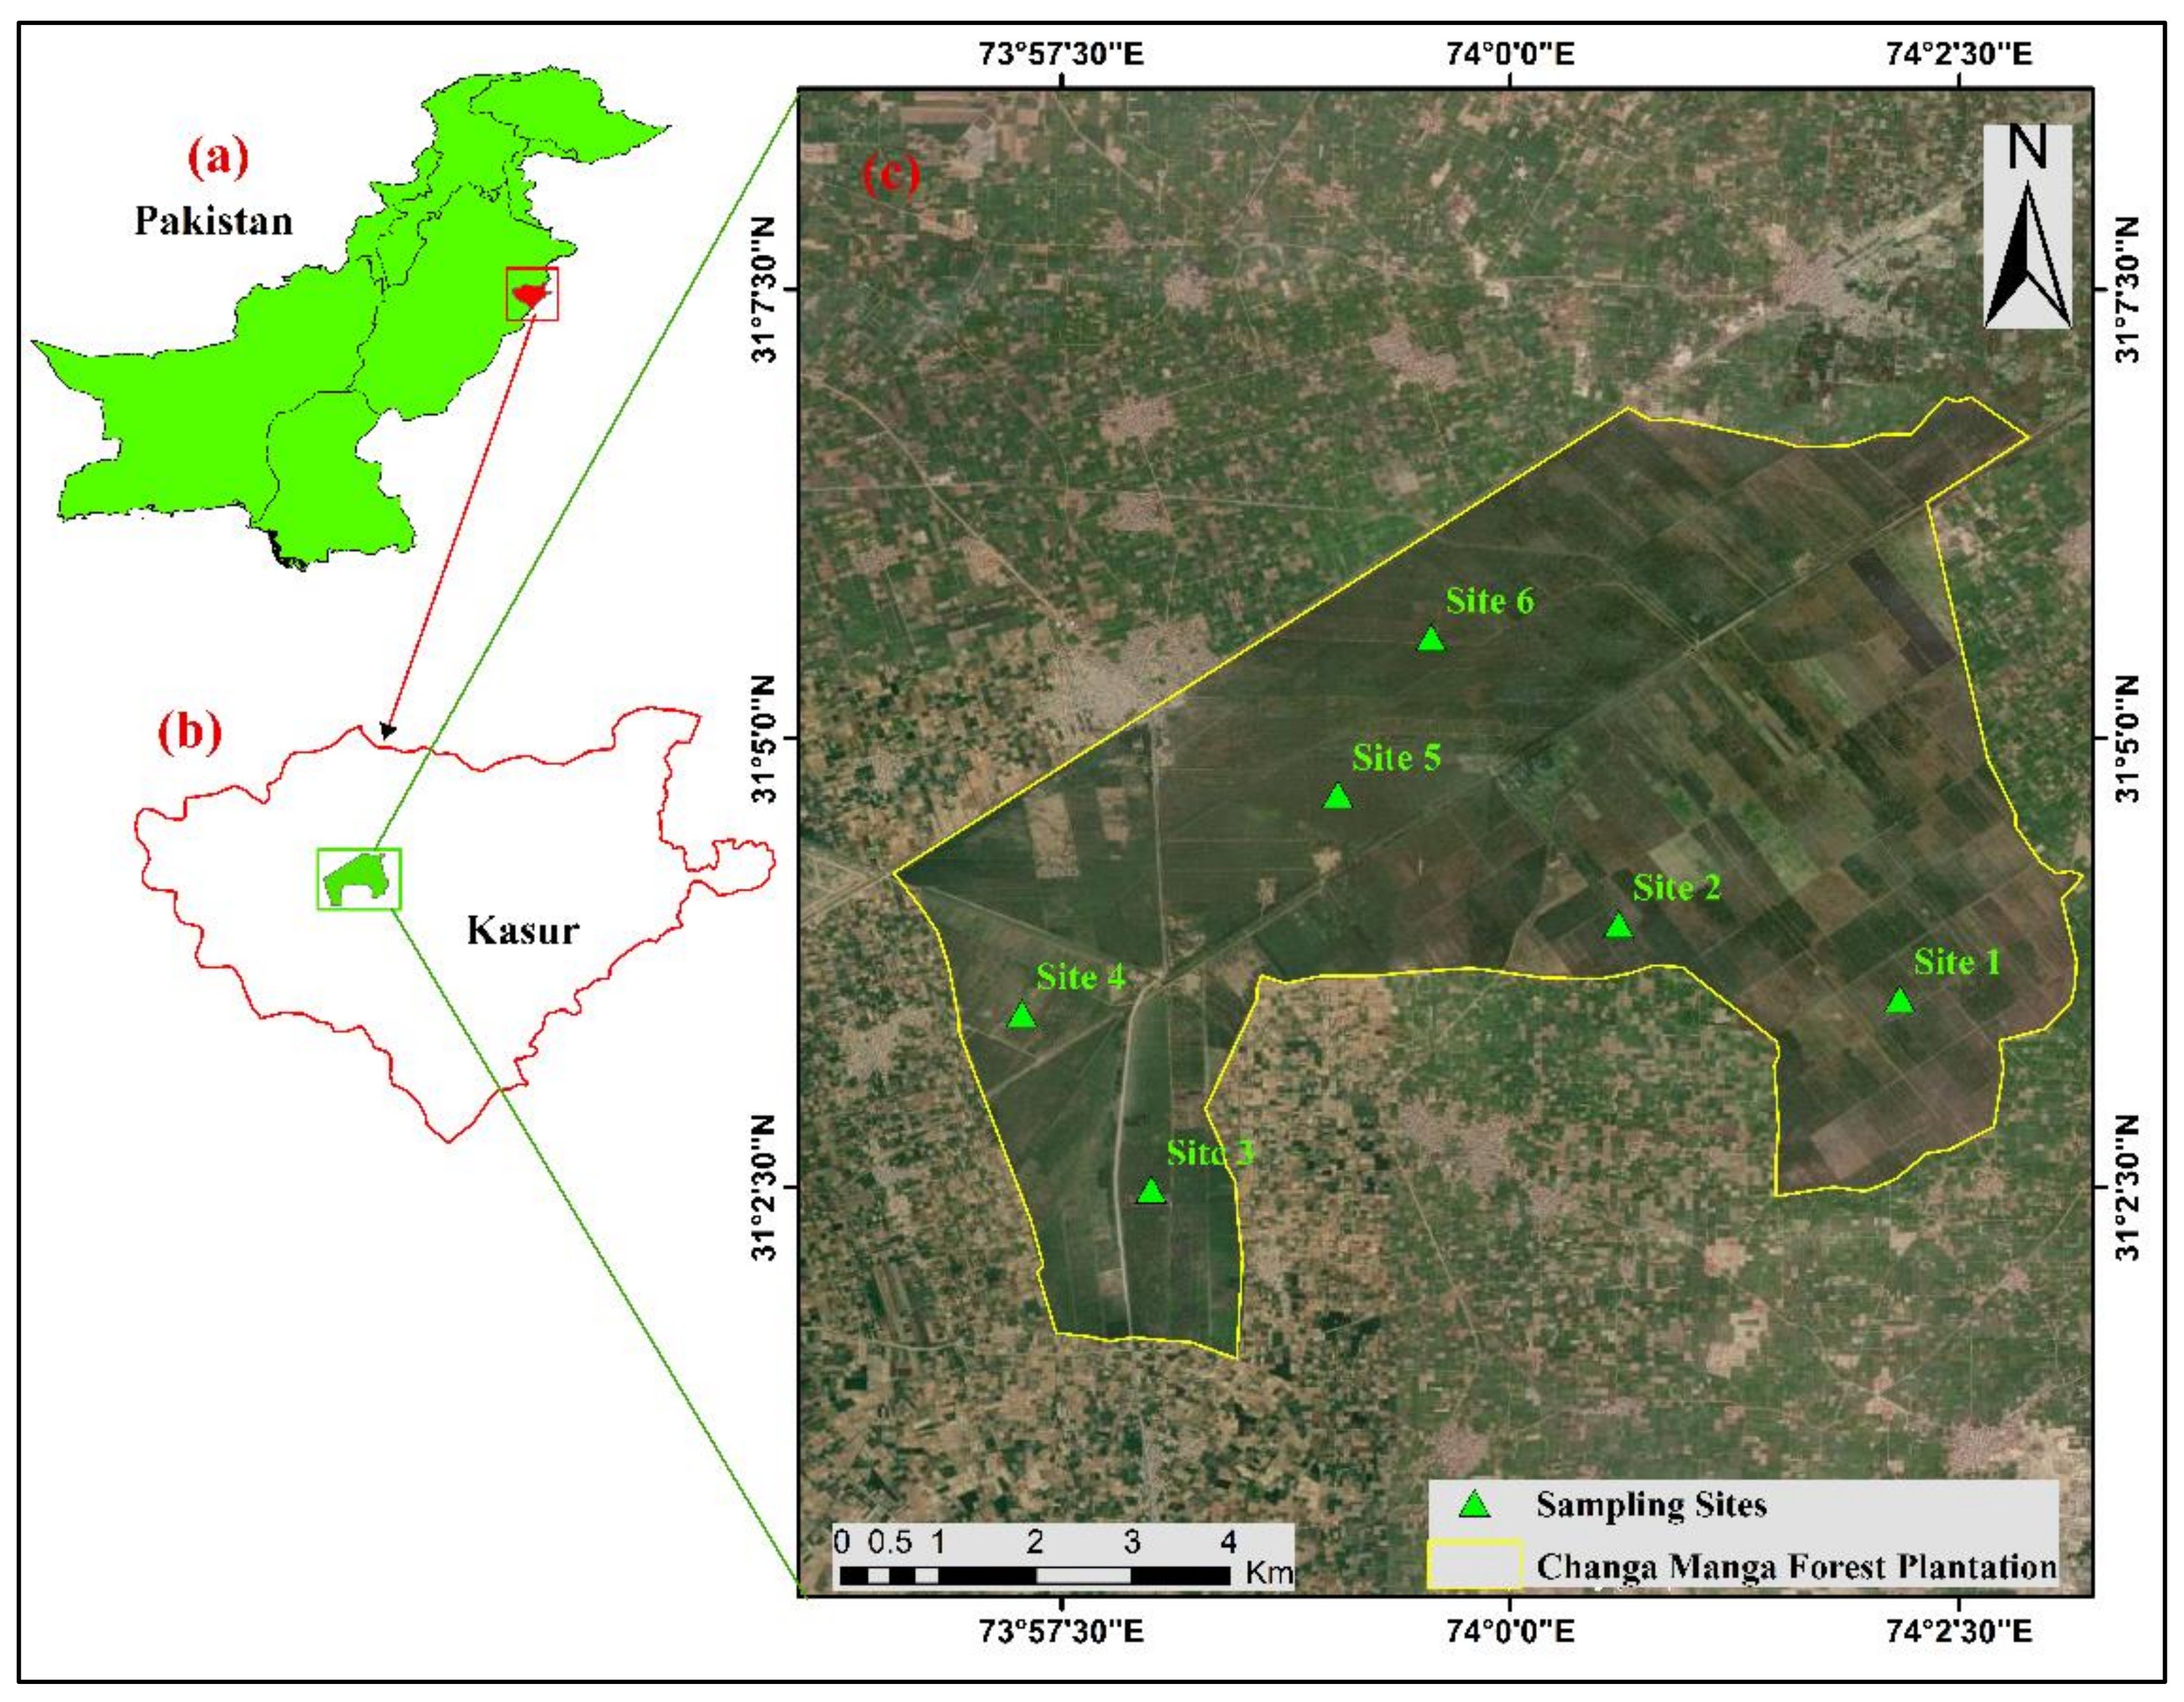
2.1. Study site

Changa Manga Forest Plantation is an irrigated plantation in Kasur district, Punjab, Pakistan, 74 km southwest of Lahore and covering 5065 ha. of land area. It is located between 31°1′ N and 74°4′ E (Figure 1). In the north, the Karachi–Lahore railway line runs from kilometers 1140 to 1148; on the east, it borders agricultural fields of the village of Gandhian; on the south, parts of the village Moujoki; and in the west, Wan Khara cultivations surround the Changa Manga Plantation. The plantation’s northwest corner is bisected by the 6.4-km Jambar–Chunian metaled road, which connects Chunian to the Lahore–Karachi national highway.
The plantation is located in central Punjab’s semi-arid, sub-tropical continental zone, which is distinguished by hot summers, low relative humidity, and infrequent as well as irregular rainfall. While the winters are from November to January, summers are hot and wet from April to September. The monsoon season typically have 128 mm of rainfall during July and August, which is more than it receives throughout the entire year. The region within the Changa Manga reserve was a desert zone with distinctive biological characteristics, named “Rakh,” before it was transformed into an irrigated plantation. Wan (Salvadora oleoides), karir (Capparis aphylla), jand (Prosopis cineraria), and other xerophytic species typical of this forest type were among the native vegetation of the tropical thorn forest that covered the area. Dalbergia sissoo and Eucalyptus spp. are the two principal species that are now present across a significant amount of the plantation. While mulberry (Morus sp.), hybrid-poplar (Populus sp.), Bombax, Terminalia, and Acacia sp. are common cultivated trees.

2.2. Sampling Design

Six plots of 100 × 100 m2 (1 ha each) were randomly established at 6 different sites in Changa Manga Forest Plantation, Pakistan from 2020 to 2021. Coordinates were measured using a GPS (Garmin e Trex). In each plot, 10 quadrats of 10 × 10 m2 for climbers and respective host trees were placed systematically (a total of 60 quadrats) [12,28,29]. For assessing whether a species was a climber or not, the nature of the species was noted i.e., we observed if a species had tendrils or twiners for climbing on a host or scrambler [8]. The height on the host species (uppermost branch) and mode of climbing were also recorded during the survey. Throughout the study period, phenological observations were made from January to December. We visited each plot and timed the peak flowering of each species. The species were also cross-checked with the published literature for confirmation of climber habits [3,5,11,12,13]. The quadrat method was used to calculate the density of climbers and host plants [11,30]. On standard herbarium sheets, plant specimens were collected, prepared, dried, poisoned, and mounted. All specimens were kept in the herbarium of the University of Okara’s Department of Botany for later use. Collectible climbing plant specimens were identified using the Flora of Pakistan [31,32]. Verification of the accepted scientific names for climbers was performed using the Plants of the World Online (POWO) website (https://powo.science.kew.org/, accessed on 12 March 2021).

2.3. Soil Analysis

Three soil samples (0–30 cm) were randomly obtained from each plot. Gathered samples were then combined to form a composite sample sealed in polythene bags and labeled for laboratory examination. Physicochemical tests were carried out; soil texture (clay, sand, and silt) [12], electrical conductivity (EC), and pH were determined from soil water extracts using a digital pH meter. The Kjeldahl method was used to calculate the total nitrogen, and the Walkley–Black method was applied in order to calculate the soil organic matter [33]. Potassium (K) and phosphorus (P) concentrations were determined according to [29]. Soil texture (silt, sand, and clay) was analyzed according to [34]. A ScalTec moisture analyzer calibrated to 110°C was used to calculate the moisture content of soil samples. The formula below was used to calculate the saturation percent [29,33].
%   m o i s t u r e = W e t   s o i l D r y   s o i l D r y   s o i l × 100
For each of the sample plots, human disturbance (tree cutting, land degradation, livestock grazing, pollution, agriculture activities) data were visually evaluated. Overgrazing and anthropogenic pressure were assessed at four different levels. As a result, four visually judged degrees of disturbance intensities were employed in each sample plot: 0 = absent, 1 = low, 2 = moderate, and 3 = strong [35,36].

2.4. Indicator Species Analysis

The indicator species analysis was carried out in order to define indicators for each of the climber groups in the study area. This provided information regarding species fidelity to a specific ecosystem. After determining indicator values of each species adapted from [37,38], a Monte Carlo assessment was performed to test for statistical significance. During indicator species analysis, the relative abundance of a species in different ecosystems was calculated using the following formula:
R e l a t i v e   a b u n d a n c e   R A j k = x k j k = 1 g x k j
where RAjk means relative abundance, Xkj is the abundance of species j in group k, and g means the total number of groups.
R e l a t i v e   f r q u e n c y   R F k j = i = 1 n k b I ˙ j k n k
where RFkj is the relative frequency of plant j in group k, bijk is the presence or absence of plant j in group k sample I, and I is the sample unit.
I n d i c a t o r   v a l u e   I V K j = 100 R A × R F
The threshold level of 25% indication and 95% significance (p ≤ 0.05) was used to determine the indicator species. Additionally, using PAST software, the indicator species with (p ≤ 0.05) values were graphically represented (version 4.10).

2.5. Data Analysis

The data were analyzed in order to observe how climber plant species interacted with environmental conditions. Utilizing data on plant species’ flowering phenology presence/absence, we conducted a hierarchical cluster analysis. According to the Ward clustering approach, the distances between groups are recalculated using the Lance–Williams dissimilarity update formula. In order to accomplish this, we employed the “Heatmap” package in the R software version 4.1.2. To investigate the influence of environmental gradients on climber composition, Canonical Correspondence Analysis (CCA) was conducted using the program CANOCO version 4.5 [39,40]. The difference between soil properties of four groups was tested through a non-parametric Kruskal–Wallis test, followed by Tukey HSD, for the purpose of determining whether there was a significant difference or not between the soil properties of the four groups in PAST software (version 4.10). The particular density (number of individuals) of each plant found along the 60 quadrats served as the initial point for the cluster analysis. For the purpose of classification, we employed Ward’s Agglomerative Cluster Analysis. The flexible beta (b = −0.25) linkage method [11], a linkage method which is frequently compatible with Sorensen distance and is space-conserving, was used along with the quantitative Sorensen (Bray–Curtis) distance measure, an efficient distance measure for ecological community analysis [28]. The dendrogram’s ideal pruning point was found using Ward’s method. Using PAST software, the clusters and diversity indices for each group of clusters were identified (version 4.10). Using Ward’s agglomerative cluster analysis [41], sampled plots were categorized into groups. On the basis of the presence and absence (1/0) of specifics, Two-Way Cluster Analysis (TWCA) was carried out [42].

3. Results

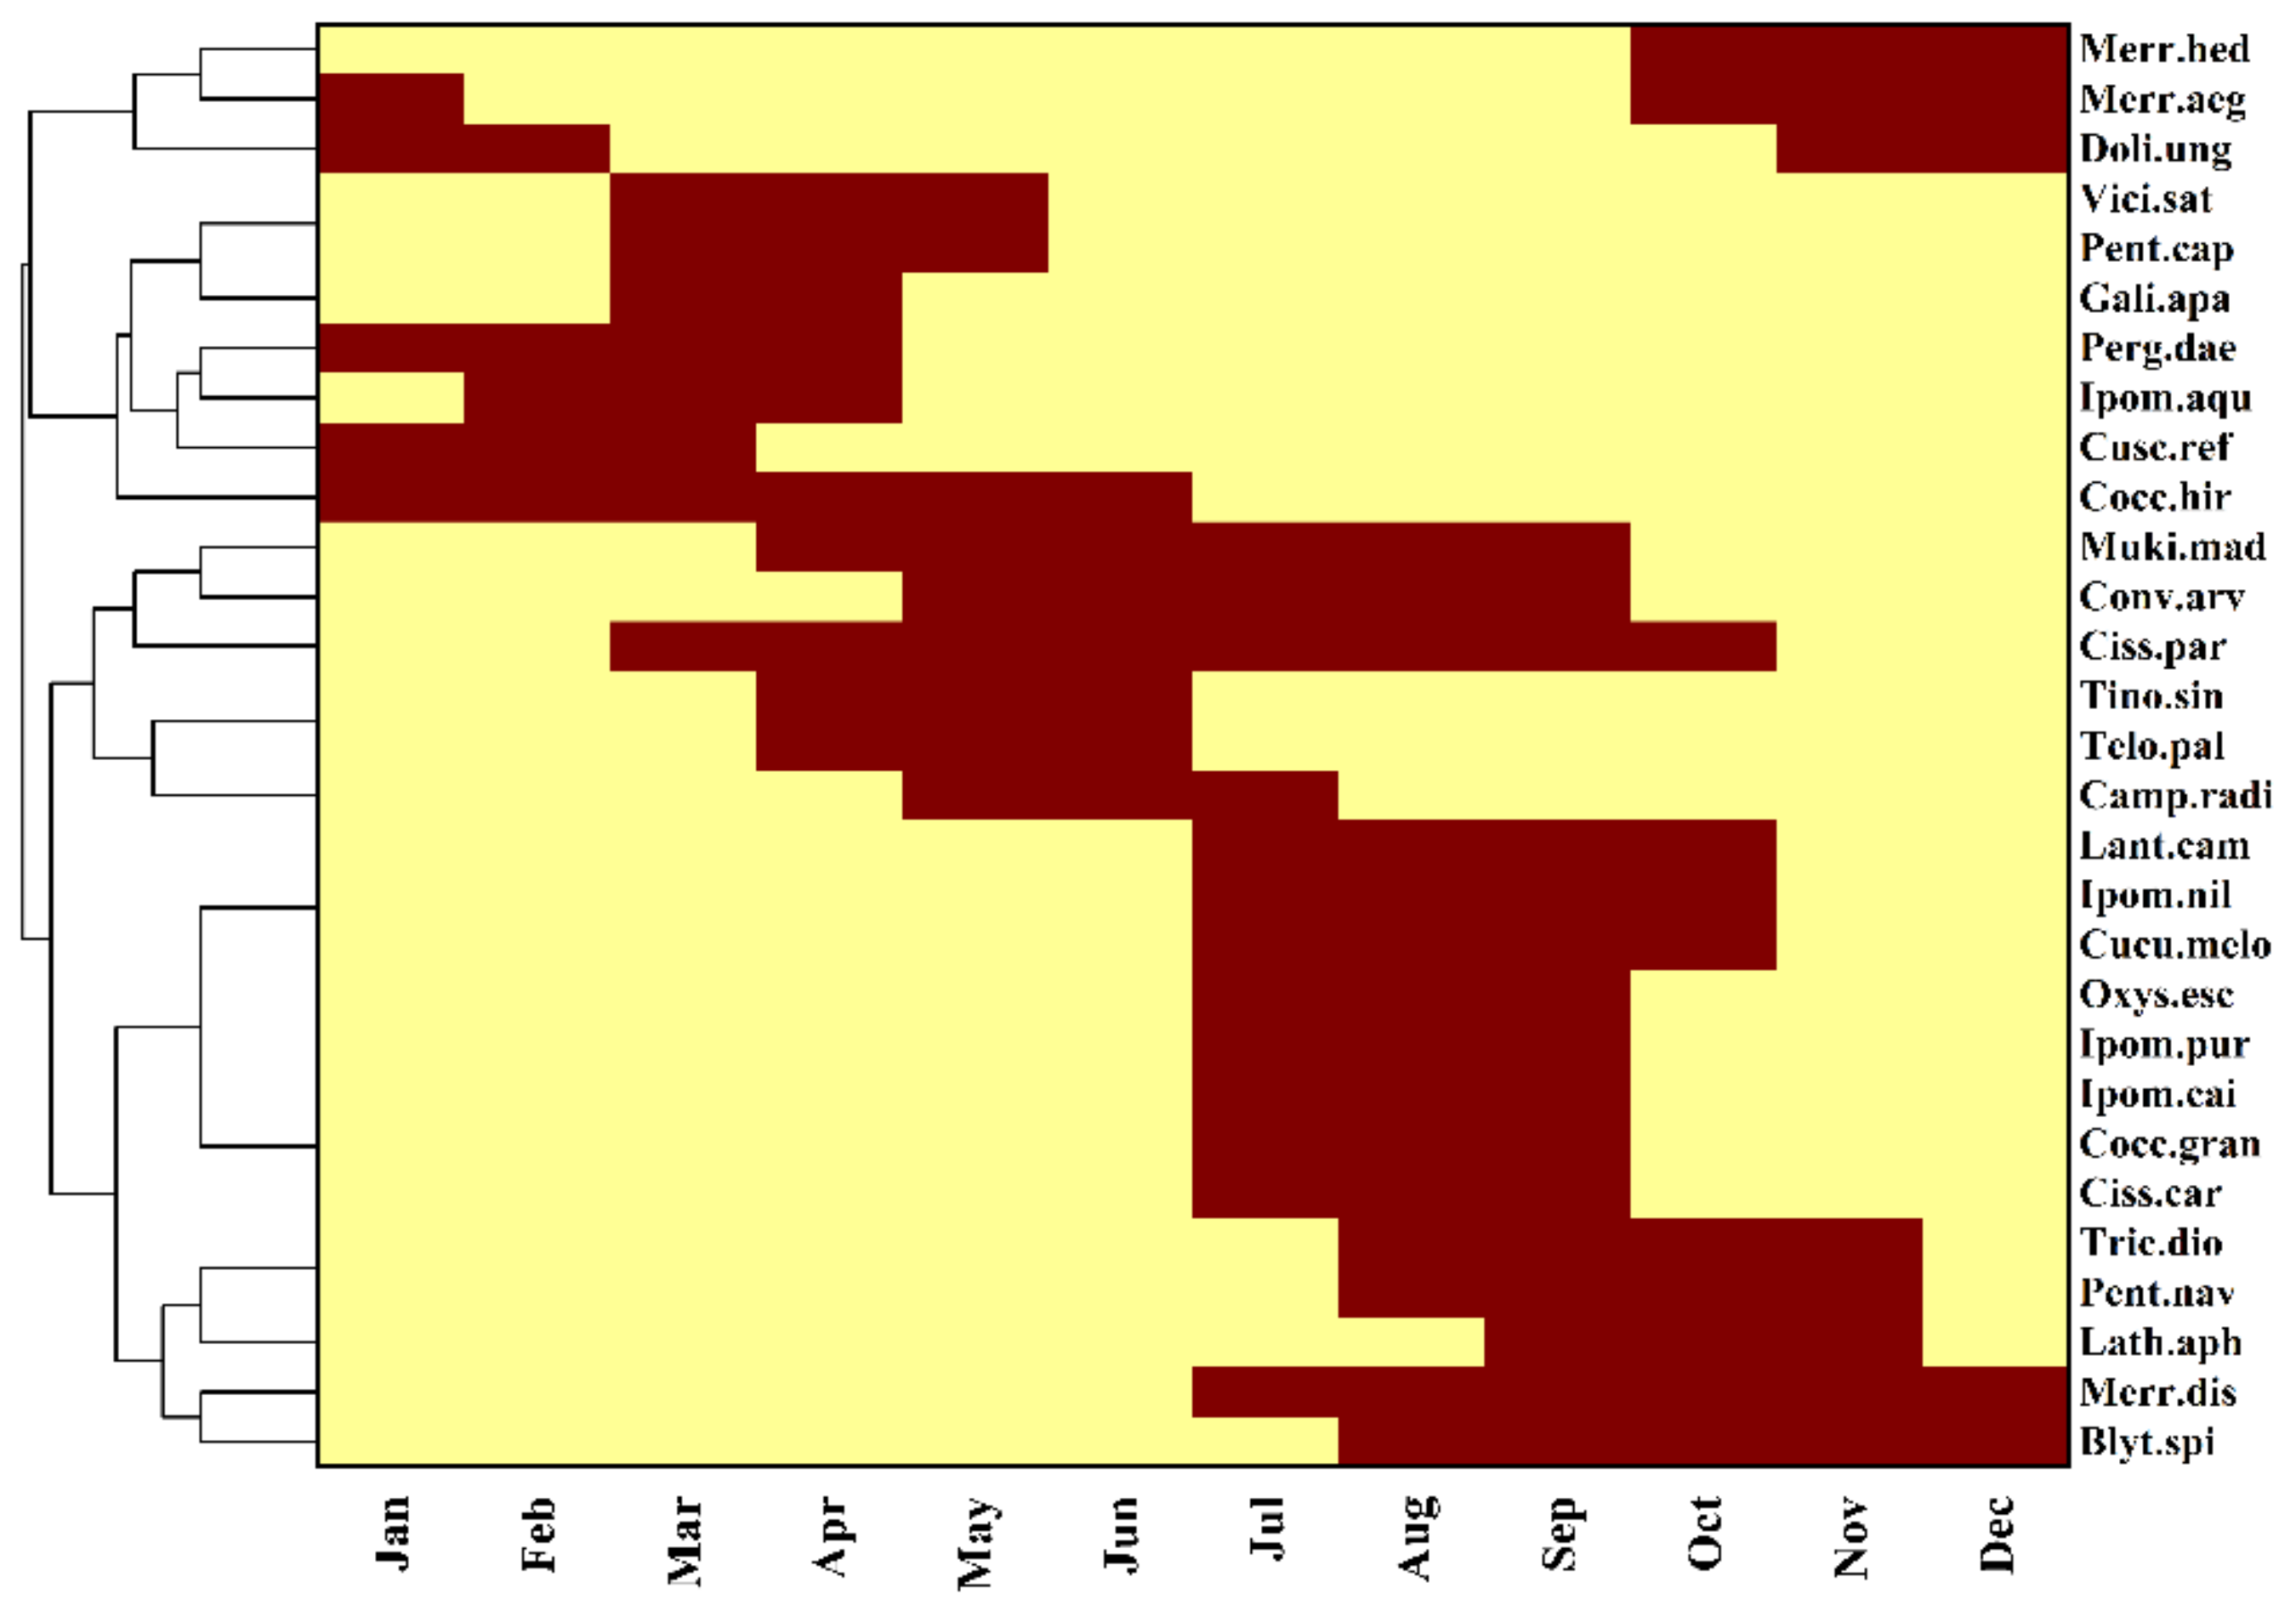
3.1. Taxonomic Diversity and Flowering Phenology

We recorded a total of 29 climber species belonging to 23 genera and 9 families from the Changa Manga Forest Plantation, Punjab (Pakistan). The predominant family was Convolvulaceae (30%), followed by Apocynaceae (20%), Cucurbitaceae (13.3%), Menispermaceae (10%), Bignoniaceae (6.7%), Leguminosae (6.7%), Asparagaceae, Rubiaceae, Verbenaceae, and Vitaceae with (3.3%). Majority of the climber species were herbaceous (70%), followed by woody (23.3%), parasitic, and climbing shrubs (3.3%) (Table 1). Most climbers exhibited twiners as their climbing mode (53.3%), while scrambler mechanisms comprised 26.6% and tendril mechanisms comprised 20% species.
The phenological response of flora represents the month-wise flowering period of each species. In the current study, the phenological responses of climbers recorded during the field survey revealed that maximum species showed the flowering stage during the months of August and September (46.6% each) and July (43.3%). The minimum flowering was recorded during December and January (23.3%), as well as February (16.6%). A cluster heat map was created in order to obtain the depiction of the association of species based on flowering stages and month-wise classification (Figure 2). The resultant dendrogram displayed two distinct clusters, in which months, i.e., July, August, and September, formed one group of the cluster, while the rest of the months formed the second cluster.

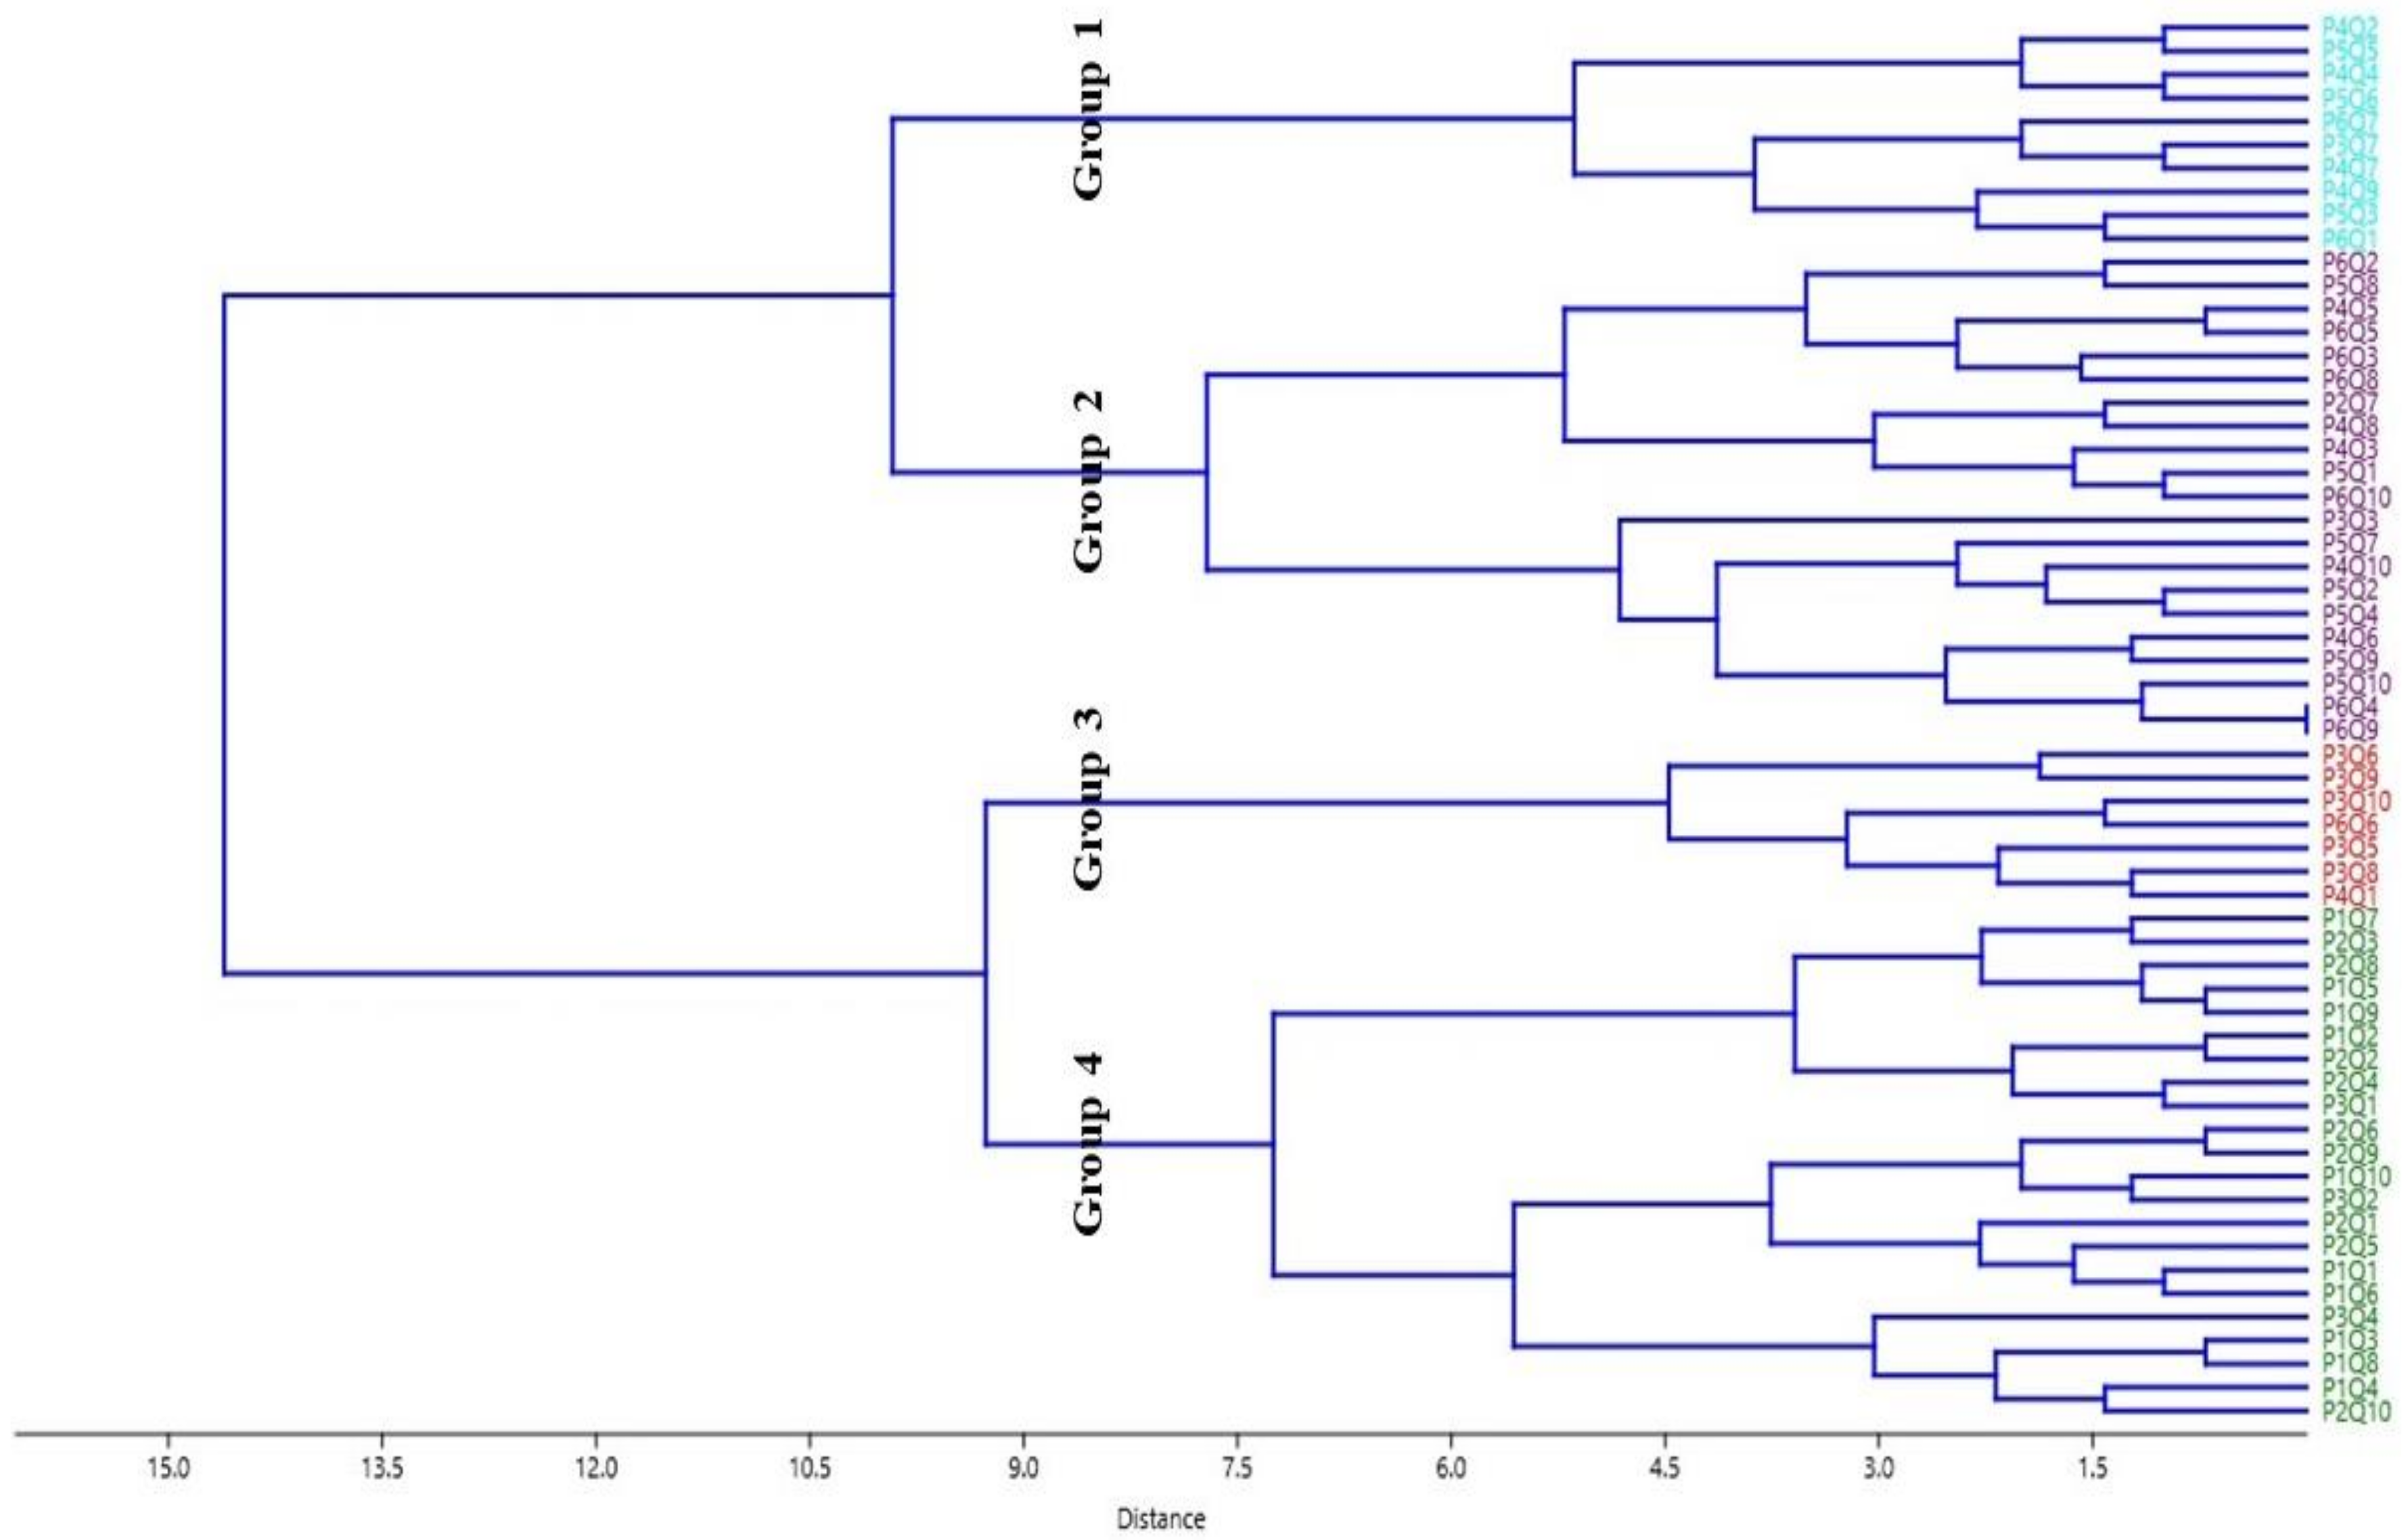
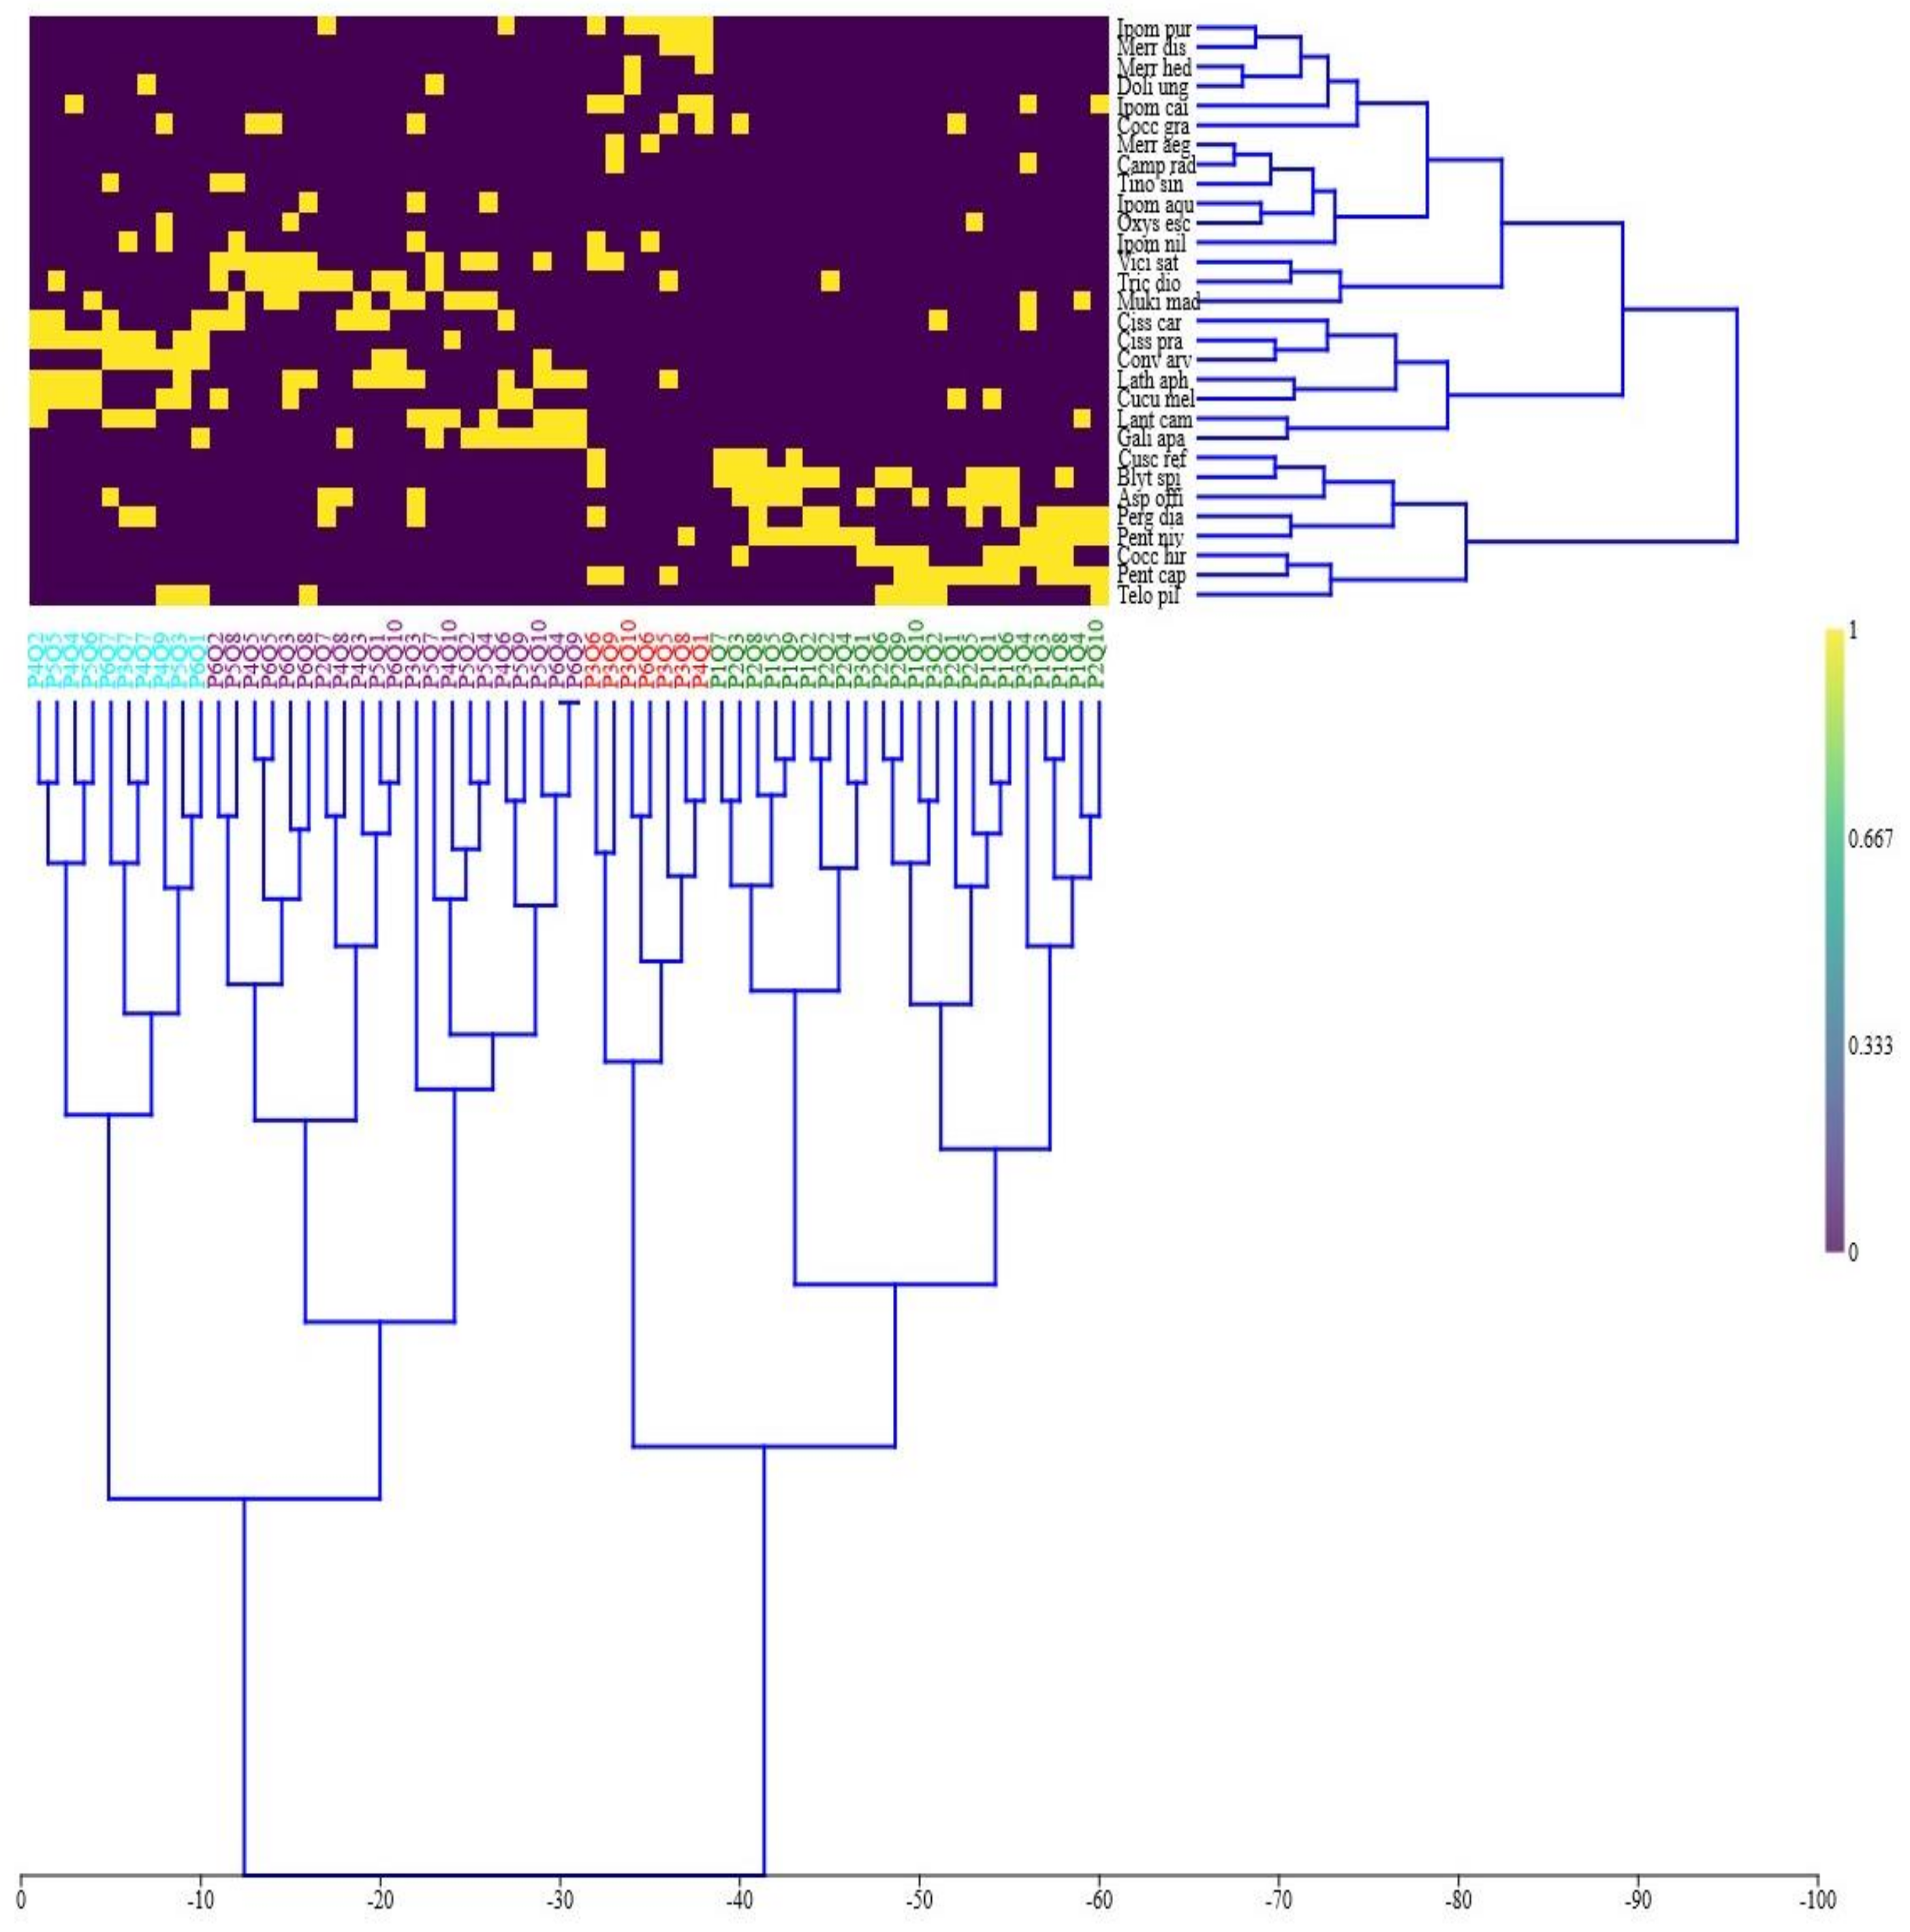
3.2. Cluster Analysis

Four plant community groupings were identified using cluster analysis and two-way cluster analysis (Figure 3 and Figure 4). The composition of the species and the proximity of the clusters grouped in one limb are more comparable. The cluster limbs one and four, on the other hand, were the most different to their surrounding groupings. The results of the categorization were confirmed using indicator species analysis. Following are the communities identified by indicator species analysis.

3.2.1. Group 1

Group 1 included 10 sampling plots, with 693 individuals belonging to 18 species. Cissampelos pareira was the dominant species, with 185 densities. The other most abundant species were Cucumus melo, Lathyrus aphaca, Telosma pallida, and Lantana camara. The group had 2.5 species richness and 0.5 species evenness, while Simpson and Shannon’s diversity values were 0.85 and 2.21 respectively. In group 1, most species (12) were herbaceous climbers, while eight species were twiners, six were tendrils, and four showed a scrambler nature.

3.2.2. Group 2

Group 2 contained 21 sampling plots, with 1315 individuals belonging to 20 species. In group 2, the predominant dominant species was Galium aparine with highest density, at 265, followed by Vicia sativa, Trichosanthes dioica, Lathyrus aphaca, Mukia maderaspatana, Lantana camara, and Cissus carnosa. Simpson and Shannon’s diversity values were 0.87 and 2.28, respectively, while species richness and species evenness in this group was 2.64 and 0.49, respectively. In group 2, the 15 species showed herbaceous nature, four were woody climbers, and one was a climbing shrub. Out of these species, eight species were twiners, seven tendrils, and five scramblers.

3.2.3. Group 3

Group 3 consisted of only seven sampling plots with 297 individuals from 17 species. The predominant species observed from group 3 was Ipomoea purpurea, with a density of 90. Other abundant species in group 3 were Vicia sativa and Merremia aegyptia. Species richness and evenness were 2.81 and 0.61, respectively, in group 3. Simpson and Shannon’s diversity values were observed to be 0.85 and 2.34, respectively. In group 3, herbaceous climbers comprised fourteen species, three were woody climbers, and one was a parasitic climber. Out of these, fifteen species were twiners, one was a tendril climber, and one was a scrambler.

3.2.4. Group 4

Group 4 included 22 sampling plots, and counted 528 individuals from 17 species. The observed predominant species was Pentatropis nivalis with density 90, followed by Blyttia spiralis. Simpson and Shannon’s diversity values were highest in group 4, at 0.88 and 2.32, respectively, while species richness and evenness were 2.55 and 0.59, respectively. In group 4, eleven species were herbaceous climbers, four woody climbers, one parasitic, and one a climbing shrub.

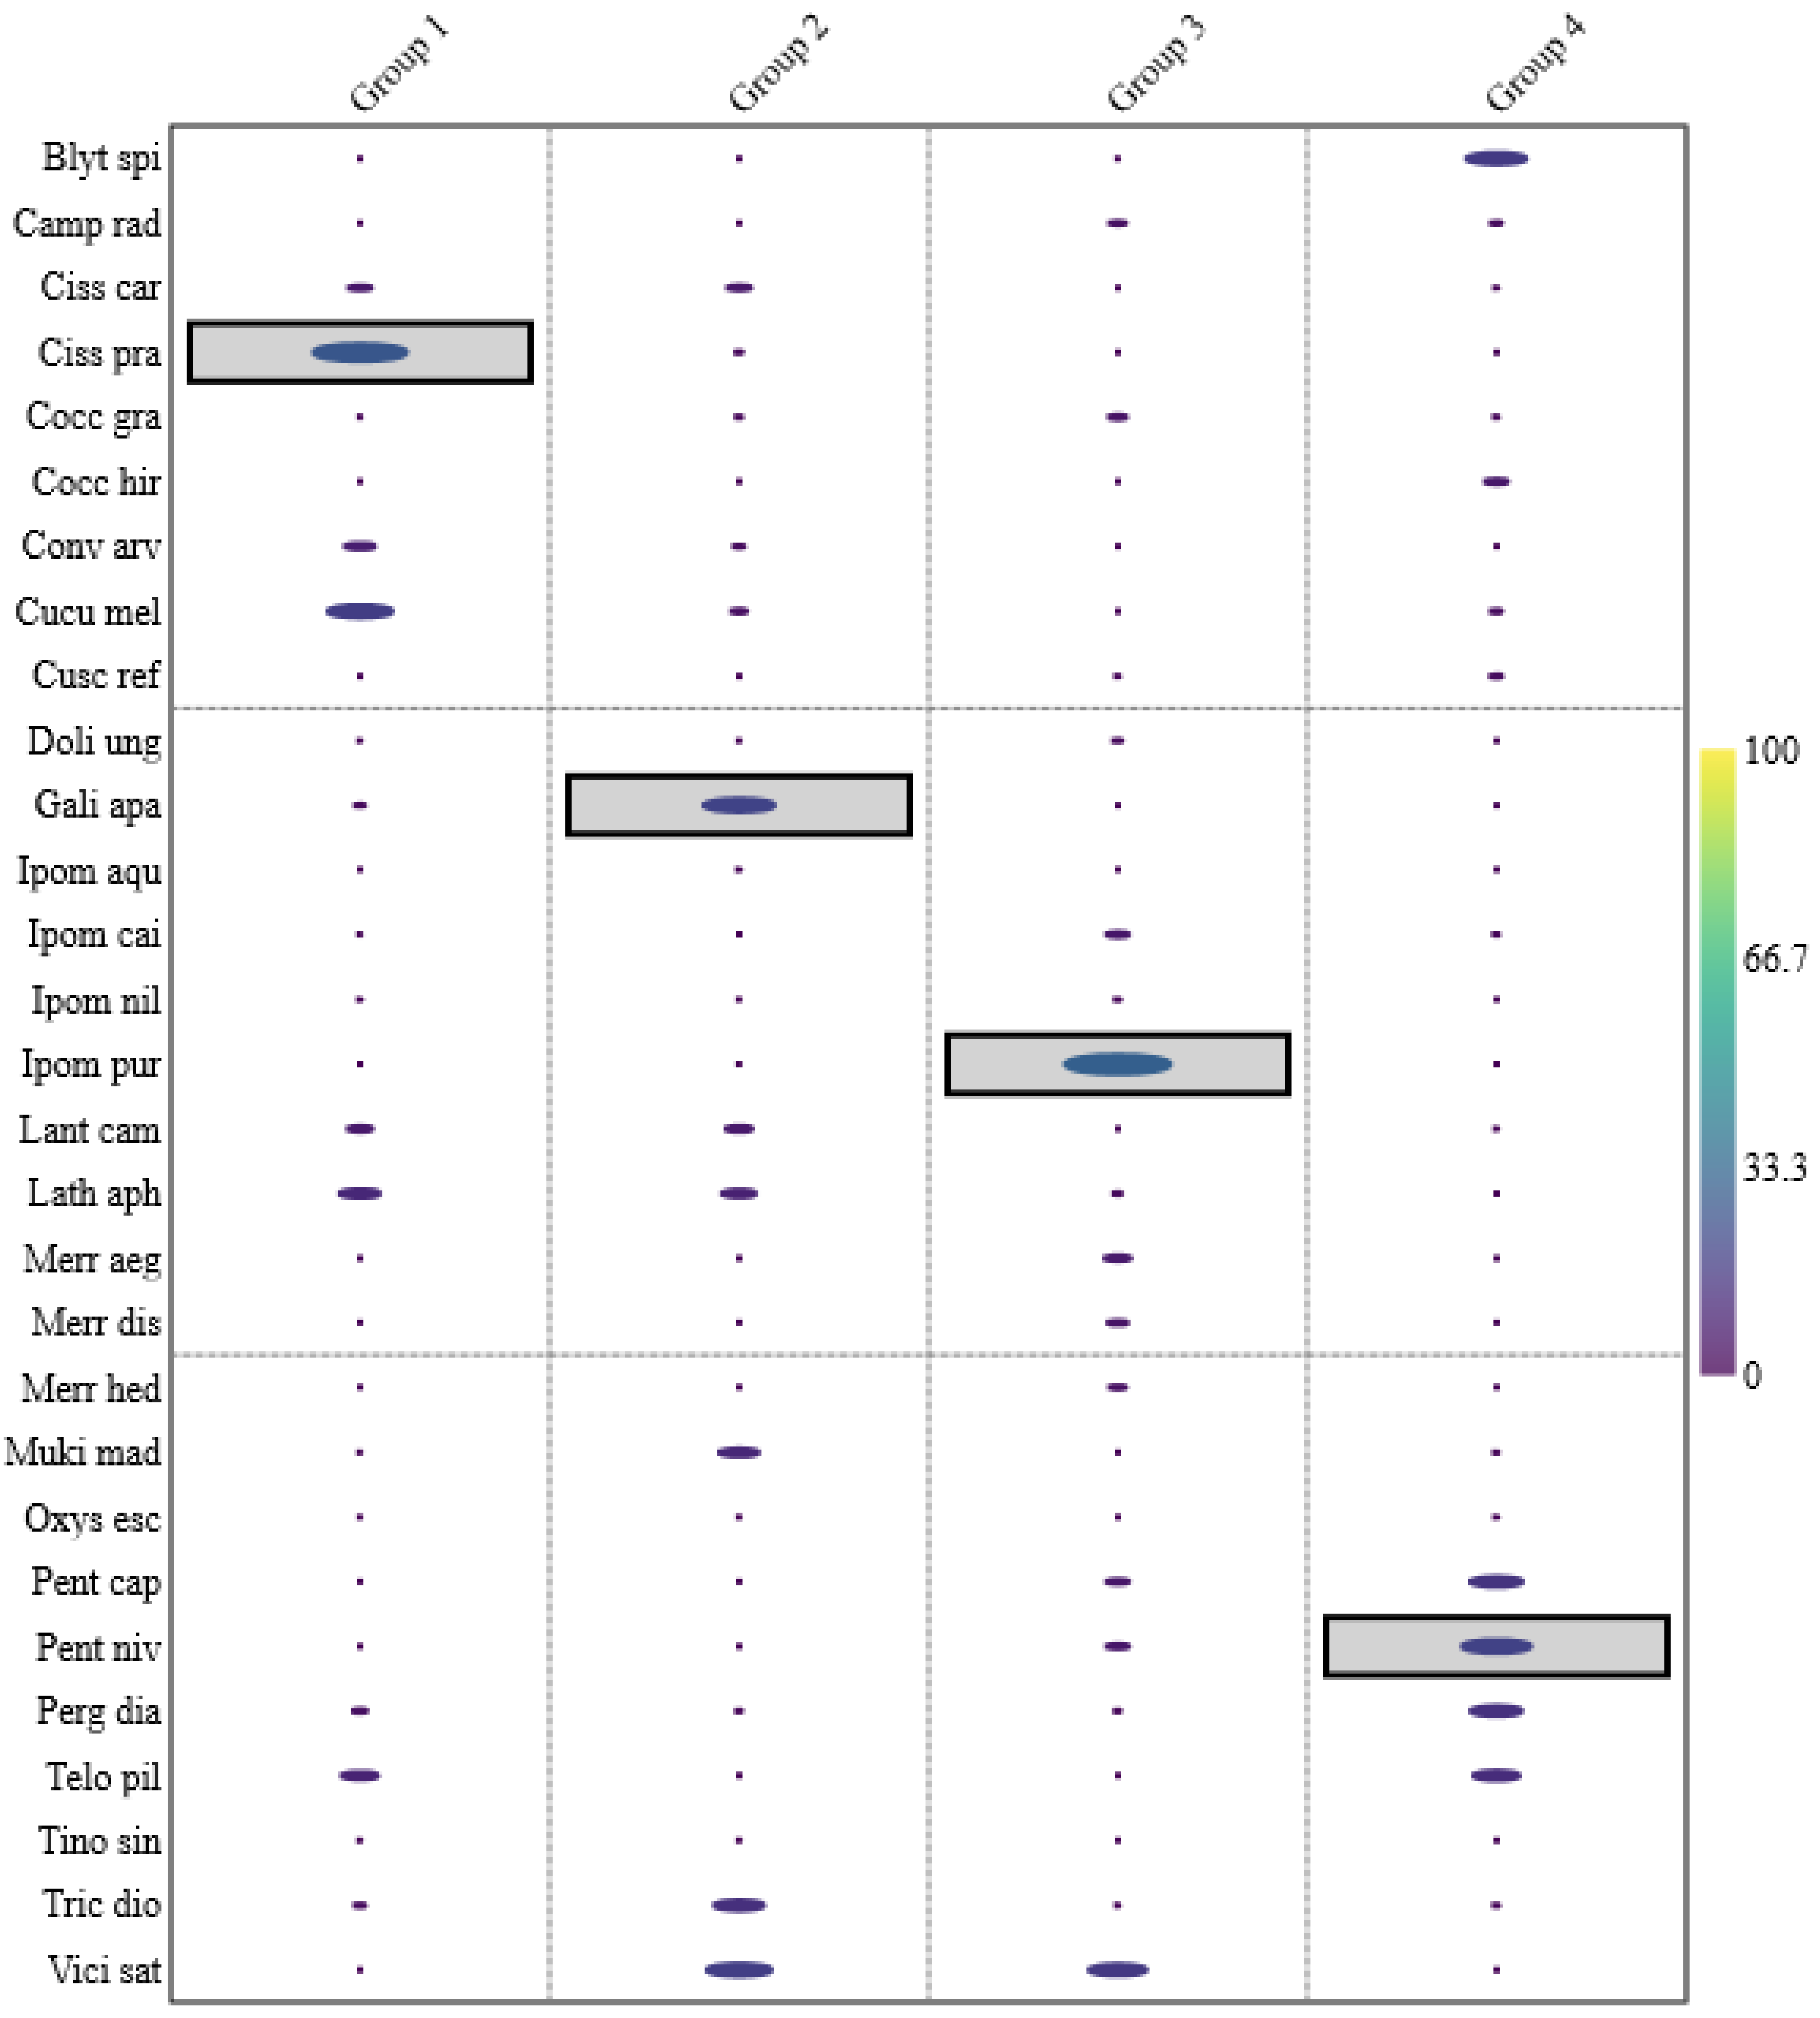
3.3. Indicator Species Analysis

The investigation of indicator species revealed the separation between the four groups of climbers, as evidenced by several species with high and significant indicator values (Figure 5). In group 1, the indicator species was Cissampelos pareira with (p < 0.03) value, while in group 2, the indicator species Galium aparine had a (p < 0.033) value. In group 3, the indicator species was Ipomoea purpurea with (p < 0.0306), and in group four, the indicator species was Pentatropis nivalis. The data attribute plots of the indicator species of each group are presented in Figure 6.

3.4. Edaphic Parameters and Climber Distribution

For investigating the role of soil on the distribution of climber species in the forest the edaphic properties of soil texture (sand, silt, and clay), nutrients (nitrogen, phosphorus, potassium, and organic matter), and chemical properties (electrical conductivity, pH, and moisture) were chosen (Table 2). The sampling quadrats in group 1 had sandy soil texture, with 54.96 ± 1.25 sand proportion, while group 3 has the lowest sand proportion, with 25.25 ± 0.95. Similarly, the highest silt proportion was recorded from group 4 sampling sites, possessing 46.78 ± 1.93, and the lowest from group 1. A high clay proportion was recorded from group 3 sampling sites, i.e., 28 ± 3. 45. The sampling locations of group 4 had the highest soil nutrients, soil organic matter (0.74 ± 0.01), potassium (383.79 ± 41.7), and phosphorus 2.67 ± 0.5. The nitrogen, moisture, and pH of the soil in group 2 had the highest values, at 0.35 ± 0.07, 18.36 ± 1.95 and 7.02 ± 0.15, respectively, as compared to other groups (Table 2).

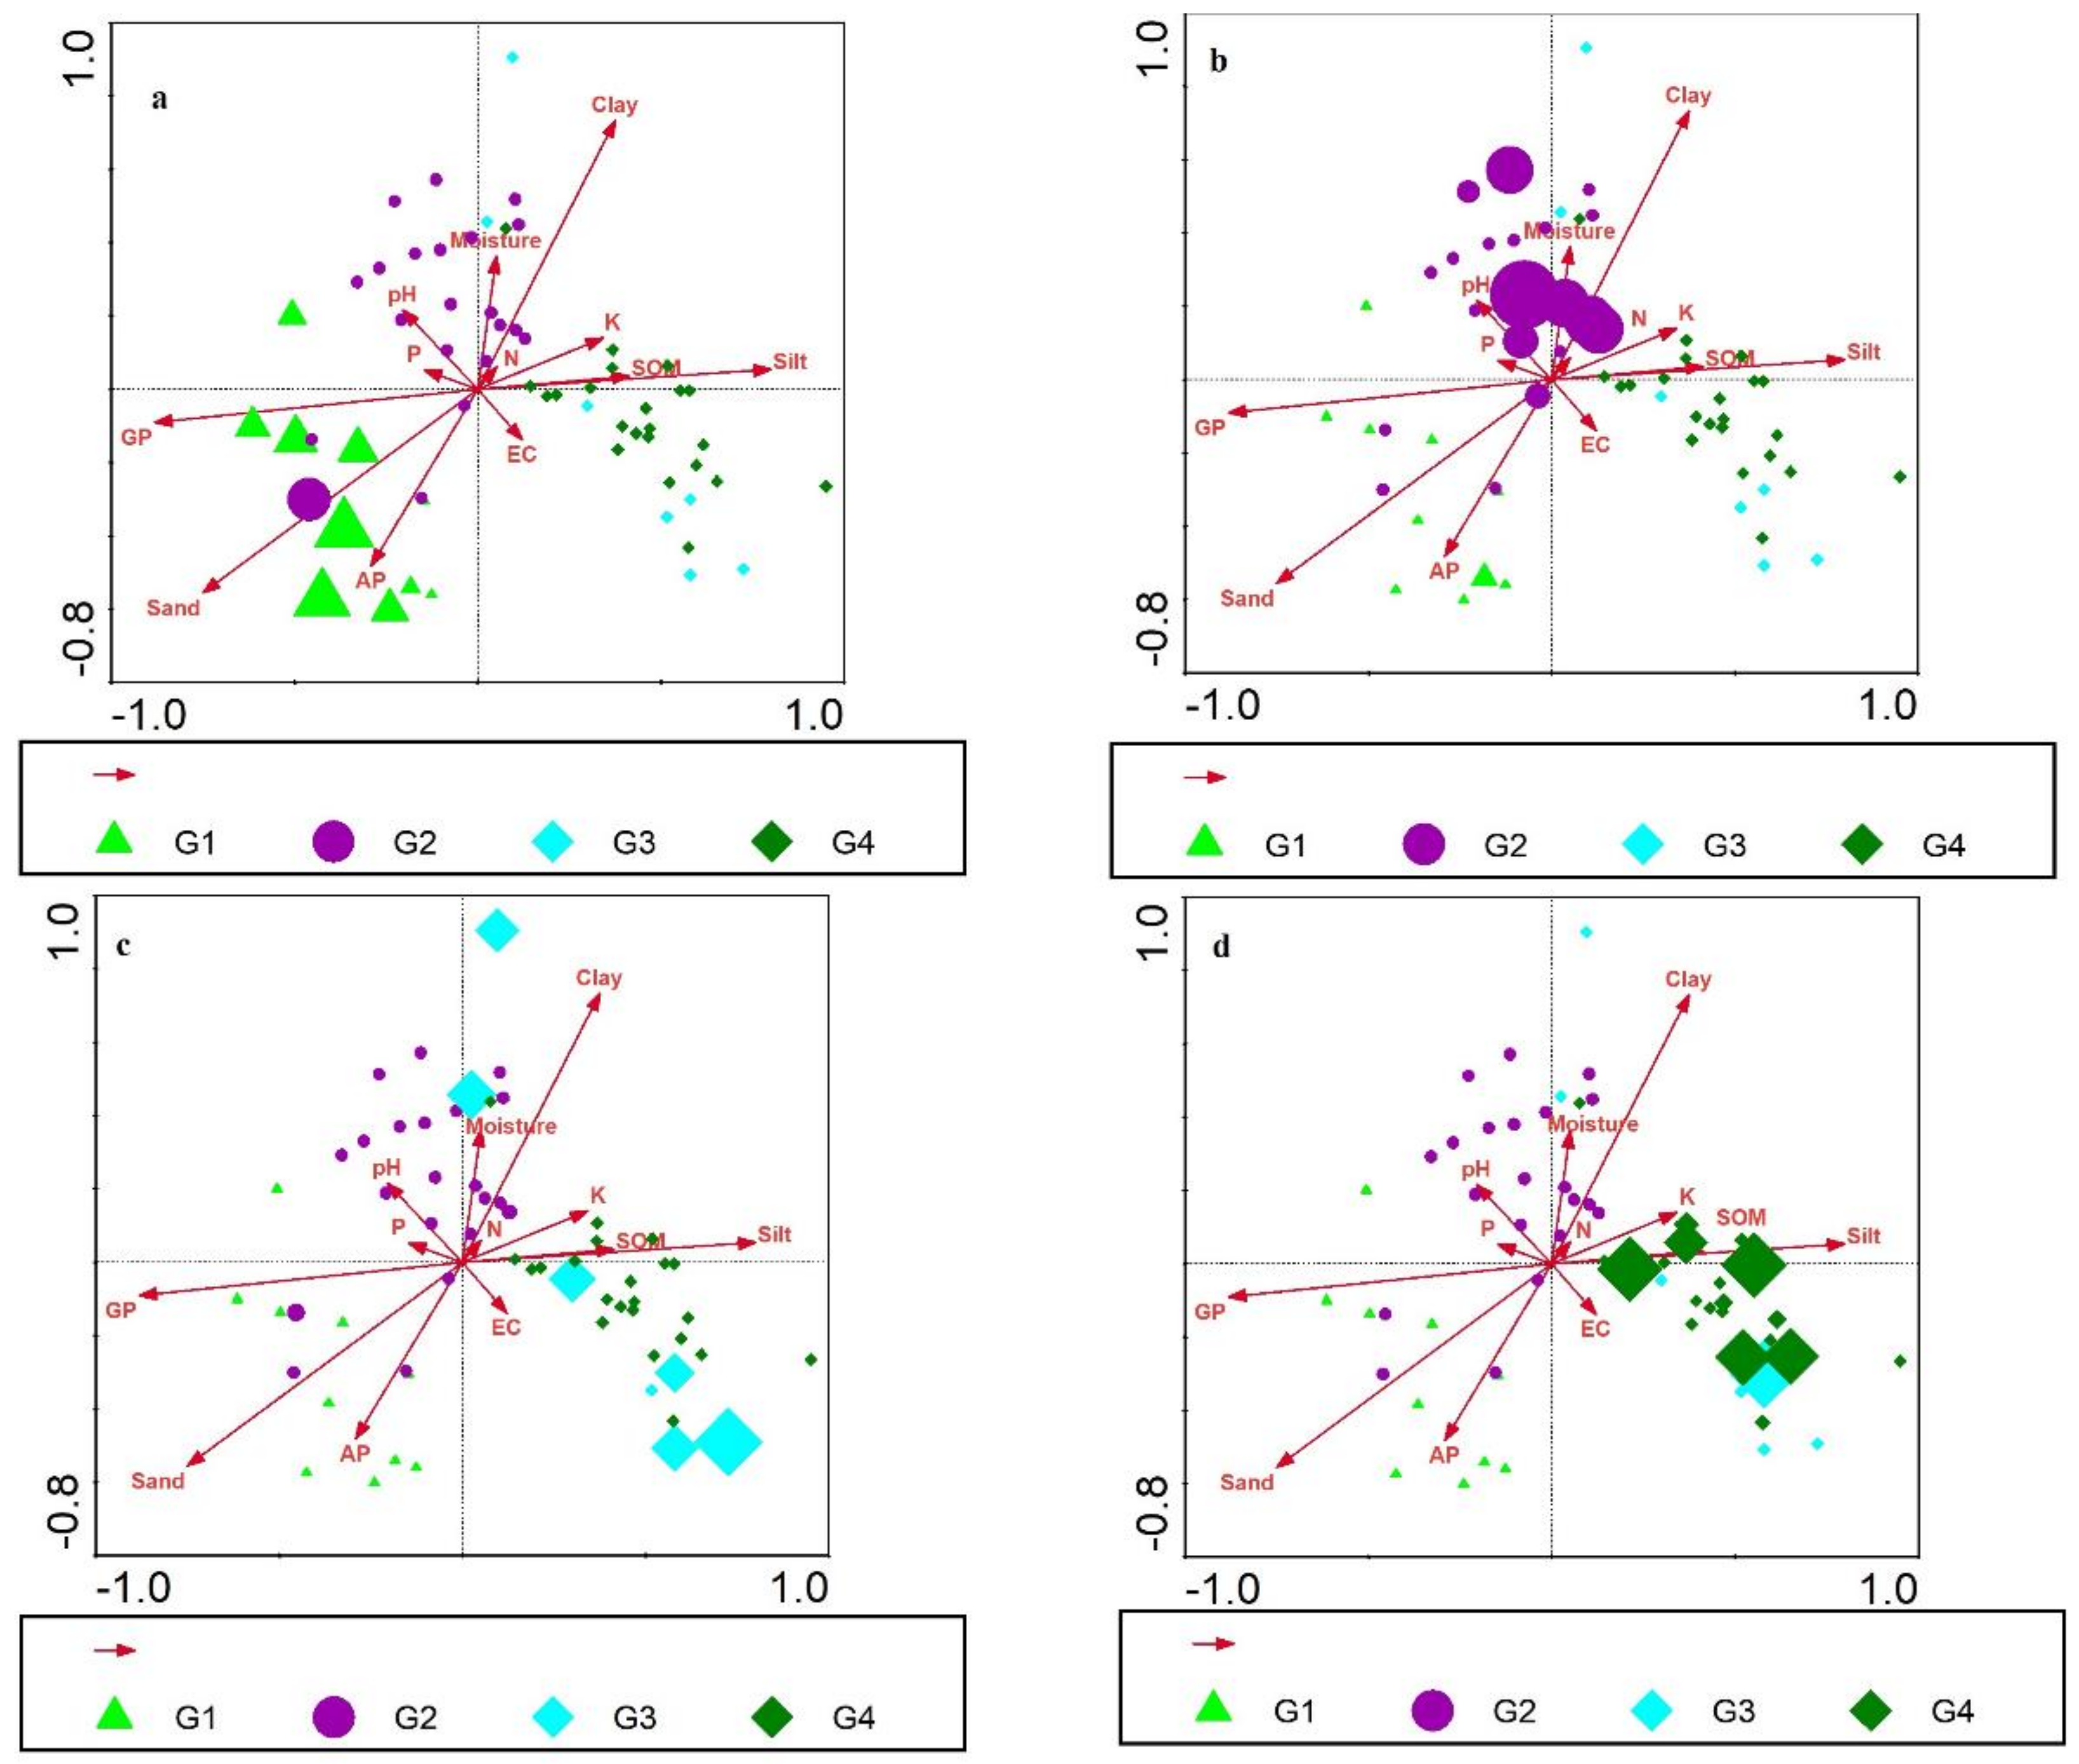
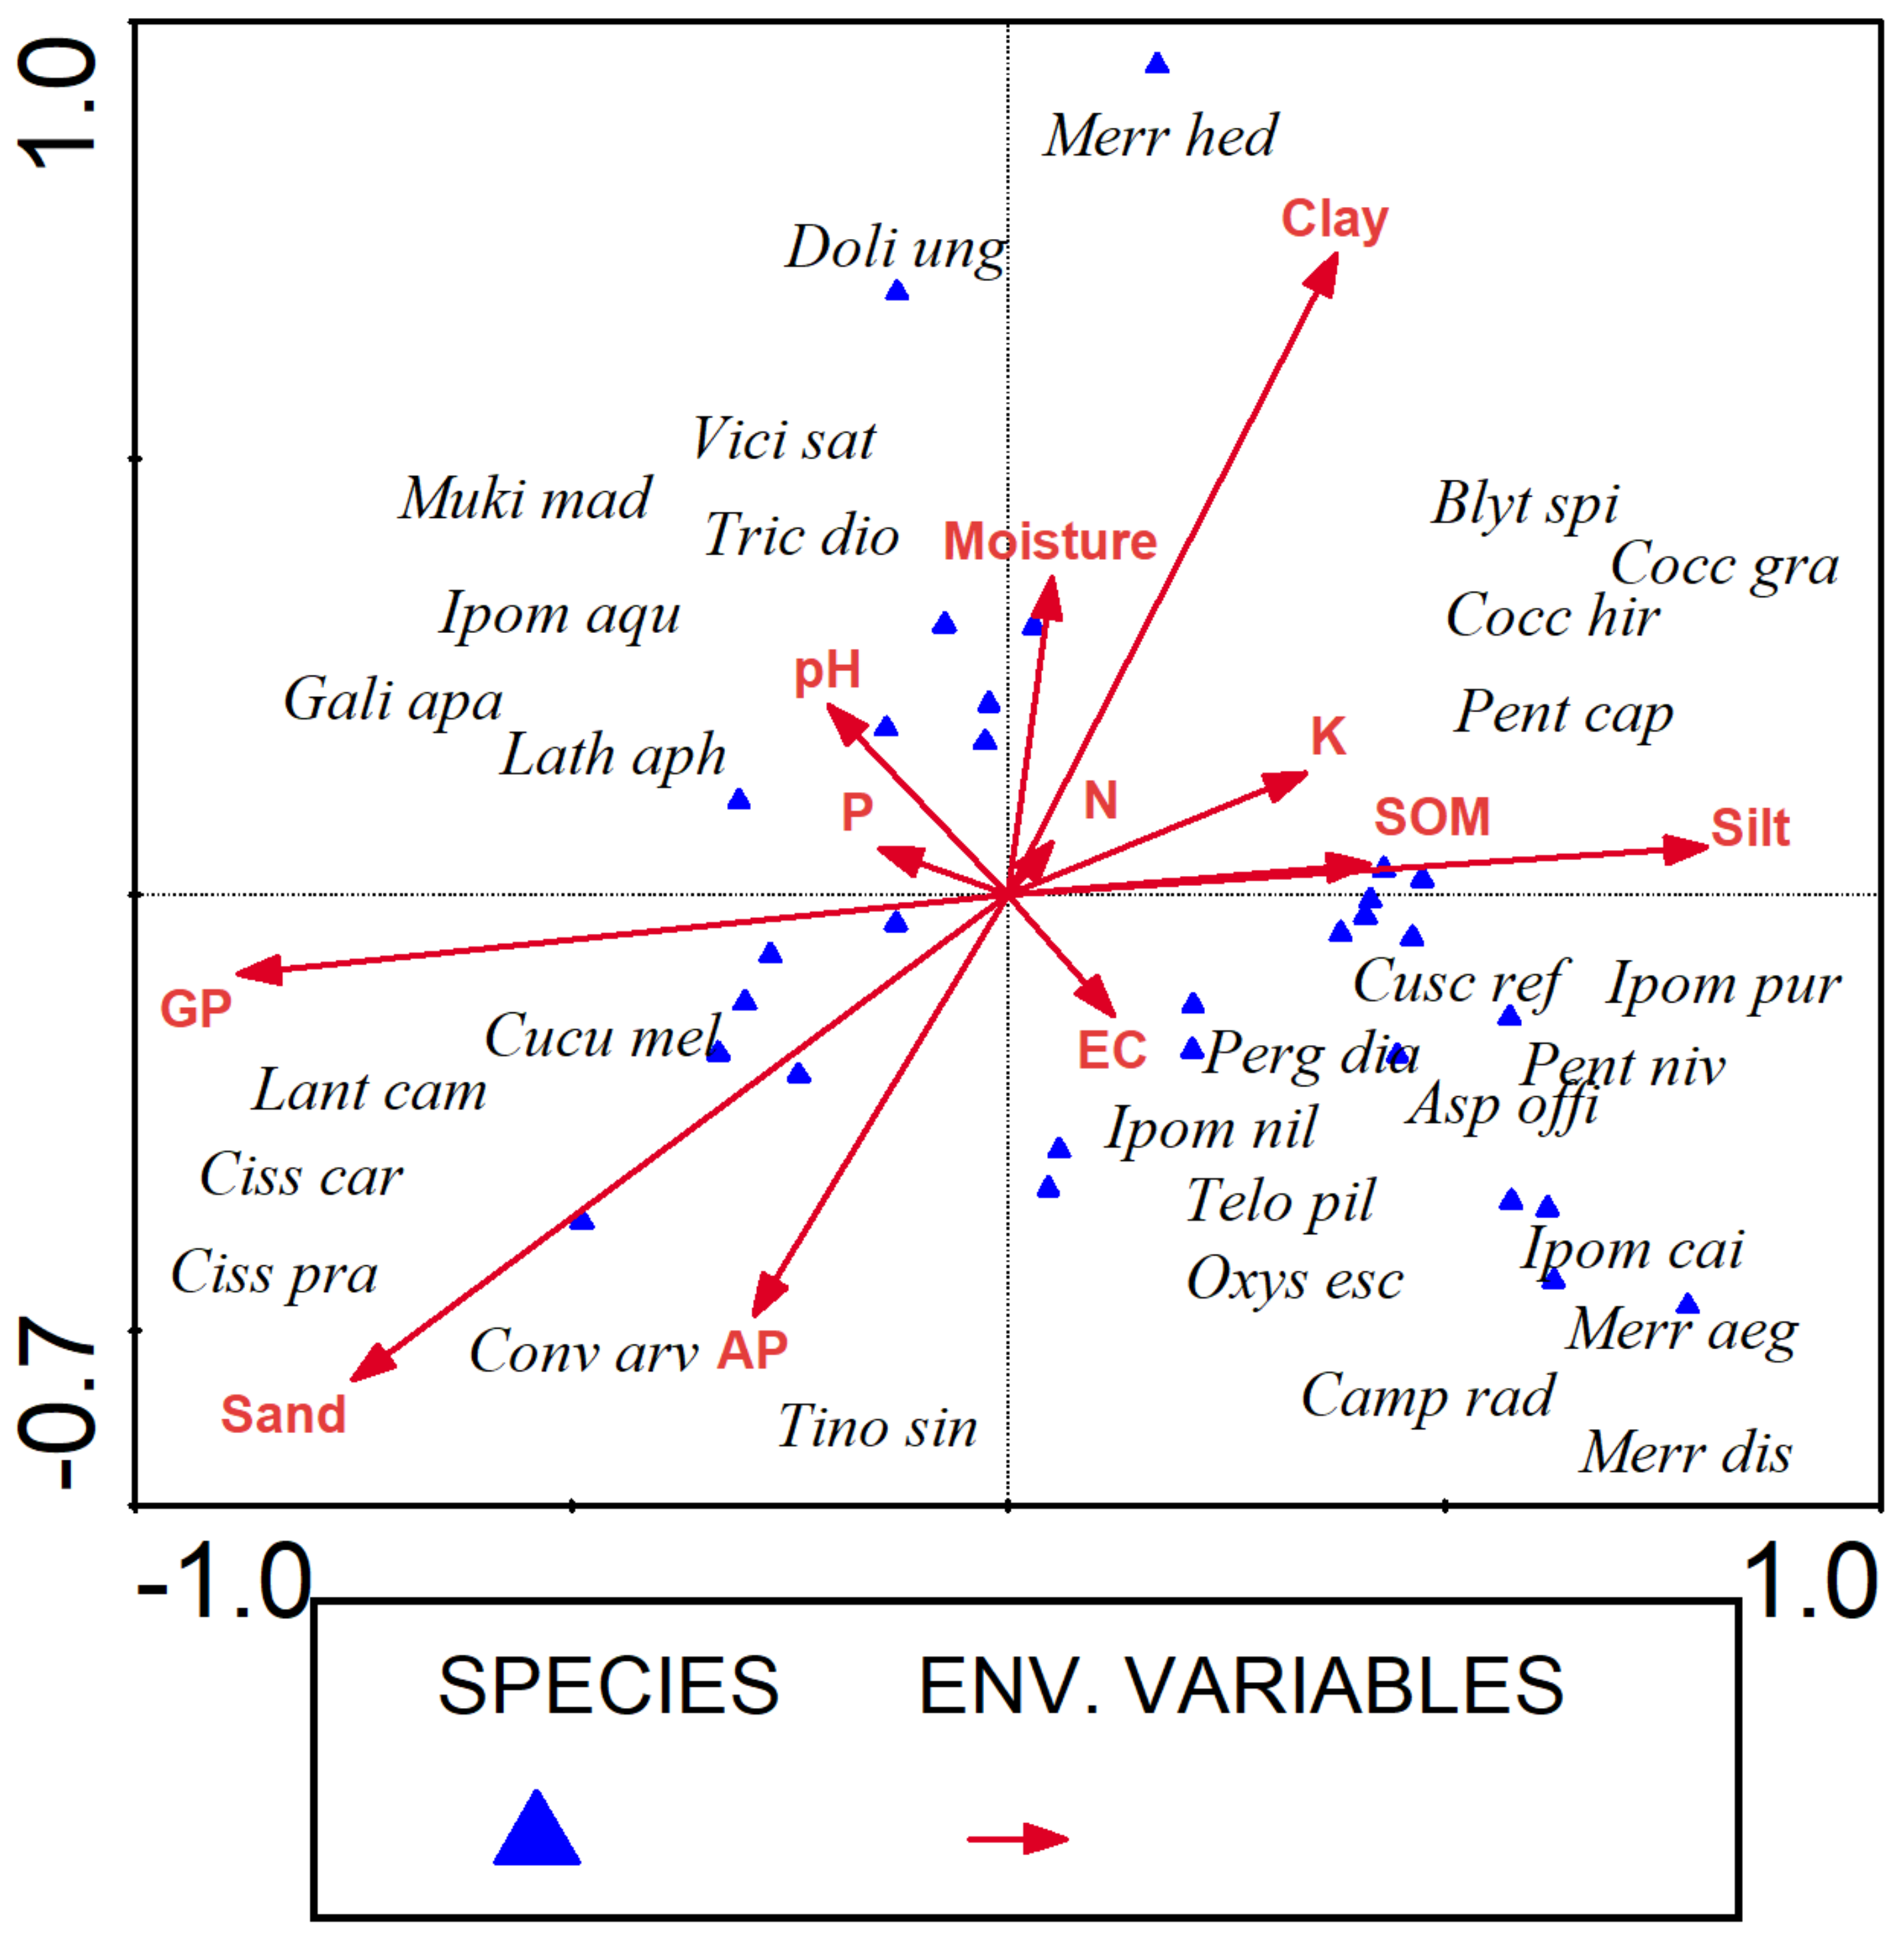
3.5. Canonical Correspondence Analysis

The effect of the environmental variables and anthropogenic disturbance was elucidated by multivariate analysis on the distribution of climber plants from the Changa Manga Forest Plantation, Punjab Province, Pakistan. The results showed that pH, electrical conductance, nitrogen, potassium, phosphorus, soil organic matter, silt, sand, clay, soil moisture, anthropogenic pressure, and grazing pressure determined the species composition and distribution pattern. The environmental gradients exhibited a significant impact with (p ≤ 0.002) on climber plant structure from the study area. Table 3 highlighted the eigenvalues of CCA, total inertia, and cumulative percentage variance of species data.
The climber species that are sensitive to clay, silt, soil moisture, potassium, nitrogen, and soil organic matter include Merremia hederacea, Pentatropis capensis, Coccinia grandis, Cocculus hirsutus, and Blyttia spiralis. Phosphorus and pH also have impact on the distribution of climber plants; however, the species that are positively associated with their values comprise Vicia sativa, Ipomoea aquatic, Mukia maderaspatana, Dolichandra unguis-cati, Trichosanthes dioica, Lathyrus aphaca, and Galium aparine. The species associated with sand, grazing pressure, and anthropogenic pressure include Cissampelos pareira, Cissus carnosa, Convolvulus arvensis, Cucumis melo, Lantana camara, and Tinospora sinensis. The species that were positively associated to electrical conductance (EC) include Campsis radicans, Ipomoea cairica, Ipomoea nil, Ipomoea purpurea, Oxystelma esculentum, Pentatropis nivalis, Pergularia daemia, Telosma pallida, Merremia aegyptia, and Merremia hederacea (Figure 7). In comparison to the second axis, which explained 11.8% of the variation, the first CCA axis explained 9.1% of it. The third and fourth axes of CCA explained 13.6 and 14.7% of the cumulative variance in climber data, respectively. All of the Eigenvalues added up to 7.343 as the result of the Monte Carlo Test. The first axis’s Eigenvalue was significant (0.67). A total of 56.8% of the species–environment relationship’s percentage variance was cumulative.

4. Discussion

The study of assemblage, distribution patterns, and diversity of plants are important for the exploration of ecological investigations and natural resources conservation [43]. Studies on floristic composition and the factors affecting them are crucial for a better understanding of structure and ecosystem processes [44]. Comprehensive analyses of the diversity of wild climbers may help with framing strategies for conservation and management of the natural area as well as forest plantations, as observed from the present investigations. Presently, 29 climber species belonging to 09 families were recorded from the Changa Manga Forest Plantation. Other similar studies were also carried out on various forests in the world; e.g., [45] documented 285 climber plants from the various forests of Southern Western Ghats India. From southern Eastern Ghats’ tropical forests, [46] reported 175 climbing plants. In addition, [47] recorded 169 climber plants from the Cagarras Islands Natural Monument (CINM) located offshore of Rio de Janeiro, Brazil. In another study from Brazil, Ref. [48] documented 93 climber species from land Atlantic forest. In India, Ref. [49] observed 47 species belonging to 26 families from tropical dry forests of Northern Andhra Pradesh. A total of 95 species of climber plants were observed in tropical seasonal rain forests of Xishuangbanna, China by [50]. From Pakistan, only Rahman [12] recorded 23 climber plants from the Monsoon forests of Murree. Even though the results of these earlier isolated studies are similar to the results of the current study, there are few dissimilarities due to differences in the physical characteristics of the sampling plots, the methodology used, and the measurement time.
The most abundant climber plants in the current investigations were Vicia sativa, Galium aparine, and Trichosanthes dioica, while [12] recorded Hedera nepalensis and Ipomoea purpurea as abundant species from Monsoon forests of Murree. Contrary to Rahman’s findings, Ipomoea purpurea was moderately abundant in the study area. The difference was due to differences in ecological zonation, given that Murree forests lie in the moist temperate zone while the study area was located in a semi-arid zone. We recorded 2833 individuals from 29 species from 6 sampling sites in the Changa Manga Forest Plantation, comparatively, as [12] species density was low, and they recorded 3400 individuals from five sampling plots. Species density and richness increased along with altitude [12,51]; however, the Changa Manga forest plantation had not possessed any altitudinal variation. Moreover, the mechanism of attachment to their hosts in climbers is an important factor in their diversity, distribution, and abundance [52].
Plantations are a common land use type, but a better knowledge of their potential and ecological functioning is required for developing and implementing socially and environmentally sustainable land-use policies that will improve important ecosystem services [40]. In order for us to better focus conservation efforts, it is crucial to understand the flora of these plantations. The results of this study confirmed that the part of the forest under high anthropogenic pressure has less diversity of plants. However, identifying the indicator species, or group of species, that reflect the biotic or abiotic state of an environment or indicate the diversity of other species, taxa, or entire communities within an area will be useful in policy implications for managing forest habitat. The indicator species recorded for forest disturbance in semi-arid and dry regions were Pentatropis nivalis, Pentatropis capensis, and Pergularia daemia. Pergularia daemia was also reported as the dominant climber in the Murree forest [12]. These species are well known for their propensity to accumulate resources in excess of what they actually require (luxury accumulation), which limits the amount of those resources in the expanding habitat and has severe competition effects [53].
Plant phenological changes brought on by climate change may have a feedback effect on the climate, because they play a crucial part in regulating seasonal dynamics of water and energy exchanges between terrestrial ecosystems and the atmosphere [54]. There is little evidence of non-climate driven phenological shifts as of yet, but changes in climatic conditions can affect plant species’ flowering times [55]. Most species’ flowering seasons begin in August and September. According to Haq [56], the flowering may be associated with favorable climatic conditions for the survival of the offspring. It is now generally acknowledged that various biological interactions and phylogenetic relationships play a role in shaping the phonological pattern [57].
The findings of this investigation also showed that different forest parts had significantly varying soil physicochemical properties. Forest soil physicochemical properties change through time and space as a result of anthropogenic activities, climate, weathering processes, plant cover, microbiological activity, and a variety of other biotic and abiotic factors [58,59,60]. In close proximity, soil quality varies according to parent rocks, vegetation cover, and land use. Bioclimatic conditions can change quickly and over short distances in semi-arid regions, leading to a remarkable variety of soil types and their chemical, physical, and biological characteristics [61,62,63,64,65], as well as shifting vegetation patterns [30,58]. We discovered that edaphic characteristics, such as soil texture and chemistry, emerged as important predictors of plant community composition in addition to climatic parameters such as temperature and precipitation. Other studies have suggested similar connections between soil edaphic characteristics and plant species composition, which can be explained by the fact that local edaphic characteristics influence the resource availability of water and nutrients in various soil types, selecting plant communities with a variety of ecological functions [29,30,36]. Under the effect of various environmental variables, canonical correspondence analysis was applied in order to observe the distribution pattern of 30 climber species in 60 sampling plots from 6 sites. Grazing pressure, soil moisture, pH, electrical conductance, soil organic matter, nitrogen, phosphorus, soil texture, and anthropogenic activities are all important factors, having a significant (p ≤ 0.002) impact on climber structure and organization. The results were in line with the findings of [60] from Malaysia’s tropical forest, the Sabah forest, Borneo [61], and the lowlands of the Sabah forest, Borneo [62]. Climber species’ diversity, richness, and distribution were mostly impacted by soil moisture and soil texture. The most important environmental component, having a detrimental impact on climber diversity and abundance, was found to be soil texture, even on a small scale range. Additionally, climbers favored locations with high soil moisture and nitrogen content, low pH, and high soil organic matter requirements. Our findings are corroborated by [62], who attributed climber diversity and abundance to their hosts and elevation. This was consistent with earlier investigations that discovered lianas in abundance at lower elevations [5,10,25,62]. Other studies in the tropics have found that abiotic factors influence the growth of lianas in ecosystems [20,63,64,65,66,67,68,69,70]. Across all phases of host tree growth in tropical forest plantations, climber species diversity rises with increasing host diameter. Increases in climber species richness with DBH might be directly attributed to the greater area for climber colonization and growth, as well as increased exposure to climber propagule rain throughout the course of a longer host tree life. This trend may also be caused by the increased range of microenvironments present on bigger tree trunks [71,72].
Indicator species that are based on scientific knowledge and depict the complexity of the environment are important because they can be easily and regularly verified [73]. Each habitat type and plant group often has one or more indicator species [37,38]. Our findings demonstrated that utilizing data from the most common species, indicator species generally correlated well. Four species were recognized as the main indicator species of climber plants in the Changa Manga Forest Plantation, i.e., Cissampelos pareira, Galium aparine, Ipomoea purpurea, and Pentatropis nivalis. These species have leaf structures that enable a broad distribution, including xeric, and were adapted to various edaphic conditions. The dominance of Galium aparine in group 2 was an indicator of high moisture, and was quite relevant to the characteristics of this species. Because the species is a global weed with significant morphological and physiological adaptability, it may colonize a wide range of habitats [74]. The attachment mechanism of Galium aparine leaves with a variety of surfaces of different host species enable the plant to successfully colonize [75]. On the other hand, Ipomoea purpurea in group 3 shows faster growth when there is competition, as plants have an advantage over slower-growing ones because they can emerge from the vegetation to access photosynthetic resources [76]. The larger climbers are more common in dense forests, which are home to taller and larger trees, whereas the smaller climbers are more common in disturbed forests, which likely reflects different survival strategies [77]. In our study, the larger climber Cissampelos pareira was more prevalent an indicator species in dense parts of forest, while Pentatropis nivalis, a smaller climber, was more dominant in disturbed parts of the forest.

5. Conclusions

The current study reported 29 climber plants from the Changa Manga Forest Plantation. The most dominant families were Convolvulaceae and Apocynaceae. The majority of species flowered throughout the months of July, August, and September. The environmental variables pH, electrical conductance, nitrogen, potassium, phosphorus, soil organic matter, silt, sand, clay, soil moisture, anthropogenic pressure, and grazing pressure determined the species composition and distribution pattern. The environmental gradients exhibited a significant impact, with (p ≤ 0.002), on climber plant structure from the study area. The results of the indicator species analysis of grasses showed 4 species, i.e., Cissampelos pareira, Galium aparine, Ipomoea purpurea, and Pentatropis nivalis as key indicators from the study area. The identified indicator species will have policy ramifications for managing forest habitat, conserving resources, and restoring the ecological balance of semi-arid landscapes. They will also contribute to filling a knowledge gap in the semi-arid region of Punjab.

Author Contributions

Conceptualization: M.W. and F.A.; investigation, S.M.H., K.F. and F.R.M.; methodology, M.W. and K.F.; supervision, F.A. and S.M.H.; data curation, formal analysis, K.F., M.W., S.M.H., A.A., A.Z.D., H.O.E. and K.Y.; writing—original draft, M.W., S.M.H., F.A., A.A., A.Z.D., K.F.A., M.A.-Y., H.O.E. and K.Y.; review and editing, M.W., F.A., S.M.H., R.W.B., F.R.M., A.A., A.Z.D., K.F.A., M.A.-Y., H.S.K., H.O.E. and K.Y.; funding acquisition, A.Z.D., H.S.K. and H.O.E. All authors have read and agreed to the published version of the manuscript.

Funding

King Saud University, RSP-2021/403.

Institutional Review Board Statement

Not applicable.

Informed Consent Statement

Not applicable.

Data Availability Statement

All obtained data are provided in the research article.

Acknowledgments

The authors extend their deep appreciation to Researchers Supporting Project Number (RSP-2021/403), King Saud University, Riyadh, Saudi Arabia.

Conflicts of Interest

The authors declare no conflict of interest.

References

  1. Parthasarathy, N.; Muthuramkumar, S.; Muthumperumal, C.; Vivek, P.; Ayyappan, N.; Sridhar, R.M. Liana composition and diversity among tropical forest types of peninsular India. In Ecology of Lianas; Schnitzer, S.A., Bongers, F., Burnham, R.J., Putz, F.E., Eds.; John Wiley & Sons, Ltd.: Hoboken, NJ, USA, 2015; pp. 36–49. [Google Scholar]
  2. Estrada-Villegas, S.; Pedraza Narvaez, S.S.; Sanchez, A.; Schnitzer, S.A. Lianas Significantly Reduce Tree Performance and Biomass Accumulation Across Tropical Forests: A Global Meta-Analysis. Front. For. Glob. Chang. 2022, 4, 812066. [Google Scholar] [CrossRef]
  3. Schnitzer, S.A.; Bongers, F. The ecology of lianas and their role in forests. Trends Ecol. Evol. 2002, 17, 223–230. [Google Scholar] [CrossRef] [Green Version]
  4. Sundarapandian, S.M.; Subbiah, S. Diversity and tree population structure of tropical dry evergreen forests in Sivagangai district of Tamil Nadu, India. Trop. Plant Res. 2015, 2, 36–46. [Google Scholar]
  5. Gentry, A.H. The distribution and evolution of climbing plants. In The Biology of Vines; Putz, F.E., Mooney, H.A., Eds.; Cambridge University Press: Cambridge, UK, 1991; pp. 3–49. [Google Scholar]
  6. Pérez-Salicrup, D.R.; Sork, V.L.; Putz, F.E. Lianas and trees in a liana forest of amazonian Bolivia. Biotropica 2001, 33, 34–47. [Google Scholar] [CrossRef]
  7. Santos, K.D.; Kinoshita, L.S.; Rezende, A.A. Species composition of climbers in seasonal semi-deciduous forest fragments of Southeastern Brazil. Biota Neotrop. 2009, 9, 175–188. [Google Scholar] [CrossRef]
  8. Isnard, S.; Silk, W.K. Moving with climbing plants from Charles Darwin’s time into the 21st century. Am. J. Bot. 2009, 96, 1205–1221. [Google Scholar] [CrossRef]
  9. Schnitzer, S.A.; Putz, F.E.; Bongers, F.; Kroening, K. The past, present, and potential future of liana ecology. In Ecology of Lianas; John Wiley & Sons, Ltd.: Hoboken, NJ, USA, 2015; pp. 1–10. [Google Scholar]
  10. Fiorello, I.; Del Dottore, E.; Tramacere, F.; Mazzolai, B. Taking inspiration from climbing plants: Methodologies and benchmarks—A review. Bioinspir. Biomim. 2020, 15, 031001. [Google Scholar] [CrossRef]
  11. Valladares, F.; Gianoli, E.; Saldana, A. Climbing plants in a temperate rainforest understorey: Searching for high light or coping with deep shade? Ann. Bot. 2011, 108, 231–239. [Google Scholar] [CrossRef] [PubMed] [Green Version]
  12. Rahman, A.U.; Khan, S.M.; Saqib, Z.; Ullah, Z.; Ahmad, Z.; Ekercin, S.; Mumtaz, A.S.; Ahmad, H. Diversity and abundance of climbers in relation to their hosts and elevation in the monsoon forests of Murree in the Himalayas. Pak. J. Bot. 2020, 52, 601–612. [Google Scholar] [CrossRef]
  13. Reddy, M.S.; Parthasarathy, N. Liana diversity and distribution on host trees in four inland tropical dry evergreen forests of peninsular India. Trop. Ecol. 2006, 47, 109–123. [Google Scholar]
  14. Addo-Fordjour, P.; Anning, A.K.; Larbi, J.A.; Akyeampong, S. Liana species richness, abundance and relationship with trees in the Bobiri forest reserve, Ghana: Impact of management systems. For. Ecol. Manag. 2009, 257, 1822–1828. [Google Scholar] [CrossRef]
  15. Addo-Fordjour, P.; Rahmad, Z.B. Environmental factors associated with liana community assemblages in a tropical forest reserve. Ghana. J. Trop. Ecol. 2015, 31, 69–79. [Google Scholar] [CrossRef]
  16. Uwalaka, N.O.; Khapugin, A.A.; Muoghalu, J.I. Effect of some environmental factors on liana abundance in a regenerating secondary lowland rainforest in Nigeria three decades after a ground fire. Ecol. Quest. 2020, 31, 27–38. [Google Scholar] [CrossRef] [Green Version]
  17. Munoz, A.A.; Chacon, P.; Perez, F.; Barnert, E.S.; Armesto, J.J. Diversity and host tree preferences of vascular epiphytes and climbers in a temperate rainforest in southern Chile. Aust. J. Bot. 2003, 51, 381–391. [Google Scholar] [CrossRef]
  18. Durigon, J.; Miotto, S.T.; Gianoli, E. Distribution and traits of climbing plants in subtropical and temperate South America. J. Veg. Sci. 2014, 25, 1484–1492. [Google Scholar] [CrossRef]
  19. Dewalt, S.J.; Schnitzer, S.A.; Denslow, J.S. Density and diversity of lianas along a chronosequence in a central Panamanian lowland forest. J. Trop. Ecol. 2000, 16, 1–19. [Google Scholar] [CrossRef] [Green Version]
  20. Chittibabu, C.V.; Parthasarathy, N. Liana diversity and host relationships in a tropical evergreen forest in the Indian Eastern Ghats. Ecol. Res. 2001, 16, 519–529. [Google Scholar] [CrossRef]
  21. Kammesheidt, L.; Berhaman, A.; Tay, J.; Abdullah, G.; Azwal, M. Liana abundance, diversity and tree infestation in the Imbak Canyon conservation area, Sabah, Malaysia. J. Trop. Sci. 2009, 21, 265–271. [Google Scholar]
  22. Ghollasimood, S.; Faridah-Hanum, I.; Nazre, M.; Kamziah, A.K. Abundance and Distribution of Climbers in a Coastal Hill Forest in Perak, Malaysia. J. Agric. Sci. 2012, 4, 245–254. [Google Scholar] [CrossRef]
  23. Anbarashan, M.; Parthasarathy, N. Diversity and ecology of lianas in tropical dry evergreen forests on the Coromandel Coast of India under various disturbance regimes. Flora-Morphol. Distrib. Funct. Ecol. Plants 2013, 208, 22–32. [Google Scholar] [CrossRef]
  24. Vivek, P.; Parthasarathy, N. Liana community and functional trait analysis in the tropical dry evergreen forest of India. J. Plant Ecol. 2014, 8, 501–512. [Google Scholar] [CrossRef] [Green Version]
  25. Mastan, T.; Parveen, S.N.; Reddy, M.S. Liana species inventory in a tropical dry forest of Sri Lanka Malla Wildlife Sanctuary, Andhra Pradesh, India. J. Environ. Res. Dev. 2015, 9, 1024–1030. [Google Scholar]
  26. Shukla, G.; Rai, P.; Manohar, K.A.; Chakravarty, S. Quantification of diversity, biomass and carbon storage of climber and liana community in a foothill forest of Indian eastern Himalayas. Acta Ecol. Sin. 2020, 40, 478–482. [Google Scholar] [CrossRef]
  27. Bongers, F.; Parren, M.P.; Traoré, D. Forest Climbing Plants of West Africa: Diversity, Ecology and Management; CABI Publishing: Oxford, UK, 2005; p. 288. [Google Scholar]
  28. Ward, E.B.; Pregitzer, C.C.; Kuebbing, S.E.; Bradford, M.A. Invasive lianas are drivers of and passengers to altered soil nutrient availability in urban forests. Biol. Invasions 2020, 22, 935–955. [Google Scholar] [CrossRef]
  29. Hussain, M.; Khan, S.M.; Ab-Allah, E.F.; Ul Haq, Z.; Alshahrani, T.S.; Alqarawi, A.A.; Ur Rahman, I.; Iqbal, M.; Abdullah Ahmad, H. Assessment of plant communities and identification of indicator species of an ecotonal forest zone at Durand line, District Kurram, Pakistan. Appl. Ecol. Environ. Res. 2019, 17, 6375–6396. [Google Scholar] [CrossRef]
  30. Saima, S.; Dasti, A.A.; Hussain, F.; Wazir, S.M.; Malik, S.A. Floristic compositions along an 18-km long transect in Ayubia National Park district Abbottabad, Pakistan. Pak. J. Bot. 2009, 41, 2115–2127. [Google Scholar]
  31. Ali, S.I.; Qaiser, M.A. Phytogeographical analysis of the phanerogams of Pakistan and Kashmir. Proc. R. Soc. Edinb. Sect. B Biol. Sci. 1986, 89, 89–101. [Google Scholar] [CrossRef]
  32. Ali, S.M.; Qaiser, M. Flora of Pakistan; Fakhri Printing Press: Karachi, Pakistan, 1995. [Google Scholar]
  33. Ramírez, N.; Dezzeo, N.; Chacon, N. Floristic composition, plant species abundance, and soil properties of montane savannas in the Gran Sabana, Venezuela. Flora-Morphol. Distrib. Funct. Ecol. Plants 2007, 202, 316–327. [Google Scholar] [CrossRef]
  34. Day, P.R. Particle Fractionation and Particle-Size Analysis. In Methods of Soil Analysis: Part 1 Physical and Mineralogical Properties, Including Statistics of Measurement and Sampling, 9.1; Black, C.A., Ed.; American Society of Agronomy, Soil Science Society of America: Madison, WI, USA, 1965; pp. 543–567. [Google Scholar]
  35. Nowak, A.S.; Nobis, M. Distribution, floristic structure and habitat requirements of the riparian forest community Populetum talassicae ass. nova in the Central Pamir-Alai Mts (Tajikistan, Middle Asia). Acta Soc. Bot. Pol. 2013, 82, 47–55. [Google Scholar] [CrossRef] [Green Version]
  36. Abbas, Z.; Khan, S.M.; Alam, J.; Abideen, Z.; Ullah, Z. Plant communities and anthropo-natural threats in the Shigar Valley, (Central Karakorum) Baltistan-Pakistan. Pak. J. Bot. 2012, 52, 987–994. [Google Scholar] [CrossRef]
  37. Dufrêne, M.; Legendre, P. Species assemblages and indicator species: The need for a flexible asymmetrical approach. Ecol. Monogr. 1997, 67, 345–366. [Google Scholar] [CrossRef]
  38. Yun, C.W.; Abdiyani, S. Assessing vegetation composition and the indicator species around water source areas in a pine forest plantation: A case study from Watujali and Silengkong Catchments, Kebumen, Indonesia. Forests 2019, 10, 825. [Google Scholar]
  39. Ter Braak, C.J.; Barendregt, L.G. Weighted averaging of species indicator values: Its efficiency in environmental calibration. Math. Biosci. 1986, 78, 57–72. [Google Scholar] [CrossRef] [Green Version]
  40. Ter Braak, C.J.; Prentice, I.C. A theory of gradient analysis. Adv. Ecol. Res. 1988, 18, 271–317. [Google Scholar]
  41. Ward, J.H., Jr. Hierarchical grouping to optimize an objective function. JASA 1963, 58, 236–244. [Google Scholar] [CrossRef]
  42. McCune, B.; Grace, J.B. Analysis of Ecological Communities; MJM Software Design: Corvallis, OR, USA, 2002. [Google Scholar]
  43. Langer, E.R.L.; Steward, G.A.; Kimberley, M.O. Vegetation structure, composition and effect of pine plantation harvesting on riparian buffers in New Zealand. For. Ecol. Manag. 2008, 256, 949–957. [Google Scholar] [CrossRef]
  44. Jadán, O.; Donoso, D.A.; Cedillo, H.; Bermúdez, F.; Cabrera, O. Floristic groups, and changes in diversity and structure of trees, in tropical montane forests in the Southern Andes of Ecuador. Diversity 2021, 13, 400. [Google Scholar] [CrossRef]
  45. Sarvalingam, A.; Rajendran, A. Rare, Endangered and Threatened (RET) climbers of Southern Western Ghats, India. Rev. Chil. de Hist. Nat. 2016, 89, 1822. [Google Scholar] [CrossRef] [Green Version]
  46. Muthumperumal, C.; Parthasarathy, N. Angiosperms, climbing plants in tropical forests of southern Eastern Ghats, Tamil Nadu, India. Check List 2009, 5, 92–111. [Google Scholar] [CrossRef]
  47. Bovini, M.G.; Faria, M.; Oliveira, R.R.; Kurtz, B.R. Floristic diversity of the Cagarras Islands Natural Monument, Rio de Janeiro, Brazil. Check List 2014, 10, 366–373. [Google Scholar] [CrossRef] [Green Version]
  48. Araujo, D.; Alves, M. Climbing plants of a fragmented area of lowland Atlantic Forest, Igarassu, Pernambuco (Northeastern Brazil). Phytotaxa 2010, 8, 1–24. [Google Scholar] [CrossRef]
  49. Srinivas, K.; Sundarapandian, S. Diversity and composition of climbing plants in tropical dry forests of Northern Andhra Pradesh, India. Int. Res. J. Nat. Appl. Sci. 2017, 4, 31–47. [Google Scholar]
  50. Lü, X.T.; Tang, J.W.; Feng, Z.L.; Li, M.H. Diversity and aboveground biomass of lianas in the tropical seasonal rain forests of Xishuangbanna, SW China. Rev. Biol. Trop. 2009, 57, 211–222. [Google Scholar] [CrossRef] [PubMed] [Green Version]
  51. Muoghalu, J.I.; Okeesan, O.O. Climber species composition, abundance and relationship with trees in a Nigerian secondary forest. Afr. J. Ecol. 2005, 43, 258–266. [Google Scholar] [CrossRef]
  52. Nabe-Nielsen, J. Diversity and distribution of lianas in a neotropical rain forest, Yasuní National Park, Ecuador. J. Trop. Ecol. 2001, 17, 1–19. [Google Scholar] [CrossRef]
  53. Qasem, J.R.; Foy, C.L. Weed allelopathy, its ecological impacts and future prospects: A review. J. Plant Prod. 2001, 4, 43–119. [Google Scholar] [CrossRef]
  54. Haq, S.M.; Singh, B.; Bashir, F.; Farooq, A.J.; Singh, B.; Calixto, E.S. Exploring and understanding the floristic richness, life-form, leaf-size spectra and phenology of plants in protected forests: A case study of Dachigam National Park in Himalaya, Asia. Acta Ecol. Sin. 2021, 41, 479–490. [Google Scholar] [CrossRef]
  55. Haq, S.M.; Hamid, M.; Lone, F.A.; Singh, B. Himalayan hotspot with Alien Weeds: A case study of biological spectrum, phenology, and diversity of weedy plants of high-altitude mountains in District Kupwara of J&K Himalaya, India. Proc. Natl. Acad. Sci. India Sect. B Biol. Sci. 2021, 91, 139–152. [Google Scholar]
  56. Hamid, M.; Khuroo, A.A.; Malik, A.H.; Ahmad, R.; Singh, C.P.; Dolezal, J.; Haq, S.M. Early evidence of shifts in alpine summit vegetation: A case study from Kashmir Himalaya. Front. Plant Sci. 2020, 11, 421. [Google Scholar] [CrossRef]
  57. Haq, S.M.; Malik, A.H.; Khuroo, A.A.; Rashid, I. Floristic composition and biological spectrum of Kerana remote valley of northwestern Himalaya. Acta Ecol. Sin. 2019, 39, 372–379. [Google Scholar] [CrossRef]
  58. Pandian, E.; Parthasarathy, N. Decadal (2003–2013) changes in liana diversity, abundance and aboveground biomass in four inland tropical dry evergreen forest sites of peninsular India. J. For. Res. 2016, 27, 133–146. [Google Scholar] [CrossRef]
  59. Pandian, E.; Ravichandran, P. Diversity and Threatened Climber Plants in Tropical Forests of Courtallam Hills, Southern Western Ghats, India. J. Trop. For. Environ. 2019, 9. [Google Scholar] [CrossRef]
  60. Putz, F.E.; Chai, P. Ecological studies of lianas in Lambir national park, Sarawak, Malaysia. J. Ecol. 1987, 75, 523–531. [Google Scholar] [CrossRef]
  61. Campbell, E.J.F.; Newbery, D.M. Ecological relationships between lianas and trees in lowland rain forest in Sabah, East Malaysia. J. Trop. Ecol. 1993, 9, 469–490. [Google Scholar] [CrossRef]
  62. Muthuramkumar, S.; Parthasarathy, N. Tree-liana relationships in a tropical evergreen forest at Varagalaiar, Anamalais, Western Ghats, India. J. Trop. Ecol. 2001, 17, 395–409. [Google Scholar] [CrossRef]
  63. Iqbal, M.; Khan, S.M.; Ahmad, Z.; Hussain, M.; Shah, S.N.; Kamran, S.; Manan, F.; Ul-Haq, Z.; Ullah, S. Vegetation classification of the Margalla Foothills, Islamabad under the influence of edaphic factors and anthropogenic activities using modern ecological tools. Pak. J. Bot. 2021, 53, 1831–1843. [Google Scholar] [CrossRef]
  64. Carter, G.A.; Teramura, A.H. Climber photosynthesis and relations to climbing mechanics in a forest understory. Am. J. Bot. 1988, 75, 1011–1018. [Google Scholar] [CrossRef]
  65. Leicht-Young, S.A.; Pavlovic, N.B.; Frohnapple, K.J.; Grundel, R. Liana habitat and host preferences in northern temperate forests. Ecol. Manag. 2010, 260, 1467–1477. [Google Scholar] [CrossRef]
  66. Ding, Y.; Zang, R. Effects of logging on the diversity of lianas in a lowland tropical rain forest in Hainan Island, South China. Biotropica 2009, 41, 618–624. [Google Scholar] [CrossRef]
  67. Haq, S.M.; Yaqoob, U.; Calixto, E.S.; Kumar, M.; Rahman, I.U.; Hashem, A.; Abd_Allah, E.F.; Alakeel, M.A.; Alqarawi, A.A.; Abdalla, M.; et al. Long-term impact of transhumance pastoralism and associated disturbances in high-altitude forests of Indian Western Himalaya. Sustainability 2021, 13, 12497. [Google Scholar] [CrossRef]
  68. Rahman, I.U.; Hart, R.E.; Ijaz, F.; Afzal, A.; Iqbal, Z.; Calixto, E.S.; Abd_Allah, E.F.; Alqarawi, A.A.; Hashem, A.; Al-Arjani, A.B.F.; et al. Environmental variables drive plant species composition and distribution in the moist temperate forests of Northwestern Himalaya, Pakistan. PLoS ONE 2022, 17, e0260687. [Google Scholar] [CrossRef] [PubMed]
  69. Haq, S.M.; Tariq, A.; Li, Q.; Yaqoob, U.; Majeed, M.; Hassan, M.; Fatima, S.; Kumar, M.; Bussmann, R.W.; Moazzam, M.F.U.; et al. Influence of Edaphic Properties in Determining Forest Community Patterns of the Zabarwan Mountain Range in the Kashmir Himalayas. Forests 2022, 13, 1214. [Google Scholar] [CrossRef]
  70. Haq, S.M.; Yaqoob, U.; Hamid, S.; Hassan, M.; Bashir, F.; Waheed, M.; Bussmann, R.W. Localized impact of livestock settlements on vegetation patterns in fir forests of Kashmir Himalaya. Acta Ecol. Sin. 2022, 42, 407–416. [Google Scholar] [CrossRef]
  71. Woods, C.L.; Cardelús, C.L.; DeWalt, S.J. Microhabitat associations of vascular epiphytes in a wet tropical forest canopy. J. Ecol. 2015, 103, 421–430. [Google Scholar] [CrossRef]
  72. Wang, X.; Long, W.; Schamp, B.S.; Yang, X.; Kang, Y.; Xie, Z.; Xiong, M. Vascular epiphyte diversity differs with host crown zone and diameter, but not orientation in a tropical cloud forest. PLoS ONE 2016, 11, e0158548. [Google Scholar] [CrossRef] [Green Version]
  73. Dale, V.H.; Beyeler, S.C. Challenges in the development and use of ecological indicators. Ecol. Indic. 2001, 1, 3–10. [Google Scholar] [CrossRef] [Green Version]
  74. Bauer, G.; Klein, M.C.; Gorb, S.N.; Speck, T.; Voigt, D.; Gallenmüller, F. Always on the bright side: The climbing mechanism of Galium aparine. Proc. R. Soc. B Biol. Sci. 2011, 278, 2233–2239. [Google Scholar] [CrossRef] [Green Version]
  75. Goodman, A.M. Mechanical adaptations of cleavers (Galium aparine). Ann. Bot. 2005, 95, 475–480. [Google Scholar] [CrossRef] [Green Version]
  76. Chaney, L.; Baucom, R.S. The costs and benefits of tolerance to competition in Ipomoea purpurea, the common morning glory. Evolution 2014, 68, 1698–1709. [Google Scholar] [CrossRef]
  77. Senbeta, F.; Schmitt, C.; Denich, M.; Demissew, S.; Velk, P.L.; Preisinger, H.; Woldemariam, T.; Teketay, D. The diversity and distribution of lianas in the Afromontane rain forests of Ethiopia. Divers. Distrib. 2005, 11, 443–452. [Google Scholar] [CrossRef]
Figure 1. Map of the study area: (a) Pakistan, (b) District Kasur, (c) points showing the sampling sites of the Changa Manga Forest plantation and the sampling design used to collect data.
Diversity 14 00988 g001
Figure 2. Heat map showing cluster dendrogram based on flowering response in a different month. Dark color indicates flowering, while light color indicates nonflowering stage. The letters on the right side of figure indicate the species codes while those on the lower side indicate the month. Full species names are mentioned in Table 1.
Diversity 14 00988 g002
Figure 3. Four major groups of climbers in the sampling plots based on Ward’s agglomerative cluster analysis. The right side of the figure shows sampling plots. The sampling plots of group 1 are highlighted with aqua color, group 2 with purple color, group 3 with red color, and group 4 with green color.
Diversity 14 00988 g003
Figure 4. Two-way cluster dendrogram exhibiting the distribution of 30 species and 60 sample plots. The blue color represents absence, while the yellow color indicates the presence of species. The right side of the figure shows the species. The sampling plots of group 1 are highlighted with aqua color, group 2 with purple color, group 3 with red color, and group 4 with green color.
Diversity 14 00988 g004
Figure 5. Indicator species in each group. The species highlighted had a significant p-value < 0.05. The color scheme describes the individual value % of plants in four different groups. The letters on the left side of the figures indicate the species code. Full species names are mentioned in Table 1.
Diversity 14 00988 g005
Figure 6. Data attribute plot of indicator species in four groups of climber plants. a. Cissampelos pareira; b. Galium aparine; c. Ipomoea purpurea; d. Pentatropis nivalis. The arrows represent the environmental variables, while the quadrats in four groups are represented by different colors. The size of samples depicts the density of each indicator species in different groups.
Diversity 14 00988 g006
Figure 7. CCA bi-plot shows the relationship between climbers, anthropogenic pressure (AP), grazing pressure (GP), and edaphic variables. The red vectors represent the variables (anthropogenic pressure, grazing pressure, and edaphic factor), while the text represents the code of the species name.
Diversity 14 00988 g007
Table 1. List of plants, climbing habits, and indicator species analysis of climbers in four groups of Ward’s cluster analysis in the Changa Manga Forest Plantation. The individual value as a percentage and indicator p-values of each recorded species of four groups are shown in the table. The individual values (%) of indicator species in each group are highlighted in bold.
SpeciesSpecies CodeClimber TypeClimbing ModeGroup 1Group 2Group 3Group 4
IndVal (%)p-ValueIndVal (%)p-ValueIndVal (%)p-ValueIndVal (%)p-Value
Blyttia spiralis (Forssk.) D.V. Field & J.R.I. Wood Blyt.spiHerbaceous climberTwiner01010.330.5614.77p < 0.1
Campsis radicans (L.) Seem. Camp.radiWoody ClimberTwiner01014.370.332.460.32
Cissampelos pareira L. Ciss.carHerbaceous climberTendril26.7p < 0.051.590.320101
Cissus carnosa Lam. Ciss.parWoody ClimberTendril6.20.226.540.22010.560.54
Coccinia grandis (L.) Voigt Cocc.granHerbaceous climberTwiner0.280.551.290.364.710.260.750.46
Cocculus hirsutus (L.) W. Theob. Cocc.hirWoody ClimberScrambler0101015.490.23
Convolvulus arvensis L. Conv.arvHerbaceous climberScrambler8.220.162.70.300101
Cucumis melo subsp. agrestis (Naudin) Pangalo Cucu.melHerbaceous climberScrambler18.33p < 0.054.030.27012.460.32
Cuscuta reflexa Roxb. Cusc.refParasite climberTwiner01011.010.492.650.26
Dolichandra unguis-cati (L.) L.G. Lohmann Doli.ungWoody ClimberTendril0.430.530.150.632.350.3601
Galium aparine L Gali.apaHerbaceous climberScrambler2.590.3320.15p < 0.050101
Ipomoea aquatica Forssk. Ipom.aquHerbaceous climberScrambler010.600.470101
Ipomoea cairica (L.) Sweet Ipom.caiHerbaceous climberTwiner0.430.53016.060.190.940.39
Ipomoea nil (L.) Roth Ipom.nil Herbaceous climberTwiner0.720.360.220.571.340.4601
Ipomoea purpurea (L.) Roth Ipom.purHerbaceous climberTwiner010.220.5630.3p < 0.0501
Lantana camara L. Lant.camClimbing shrubScrambler6.780.207.30.19010.370.56
Lathyrus aphaca L. Lath.aphHerbaceous climberTendril11.26p < 0.19.35p < 0.12.020.4001
Merremia aegyptia (L.) Urb. Merr.aegHerbaceous climberTwiner01017.071p < 0.101
Merremia dissecta (Jacq.) Hallier f. Merr.disHerbaceous climberTwiner01015.380.2301
Merremia hederacea (Burm. f.) Hallier f. Merr.hedHerbaceous climberTwiner01014.370.3301
Mukia maderaspatana (L.) M. Roem. Muki.madHerbaceous climberTendril0.430.5311.03p < 0.1010.750.45
Oxystelma esculentum (L. f.) Sm. Oxys.escHerbaceous climberTwiner0.140.590.150.62010.560.53
Pentatropis capensis (L. f.) Bullock Pent.capHerbaceous climberTwiner01016.060.2012.880.13
Pentatropis nivalis (J.F. Gmel.) D.V. Field & J.R.I. Wood Pent.navHerbaceous climberTwiner01016.060.2017.05p < 0.05
Pergularia daemia (Forssk.) Chiov. Perg.daeHerbaceous climberTwiner3.750.261.210.401.340.4612.50.16
Telosma pallida (Roxb.) Craib Telo.palWoody ClimberTwiner10.10.130.070.660111.170.18
Tinospora sinensis (Lour.) Merr. Tino.sinWoody ClimberTwiner0.430.520.300.490101
Trichosanthes dioica Roxb. Tric.dioHerbaceous climberTendril2.740.2913.99p < 0.10.670.530.940.40
Vicia sativa L. Vici.saHerbaceous climberTendril0118.4p < 0.116.5p < 0.101
Table 2. Mean values ± SE of the edaphic parameters (soil texture, nutrients, and soil chemical properties) based on the four groups acquired from Ward’s cluster analysis using the climber sampling data. (Mean ± SE). The four groups have different soil properties and four different indicator species. Non-parametric Kruskal–Wallis test followed by Tukey HSD was used to determine whether there was a significant difference between the soil properties of the four groups. * (p < 0.05); ** (p < 0.01).
Soil CharacteristicsVariable NameGroup 1Group 2Group 3Group 4H-Valuesp-Values
1. Soil Texture1. Sand54.96 ± 1.2536.38 ± 1.9125.25 ± 0.9528.62 ± 0.7110.8720.004 **
2. Silt32.79 ± 0.7937.39 ± 0.7045.31 ± 2.6146.78 ± 1.9311.4830.005 **
3. Clay15.25 ± 0.5626.22 ± 1.3128 ± 3.4526.4 ± 1.2312.9720.003 **
2. Nutrients1. SOM0.69 ± 0.020.71 ± 0.010.74 ± 0.010.74 ± 0.014.5970.223
2. Nitrogen0.28 ± 0.090.35 ± 0.070.27 ± 0.070.30 ± 0.032.3480.075
3. K267.67 ± 26.7294.87 ± 32.1285.94 ± 48.3383.79 ± 41.77.6480.051 *
4. P3.21 ± 0.63.01 ± 0.52.37 ± 1.032.67 ± 0.55.4760.136
3. Chemical Properties1. Moisture15.31 ± 3.2118.36 ± 1.9512.92 ± 3.3415.49 ± 6.57.4590.051 *
2. pH6.79 ± 0.197.02 ± 0.156.96 ± 0.256.57±0.132.1950.532
3. EC0.91 ± 0.040.94 ± 0.040.91 ± 0.080.96 ± 0.032.4020.523
Table 3. CCA bi-plot summary of the 30 climber plant species with environmental factors.
Axes1234Total Inertia
Eigenvalues:0.670.20.1310.087.343
Species–environment correlations:0.9220.6640.5810.426
Cumulative % variance of species data9.111.813.614.7
Cumulative % variance of species-environment relation56.873.784.991.7
Summary of Monte Carlo test
Test of significance of first canonical axisTest of significance of all canonical axes
Eigen value = 0.67Trace = 1.180
F-ratio = 5.322F-ratio = 1.691
p-value = 0.0020p-value = 0.0020
Publisher’s Note: MDPI stays neutral with regard to jurisdictional claims in published maps and institutional affiliations.

