Article

Prioritizing Areas for Primate Conservation in Argentina

by
Ilaria Agostini
1,2,*,
Santiago José Elías Velazco
2,3,
Juan Ariel Insaurralde
4,
Romina Pavé
5,
Ingrid Holzmann
6,
Eduardo Fernández-Duque
7,
María Paula Tujague
2,8,
Silvana Peker
9,
Martín M. Kowalewski
10 and
Mario Santiago Di Bitetti
2,8
1
CENAC (Parque Nacional Nahuel Huapi-CONICET), San Carlos de Bariloche 8400, Argentina
2
Instituto de Biología Subtropical (IBS), CONICET-Universidad Nacional de Misiones, Puerto Iguazú 3370, Argentina
3
Programa de Pós-Graduação em Biodiversidade Neotropical, Universidade Federal da Integração Latino-Americana (UNILA), Foz do Iguaçu 85866-000, Brazil
4
Instituto de Investigaciones Biológicas y Tecnológicas (IIBYT), CONICET-Universidad Nacional de Córdoba, Córdoba 5016, Argentina
5
Instituto Nacional de Limnología (INALI), CONICET-Universidad Nacional del Litoral, Santa Fe 3000, Argentina
6
Instituto de Bio y Geociencias del NOA (IBIGEO), CONICET-Universidad Nacional de Salta, Salta 4405, Argentina
7
Department of Anthropology, School of the Environment, Yale University, New Haven, CT 06520, USA
8
Facultad de Ciencias Forestales, Universidad Nacional de Misiones, Eldorado 3380, Argentina
9
Ministerio de Ambiente y Desarrollo Sustentable de la Nación, Buenos Aires C1004, Argentina
10
Estación Biológica de Corrientes (EBCo)-CECOAL, CONICET-Universidad Nacional del Nordeste, San Cayetano, Corrientes 3401, Argentina
*
Author to whom correspondence should be addressed.
Diversity 2022, 14(11), 982; https://doi.org/10.3390/d14110982
Submission received: 22 September 2022 / Revised: 1 November 2022 / Accepted: 9 November 2022 / Published: 15 November 2022
(This article belongs to the Special Issue Ecology, Diversity, and Conservation of Primates)

Abstract

:
Argentina lies within the southernmost distributional range of five neotropical primates, the brown howler monkey Alouatta guariba, the black-and-gold howler monkey Alouatta caraya, the black-horned capuchin Sapajus nigritus, the Azara’s capuchin Sapajus cay, and the Azara’s owl monkey Aotus azarae; the first three of which are globally threatened. These species occupy different ecoregions: the Alto Paraná Atlantic forest, the Araucaria moist forest, the humid Chaco, the Southern Cone Mesopotamian savanna, the Paraná Ffooded savanna, and the Southern Andean Yungas. The recently approved National Primate Conservation Plan of Argentina calls for identifying priority areas to focus conservation actions for these species. We used species distribution models to estimate species ranges and then used the Zonation software to perform a spatial conservation prioritization analysis based on primate habitat quality and connectivity to identify potential areas of importance at national and ecoregional levels. Only 7.2% (19,500 km2) of the area inhabited by primates in Argentina is under protection. Outside the current protected areas, the top-ranked 1% and 5% priority areas identified in our analysis covered 1894 and 7574 km2, respectively. The top 1% areas were in the Atlantic forest of Misiones province, where S. nigritus, A. guariba, and A. caraya are distributed, and in the humid portion of eastern Chaco and Formosa provinces, where A. azarae and A. caraya are present. The top 5% areas included portions of the Yungas, where S. cay is the only primate present. Priority areas in Chaco and Formosa provinces are particularly relevant because of the paucity of protected areas and the high deforestation rate. The endangered A. guariba population will benefit from the better protection of the priority areas of Misiones. The potential priority areas proposed herein, considered within a context of a broad participatory process involving relevant stakeholders and local people, will help guide new and innovative conservation policies and practices while supporting management objectives.

Graphical Abstract

1. Introduction

Argentina harbors five primate species: two howler monkeys (the black-and-gold howler monkey—Alouatta caraya, and the brown howler monkey—Alouatta guariba ssp. clamitans); Azara’s owl monkey (Aotus azarae), and two capuchin monkeys (the black-horned capuchin—Sapajus nigritus ssp. cucullatus, and Azara’s capuchin—Sapajus cay). These species are distributed throughout the northern portion of the country, occupying different ecoregions and forest types, from gallery forests in the humid Chaco to flooded forests in the Paraná flooded savanna, naturally fragmented forests in the Southern Cone Mesopotamian savannas, subtropical semideciduous rainforests in the Alto Paraná Atlantic forest, and cloud and montane forests in the Yungas (Figure A1).
In 2019, a new categorization of the mammals of Argentina updated the conservation status of primate species and helped identify their major threats [1,2]. The most important threats can be grouped into: (1) forest loss, degradation, and fragmentation; (2) anthropogenic effects (e.g., hunting, road killing, dog attacks); and (3) disease epidemics. The reduction of high-quality habitat for primates is mainly caused by timber exploitation, agriculture, and livestock grazing that are increasingly affecting large forest areas across northern Argentina [3,4]. Besides, human-induced fires are dramatically impacting the ecosystems in this region: in 2020, 333,000 ha of native forests were lost in Argentina, and 54% of this loss was caused by fires, mainly in the Chaco and Yungas [5]. Finally, epidemics are another major threat to primate populations. The yellow fever outbreak of 2008–2009 decimated the already small remnant population of brown howlers and black-and-gold howler monkeys of the Atlantic forest of Misiones [6]. Thus, humans may have important negative effects on primate populations, either indirectly through disease transmission, the effects of infrastructure, and land-use patterns or directly through hunting for the pet trade, poaching, and retaliatory killing due to wildlife–human conflicts. The indirect or direct threats affecting primate populations living in the anthropogenic landscapes of Argentina should be considered when prioritizing areas for primate conservation.
There are multiple reasons why it is important to conserve primate populations. Besides their intrinsic value, primate populations serve key ecological functions in the ecosystems they inhabit, such as predation, pollination, and seed dispersal [7]. They also serve as prey for larger predators and contribute to maintaining community structure across multiple trophic levels. As key dispersers of large-seeded plant species, they also contribute to carbon stocking and may have a buffering role against the effects of global climate change [8,9]. Primate species also provide important benefits to local communities by representing a source of substantial income from ecotourism and may have cultural or religious relevance for the local communities sharing the habitat with them [7].
Given all the aforementioned threats and the importance of preserving primates, it became imperative to develop an action plan with long-term conservation strategies for the primates of Argentina [2]. The National Primate Conservation Plan of Argentina was developed in 2019 and approved in 2021 (Res. 430/21, Ministerio de Ambiente y Desarrollo Sostenible, Argentina). One of the plan’s priority actions is to identify areas of importance for the conservation of primates in Argentina to more effectively focus conservation efforts. These efforts include not only the possibility of creating new protected areas but other conservation actions as well, such as ecosystem restoration, environmental education, and environmentally sound economic activities, such as ecotourism, involving local communities and landowners.
Resources for conserving species diversity are always limited; thus, to maximize the effectiveness of conservation actions, it is necessary to focus efforts on the highest conservation priorities [10]. Conservation prioritization utilizes computational tools and analyses that contribute to an ecologically informed spatial allocation of conservation actions [11]. In the last few decades, spatial prioritization methods have rapidly evolved to support decisions on where to concentrate conservation efforts. These methods range from simple complementarity-based algorithms that operate on relatively small data sets and presence–absence data [12] to more recent methods incorporating costs, threats, and alternative land uses, improving ecological realism by dealing with species-specific connectivity and uncertainty [11,13].
Prioritization analyses using different analytical methods and scales (e.g., regional, national) have been rarely applied to primates. Some of these analyses have used species distribution modeling approaches to prioritize areas based on landscape and climatic variables, as was the case for the black lion tamarin (Leontopithecus chrysopygus) [14] and Indonesian threatened primate species [15]. Others, such as the selection of priority areas for primates in Tanzania, used a complementarity analysis to identify areas based on a set of criteria and scores assigned to species and sites [16]. A prioritization effort analysis of six primate species in an Amazonian savanna used a combination of species-distribution modeling and a systematic conservation planning approach, through Marxan software, to identify the set of areas that represent biodiversity features with the minimum possible cost [17]. Finally, the identification of priority areas for the three primate species in Mexico has been undertaken combining species distribution modeling and explicitly involving expert knowledge [18].
Our study aims to identify the Areas of Importance for the Conservation of Primates in Argentina (AICPAs), defined as areas that, if protected, could potentially ensure the long-term persistence of viable primate populations. As a first step to identify the AICPAs, we developed primate distribution models in Argentina; we later used these distribution models in a prioritization analysis. We show how the results of this prioritization may help focus conservation efforts in areas with the highest potential positive impact on primate populations and discuss the pros and cons of this approach.

2. Materials and Methods
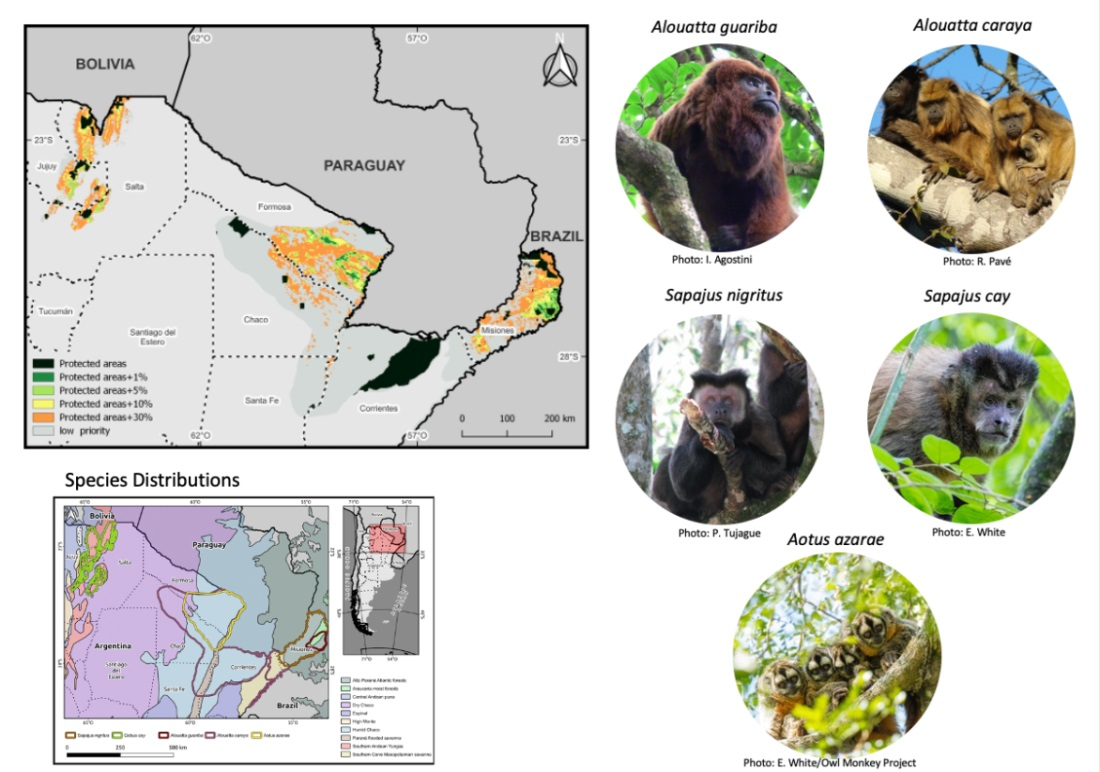
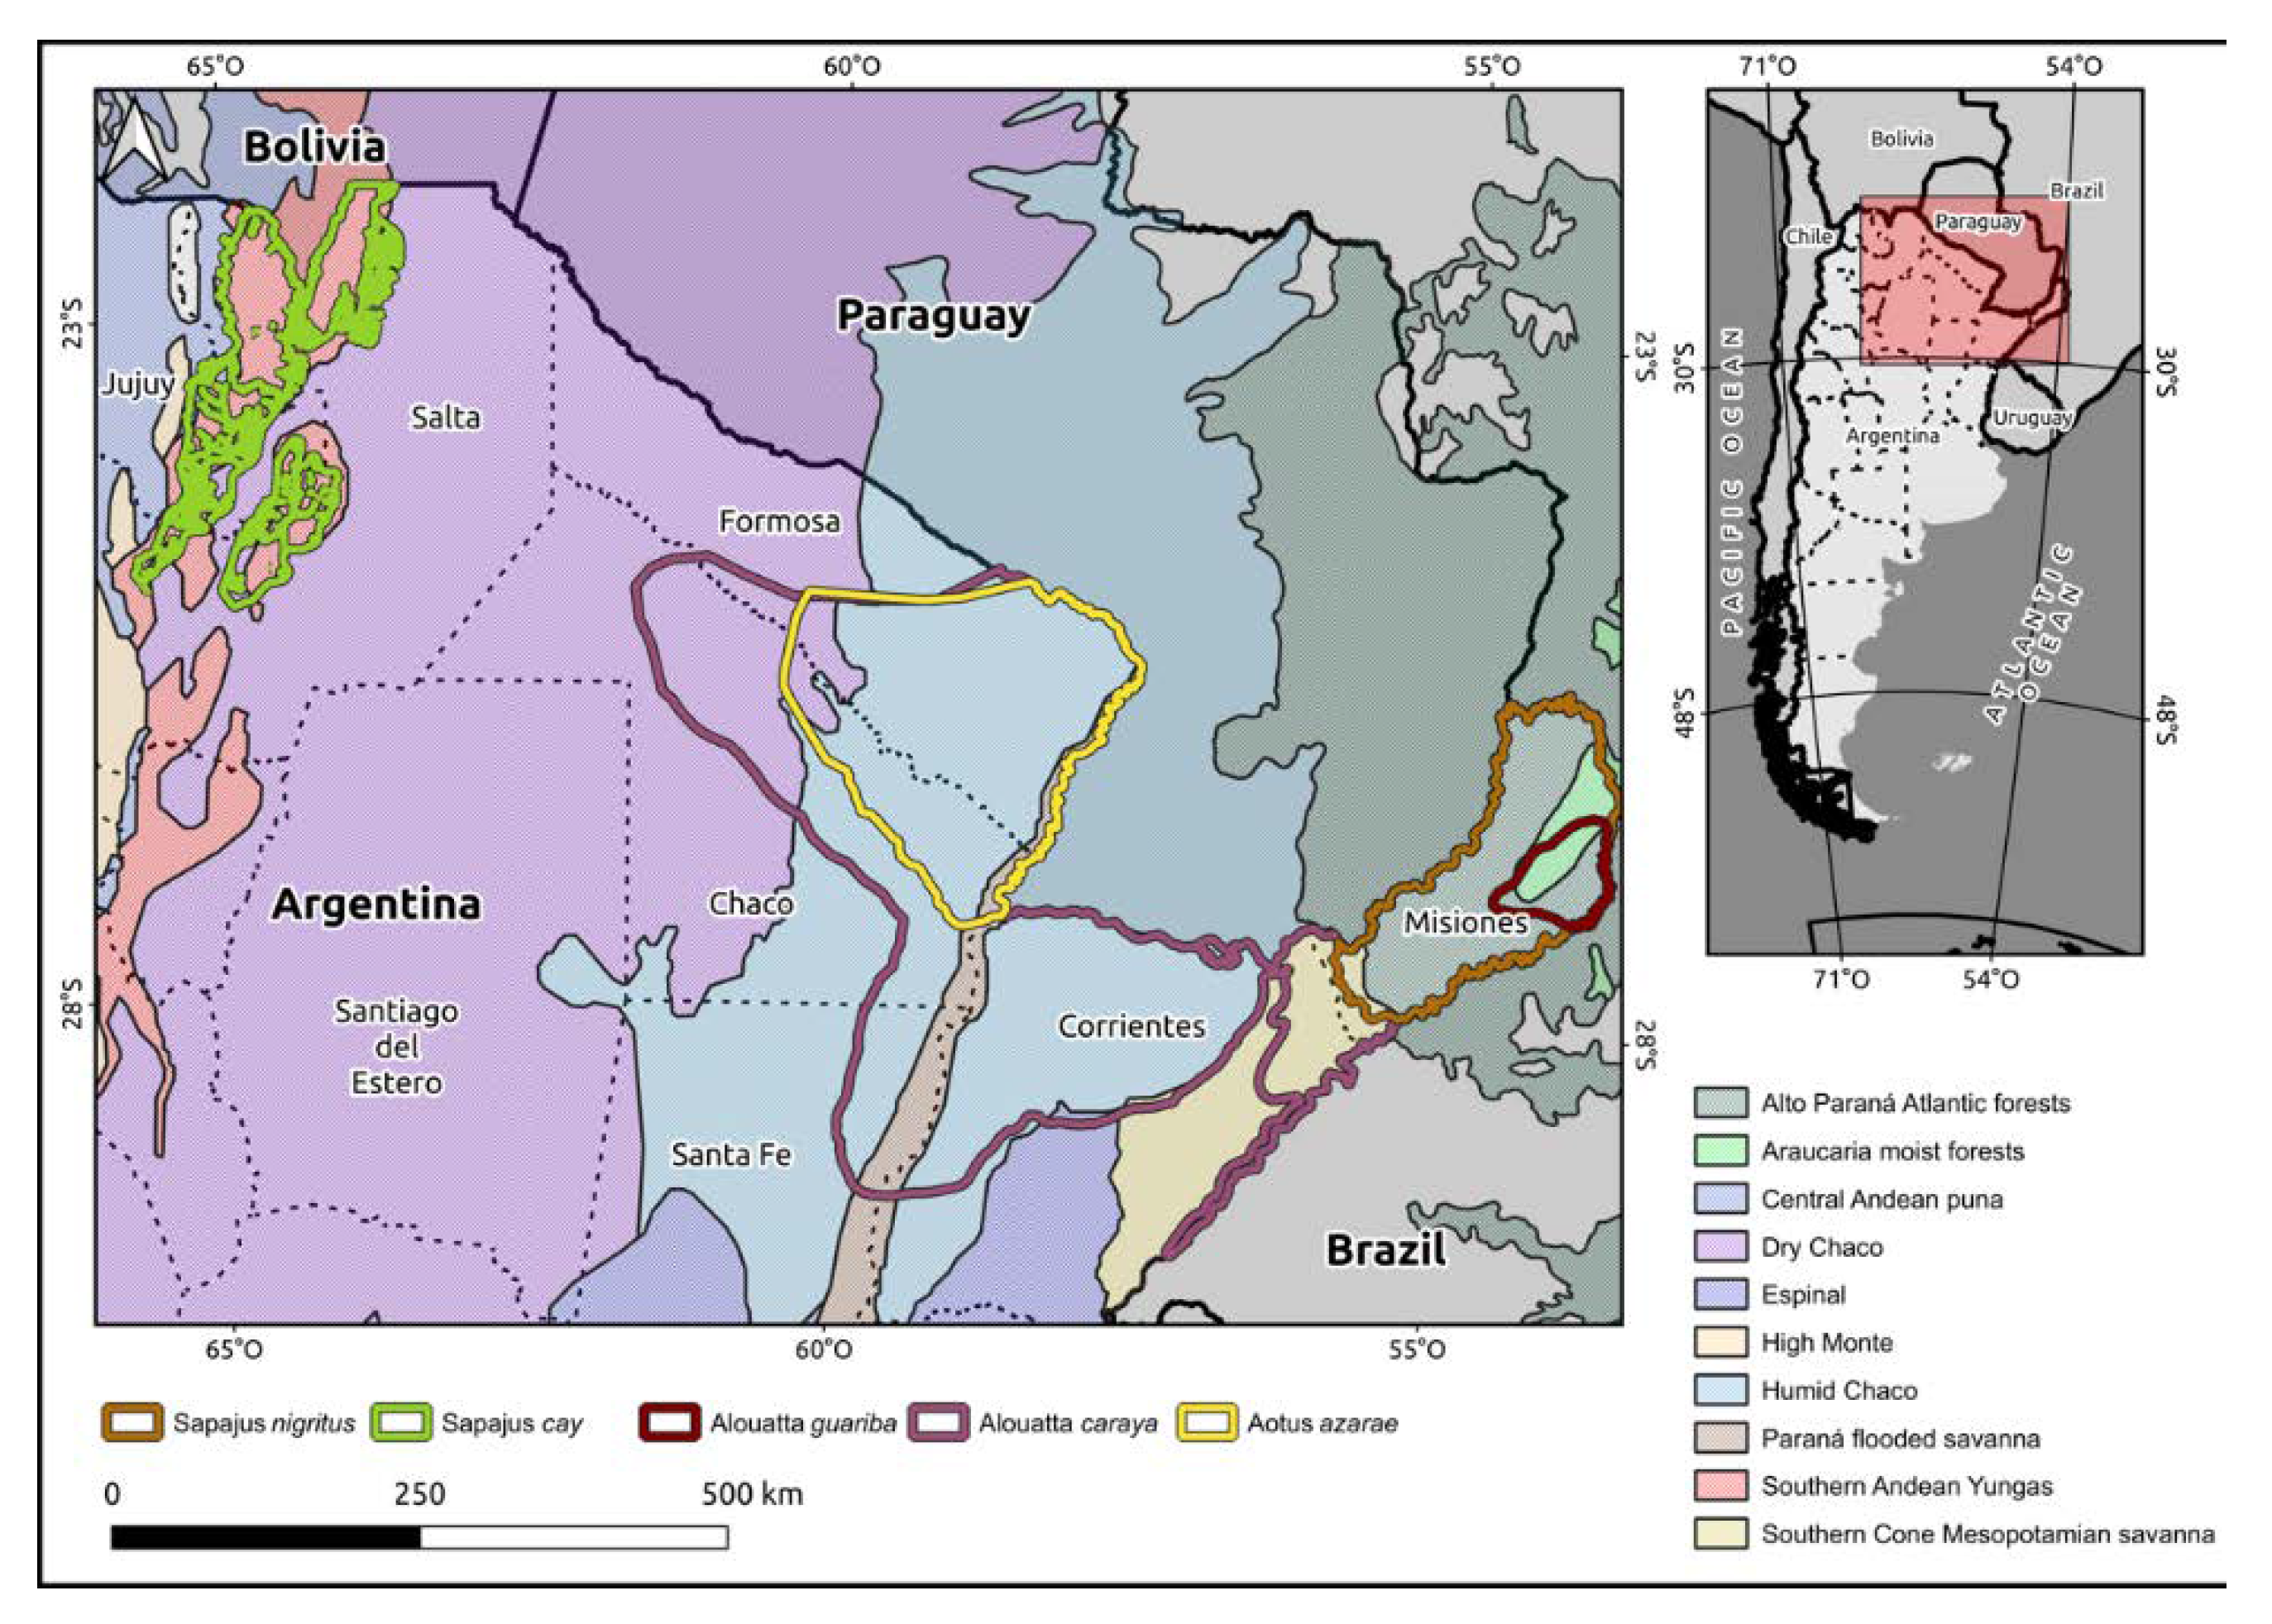
2.1. Study Area

The study area, including the distribution ranges of all primate species within Argentina, comprises seven provinces and six ecoregions and occupies 271,624 km2 [19] (Figure A1). The Alto Paraná Atlantic forest ecoregion is a semi-deciduous subtropical forest with marked seasonality in day length, temperature, and primary productivity [20]. Mean annual temperature ranges from 16 to 22 °C, and rainfall ranges from 1000 to 2200 mm per year [21]. The Araucaria moist forest ecoregion occupies relatively higher altitudes (550–800 m a.s.l.) and resembles the Alto Paraná Atlantic forest but with the presence of the gymnosperm Araucaria angustifolia [21]. Although Misiones province hosts the highest number of protected areas in Argentina, most of them are quite small, and its biodiversity is still threatened, mainly due to deforestation for agriculture and livestock activities, poaching, and the non-sustainable exploitation of forest remnants [21].
The Southern Cone Mesopotamian savanna ecoregion is a relatively flat landscape covered mainly by grasslands and small forest patches. In the savannas of Corrientes, forest plantations with exotic trees (Pinus and Eucalyptus spp.) are also increasingly replacing the native vegetation [4]. This ecoregion has subtropical weather without a dry season, with an average annual precipitation of 1400–1800 mm [22,23], monthly mean temperatures ranging from 14 °C in July (winter) to 27 °C in January (summer), and frosts occurring during the winter months of May to September [24,25].
The Paraná flooded savanna ecoregion occupies riparian and flooded forests in the proximity of the Paraná and Paraguay rivers. Although 14% of this ecoregion is protected, mainly in the south, it is still threatened by the expansion of forest plantations [4]. This ecoregion has subtropical weather with an average annual temperature of 22 °C and a range that varies from 14° C in July to 27 °C in January, and an annual average rainfall of 1350 mm [26,27].
The humid portion of the Chaco ecoregion consists of a highly heterogeneous matrix of different environmental units, such as pastures, palm savannas, riverine forests, wetlands, and naturally fragmented forests [19]. The Humid Chaco has a low protection degree (<2% of the land is under protection) [4,28]. The climate is subtropical, with the lowest monthly mean temperatures from May through August (16–18 °C) and the highest from October through March (23 to 27 °C). Mean annual precipitation is 1436 ± SD 333 mm (1977 to 2017) with a drier period in June through August [29].
The dry Chaco, which, in Argentina, occupies the northern–central portion of the country, is the largest dry subtropical forest in the neotropics [30] and is considered a global deforestation hotspot [3,31]. In this ecoregion, the mean annual temperature ranges from 18 to 23 °C, and rainfall ranges from 500 to 700 mm [32]. The dry and the humid Chaco are highly threatened by agriculture and livestock grazing expansion [4]. Primates from northern–northeastern Argentina are distributed mainly in the humid Chaco, except for A. caraya, which also extends its range into a small portion of the eastern dry Chaco [33].
The southern Andean Yungas ecoregion (hereinafter Yungas) occupies a relatively small area of Argentina (2%). Its wide altitudinal range (400–3000 m a.s.l.) and marked ecological gradient promote high biodiversity [4,34]. In this ecoregion, the average annual temperature is 19 °C, ranging between 10 °C in the winter and 30 °C in the summer, and the mean rainfall is 1000 mm, ranging from 550 to 2500 mm [35,36]. Agriculture expansion, mainly for sugar cane plantations, has replaced ca. 90% of the Lowland Yungas forest, and only ca. 9% of the Yungas is protected [4].

2.2. Study Species

Our study is focused on all primate species inhabiting Argentina: A. guariba, A. caraya, A. azarae, S. nigritus, and S. cay.
The brown howler A. guariba is endemic to the Atlantic forest of South America, occurring along the Brazilian coast from the state of Bahía in the north to Rio Grande do Sul in the south, reaching a small portion of the Misiones province in Argentina [37] (Figure A1). This species occurs mainly in the central–eastern portion of Misiones, where it is frequently sympatric with the black-and-gold howler [38,39]. A. guariba is listed as one of the 25 most endangered primate species worldwide [40], and it is globally listed as vulnerable (VU) [41] and as critically endangered (CR) in Argentina, where a small population persists at extremely low densities, probably due to recurrent yellow fever outbreaks [38]. The brown howlers in Misiones usually live in small groups (2–7 individuals) that occupy relatively large home ranges (31–70 ha; [42]). A relatively low population density of 10 individuals per km2 was estimated at Piñalito Provincial Park, Misiones, in 2005–2007 [39]. In 2008–2009, as a result of a yellow fever outbreak, there was a population crash that put the population at the brink of extinction [43]. Currently, the population density is so low that it is difficult to encounter groups while walking line transects [43].
The black-and-gold howler A. caraya inhabits secondary, riverine, and flooded forests, with a distribution spanning parts of Brazil, Argentina, Paraguay, and Bolivia [44]. In Argentina, the species is abundant in the humid Chaco, the Paraná flooded savanna, and the Southern Cone Mesopotamian savanna, while relatively lower densities characterize populations inhabiting the Atlantic forest of Misiones, as well as the dry Chaco [33] (Figure A1). The species is globally listed as near-threatened (NT; [44]) and as VU in Argentina, mainly due to anthropogenic habitat modification and forest fragmentation [33]. In Argentina, A. caraya’s group size (2–20 individuals) and home ranges (4–112 ha) are highly variable [45]. Population densities are also highly variable. In the humid Chaco and Paraná flooded savanna, where it reaches its highest densities, estimates range from 12 to 320 individuals per km2 of forest habitat, but in the Atlantic forest of Misiones, the population status is not different from that of the brown howler [45,46].
Azara’s owl monkey A. azarae inhabits riverine forests in the humid and (to a much lesser extent) dry Chaco ecoregions of Brazil, Paraguay, and Argentina [47]. In Argentina, it occupies a relatively small area of eastern Formosa and Chaco provinces [48] (Figure A1). The species is globally listed as least concern (LC; [49]) but as VU in Argentina because of the high deforestation rates affecting both the humid and dry Chaco ecoregions [50]. This monkey lives in small groups of 3–6 individuals occupying home ranges of 6–11 ha [51]. Population densities in the gallery forests of the humid Chaco of eastern Formosa province range from 8 to 16 groups per km2 to 25 to 64 individuals per km2 of forest, but these densities diminish to the west of the province [50,52].
The black-horned capuchin monkey S. nigritus is endemic to the southern portion of the Atlantic forest. In Argentina, the species occupies most of Misiones province (Figure A1), being partially sympatric with A. guariba and A. caraya [53]. It is globally listed as NT [54,55] and as VU in Argentina [53]. The loss, degradation, and fragmentation of the Atlantic forest are the main threats [55]. The black-horned capuchin lives in relatively large groups of 7–44 individuals [56] and occupies large home ranges in Misiones (81–293 ha; [57]), especially in fragmented landscapes (>600 ha; V. Zárate, unpublished results). Population density at Iguazú National Park was estimated at 16 individuals per km2 [57], but this value is probably lower in other parts of Misiones, particularly in unprotected areas and productive landscapes where the probability of the occurrence of the species is lower [43].
Finally, Azara’s capuchin S. cay inhabits forested portions of the Pantanal, the Yungas, the dry deciduous forests of northern Bolivian Chaco and eastern Paraguay, as well as the Cerrado [58]. In Argentina, it occurs in the Yungas provinces of Salta and Jujuy (Figure A1). The species is listed as VU globally and in Argentina, with habitat loss as its main threat [58,59]. However, information on the ecology of the species in Argentina is scarce [60]. Outside Argentina, social groups have home ranges of <200 ha [59]. Although the species is present in most protected areas of the Argentine Yungas, there are no population density estimates for the country [59].

2.3. Expert Knowledge

The integration of expert knowledge to the systematic algorithm-based approach for the construction of niche models and the identification of priority areas for conservation is increasingly recommended, since it produces overall better representations of the geographic distribution of species and the important areas to focus conservation actions [61,62]. Following a workshop that took place in Corrientes province in March 2019, which gave momentum to the National Primate Conservation Plan of Argentina, a group of 13 primatologists (including some of the authors) with expertise on different primate species inhabiting the different ecoregions of the country was called to review the whole process and outputs of modeling species distribution and prioritization analysis (Supplementary Materials Table S1). Thus, some of the modeling and prioritization stages involved the modification of input variables following expert-judgment-based criteria. In particular, these variables included the species distribution limits, the records and databases used to build the species distribution models, the weighted variables used to construct the human footprint layer, and the importance assigned to different portions of species distribution for the prioritization analysis.

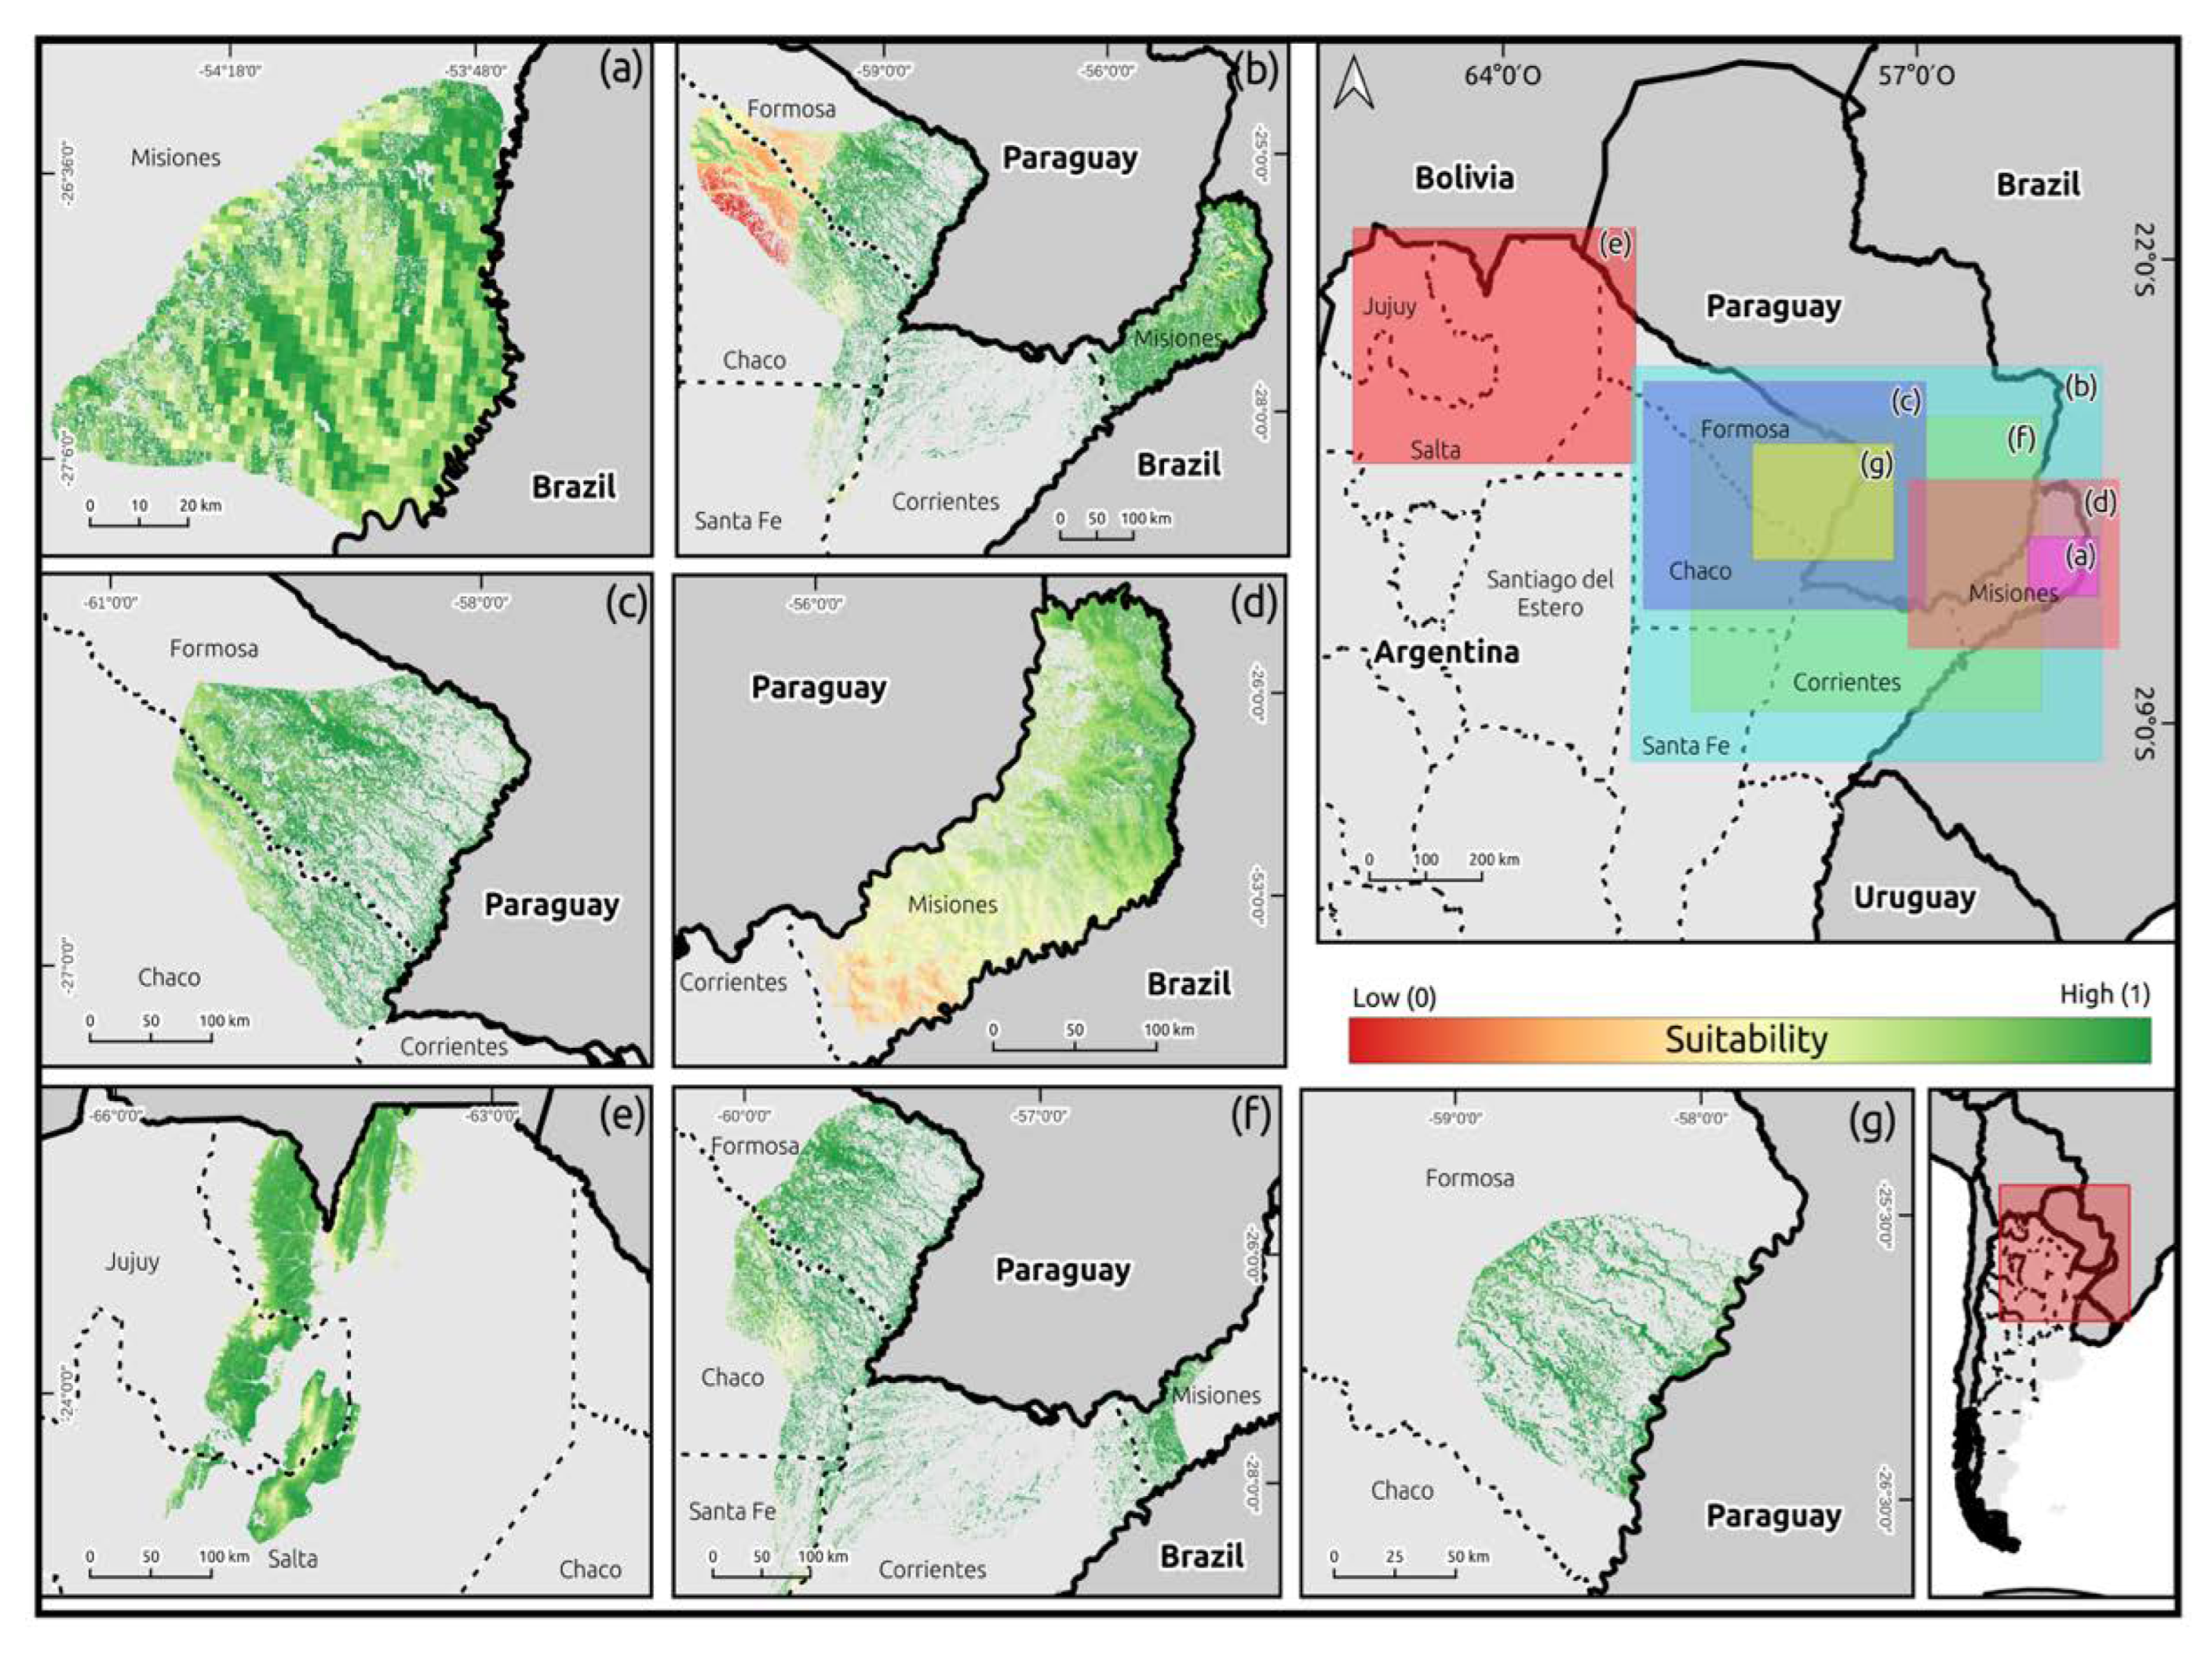
2.4. Species Distribution Models

We used species distribution models (SDMs) to estimate the environmental suitability and to map the species’ distribution. To build SDMs for each species, we used presence data from their whole distribution in South America to characterize their niches and estimate their environmental suitability [63]. Presence data were obtained from the Atlantic Primates data set [64] (n = 2922 records) from the Global Biodiversity Facility (GBIF, https://doi.org/10.15468/dl.bate8h (accessed on 1 August 2020, downloaded with the rgbif R package)) (n = 46), the database compiled for the categorization of threatened mammals of Argentina by the Ministry of Environment and Sustainable Development and the Argentine Society for the Study of Mammals [1] (n = 460), and personal or specific projects’ databases (I. Holzmann, unpublished data; Proyecto Mirikiná, unpublished data) (n = 171). We compiled 3599 raw records, which were cleaned by eliminating species records (1) with repeated geographic coordinates, (2) with coordinates with an accuracy < 0.5 degrees, (3) georeferenced out of the continent or in centroids of countries or provinces/states, or (4) georeferenced in scientific institutions or zoos. Presence records are usually geographically biased towards infrastructures that facilitate access to collection sites (e.g., roads and research institutions), which can negatively affect SDM performance [65,66]; all species records and databases were revised and validated by experts. We spatially filtered presence with a 10 km thinning distance to correct this sampling bias with the spThin R package [67]. Models were constructed with 1773 records (726 for A. guariba, 359 for A. caraya, 46 for A. azarae, 480 for S. nigritus, and 162 for S. cay).
We used 19 bioclimatic variables sourced from the CHELSA (https://chelsa-climate.org (accessed on 1 August 2020)) [68] with 1 km spatial resolution. To correct the variable multicollinearity, we performed a principal component analysis based on a correlation matrix. To do so, variables were first standardized by subtracting mean values and dividing by the standard deviation. Then, we used the eigenvectors originated for each principal component to calculate the scoring for each raster cell. We used the first five principal components, which explained 95% of the original variance as the new predictor variables in the SDMs [69] (Supplementary Materials Tables S2–S4). To model A. caraya and A. azarae, for which gallery forests constitute prime habitat and for which distributions are likely affected by the distance to water bodies according to expert judgment, we also used a variable that represents the distance to rivers using the hydrographic network of 1st, 2nd, and 3rd order of Strahler. This variable was generated using the database HydroSHEDS and used together with the five principal components [70,71].
To address the uncertainty associated with each algorithm [72] and to adequately consider different modeling conditions (e.g., number of presences, geographic biases) [73], we used algorithms based on different modeling approaches: maximum entropy [74], random forests [75], and support vector machine [76]. Maximum entropy models were fitted in two ways: with maximum entropy default (MED) using all features, i.e., linear, quadratic, product, and hinge, and with maximum entropy simple (MES) fitted only with linear and quadratic features. The MED and MES were fitted using a non-homogeneous Poisson procedure [74], a regularization multiplier value of 110,000 background points, and clog-log prediction. Random forests were automatically fitted through the function tuneRF of the randomForest R package [75], 500 trees, and out-of-bag error optimization parameter. Models with the minimum out-of-bag error were selected as the final models. Support vector machine models were fitted using a radial basis function kernel, with a constant cost value of 1, based on probability classes. Since the regional biological data lack real absences, we used pseudo-absences to construct random forests and support vector machine models. Since the distribution method of pseudo-absences and the proportion of the number of presences and the number of pseudo-absences can affect the algorithm performance [77], the number of pseudo-absences was equal to the number of presences. The pseudo-absences were randomly distributed throughout the same area used to construct SDMs, avoiding those cells with presence records. The calibration area (or accessible area) used for each species was defined based on the ecoregions where the species has been recorded. Ecoregions’ boundaries were obtained from the World Terrestrial Ecoregions [19].
Models were evaluated based on accuracy metrics, dependently and independently of threshold: area under the curve, true skill statistic, Jaccard, Sørensen, Fpb (F-measure), and Boyce [78,79]. We used the threshold that maximizes the sum of sensitivity and specificity (i.e., the threshold that maximizes the true skill statistic). We used an ensemble model to reduce the uncertainty associated with individual models [80]. Ensemble models were based on a principal component analysis with the environmental suitability values of the best algorithms for each species, i.e., those with a true skill statistic higher or equal to the mean of all algorithms for a given species. The eigenvector of the first principal component was used to calculate the environmental suitability values. The SDMs were built with the ENMTML R package [81]. Presence records processing and modeling were performed with the R software v.4.0.2 (R Core Team 2020, Vienna, Austria).

2.5. Post-Processing Steps

When SDMs are constructed using only abiotic environmental variables (i.e., without incorporating species interactions and/or simulations of dispersal), they tend to overestimate the distribution range of the species [82], which may affect the results of the spatial prioritization analysis [83]. To overcome this limitation, the environmental suitability values were restricted to within each species’ polygons of distribution. Distribution limits were set based on maps available in the categorization of threatened mammals of Argentina [1]. Only for A. azarae, following experts’ criteria, did we modify the original polygon by eliminating a doubtful record extremely isolated from the rest of the species’ distribution.
Based on the Hansen Global Forest Change v.1.6 (2000–2018), starting from the forest distribution in 2002, we eliminated the areas that had been transformed (loss of forest coverage) by 2018. The spatial resolution of this input is 1 arc-second per pixel or approximately 30 m per pixel at the equator. We did not sum forest gain areas since most corresponded to forestry plantations. We elaborated a script for Google Earth Engine, and we downloaded all of the cartography corresponding to forests for the whole area of the distribution of the primate species of Argentina (http://earthenginepartners.appspot.com/science-2013-global-forest (accessed on 15 March 2020)).
Finally, to avoid including forest fragments too small to be habitable by a primate group, we eliminated all forest patches smaller than the minimum home range area estimated for each species based on published data and expert criteria. We used 10 ha for both howler monkey species in the Atlantic forest [42,84], 4 ha for A. caraya in the Chaco region [45], 2 ha for A. azarae [85], and 80 ha for S. nigritus [57] and S. cay (for this species we used the same value as for S. nigritus because no data were available).

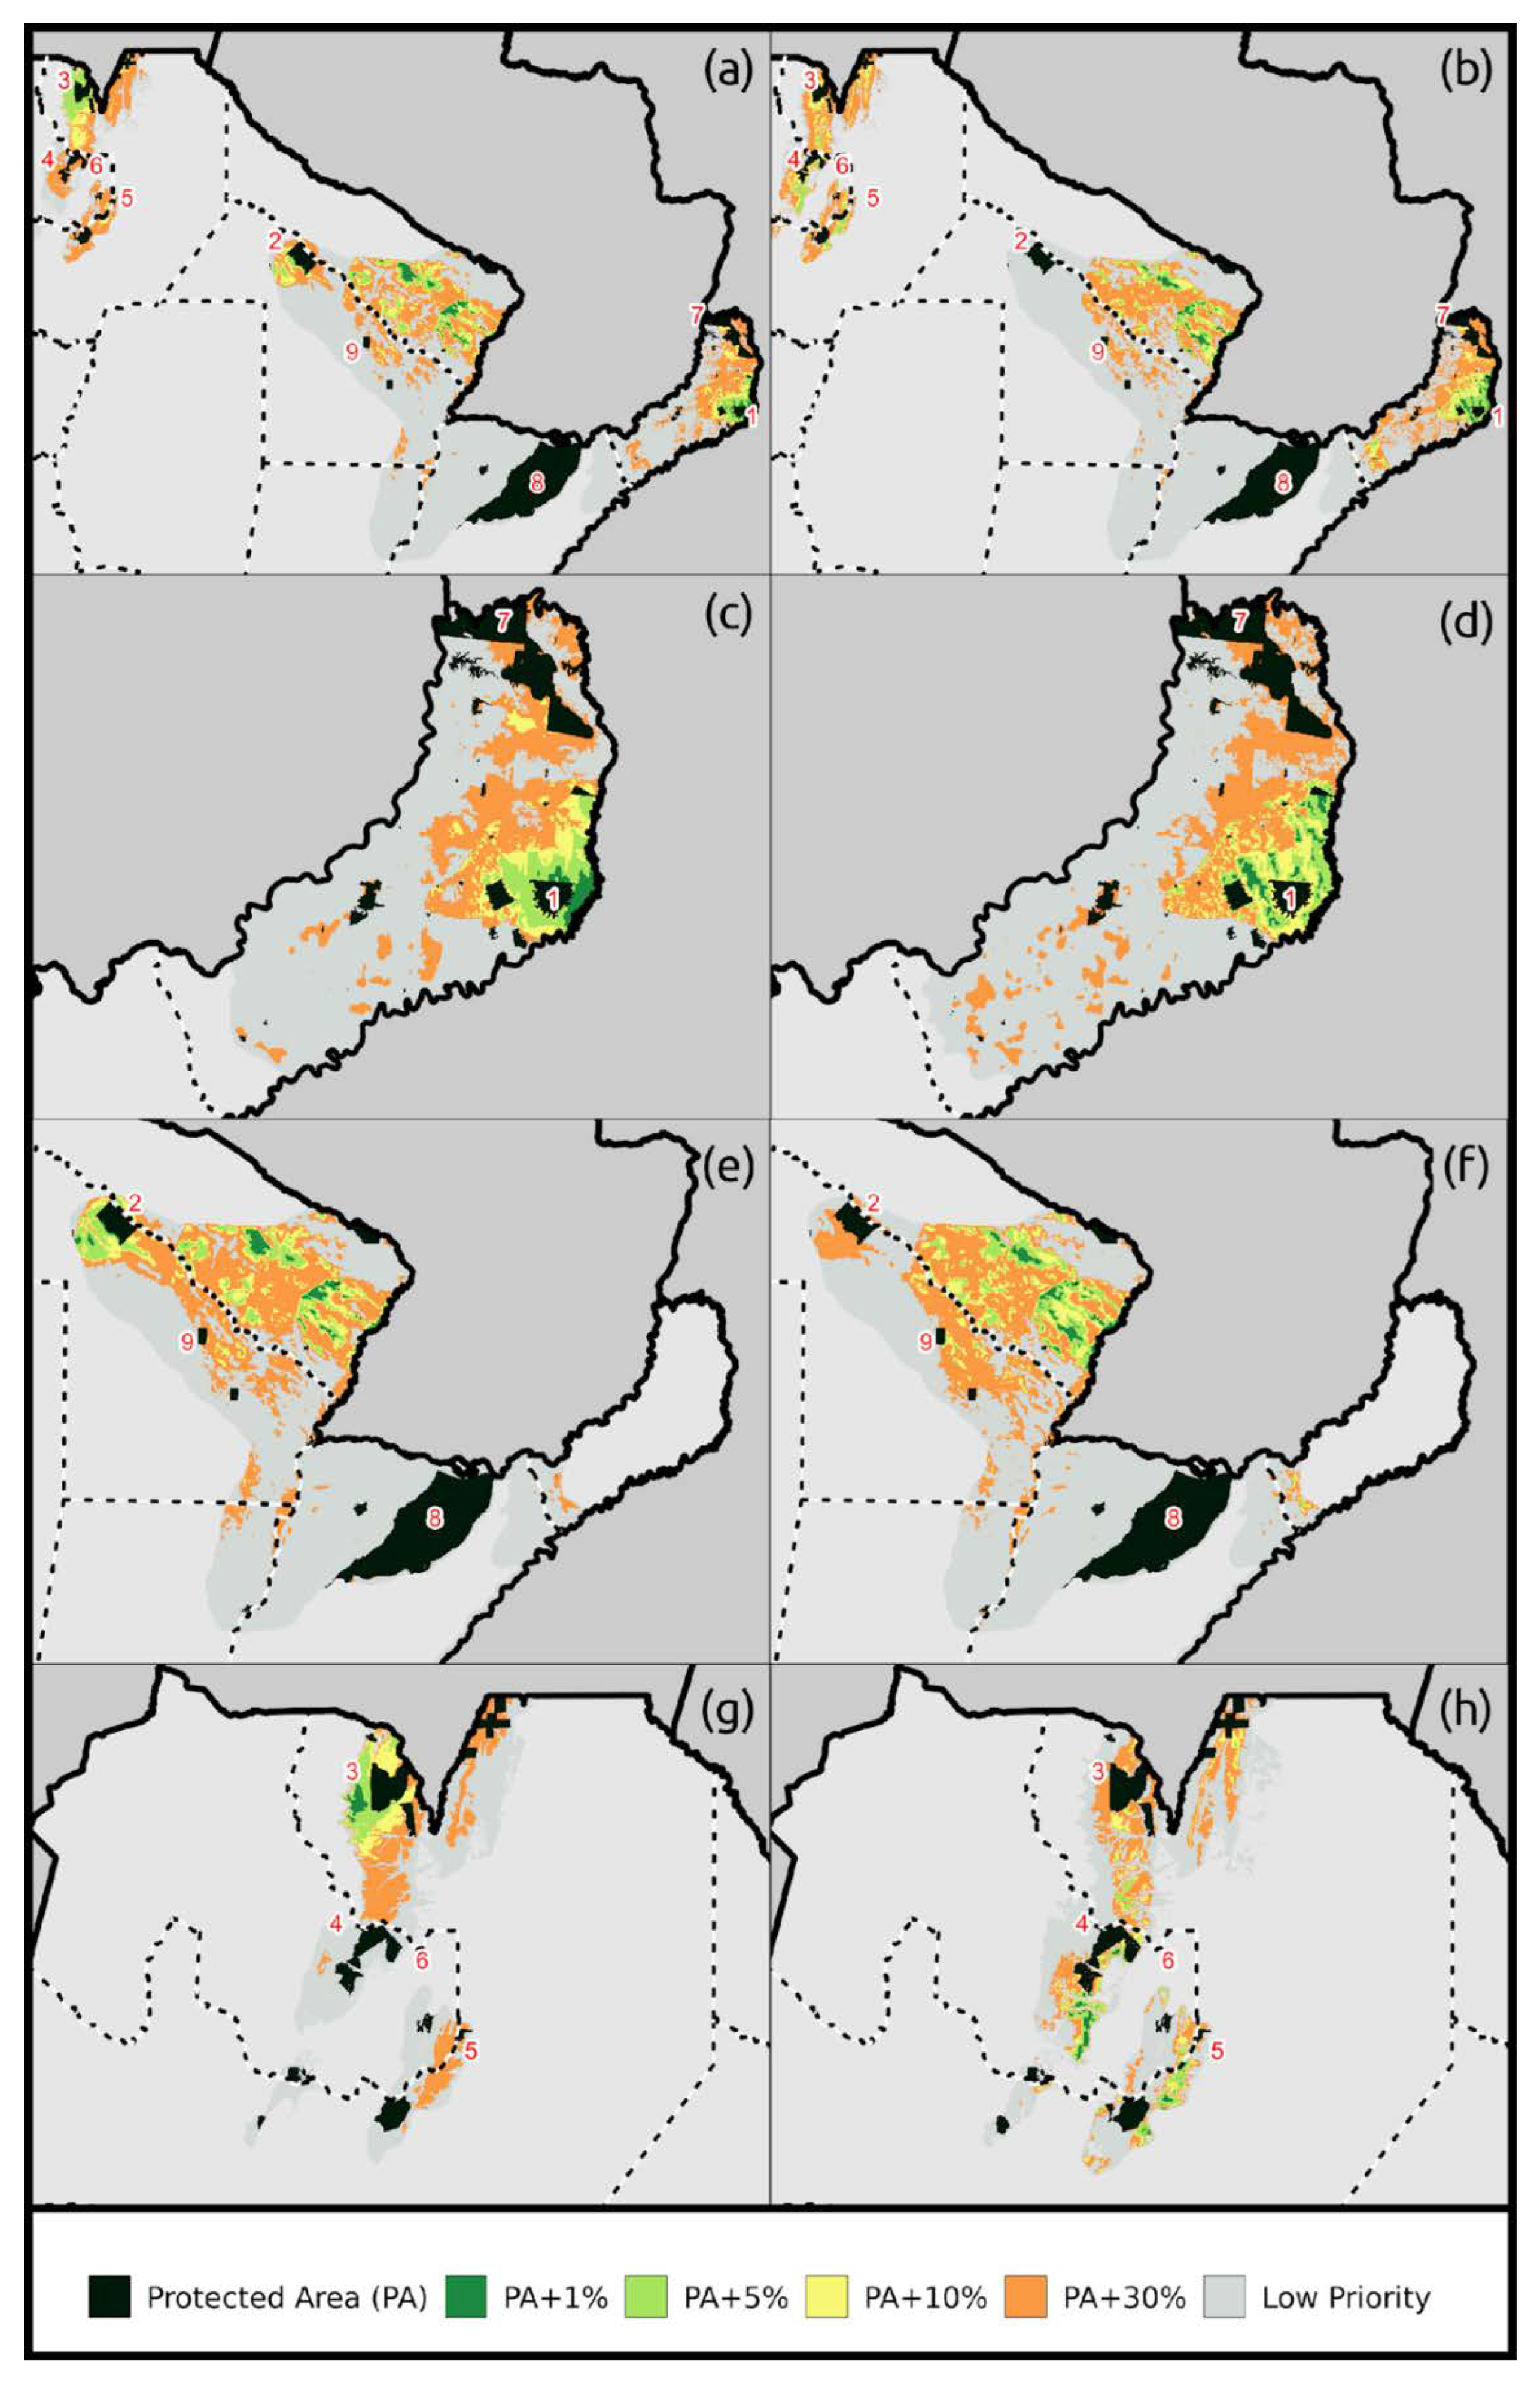
2.6. Spatial Prioritization Analysis

We used the software Zonation v. 4.0 [86] to identify priority areas for protecting primates in Argentina. Overall, we sought to identify areas where primates occur outside the current protected-area network to define potential new conservation areas. We developed prioritization analyses both at a national and an ecoregional scale. The latter was performed across three main blocks (hereinafter ecoregions), some of them constituting a combination of ecoregions recognized by Olson et al. [19]: (1) the Atlantic forest (which comprises the Alto Paraná Atlantic forest and the Araucaria moist forest), (2) the Chaco (encompassing the humid Chaco, dry Chaco, Paraná flooded savanna, and Southern Cone Mesopotamian savanna), and (3) the Andean Yungas (henceforth the Yungas). Moreover, we compared scenarios with or without a human footprint as an important factor in assessing the potential cost of conserving a particular area. Incorporating the human footprint as a cost in the analysis can illustrate which areas of high value for the species of interest can be conserved without incurring high costs due to anthropogenic factors [87].
Zonation is a prioritization analysis software useful for large-scale systematic planning. It can help identify areas of importance for retaining habitat quality and connectivity. The algorithm starts with a complete landscape and then iteratively discards grid cells (pixels) with lower values from the edges of the remaining area. In this way, the software helps maintain high levels of structural habitat connectivity. The order of cell removal provides landscape zonation wherein the most important areas are retained after removing the less important ones. By limiting the removal of cells from the edges of the remaining areas, the program allows the identification of a nested sequence of landscape structures where the priority core areas of species distribution are kept until the end of the cell removal process. The results are easy to visualize and interpret for planning and conservation [88].
Zonation develops spatial priority rankings based on species distributions and, optionally, on threats or costs, as well as other ecological factors such as connectivity effects [63,66]. Importantly, it considers the principle of complementarity, i.e., the algorithm tends to maintain a balanced representation of all species by ranking priority areas [86]. For our analysis, we used a ranking method based on the Core-Area Zonation function (CAZ), which calculates the value of each cell as the maximum biological value across all species instead of the sum of species-specific values [88]. Given the small number of primate species in Argentina and the relatively restricted distribution characterizing some of them, we find this method to be more appropriate since it enables identifying high-quality areas for each species individually, prioritizing sites with high occurrence levels for a single rare and/or highly weighted feature [88,89]. Although the five primate species we considered differ in their conservation status [1], we decided not to weigh species by their conservation status (i.e., all have the same weight) because of the significantly reduced distribution of A. guariba, which is also the most threatened species, already makes this primate highly important in contributing to the value of a cell.
The naturally fragmented forests of the humid easternmost Chaco constitute prime habitats for A. caraya and A. azarae, where they reach high densities [45,48,90]. In previous analyses, because Zonation usually prioritizes aggregated solutions [86], the prioritization solution was heavily weighted to the suboptimal but more continuous habitat of the boundary between the dry and the humid Chaco, where these species are less abundant. Therefore, we applied a specific expert-based criterion and assigned a greater importance to the humid Chaco portion where these species are known to be more abundant by adding two further polygons delimiting areas with a high population density of A. caraya and A. azarae (Figure 1f,g).

2.6.1. Connectivity

Habitat fragmentation is usually an undesired characteristic in planning new protected areas because some species have a lower probability of persisting in small and isolated fragments in the long term [91,92]. Besides, implementing severely fragmented protected areas can be impractical and costly [86]. Thus, connectivity is a fundamental component of spatial analyses. Zonation offers different aggregation methods that produce relatively more compact solutions, like distribution smoothing, which is species-specific and retains areas that are well connected. In this case, the connectivity among cells is determined through a smoothing kernel that allows a cell value to be “smoothed” to the surrounding area, i.e., cells that are surrounded by other high-value cells receive a higher value than more isolated ones [86]. The width of the smoothing kernel is species-specific and expresses the species dispersal or landscape use capacity. We assigned a smoothing kernel width of 2000 m for A. caraya and A. azarae, the two species that inhabit the most naturally fragmented landscapes of the Chaco ecoregion. We used 500 m width for the species living in more continuous forest landscapes (the brown howler and the two capuchin monkey species). These values represent the maximum distances of movement between separate fragments for each taxon [93,94]. In addition, we used the edge-removal feature of the software, which allows the preferential removal of cells from the edges of the remnant landscape (and not from internal areas), further influencing the aggregation of the prioritization solution [86].

2.6.2. Human Influence

To add the potential influence of human activities in areas of potential habitat for the five species, we created a human footprint for primates (hereafter, Human Footprint) layer based on the weighted sum of variables considered influential for prioritization. The variables and their weights, selected by the experts based on the current knowledge of the main anthropogenic factors affecting primates in Argentina, had been also identified in the recent categorization of Argentine mammals following IUCN criteria [1]. The variables used were: road network (obtained from Open Street Maps data, considering the categories “trunk”, “primary”, “secondary”, “tertiary”, “unclassified”, and “track”), human population density (data per census radius according to the Argentine National Census of Population and Housing 2010-INDEC) distributed by pixel, and land-cover map (obtained from MapBiomas Chaco Collection 1-2017) of forest, forest plantations, agriculture, and pastures. The road network and pasture cover were considered the most influential factors that could entail costs for primate conservation, followed by human population density and forestry plantations and, lastly, agriculture (Supplementary Materials Table S5).
The resulting raster was linearly scaled to express values from 0 (low Human Footprint) to 1 (high Human Footprint). The Human Footprint was introduced in the analysis as a cost layer to investigate the role of human influence on prioritization. When a cost layer is used, cell removal is based on the local conservation value divided by the cost of the cell (i.e., efficiency). In this way, a cell can be given a high value because of (1) a high suitability for the species or (2) low cost for the cell [86].

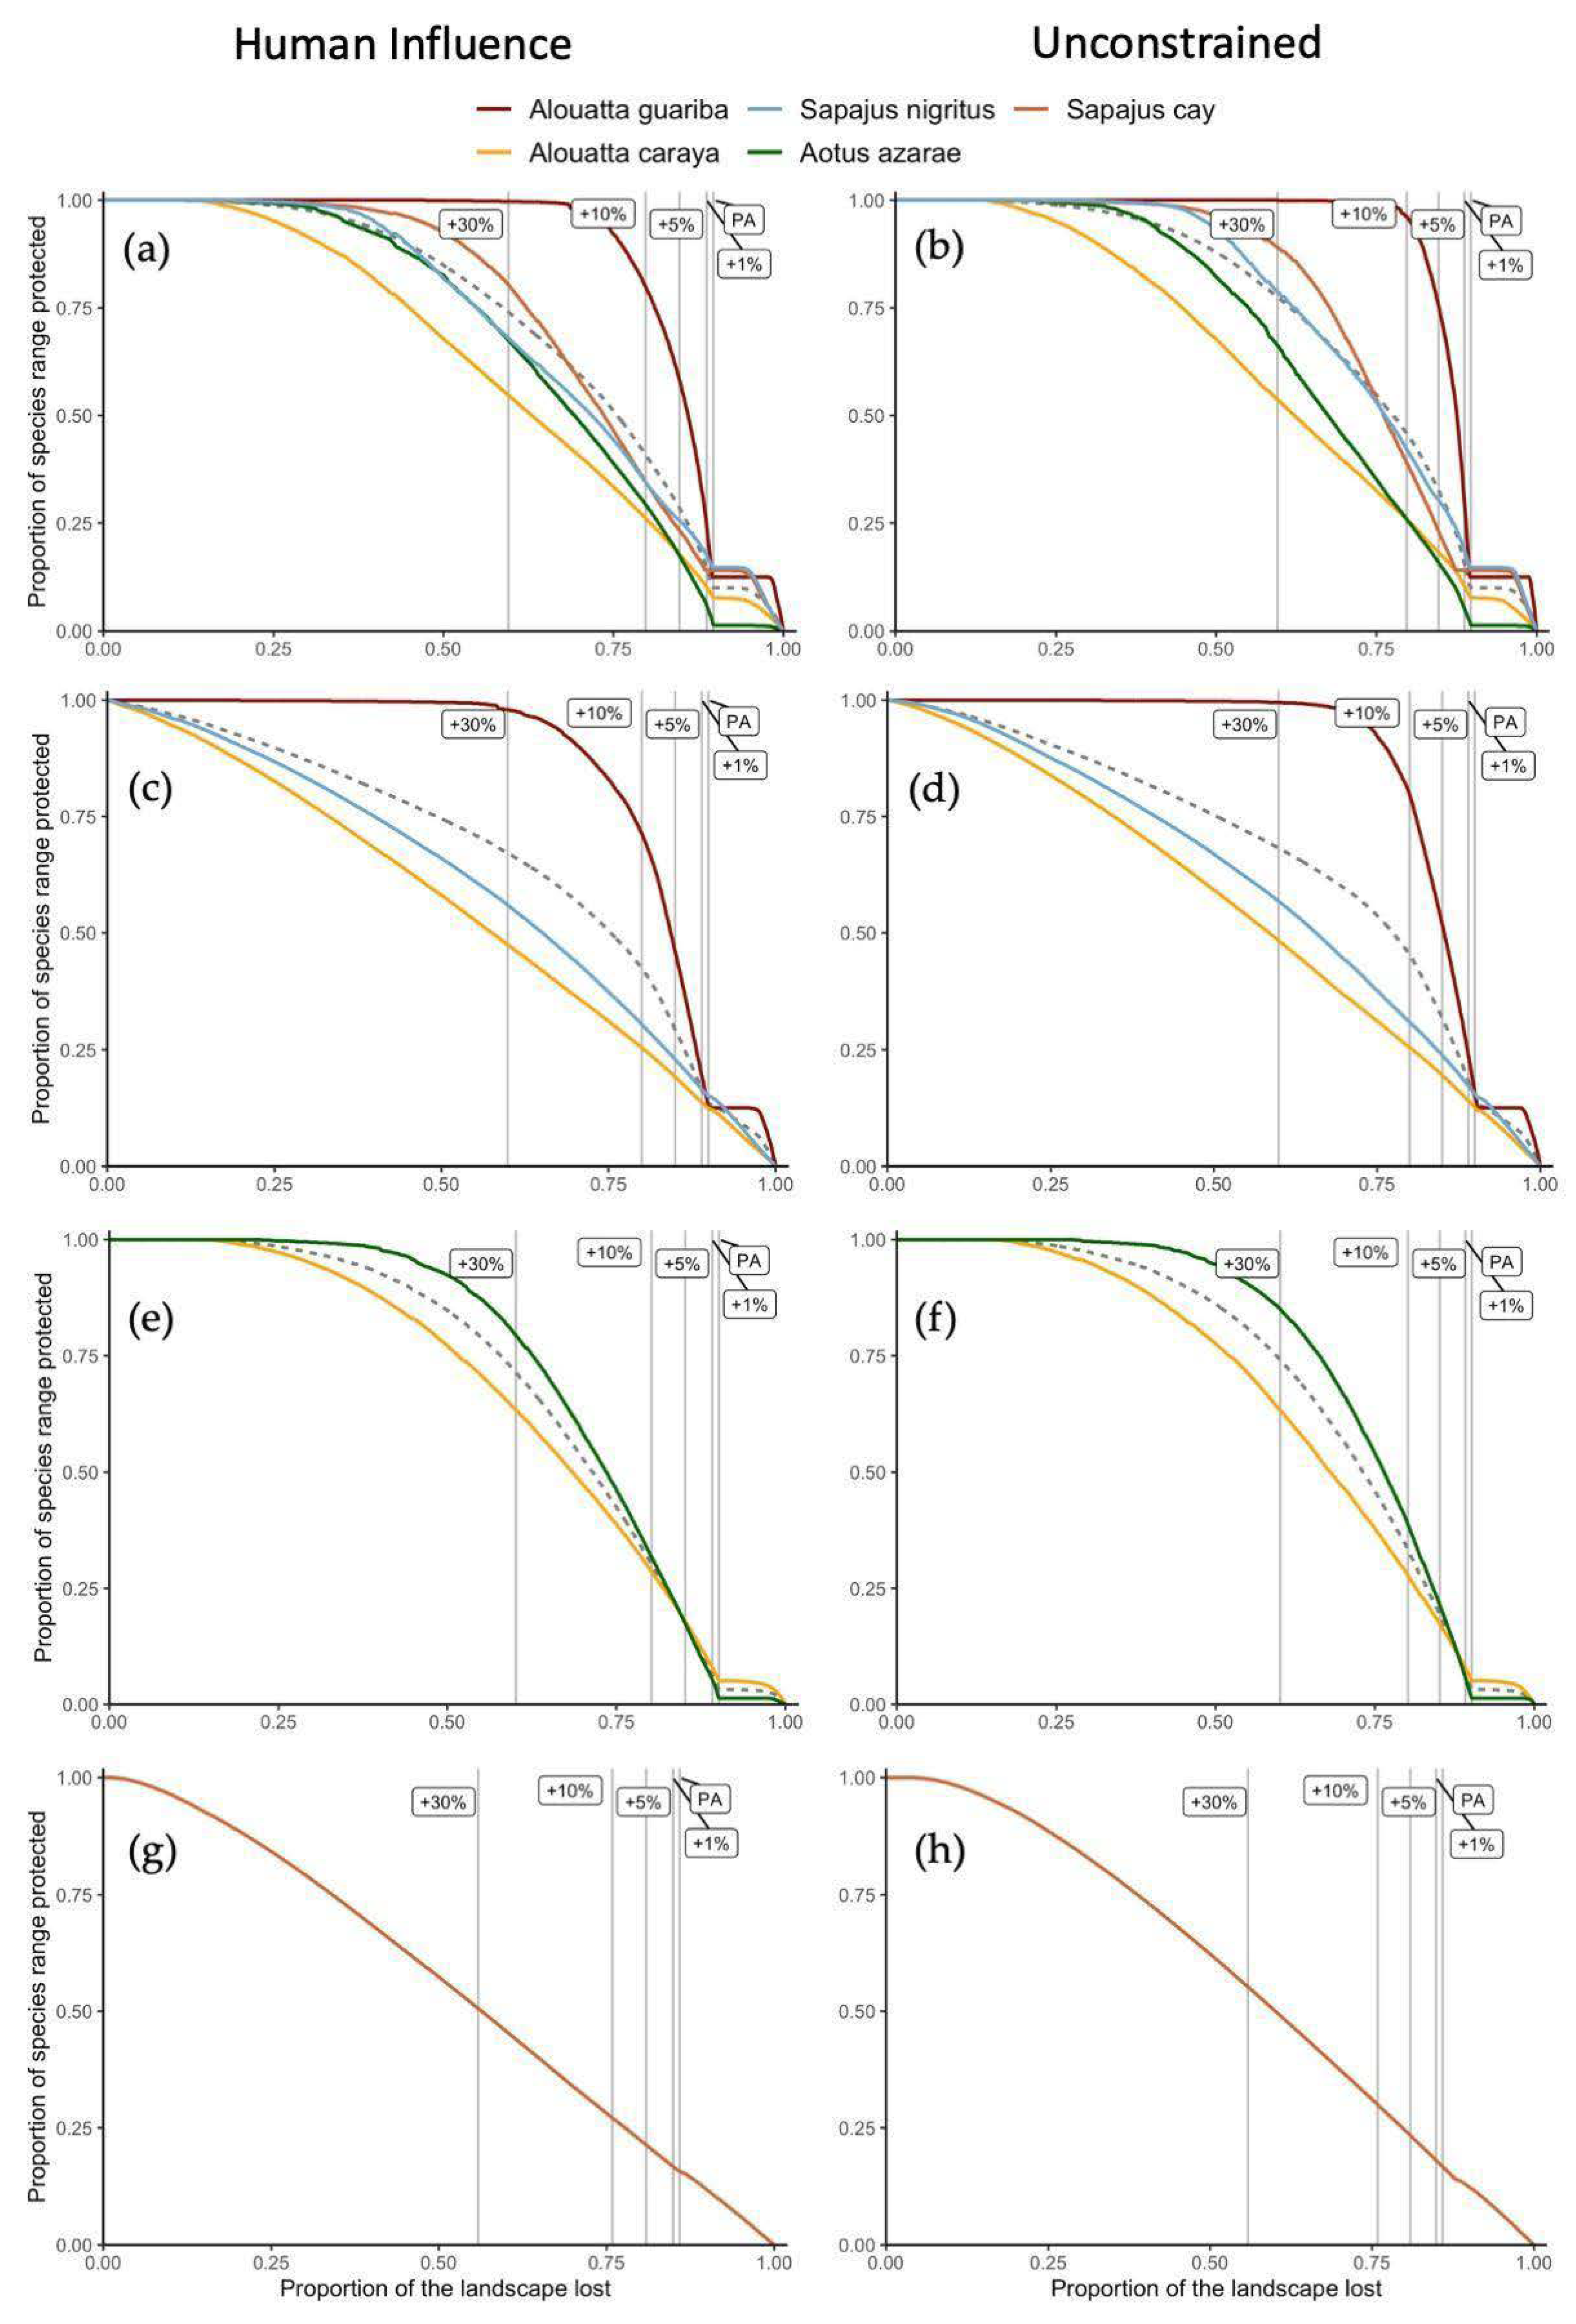
2.6.3. Conservation Targets

We aimed to identify new priority areas for the conservation of primates in Argentina outside the current reserve network, i.e., considering Argentina’s current protected area network (Biodiversity Information System: https://sib.gob.ar/mapa-sifap (accessed on 1 May 2020) as a basis. This analysis requires a hierarchical prioritization structure, which is specified using a mask that identifies existing reserves’ locations and then assigns them the highest ranks. In this way, it is guaranteed that the highest priorities are located in the present conservation areas and that priority areas outside them are identified [13,95]. We performed both national and ecoregional prioritization analyses. We defined as targets the top-ranked 1%, 5%, 10%, and 30% areas outside those already protected. This set of areas would expand and fill the ecological and geographical gaps in the current network of protected areas, increasing the conservation coverage of species in a balanced manner. According to the 2030 action targets specified by UNEP, ensuring the conservation and equitable management of >30% of the areas of particular importance for biodiversity and people is key to reducing threats to biodiversity [96].

2.6.4. Uncertainty Analysis

A problem common to all ecological and conservation sciences is data quality, quantity, and uncertainty. In general, there is first the challenge of addressing the lack of data, which, for our analyses, was of relatively small concern, since there is considerable information on the distribution of primate species in Argentina [1]. In addition, uncertainty in the analyses can also result from the use of predicted suitability based on different algorithms.
The main objective of uncertainty analysis in the prioritization approach is to assess the trade-offs between the areas’ biological quality and the information’s degree of uncertainty. Ideally, a network of areas should be selected to guarantee a high biological value despite certain uncertainty [86]. We performed an uncertainty analysis included in Zonation, called distribution discounting, which allows landscape ranking using uncertainty in species distribution [97]. We calculated uncertainty maps based on the standard deviation (SD) of the suitability estimated by each algorithm. We then specified the degree of uncertainty as 0.3 SD from the value of the nominal estimates of the input layers of the analysis. This produced a priority map based on an error of 0.3 SD. The priority values of this map were then visually compared with those of the main (nominal) map.
All layers incorporated into the analysis (species distributions, Human Footprint, protected areas) were rasterized at a 150 m spatial resolution.

2.7. Comparisons of Anthropic Scenarios

Species vulnerability to human proximity and anthropic impacts differ based on the degree of conflict and retaliatory responses that those species tend to elicit in local communities. For example, capuchin monkeys have a tendency to raid crops or damage forest plantations, thus they tend to be persecuted by local farmers [43,98]; neither howler monkeys or owl monkeys are known for those behaviors. For this reason, we compared the species representativity for different conservation targets between two scenarios: (1) a “human influence” scenario, in which we performed the prioritization analysis considering the species distribution but including the Human Footprint as a cost layer, and (2) an “unconstrained” scenario (i.e., without human impacts), considering only the species distribution in the analysis to identify priority areas, all other factors being equal.

3. Results

Most models performed well in predicting species presence (Table A1). The ensemble model performed as well as or better than many individual algorithms for all species except S. cay, for which the support vector machine was the best algorithm (Table A1).
Regarding species’ distribution, A. guariba showed high environmental suitability values in the highlands of central–eastern Misiones province, greatly overlapping with the small portion of the Araucaria moist forest ecoregion (Figure 1a). For A. caraya, the highest environmental suitability values were in the humid Chaco of eastern Formosa, eastern Chaco, and northeastern Santa Fe provinces; extensive areas of the Iberá wetlands and savannas in Corrientes; and the Atlantic forest of Misiones (Figure 1b,f). A. azarae showed high environmental suitability values in eastern Formosa and northeastern Chaco provinces, in areas dominated by gallery forests extending along watercourses (Figure 1c,g). The distribution of S. nigritus corresponds to the entire extension of the Atlantic forest in Misiones province, with the highest suitability values found in the northern and central areas of this province and lower ones in southern Misiones, in the transition between the Atlantic forest and the savannas (Figure 1d). Finally, S. cay showed the highest suitability values in the Yungas of Jujuy and Salta provinces and a small portion of the transitional Yungas–dry Chaco of both provinces (Figure 1e).
The current network of the protected areas of northern Argentina includes 19,511 km2, covering 7.2% of the whole distribution of the five primate species in the country (Figure 2). However, species’ distribution ranges are not equally represented in this network: 14–15% of the range of both capuchin species (S. nigritus and S. cay) and 12% of the small range of A. guariba lie within protected areas, while 8% of A. caraya’s and only 1% of A. azarae’s ranges are currently protected (Figure 3; Table 1). Performance curves showed that the increase in conservation coverage of the range of each primate species would be a function of the landscape area protected; however, the protection effort would not be evenly effective for all species (Figure 3). Indeed, some species, such as A. guariba, whose distribution range is relatively small and overlaps with other two species, would reach almost full range coverage (4/5) if only 10% of the landscape were protected at the national level. Others, such as S. cay would reach similar levels of coverage only at the 30% conservation target. A. azarae and S. nigritus, would require 30% of the landscape under protection to reach c. 2/3 of their range covered, while A. caraya, the primate species with the largest distribution in the country and the only one present in a wide part of its range, would have just half of its range conserved with 30% of landscape protected (Figure 3; Table 1).
Our prioritization analyses, under the human-influence scenario, suggest that most top-ranked priority areas (top 1% and 5%) are concentrated in: (1) the Yabotí Biosphere Reserve, a sustainable-use area located in central–eastern Misiones, where there is a large remaining block of Atlantic forest currently without a strict conservation category; (2) areas of the humid Chaco in Formosa province and in areas surrounding El Impenetrable National Park in Chaco province; and (3) around Baritú National Park, in the Yungas of Salta province (Figure 2a,c,e,g).
In the unconstrained scenario, i.e., without human footprint, the prioritization changes markedly in almost all ecoregions, except around Yabotí Biosphere Reserve in the Atlantic Forest of Misiones. However, the northern areas of Yabotí Biosphere Reserve and areas in southern Misiones increase in priority (Figure 2c,d). In the Chaco ecoregion, the highest-priority areas are shifted to the east, giving priority to the gallery forests of the humid Chaco in areas with higher human density and less relevance to the area surrounding the Impenetrable National Park (Figure 2e,f). In the Yungas, the areas identified as of top and high priority become more fragmented and shift from northwest to southeast, concentrating along and in the surroundings of Calilegua National Park in Jujuy and Pizarro National Reserve and El Rey National Park in Salta province, again areas with high human density (Figure 2b,h). Overall, compared to the human-influence scenario, the unconstrained scenario prioritizes more fragmented areas for all ecoregions (Figure 2). Besides, when the human footprint is not considered, the proportion of species range conserved increases slightly for all categories of priority areas. Under this scenario, the efficiency of land protection is especially higher for A. guariba, and for S. nigritus and S. cay as well (Figure 3).
Our prioritization results are robust since we found low sensitivity to the uncertainty associated with primate distributions (Supplementary Materials Figure S1).

4. Discussion

Our prioritization analyses identified potentially important areas for primate conservation in Argentina. These areas require protection that can be secured by creating new protected areas that complement existing ones or by mitigating the negative impacts of human activities or infrastructure. In these areas, we aim to facilitate the engagement of local communities in conservation activities and to promote innovative productive activities, such as ecotourism, that improve local economies while protecting forests and primate populations. Identified priority areas partially overlap with areas that experts had also identified as important for primate conservation. However, the algorithm-based systematic process of prioritization, such as the one made using Zonation, has more transparency and is explicitly target-driven [99], thus less prone to being biased by human perceptions or interests. Following this systematic prioritization analysis, results were reviewed, criticized, and revised by a team of experts. In particular, some biases were identified (e.g., the distribution of A. azarae was revised due to an outlier data point), and modifications were required to reach a consensus on the procedure, grounded in scientific knowledge and the ensuing results (e.g., relative dispersal distances of species had to be estimated and adjusted to make models more realistic). Nevertheless, the experts in this analysis agreed that the identified priority areas are important for deciding where to focalize conservation actions.
At the national level, the top-ranked priority areas (PA + 1% and PA + 5%) overlap, except those in the Yungas, with areas where >1 species is present. The results seem to provide an efficient solution regarding where to concentrate conservation actions. For example, if only 5% of the most important areas for primate conservation can be effectively protected, >50% of the distribution range of A. guariba (Argentina’s most endangered primate species) will be protected. This 5% covers c. 16 to 30% of the distribution ranges of the other species. Given that these other primates have much wider distribution ranges and in some cases population densities that are higher than A. guariba in absolute terms, their population size under protection in the 5% top-ranked priority areas will be larger than A. guariba’s if applying this conservation target. Furthermore, most of these primate species already have reached some degree of protection within national parks (e.g., S. nigritus within Iguazú National Park, S. cay within Baritú and Calilegua National Parks, A. caraya within Iberá and Chaco National Parks), something that is insufficient for A. guariba and for A. azarae, which have few and small populations effectively protected. Although c. 12% of the distributional range of A. guariba is within protected areas (mostly within Misiones provincial parks), no national park in Argentina contains a population of this species. The Yabotí Biosphere Reserve of Misiones contains most of its population in a multiple-use area where poaching and extractive activities are common and where, recently, forest fires have become another threat. Implementing strictly protected areas within this reserve would strongly impact the conservation of A. guariba. In sum, ensuring the effective protection of the selected top-ranked 5% priority areas, even though not a highly ambitious target, will significantly impact primate conservation in Argentina.
At an ecoregional level, the patterns are similar to those described at a national level. However, if the conservation targets were to protect a certain percentage of the range of the species (or of their populations), the percentage of the ecoregions that require protection will be larger than those attained at national level analyses. In the Yungas and the Atlantic forest of Argentina, the current protected area system encompasses >10% of the distributional range of the primate species occurring in those regions. In the Chaco ecoregion, however, a very small proportion (2–5%) of primate distributional ranges are included within the protected area system. In particular, A. azarae has only 1–2% of its distributional range within protected areas at ecoregional and national levels. Most populations of A. azarae in Argentina are on private lands without explicit levels of protection or within private reserves (e.g., Reserva Privada Mono Mirikina, Estancia Guaycolec [100]). Thus, creating strictly protected areas in the humid Chaco, particularly in eastern Formosa province, is imperative. For A. caraya, although there are protected areas at different levels (i.e., national or provincial) in the Chaco ecoregion, 8% of its distributional range is included within the protected area system, hence more protected areas are necessary in eastern Chaco, northwestern Corrientes, and northeastern Santa Fe provinces, where this species occupies the limit of its distribution. These regions are intensely affected by deforestation, habitat modification, urbanization [2], and recent massive wildfires [101].
Including the potential impact of humans in the analysis produced different results, affecting the species and ecoregions differently. Changes in land-use patterns exerted by humans may have important effects on primate populations. The human activity with the highest negative impact on primate populations is deforestation, particularly for the expansion of agriculture and cattle ranching [102]. Human infrastructure, particularly roads and high-voltage power lines, can also be important source of mortality for some primate populations (e.g., howler species [103,104]), and has been reported for the A. caraya living near human infrastructure in Argentina (M. Kowalewski pers. obs.). Finally, primates are particularly vulnerable to fires, usually of anthropic origin, that have become more frequent and intense in some areas of South America [105] and Argentina [101,106,107].
Disease and pathogen transmission from humans and domestic animals to wild primates, particularly in fragmented and degraded forests, is another important threat in areas with high human density [82,83,84,85,86] and should be considered when deciding the best location for protected areas. Both species of howler monkeys are highly susceptible to yellow fever epidemics in the Atlantic forest of Argentina [6,43], representing the main threat to the critically endangered A. guariba [108]. However, though the frequency and lethality of this disease are the main predictors of local howler extinctions, the complex dynamics of this disease are not necessarily associated with human presence or density [109], for which it is not clear if the prioritization scenario that considers the human footprint index is better for the conservation of the brown howler, at least concerning this important threat.
Primate hunting for the illegal pet trade is a direct threat for some primate populations worldwide [102], and this is frequent in Argentina in areas of high human accessibility, with A. caraya being a frequent target [2,33]. The retaliatory killing of primate species prone to raiding crops is another mortality source for some primate populations [110], and this is important in forest areas close to productive lands (i.e., orchards, crops, plantations) characterized by a high human footprint. Capuchin monkeys are particularly exposed to retaliatory killing for their crop-raiding tendency [110]. In the Atlantic forest and the Yungas, conflicts with farmers due to the damage produced by Sapajus species on crops [111] and forest plantations [98] are frequent. This may explain why, in the Atlantic forest, S. nigritus has a higher probability of occurrence in more continuous forests with low human accessibility [43]. Thus, the top-priority areas identified in the unconstrained scenario are probably not the best for these two capuchin species. For S. cay, top-priority areas would be better located in northern Salta province, in areas of low human population density and low human accessibility surrounding Baritú National Park, as indicated by the constrained model. In Misiones, given that the best conservation areas for the critically endangered A. guariba are in the Yabotí Biosphere Reserve, an area with a relatively high human footprint, the best areas to preserve S. nigritus should be traded off against areas for the better protection of A. guariba. However, in the Yungas and in the Atlantic forest, it will be important to implement conservation programs to mitigate conflicts and to reduce the retaliatory killing of primates. In the Chaco region, given that both A. azarae and A. caraya are not prone to crop-raiding and the retaliatory killing of these species is not common, the unconstrained prioritization scenario is probably the best selection, at least concerning this threat. This scenario gives more weight to areas located in the riverine forests of eastern Formosa, where A. azarae reaches its highest densities, for which it probably constitutes the best of the two options, particularly since the top-priority areas selected under the human footprint scenario, even though relatively free of the anthropic threats mentioned previously, are located in areas with lower habitat suitability for these two primates (i.e., in the dry Chaco).
One of the limitations of Zonation software that required thought and discussions among the authors of this work, and a differential modification of model parameters to species and ecoregions, was related to different capacities of species to deal with habitat fragmentation and the heavy weight that the algorithm gives to habitat connectivity. When we assigned to the five species the same ability to move or disperse between habitat patches, the areas with the highest densities of A. azarae and A. caraya in the humid Chaco, presumably those with the highest habitat suitability for them, were not selected in the top priority areas, which Zonation identified as laying in the driest portion of these primates’ distribution in the Chaco, where forests have more continuity. Zonation heavily penalized habitat fragmentation. However, these two primate species have higher dispersal and movement capacity than the other ones and generally occupy naturally fragmented landscapes in the humid Chaco [90,112]. For example, in eastern Chaco and northern Corrientes provinces, isolated forest fragments dominate the landscape, and even very small (<2 ha) and isolated ones are occupied by social groups of A. caraya [90,113]. This suggests that these two species frequently move and disperse through open areas, something not frequent in the other three primate species. We thus assigned them a differential (larger) dispersal capacity to make the models more realistic. However, we emphasize the urgent need for better basic demographic data, particularly on the dispersal capacity of primate species, information that is critically important to model landscape use and identify priority areas given the current scenario of the increasing fragmentation and degradation of primate habitat.
Another limitation of our analysis is that it is based on distribution models with only presence data, not data on population abundances, which are better correlated with habitat suitability. For S. nigritus, as a surrogate, occupancy models have been used to assess habitat suitability in the Atlantic forest [43]. However, little information exists on habitat quality and the determinants of primate densities in Argentina. Very few density estimates exist for the primates of Argentina, even for the relatively well-studied species such as S. nigritus, A. caraya, and A. azarae, for which data are available for just one or a few locations each [45,46,48,57,113].
This study has shown how important the knowledge of experts (i.e., field primatologists) is when selecting variables critical for prioritization analyses (e.g., species’ habitat use and dispersal capacity). In addition, our experience has highlighted the relevance of a critical assessment of prioritization outputs by experts with a field-based criterion to make this exercise more realistic and potentially useful as a management tool for species conservation. We conclude that, at least for non-human primates in Argentina, species distribution modeling would greatly benefit from considering not only species’ presence but also abundance data, which are likely to improve the predictive power of model distributions [114], thus providing higher-quality inputs for prioritization analyses.
The areas identified in this study will serve to further the National Primate Conservation Plan of Argentina. Furthermore, they may also be used as an important input for the implementation of the Argentine forest law (Ley Nacional N° 26.331), which promotes the conservation of native forests. This law mandates provinces to categorize their forests, in a spatially explicit way (in maps), into three conservation categories: I) forests with strict protection, II) those that cannot be converted to other uses but where forests can be sustainably exploited, and III) those that may be converted to other land uses with a previous environmental impact assessment and after public consultation [115]. Our prioritization can be fed into this process of categorizing native forests, and, ideally, our priority areas can be assigned to categories I or II or, when placed into category III, we can convince the public on the importance of the conservation of these forests and to promote mitigation actions.
Finally, guided by a general concern about the ecological crisis we are facing, we call for the urgent mobilization of funds and resources to implement the conservation of primate populations and their habitats in Argentina. Future prioritization analysis should consider land cost to estimate the costs of protected-area expansion more realistically. The involvement and support of the local communities that live in the identified priority areas for the protection of primate populations and their habitats is fundamental to achieve the conservation goals, and this should entail economic and social benefits for those communities. The potential priority areas proposed here, considered within the context of a broad participatory process involving relevant stakeholders, will help guide new conservation policies and support management objectives.

Supplementary Materials

The following supporting information can be downloaded at: https://www.mdpi.com/article/10.3390/d14110982/s1. Figure S1: Zonation outputs of priority areas for primates of Argentina (AICPA), from white (low priority) to black (high priority). Map based on nominal estimates from species distribution models (above) and map based on 0.3SD (standard deviation) uncertainty of models (below); Table S1: List of the 13 expert primatologists (in alphabetical order of surnames) involved in reviewing the process and outputs of modeling species distribution and prioritization analysis; Table S2: Environmental variables used to model potential species distribution of primates in Argentina; Table S3: Variance and cumulative variance explained by the principal components selected from the Analysis of Principal Components performed with the environmental variables; Table S4: Coefficient of original bioclimatic variable regarding the first five principal components used as predictors to construct species distribution models; Table S5: List of the variables and their relative weight used to build the human footprint raster layer that was introduced as a potential cost into the prioritization analysis. The variables and their weights were selected by experts based on current knowledge about the main anthropogenic factors affecting primates in Argentina. The road network was obtained by Open Street Maps data and included the following categories: trunk, primary, secondary, tertiary, unclassified and track. Human population density per pixel was obtained by census radius data according to the National Census of Population and Housing 2010—INDEC. Maps of forest cover, forest plantations, agriculture and pastures were obtained by MapBiomas Chaco Colección 1-2017.

Author Contributions

Conceptualization, I.A., M.S.D.B. and S.J.E.V.; formal analysis, I.A., S.J.E.V. and J.A.I.; funding acquisition: M.S.D.B.; methodology, I.A., S.J.E.V. and J.A.I.; project administration, I.A.; writing—original draft preparation, I.A., M.S.D.B. and S.J.E.V.; writing—review and editing, R.P., E.F.-D., S.P., M.P.T., I.H. and M.M.K. All authors have read and agreed to the published version of the manuscript.

Funding

The APC was funded by PICT-2019-01891, FONCyT, Agencia de Ciencia y Tecnología, Ministerio de Ciencia y Tecnología de Argentina and PUE-CONICET No. 22920160100130CO.

Institutional Review Board Statement

Not applicable.

Informed Consent Statement

Not applicable.

Data Availability Statement

The original dataset (i.e., rasters of the species distribution models and rasters of priority areas) are available in figshare.com (https://doi.org/10.6084/m9.figshare.21187003 (accessed on 15 September 2022)).

Acknowledgments

We are grateful to the Ministry of Environment and Sustainable Development of Argentina (MAyDS), the Argentine Society for the Study of Mammals (SAREM), and the Argentine Primatological Society (APRIMA) for promoting the National Primate Conservation Plan of Argentina. We also thank all the researchers and park rangers that contributed with primate locations that were used to improve data sets and refine distribution limits for all primate species, and the experts whose criterion was taken into account through the distribution modeling and prioritization analysis process. Two anonymous reviewers provided helpful comments on this manuscript.

Conflicts of Interest

The authors declare no conflict of interest.

Appendix A

Figure A1. Map showing the known distribution ranges for the five primate species in the ecoregions identified in northern Argentina [19].
Diversity 14 00982 g0a1
Table A1. The performance of four algorithms (MED = maximum entropy default, MES = maximum entropy simple, SVM = support vector machine, RF = random forest) and an ensemble model (PCS) were used to model the spatial distribution of the primate species of Argentina. Model performance metrics are in columns: Boyce’s index, the area under the curve (AUC), the similarity indices of Jaccard and Sørensen, and the true skill statistic (TSS).
SpeciesAlgorithmBoyceAUCJaccardSørensenTSS
Alouatta guaribaMED0.810.860.680.810.59
MES0.860.880.70.820.61
SVM0.850.870.70.820.62
RF0.930.920.730.840.68
PCS *0.930.920.730.840.68
Alouatta carayaMED0.910.840.650.790.57
MES0.890.820.620.760.53
SVM0.950.850.630.770.57
RF0.910.890.70.830.66
PCS *0.910.890.70.830.66
Aotus azaraeMED0.550.850.720.840.66
MES0.70.840.720.830.65
SVM0.480.830.690.810.63
RF0.720.870.730.840.69
PCS *0.740.870.720.840.65
Sapajus nigritusMED0.770.860.710.830.61
MES0.710.870.720.840.63
SVM0.590.820.70.820.6
RF0.920.860.710.830.62
PCS *0.890.880.720.840.63
Sapajus cayMED0.190.320.430.60.06
MES−0.080.30.280.370.11
SVM *0.670.530.460.60.35
RF0.110.470.410.540.27
PCS0.250.490.430.560.3
* Selected model.

References

  1. SAyDS. SAREM Categorización 2019 de los Mamíferos de Argentina Según su Riesgo de Extinción. Lista Roja de los Mamíferos de Argentina. 2019. Available online: https://cma.sarem.org.ar/ (accessed on 1 March 2020).
  2. Abba, A.M.; Varela, D.; Cirignoli, S.; Pereira, J.A.; Bolkovic, M.L.; Peker, S.; Porini, G.M.; de Bustos, S.; Degrati, M.; Denuncio, P.; et al. Categorización de los mamíferos de Argentina 2019: Resumen y análisis de las amenazas. Mastozoología Neotrop. 2022, 29, 1–73. [Google Scholar] [CrossRef]
  3. Hansen, M.C.; Potapov, P.V.; Moore, R.; Hancher, M.; Turubanova, S.A.; Tyukavina, A.; Thau, D.; Stehman, S.V.; Goetz, S.J.; Loveland, T.R.; et al. High-resolution global maps of 21st-century forest cover change. Science 2013, 342, 850–853. [Google Scholar] [CrossRef] [Green Version]
  4. Nanni, A.S.; Piquer-Rodríguez, M.; Rodríguez, D.; Regueiro, M.N.; Periago, M.E.; Aguiar, S.; Ballari, S.; Blundo, C.; Derlindati, E.; Di Blanco, Y.; et al. Presiones sobre la conservación asociadas al uso de la tierra en las ecorregiones terrestres de la Argentina. Ecol. Austral 2020, 30, 304–320. [Google Scholar] [CrossRef]
  5. UMSEF. Monitoreo de la Superficie de Bosque Nativo de la República Argentina; Tomo, I., Ed.; Unidad de Manejo del Sistema de Evaluación Forestal, Dirección Nacional de Bosques, Ministerio de Ambiente y Desarrollo Sostenible de la Nación: Buenos Aires, Argentina, 2021. [Google Scholar]
  6. Holzmann, I.; Agostini, I.; Areta, J.I.; Ferreyra, H.; Beldomenico, P.; Di Bitetti, M.S. Impact of yellow fever outbreaks on two howler monkey species (Alouatta guariba clamitans and A. caraya) in Misiones, Argentina. Am. J. Primatol. 2010, 72, 475–480. [Google Scholar] [CrossRef] [PubMed]
  7. Marshall, A.J.; Wich, S.A. Why conserve primates? In An Introduction to Primate Conservation; Wich, S.A., Marshall, A.J., Eds.; Oxford University Press: Oxford, UK, 2016; pp. 13–31. [Google Scholar]
  8. Bello, C.; Galetti, M.; Pizo, M.A.; Magnago, L.F.S.; Rocha, M.F.; Lima, R.A.F.; Peres, C.A.; Ovaskainen, O.; Jordano, P. Defaunation affects carbon storage in tropical forests. Sci. Adv. 2015, 1, e1501105. [Google Scholar] [CrossRef] [PubMed] [Green Version]
  9. Peres, C.A.; Emilio, T.; Schietti, J.; Desmoulière, S.J.M.; Levi, T. Dispersal limitation induces long-term biomass collapse in overhunted Amazonian forests. Proc. Natl. Acad. Sci. USA 2016, 113, 892–897. [Google Scholar] [CrossRef] [Green Version]
  10. Margules, C.R.; Pressey, R.L. Systematic conservation planning. Nature 2000, 405, 243–253. [Google Scholar]
  11. Kukkala, A.; Moilanen, A. Core concepts of spatial prioritisation in systematic conservation planning. Biol. Rev. 2012, 88, 443–464. [Google Scholar] [CrossRef] [Green Version]
  12. Sarkar, S.; Pressey, R.L.; Faith, D.P.; Margules, C.R.; Fuller, T.; Stoms, D.M.; Moffett, A.; Wilson, K.A.; Williams, K.J.; Williams, P.H.; et al. Biodiversity Conservation Planning Tools: Present Status and Challenges for the Future. Annu. Rev. Environ. Resour. 2006, 31, 123–159. [Google Scholar] [CrossRef]
  13. Lehtomäki, J.; Moilanen, A. Methods and workflow for spatial conservation prioritization using Zonation. Environ. Model. Softw. 2013, 47, 128–137. [Google Scholar] [CrossRef] [Green Version]
  14. Rezende, G.; Sobral-Souza, T.; Culot, L. Integrating climate and landscape models to prioritize areas and conservation strategies for an endangered arboreal primate. Am. J. Primatol. 2020, 82, e23202. [Google Scholar] [CrossRef]
  15. Condro, A.; Prasetyo, L.; Rushayati, S.; Santikayasa, I.; Iskandar, E. Predicting Hotspots and Prioritizing Protected Areas for Endangered Primate Species in Indonesia under Changing Climate. Biology 2021, 10, 154. [Google Scholar] [CrossRef] [PubMed]
  16. Davenport, T.R.; Nowak, K.; Perkin, A. Priority Primate Areas in Tanzania. Oryx 2013, 48, 39–51. [Google Scholar] [CrossRef] [Green Version]
  17. Calle-Rendón, B.R.; de Toledo, J.J.; Mustin, K.; Vasconcelos, I.M.; Hilário, R.R. Priority areas for conservation of primates in a threatened Amazonian savanna. J. Nat. Conserv. 2021, 65, 126109. [Google Scholar] [CrossRef]
  18. Tobón, W.; Urquiza-Haas, T.; Ramos-Fernández, G.; Calixto-Pérez, E.; Alarcón, J.; Kolb, M.; Koleff, P. Prioridades Para la Conservación de Los Primates en México; Comisión Nacional para el Conocimiento y Uso de la Biodiversidad–Asociación Mexicana de Primatología, A.C.–Comisión Nacional de Áreas Naturales Protegidas: Mexico City, Mexico, 2012. [Google Scholar]
  19. Olson, D.M.; Dinerstein, E.; Wikramanayake, E.D.; Burgess, N.D.; Powell, G.V.N.; Underwood, E.C.; D’Amico, J.A.; Itoua, I.; Strand, H.E.; Morrison, J.C.; et al. Terrestrial Ecoregions of the World: A New Map of Life on Earth: A New Global Map of Terrestrial Ecoregions Provides an Innovative Tool for Conserving Biodiversity. Bioscience 2001, 51, 933–938 . [Google Scholar] [CrossRef]
  20. Di Bitetti, M.S.; Janson, C.H. Reproductive socioecology of tufted capuchins (Cebus apella nigritus) in Norteastern Argentina. Int. J. Primatol. 2001, 22, 127–142. [Google Scholar]
  21. Di Bitetti, M.S.; Placci, G.; Dietz, L.A. A Biodiversity Vision for the Upper Paraná Atlantic Forest Ecoregion: Designing a Biodiversity Conservation Landscape and Setting Priorities for Conservation Action; World Wildlife Fund: Washington, DC, USA, 2003. [Google Scholar]
  22. Neiff, J.J.; Neiff, M. Evaluación de los impactos del cambio climático sobre el ecosistema natural y la biodiversidad Esteros del Iberá (Argentina). Ser. Medio Ambient. y Desarro. Santiago Chile Nac. Unidas. 2013, 152, 1–58. Available online: https://repositorio.cepal.org/bitstream/handle/11362/35885/LCL3728_es.pdf?sequence=1&isAllowed=y (accessed on 1 March 2020).
  23. Sampedro, D.; Calvi, M. Caracterización de la ganadería vacuna del nordeste argentino (NEA). In Cría Vacuna En el NEA; Barbera, P., Ed.; Ediciones INTA: Buenos Aires, Argentina, 2018; pp. 8–18. [Google Scholar]
  24. Orozco, M.M.; Marull, C.; Jiménez, I.; Gürtler, R.E. Mortalidad invernal de ciervo de los pantanos (Blastocerus dichotomus) en humedales del noreste argentino. Mastozoología Neotrop. 2013, 20, 163–170. [Google Scholar]
  25. Pizzio, R.; Bendersky, D. Base forrajera y potencial de mejora en el NEA. In Cría vacuna en el NEA; Barbera, P., Ed.; Ediciones INTA: Buenos Aires, Argentina, 2018; pp. 19–44. [Google Scholar]
  26. Brown, A.; Martinez Ortiz, U.; Acerbi, M.; Corcuera, J. La Situación Ambiental Argentina 2005; Fundación Vida Silvestre Argentina: Buenos Aires, Argentina, 2006. [Google Scholar]
  27. Bianchi, A.R.; Cravero, S.A.C. Atlas climático digital de la República Argentina; Instituto Nacional del Tecnología Agropecuaria (INTA): Salta, Argentina, 2010. [Google Scholar]
  28. Ginzburg, R.; Adámoli, J. Situación ambiental en el Chaco Húmedo. In La Situación Ambiental Argentina 2005; Brown, A., Martinez Ortiz, U., Acerbi, M., Corchera, J., Eds.; Fundación Vida Silvestre Argentina: Buenos Aires, Argentina, 2005; pp. 103–113. [Google Scholar]
  29. Fernandez-Duque, E. Social monogamy in wild owl monkeys (Aotus azarae) of Argentina: The potential influences of resource distribution and ranging patterns. Am. J. Primatol. 2015, 78, 355–371. [Google Scholar] [CrossRef] [Green Version]
  30. Portillo-Quintero, C.; Sánchez-Azofeifa, G. Extent and conservation of tropical dry forests in the Americas. Biol. Conserv. 2010, 143, 144–155. [Google Scholar] [CrossRef]
  31. Ojeda, R.; Stadler, J.; Brandl, R. Diversity of mammals in the tropical–temperate Neotropics: Hotspots on a regional scale. Biodivers. Conserv. 2003, 12, 1431–1444. [Google Scholar] [CrossRef]
  32. Burkart, R.; Bárbaro, N.O.; Sánchez, R.O.; Gómez, D.A. Ecoregiones de la Argentina; Administración de Parque Nacionales, Programa Desarrollo Institucional Ambiental: Buenos Aires, Argentina, 1999. [Google Scholar]
  33. Oklander, L.I.; Kowalewski, M.M.; Peker, S.M.; Pavé, R.; Agostini, I.; Holzmann, I.; Apellaniz, M. Alouatta caraya. In Categorización del Estado de Conservación de Los Mamíferos de Argentina 2019; Lista Roja de los mamíferos de Argentina; SaydS, S., Ed.; SAREM: Buenos Aires, Argentina, 2019; Available online: http://cma.sarem.org.ar/es/especie-nativa/alouatta-caraya (accessed on 1 March 2020).
  34. Brown, A.D.; Pacheco, S.; Lomáscolo, T.; Malizia, L. Situación ambiental en los bosques andinos yungueños. In La Situación Ambiental Argentina 2005; Brown, A.D., Martinez Ortiz, U., Acerbi, M., Corcuera, J., Eds.; Fundación Vida Silvestre Argentina: Buenos Aires, Argentina, 2005; pp. 53–61. [Google Scholar]
  35. Minetti, J.L.; Bobba, M.E.; Hernández, C. Régimen espacial de temperaturas en el Noroeste de Argentina. In El Clima del Noroeste Argentino; Minetti, J.L., Ed.; Laboratorio Climatológico Sudamericano (LCS), Editorial Magna: Tucuman, Argentina, 2012; pp. 141–161. [Google Scholar]
  36. Morello, J.; Matteucci, S.D.; Rodríguez, A.F.; Silva, M. Ecorregiones y Complejos Ecosistémicos Argentinos, 1st ed.; Orientacion Gráfica Editora: Buenos Aires, Argentina, 2012. [Google Scholar]
  37. Kinzey, W.G. Distribution of primates and forest refuges. In Biological diversification in the Tropics; Prance, G.T., Ed.; Columbia University Press: New York, NY, USA, 1982; pp. 455–482. [Google Scholar]
  38. Agostini, I.; Holzmann, I.; Oklander, L.I.; Peker, S.M.; Pavé, R.; Kowalewski, M.M. Alouatta guariba. In Categorización del Estado de Conservación de Los Mamíferos de Argentina 2019; Lista Roja de Los Mamíferos de Argentina; SaydS, S., Ed.; SAREM: Buenos Aires, Argentina, 2019; Available online: http://cma.sarem.org.ar/es/especie-nativa/alouatta-guariba (accessed on 1 March 2020).
  39. Agostini, I.; Holzmann, I.; Di Bitetti, M.S. The brown howler monkey (Alouatta guariba clamitans) in Argentina: Current status, threats and conservation challenges. In Primatology in Argentina; Kowalewski, M.M., Oklander, L.I., Eds.; SAREM Series A—Mammalogical Research; SAREM: Buenos Aires, Argentina, 2017; Volume 2, pp. 235–254. ISBN 9789879849774. [Google Scholar]
  40. Oklander, L.I.; Buss, G.; Biccamarques, J.C.; Hirano, Z.B.; Chaves, Ó.M.; Assis Jardim, M.M.; Valença-Montenegro, M.M.; Mendes, S.L.; Neves, L.G.; Kowalewski, M.; et al. Brown howler monkey Alouatta guariba (Humboldt, 1812). In Primates in Peril: The World’s 25 Most Endangered Primates 2022–2023; Mittermeier, R.A., Reuter, K.E., Rylands, A.B., Jerusalinsky, L., Schwitzer, C., Strier, K.B., Ratszimbazafy, J., Humle, T., Eds.; IUCN SSC Primate Specialist Group, International Primatological Society, Re:wild: Washington, DC, USA, 2022; pp. 121–125. [Google Scholar]
  41. Jerusalinsky, L.; Bicca-Marques, J.C.; Neves, L.G.; Alves, S.L.; Ingberman, B.; Buss, G.; Fries, B.G.; Alonso, A.C.; da Cunha, R.G.T.; Miranda, J.M.D.; et al. Alouatta guariba (Brown Howler Monkey)-(amended version of 2020 assessment). In The IUCN Red List of Threatened Species 2021; International Union for Conservation of Nature and Natural Resources: Glenn, Switzerland, 2021; p. e.T39916A190417874. [Google Scholar]
  42. Agostini, I.; Holzmann, I.; Di Bitetti, M.S. Ranging patterns of two syntopic howler monkey species (Alouatta guariba and A. caraya) in Northeastern Argentina. Int. J. Primatol. 2010, 31, 363–381. [Google Scholar] [CrossRef]
  43. Agostini, I.; Pizzio, E.; De Angelo, C.; Di Bitetti, M.S. Population status of primates in the Atlantic Forest of Argentina. Int. J. Primatol. 2015, 36, 244–258. [Google Scholar] [CrossRef]
  44. Bicca-Marques, J.C.; Rumiz, D.I.; Ludwig, G.; Rímoli, J.; Martins, V.; da Cunha, R.G.T.; Alves, S.L.; Valle, R.R.; Miranda, J.M.D.; Jerusalinsky, L.; et al. Alouatta caraya (Black-and-gold howler monkey)-(amended version of 2020 assessment). In The IUCN Red List of Threatened Species 2021; International Union for Conservation of Nature and Natural Resources: Glenn, Switzerland, 2021; p. e.T41545A190414715. [Google Scholar]
  45. Kowalewski, M.M.; Pavé, R.; Fernández, V.A.; Raño, M.; Zunino, G.E. Life-history traits and group dynamic in black and gold howler monkeys in flooded forests of northern Argentina. In Primates in Flooded Habitats: Ecology and Conservation; Nowak, K., Barnett, A., Matsuda, I., Eds.; Cambridge University Press: Cambridge, UK, 2019; pp. 263–269. ISBN 9781107134317. [Google Scholar]
  46. Juárez, C.P.; Dvoskin, R.; Fernandez-Duque, E. Structure and composition of wild black howler troops (Alouatta caraya) in gallery forests of the Argentinean Chaco. Neotrop. Primates 2005, 13, 19–22. [Google Scholar] [CrossRef]
  47. Fernandez-Duque, E.; Juárez, C.P.; Defler, T. Distribution, systematics and taxonomy. In Owl Monkeys: Biology, Adaptive Radiation, and Behavioral Ecology of the Only Nocturnal Primate in the Americas; Fernandez-Duque, E., Ed.; Springer: Berlin/Heidelberg, Germany, 2023. [Google Scholar]
  48. Fernandez-Duque, E.; Rotundo, M.; Sloan, C. Density and population structure of owl monkeys (Aotus azarai) in the Argentinean chaco. Am. J. Primatol. 2001, 53, 99–108. [Google Scholar] [CrossRef]
  49. Rímoli, J.; Pinto, T.; Romero-Valenzuela, D.; Rumiz, D.I.; Lynch Alfaro, J.W.; Ravetta, A.L. Aotus azarae (Azara’s night monkey) -(amended version of 2018 assessment). In The IUCN Red List of Threatened Species 2021; International Union for Conservation of Nature and Natural Resources: Glenn, Switzerland, 2021; p. e.T41539A190450485. [Google Scholar]
  50. Briggs, E.; Rotundo, M.; Dávalos, V.; García de la Chica, A.; Fernández-Duque, E. Aotus azarae. In Categorización 2019 de los Mamíferos de Argentina Según su Riesgo de Extinción; Lista Roja de los Mamíferos de Argentina; Sayds, S., Ed.; SAREM: Buenos Aires, Argentina, 2019; Available online: http://cma.sarem.org.ar/es/especie-nativa/aotus-azarae (accessed on 1 March 2020).
  51. Fernandez-Duque, E.; Huck, M.; Van Belle, S.; Di Fiore, A. The evolution of pair-living, sexual monogamy, and cooperative infant care: Insights from research on wild owl monkeys, titis, sakis, and tamarins. Am. J. Phys. Anthr. 2020, 171, 118–173. [Google Scholar] [CrossRef]
  52. Zunino, G.E.; Galliari, C.A.; Colillas, O.J. Distribución y conservación del mirikiná (Aotus azarae) en Argentina: Resultados preliminares. In A Primatologia no Brasil 2; De Mello, M.T., Ed.; Sociedade Brasileira dePrimatologia: Brasília, Brazil, 1985; pp. 305–316. [Google Scholar]
  53. Tujague, M.P.; Agostini, I.; Oklander, L.; Peker, S.; Pfoh, R.; Baldovino, M.C.; Nieves, M.; Apellaniz, M. Sapajus nigritus. In Categorización del Estado de Conservación de los Mamíferos de Argentina 2019; Lista Roja de los Mamíferos de Argentina; SaydS, S., Ed.; SAREM: Buenos Aires, Argentina, 2019; Available online: http://cma.sarem.org.ar/es/especie-nativa/sapajus-nigritus (accessed on 1 March 2020).
  54. Ludwig, G.; de Melo, F.R.; Martins, W.P.; Miranda, J.M.D.; Lynch Alfaro, J.W.; Alonso, A.C.; dos Santos, M.C.; Rímoli, J. Sapajus nigritus (Black-horned capuchin)-(amended version of 2021 assessment). In The IUCN Red List of Threatened Species 2022; International Union for Conservation of Nature and Natural Resources: Glenn, Switzerland, 2022; p. e.T136717A210336199. [Google Scholar]
  55. Di Bitetti, M.; Kowalewski, M.; Lynch Alfaro, J.; Rylands, A.B. Sapajus nigritus ssp. cucullatus (Southern black-horned capuchin). In The IUCN Red List of Threatened Species 2020; International Union for Conservation of Nature and Natural Resources: Glenn, Switzerland, 2020; p. e.T160945956A160945959. [Google Scholar]
  56. Janson, C.; Baldovino, M.C.; Di Bitetti, M. The group life cycle and demography of brown capuchin monkeys (Cebus [apella] nigritus) in Iguazú National Park, Argentina. In Long-Term Field Studies of Primates; International Union for Conservation of Nature and Natural Resources; Kappeler, P.M., Watts, D.P., Eds.; Springer: Berlin/Heidelberg, Germany, 2012; pp. 185–212. ISBN 9783642225130. [Google Scholar]
  57. Di Bitetti, M.S. Home-range use by the tufted capuchin monkey (Cebus apella nigritus) in a subtropical rainforest of Argentina. J. Zool. 2001, 253, 33–45. [Google Scholar] [CrossRef]
  58. Rímoli, J.; Smith, L.; Ludwig, G.; Martinez, M.; Kowalewski, M.; Melo, R.; Lynch, W. Sapajus cay (Azara’s capuchin). In The IUCN Red List of Threatened Species 2022; International Union for Conservation of Nature and Natural Resources: Glenn, Switzerland, 2022; Volume 35, p. e.T136366A215548623. [Google Scholar]
  59. Nieves, M.; Peker, S.; Tujague, M.P.; Kowalewski, M.; Pavé, R.; Agostini, I.; Alcalde, A.S.; Albanesi, S.; de Bustos, S.; Jayat, J.P.; et al. Sapajus cay. In Categorización del Estado de Conservación de los Mamíferos de Argentina 2019; Lista Roja de los Mamíferos de Argentina; SaydS, S., Ed.; SAREM: Buenos Aires, Argentina, 2019; Available online: http://cma.sarem.org.ar/es/especie-nativa/sapajus-cay (accessed on 1 March 2020).
  60. Brown, A.D.; Zunino, G.E. Dietary variability in Cebus apella in extreme habitats: Evidence for adaptability. Folia Primatol. 1990, 54, 187–195. [Google Scholar] [CrossRef]
  61. Calixto-Pérez, E.; Alarcón-Guerrero, J.; Ramos-Fernández, G.; Dias, P.A.D.; Rangel-Negrín, A.; Améndola-Pimenta, M.; Domingo, C.; Arroyo-Rodríguez, V.; Pozo-Montuy, G.; Pinacho-Guendulain, B.; et al. Integrating expert knowledge and ecological niche models to estimate Mexican primates’ distribution. Primates 2018, 59, 451–467. [Google Scholar] [CrossRef]
  62. Kareksela, S.; Aapala, K.; Alanen, A.; Haapalehto, T.; Kotiaho, J.; Lehtomäki, J.; Leikola, N.; Mikkonen, N.; Moilanen, A.; Nieminen, E.; et al. Combining spatial prioritization and expert knowledge facilitates effectiveness of large-scale mire protection process in Finland. Biol. Conserv. 2019, 241, 108324. [Google Scholar] [CrossRef]
  63. Sánchez-Fernández, D.; Lobo, J.M.; Hernández-Manrique, O.L. Species distribution models that do not incorporate global data misrepresent potential distributions: A case study using Iberian diving beetles. Divers. Distrib. 2010, 17, 163–171. [Google Scholar] [CrossRef]
  64. Culot, L.; Pereira, L.A.; Agostini, I.; de Almeida, M.A.B.; Alves, R.S.C.; Aximoff, I.; Bager, A.; Baldovino, M.C.; Bella, T.R.; Bicca-Marques, J.C.; et al. ATLANTIC-PRIMATES: A dataset of communities and occurrences of primates in the Atlantic Forests of South America. Ecology 2018, 100, e02525. [Google Scholar] [CrossRef] [PubMed] [Green Version]
  65. Mccarthy, K.P.; Jr., R.J.F.; Rota, C.T.; Hutto, R.L. Predicting species distributions from samples collected along roadsides. Conserv. Biol. 2011, 26, 68–77. [Google Scholar] [CrossRef] [PubMed]
  66. Varela, S.; Anderson, R.P.; García-Valdés, R.; Fernández González, F. Environmental filters reduce the effects of sampling bias and improve predictions of ecological niche models. Ecography 2014, 37, 1084–1091. [Google Scholar] [CrossRef]
  67. Aiello-Lammens, M.E.; Boria, R.A.; Radosavljevic, A.; Vilela, B.; Anderson, R.P. spThin: An R package for spatial thinning of species occurrence records for use in ecological niche models. Ecography 2015, 38, 541–545. [Google Scholar] [CrossRef]
  68. Karger, D.N.; Conrad, O.; Böhner, J.; Kawohl, T.; Kreft, H.; Soria-Auza, R.W.; Zimmermann, N.E.; Linder, H.P.; Kessler, M. Climatologies at high resolution for the earth’s land surface areas. Sci. Data 2017, 4, 170122. [Google Scholar] [CrossRef] [Green Version]
  69. De Marco, P.; Nóbrega, C.C. Evaluating collinearity effects on species distribution models: An approach based on virtual species simulation. PLoS ONE 2018, 13, e0202403. [Google Scholar] [CrossRef]
  70. Messager, M.L.; Lehner, B.; Grill, G.; Nedeva, I.; Schmitt, O. Estimating the volume and age of water stored in global lakes using a geo-statistical approach. Nat. Commun. 2016, 7, 13603. [Google Scholar] [CrossRef]
  71. Lehner, B.; Grill, G. Global river hydrography and network routing: Baseline data and new approaches to study the world’s large river systems. Hydrol. Process. 2013, 27, 2171–2186. [Google Scholar] [CrossRef]
  72. Thuiller, W.; Guéguen, M.; Renaud, J.; Karger, D.N.; Zimmermann, N.E. Uncertainty in ensembles of global biodiversity scenarios. Nat. Commun. 2019, 10, 1446. [Google Scholar] [CrossRef] [Green Version]
  73. Qiao, H.; Soberón, J.; Peterson, A.T. No silver bullets in correlative ecological niche modelling: Insights from testing among many potential algorithms for niche estimation. Methods Ecol. Evol. 2015, 6, 1126–1136. [Google Scholar] [CrossRef] [Green Version]
  74. Phillips, S.J.; Anderson, R.P.; Dudík, M.; Schapire, R.E.; Blair, M.E. Opening the black box: An open-source release of Maxent. Ecography 2017, 40, 887–893. [Google Scholar] [CrossRef]
  75. Liaw, A.; Wiener, M. Classification and Regression by randomForest. R News 2002, 2, 18–22. [Google Scholar]
  76. Karatzoglou, A.; Smola, A.; Hornik, K.; Zeileis, A. kernlab- AnS4Package for Kernel Methods inR. J. Stat. Softw. 2004, 11, 1–20. [Google Scholar] [CrossRef] [Green Version]
  77. Barbet-Massin, M.; Jiguet, F.; Albert, C.H.; Thuiller, W. Selecting pseudo-absences for species distribution models: How, where and how many? Methods Ecol. Evol. 2012, 3, 327–338. [Google Scholar] [CrossRef]
  78. Allouche, O.; Tsoar, A.; Kadmon, R. Assessing the accuracy of species distribution models: Prevalence, kappa and the true skill statistic (TSS). J. Appl. Ecol. 2006, 43, 1223–1232. [Google Scholar] [CrossRef]
  79. Leroy, B.; Delsol, R.; Hugueny, B.; Meynard, C.N.; Barhoumi, C.; Barbet-Massin, M.; Bellard, C. Without quality presence-absence data, discrimination metrics such as TSS can be misleading measures of model performance. J. Biogeogr. 2018, 45, 1994–2002. [Google Scholar] [CrossRef]
  80. Zhu, G.-P.; Peterson, A.T. Do consensus models outperform individual models? Transferability evaluations of diverse modeling approaches for an invasive moth. Biol. Invasions 2017, 19, 2519–2532. [Google Scholar] [CrossRef]
  81. De Andrade, A.F.A.; Velazco, S.J.E.; Júnior, P.D.M. ENMTML: An R package for a straightforward construction of complex ecological niche models. Environ. Model. Softw. 2020, 125, 104615. [Google Scholar] [CrossRef]
  82. Soberon, J.; Peterson, A.T. Interpretation of models of fundamental ecological niches and species’ distributional areas. Biodivers. Inform. 2005, 2, 10. [Google Scholar] [CrossRef] [Green Version]
  83. Velazco, S.J.E.; Ribeiro, B.R.; Laureto, L.M.O.; Júnior, P.D.M. Overprediction of species distribution models in conservation planning: A still neglected issue with strong effects. Biol. Conserv. 2020, 252, 108822. [Google Scholar] [CrossRef]
  84. Fortes, V.B.; Bicca-Marques, J.C.; Urbani, B.; Fernández, V.A.; Pereira, T.d.S. Ranging behavior and spatial cognition of howler monkeys. In Howler Monkeys, Developments in Primatology: Progress and Prospects; Kowalewski, M., Garber, P., Cortés-Ortiz, L., Urbani, B., Youlatos, D., Eds.; Springer Science+Business Media: New York, NY, USA, 2015; pp. 219–255. [Google Scholar]
  85. Wartmann, F.M.; Juárez, C.P.; Fernandez-Duque, E. Size, site fidelity, and overlap of home ranges and core areas in the socially monogamous owl monkey (Aotus azarae) of Northern Argentina. Int. J. Primatol. 2014, 35, 919–939. [Google Scholar] [CrossRef] [Green Version]
  86. Moilanen, A.; Pouzols, F.M.; Meller, L.; Veach, V.; Arponen, A.; Leppänen, J.; Kujala, H. Zonation Version 4 User Manual; C-BIG Conservation Biology Informatics Group, Department of Biosciences, University of Helsinki: Helsinki, Finland, 2014. [Google Scholar]
  87. Moilanen, A.; Anderson, B.J.; Eigenbrod, F.; Heinemeyer, A.; Roy, D.B.; Gillings, S.; Armsworth, P.R.; Gaston, K.J.; Thomas, C.D. Balancing alternative land uses in conservation prioritization. Ecol. Appl. 2011, 21, 1419–1426. [Google Scholar] [CrossRef] [PubMed]
  88. Moilanen, A.; Franco, A.M.A.; Early, R.I.; Fox, R.; Wintle, B.; Thomas, C.D.; Moilanen, A.; Franco, A.M.A.; Early, R.I.; Fox, R.; et al. Prioritizing multiple-use landscapes for conservation: Methods for large multi-species planning problems. Proc. R. Soc. B: Boil. Sci. 2005, 272, 1885–1891. [Google Scholar] [CrossRef] [PubMed] [Green Version]
  89. Pouzols, F.M.; Moilanen, A. A method for building corridors in spatial conservation prioritization. Landsc. Ecol. 2014, 29, 789–801. [Google Scholar] [CrossRef]
  90. Zunino, G.E.; Kowalewski, M.M.; Oklander, L.I.; González, V. Habitat fragmentation and population size of the black and gold howler monkey (Alouatta caraya) in a semideciduous forest in Northern Argentina. Am. J. Primatol. 2007, 69, 966–975. [Google Scholar] [CrossRef]
  91. Fahrig, L. Effects of habitat fragmentation on biodiversity. Annu. Rev. Ecol. Evol. Syst. 2003, 34, 487–515. [Google Scholar] [CrossRef] [Green Version]
  92. Da Silva, L.G.; Ribeiro, M.C.; Hasui, E.; da Costa, C.A.; da Cunha, R.G.T. Patch size, functional isolation, visibility and matrix permeability influences neotropical primate occurrence within highly fragmented landscapes. PLoS ONE 2015, 10, e0114025. [Google Scholar] [CrossRef] [Green Version]
  93. Duque, F. Natal dispersal in monogamous owl monkeys (Aotus azarai) of the Argentinean Chaco. Behaviour 2009, 146, 583–606. [Google Scholar] [CrossRef]
  94. Raño, M.; Kowalewski, M.M.; Cerezo, A.M.; Garber, P.A. Determinants of daily path length in black and gold howler monkeys (Alouatta caraya) in northeastern Argentina. Am. J. Primatol. 2016, 78, 825–837. [Google Scholar] [CrossRef]
  95. Mikkonen, N.; Moilanen, A. Identification of top priority areas and management landscapes from a national Natura 2000 network. Environ. Sci. Policy 2013, 27, 11–20. [Google Scholar] [CrossRef] [Green Version]
  96. CBD First Draft of the Post-2020 Global Biodiversity Framework CBD/WG2020/3/3. 5 July 2021. Available online: https://www.cbd.int/doc/c/abb5/591f/2e46096d3f0330b08ce87a45/wg2020-03-03-en.pdf (accessed on 19 October 2022).
  97. Moilanen, A.; Wintle, B.A.; Elith, J.; Burgman, M. Uncertainty Analysis for Regional-Scale Reserve Selection. Conserv. Biol. 2006, 20, 1688–1697. [Google Scholar] [CrossRef] [PubMed]
  98. Di Bitetti, M.S. Primates bark-stripping trees in forest plantations—A review. For. Ecol. Manag. 2019, 449, 117482. [Google Scholar] [CrossRef]
  99. Cowling, R.; Pressey, R.; Sims-Castley, R.; le Roux, A.; Baard, E.; Burgers, C.; Palmer, G. The expert or the algorithm?—Comparison of priority conservation areas in the Cape Floristic Region identified by park managers and reserve selection software. Biol. Conserv. 2003, 112, 147–167. [Google Scholar] [CrossRef]
  100. Fernández-Duque, F.; Huck, M.; Dávalos, V.; Fernández-Duque, E. Estudio preliminar sobre la ecología, el comportamiento y la demografía del muitú (Crax fasciolata) en la selva en galería del Riacho Pilagá, Formosa, Argentina. Hornero 2013, 28, 65–74. [Google Scholar]
  101. Smichowski, H.; del Rosario Montiel, M.; Romero, V.; Kowalewski, M.; Contreras, F.I. Evaluación de incendios en áreas periurbanas de la ciudad de Corrientes (Argentina) durante el año 2020. Papeles Geogr. 2021, 67, 151–167. [Google Scholar] [CrossRef]
  102. Estrada, A.; Garber, P.A.; Rylands, A.B.; Roos, C.; Fernandez-Duque, E.; Di Fiore, A.; Nekaris, K.A.-I.; Nijman, V.; Heymann, E.W.; Lambert, J.E.; et al. Impending extinction crisis of the world’s primates: Why primates matter. Sci. Adv. 2017, 3, e1600946. [Google Scholar] [CrossRef] [Green Version]
  103. Sánchez-Murillo, F.; Arguedas, R. Blood analytes of electrocuted mantled howler monkeys (Alouatta palliata) in the Nicoya peninsula of Costa Rica. J. Med. Primatol. 2021, 50, 231–239. [Google Scholar] [CrossRef]
  104. Pozo-Montuy, G.; Bonilla-Sánchez, Y.M. Population decline of an endangered primate resulting from the impact of a road in the Catazajá wetlands, Chiapas, México. Therya Notes 2022, 3, 75–81. [Google Scholar] [CrossRef]
  105. Tomas, W.M.; Berlinck, C.N.; Chiaravalloti, R.M.; Faggioni, G.P.; Strüssmann, C.; Libonati, R.; Abrahão, C.R.; Alvarenga, G.D.V.; Bacellar, A.E.D.F.; Batista, F.R.D.Q.; et al. Distance sampling surveys reveal 17 million vertebrates directly killed by the 2020’s wildfires in the Pantanal, Brazil. Sci. Rep. 2021, 11, 1–8. [Google Scholar] [CrossRef]
  106. Di Bitetti, M.S.; Mata, J.; Svenning, J.-C. Exotic mammals and rewilding in the Neotropics. Mastozoología Neotrop. 2022, 29, 001–015. [Google Scholar] [CrossRef]
  107. Di Bitetti, M.S.; De Angelo, C.; Paviolo, A.; Di Giacomo, A.S.; Varela, D.; Giraudo, A.R. Argentina: Wildfires jeopardize rewilding. Nature 2022, 604, 246. [Google Scholar] [CrossRef] [PubMed]
  108. Agostini, I.; Holzmann, I.; Di Bitetti, M.S.; Oklander, L.I.; Kowalewski, M.M.; Beldomnico, P.M.; Goenaga, S.; Martínez, M.; Moreno, E.S.; Lestani, E.; et al. Building a species conservation strategy for the brown howler monkey (Alouatta guariba clamitans) in Argentina in the context of yellow fever outbreaks. Trop. Conserv. Sci. 2014, 7, 25–34. [Google Scholar] [CrossRef]
  109. Moreno, E.S.; Agostini, I.; Holzmann, I.; Di Bitetti, M.S.; Oklander, L.I.; Kowalewski, M.M.; Beldomenico, P.M.; Goenaga, S.; Martínez, M.; Lestani, E.; et al. Yellow fever impact on brown howler monkeys (Alouatta guariba clamitans) in Argentina: A metamodelling approach based on population viability analysis and epidemiological dynamics. Mem. Inst. Oswaldo Cruz 2015, 110, 865–876. [Google Scholar] [CrossRef] [PubMed] [Green Version]
  110. Hill, C.M. Primate crop feeding behavior, crop protection, and conservation. Int. J. Primatol. 2017, 38, 385–400. [Google Scholar] [CrossRef]
  111. Spagnoletti, N.; Cardoso, T.C.M.; Fragaszy, D.; Izar, P. Coexistence between humans and capuchins (Sapajus libidinosus): Comparing observational data with farmers’ perceptions of crop losses. Int. J. Primatol. 2016, 38, 243–262. [Google Scholar] [CrossRef]
  112. Corley, M.; Fernandez-Duque, E. Dispersal: A critical life-history stage influencing populations, social dynamics, and individual fitness. In Owl Monkeys: Biology, Adaptive Radiation, and Behavioral Ecology of the Only Nocturnal Primate in the Americas; Fernandez-Duque, E., Ed.; Springer: Berlin/Heidelberg, Germany, 2023. [Google Scholar]
  113. Gorostiaga, N.; Zamboni, L.P.; Cerezo, A.; Pavé, R. Influencia de los atributos del paisaje en la ocupación de parches de bosque y en la demografía de Alouatta caraya en un ambiente fragmentado del noreste de Argentina. Rev. Mex. Biodivers. 2021, 92, 923475. [Google Scholar] [CrossRef]
  114. Howard, C.; Stephens, P.A.; Pearce-Higgins, J.W.; Gregory, R.D.; Willis, S.G. Improving species distribution models: The value of data on abundance. Methods Ecol. Evol. 2014, 5, 506–513. [Google Scholar] [CrossRef] [Green Version]
  115. Sans, G.H.C.; Aguiar, S.; Vallejos, M.; Paruelo, J.M. Assessing the effectiveness of a land zoning policy in the Dry Chaco. The case of Santiago del Estero, Argentina. Land Use Policy 2017, 70, 313–321. [Google Scholar] [CrossRef]
Figure 1. Species suitability pattern for the five primate species native to Argentina: (a) brown howler monkey (Alouatta guariba), (b) black-and-gold howler monkey (Alouatta caraya), (c) Azara’s owl monkey (Aotus azarae), (d) black-horned capuchin monkey (Sapajus nigritus), and (e) Azara’s capuchin monkey (Sapajus cay). The additional polygons delimiting areas of high population density for (f) A. caraya and (g) A. azarae are reported.
Diversity 14 00982 g001
Figure 2. Prioritization using Zonation under the human-influence scenario (left column) and the unconstrained scenario (right column) for primate species in Argentina (a,b) at a national scale, (c,d), within the Atlantic forest of Misiones, (e,f) within the Chaco, and (g,h) within the Yungas forest. Some of the protected areas mentioned in the text are numbered as follows: (1) Yabotí Biosphere Reserve, (2) El Impenetrable National Park, (3) Baritú National Park, (4) Calilegua National Park, (5) Pizarro National Reserve, (6) El Rey National Park, (7) Iguazú National Park, (8) Iberá National Park, (9) Chaco National Park.
Diversity 14 00982 g002
Figure 3. Performance curves are shown for prioritization at (a,b) national and ecoregional scale. i.e., Atlantic forest (c,d), Chaco (e,f), and Yungas (g,h). These curves represent the relationship between the proportion of the species’ distributional range protected (y-axis, 1.00 = all range protected) and the proportion of the landscape lost for primate species (x-axis, 1.00 = all landscape lost) under the human-influence scenario (i.e., with a human footprint as a cost) (left graphs) and for the unconstrained scenario (i.e., without a human footprint) (right graphs). Gray vertical lines indicate the 1%, 5%, 10%, and 30% of priority areas most important for primate conservation in Argentina.
Diversity 14 00982 g003
Table 1. Percentages of each primate species’ distribution range represented in the protected areas (PA) and within the priority areas according to the different conservation targets (PA + 1%, PA + 5%, PA + 10%, PA + 30%). Values are provided for both scenarios, with a human footprint (human-influence scenario—HIS, in gray) and without a human footprint (unconstrained scenario-US), at national and ecoregional scales.
NationalDistribution (km2)PAPA + 1%PA + 5%PA + 10%PA + 30%
HISA. guariba496212.5%24.3%58.2%80.0%99.7%
A. caraya1649577.7%10.3%17.8%26.1%54.7%
A. azarae499051.3%5.9%17.4%29.3%67.5%
S. nigritus2818914.7%17.4%25.6%34.5%68.0%
S. cay2361114.0%14.0%23.3%34.6%80.4%
USA. guariba496212.5%30.1%75.4%96.1%99.9%
A. caraya1649577.7%10.4%18.2%25.8%53.7%
A. azarae499051.3%5.3%15.8%25.9%66.3%
S. nigritus2818914.7%18.6%30.3%42.1%78.8%
S. cay2361114.0%14.0%23.1%39.0%89.1%
Atlantic Forest
HISA. guariba496213.2%19.9%46.5%71.6%97.9%
A. caraya2707712.5%13.8%19.3%25.5%47.5%
S. nigritus2691815.1%16.7%23.0%30.5%56.0%
USA. guariba496216.3%24.3%52.2%79.8%99.5%
A. caraya2707712.7%14.1%19.6%25.5%48.4%
S. nigritus2691815.5%17.3%23.9%30.9%56.8%
Chaco
HISA. caraya1378805.3%8.1%18.1%28.7%63.5%
A. azarae499051.6%5.6%17.6%31.9%79.5%
USA. caraya1378805.3%8.0%17.5%27.9%63.3%
A. azarae499051.6%6.1%21.7%39.0%85.1%
Yungas
HISS. cay2361115.6%16.7%21.3%27.0%50.5%
USS. cay2361116.7%18.0%23.4%30.0%55.2%
Publisher’s Note: MDPI stays neutral with regard to jurisdictional claims in published maps and institutional affiliations.

