
One Tree at a Time: Restoring Landscape Connectivity through Silvopastoral Systems in Transformed Amazon Landscapes


Abstract
:1. Introduction
2. Materials and Methods
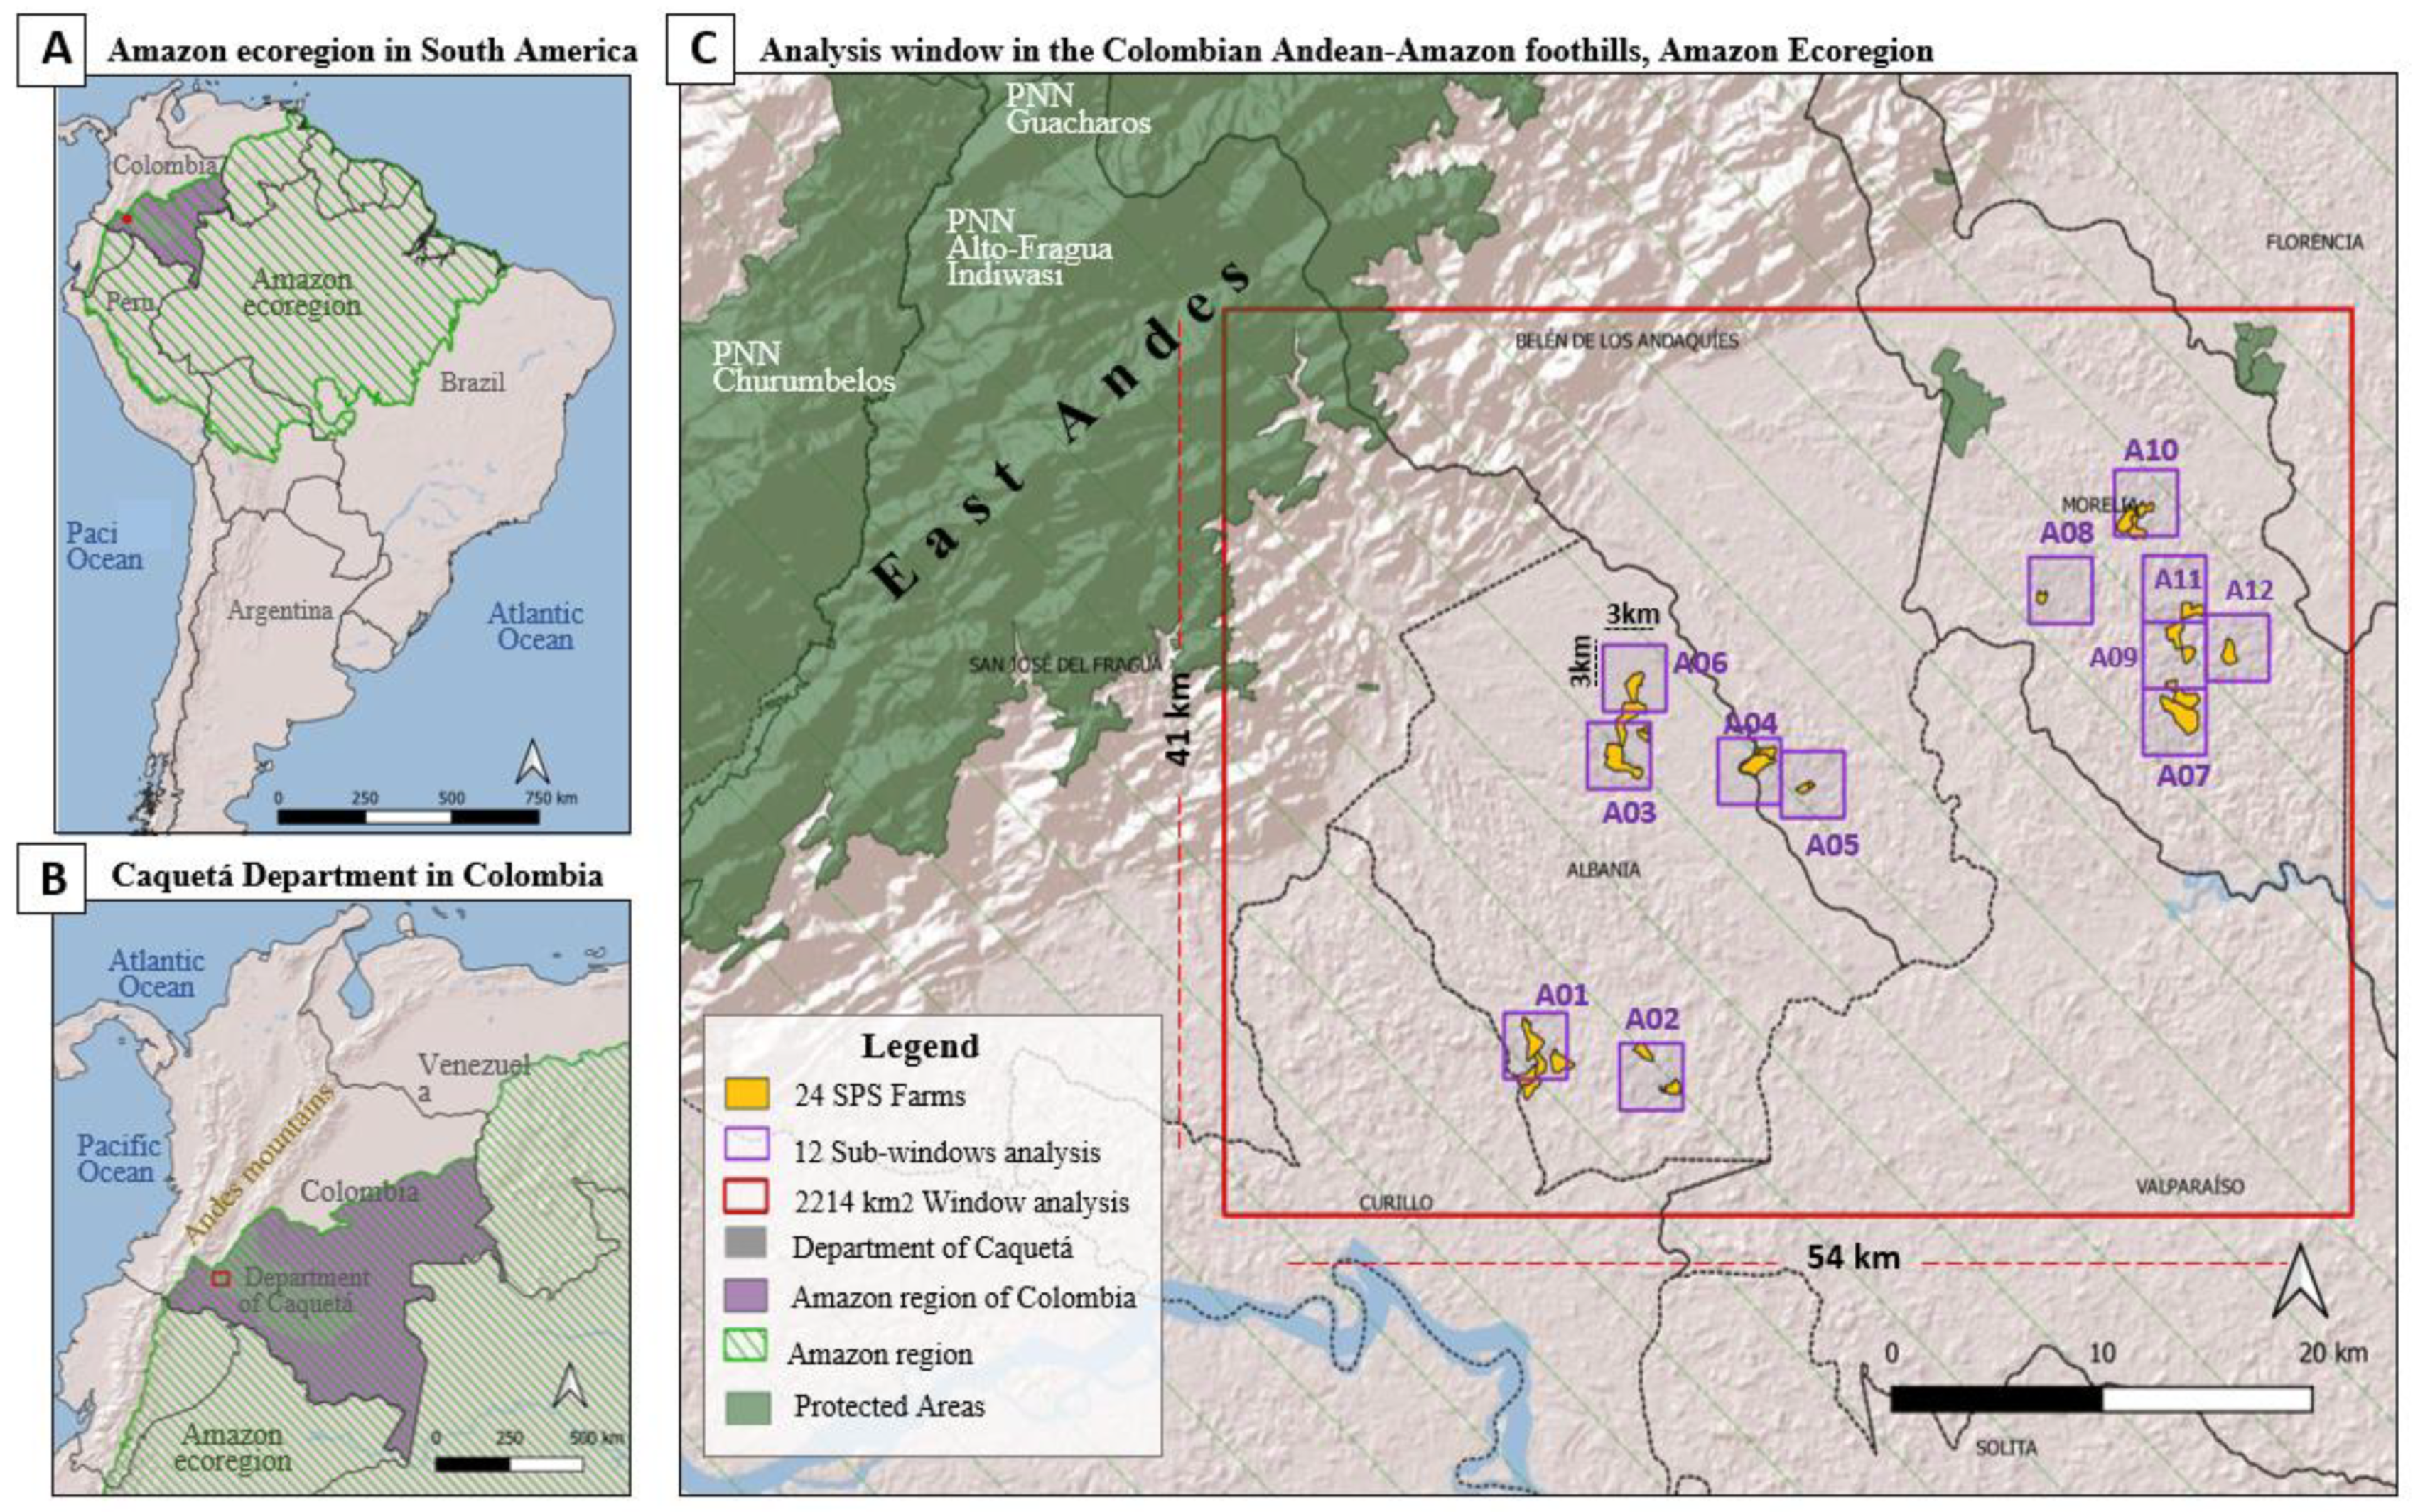
2.1. Study Area
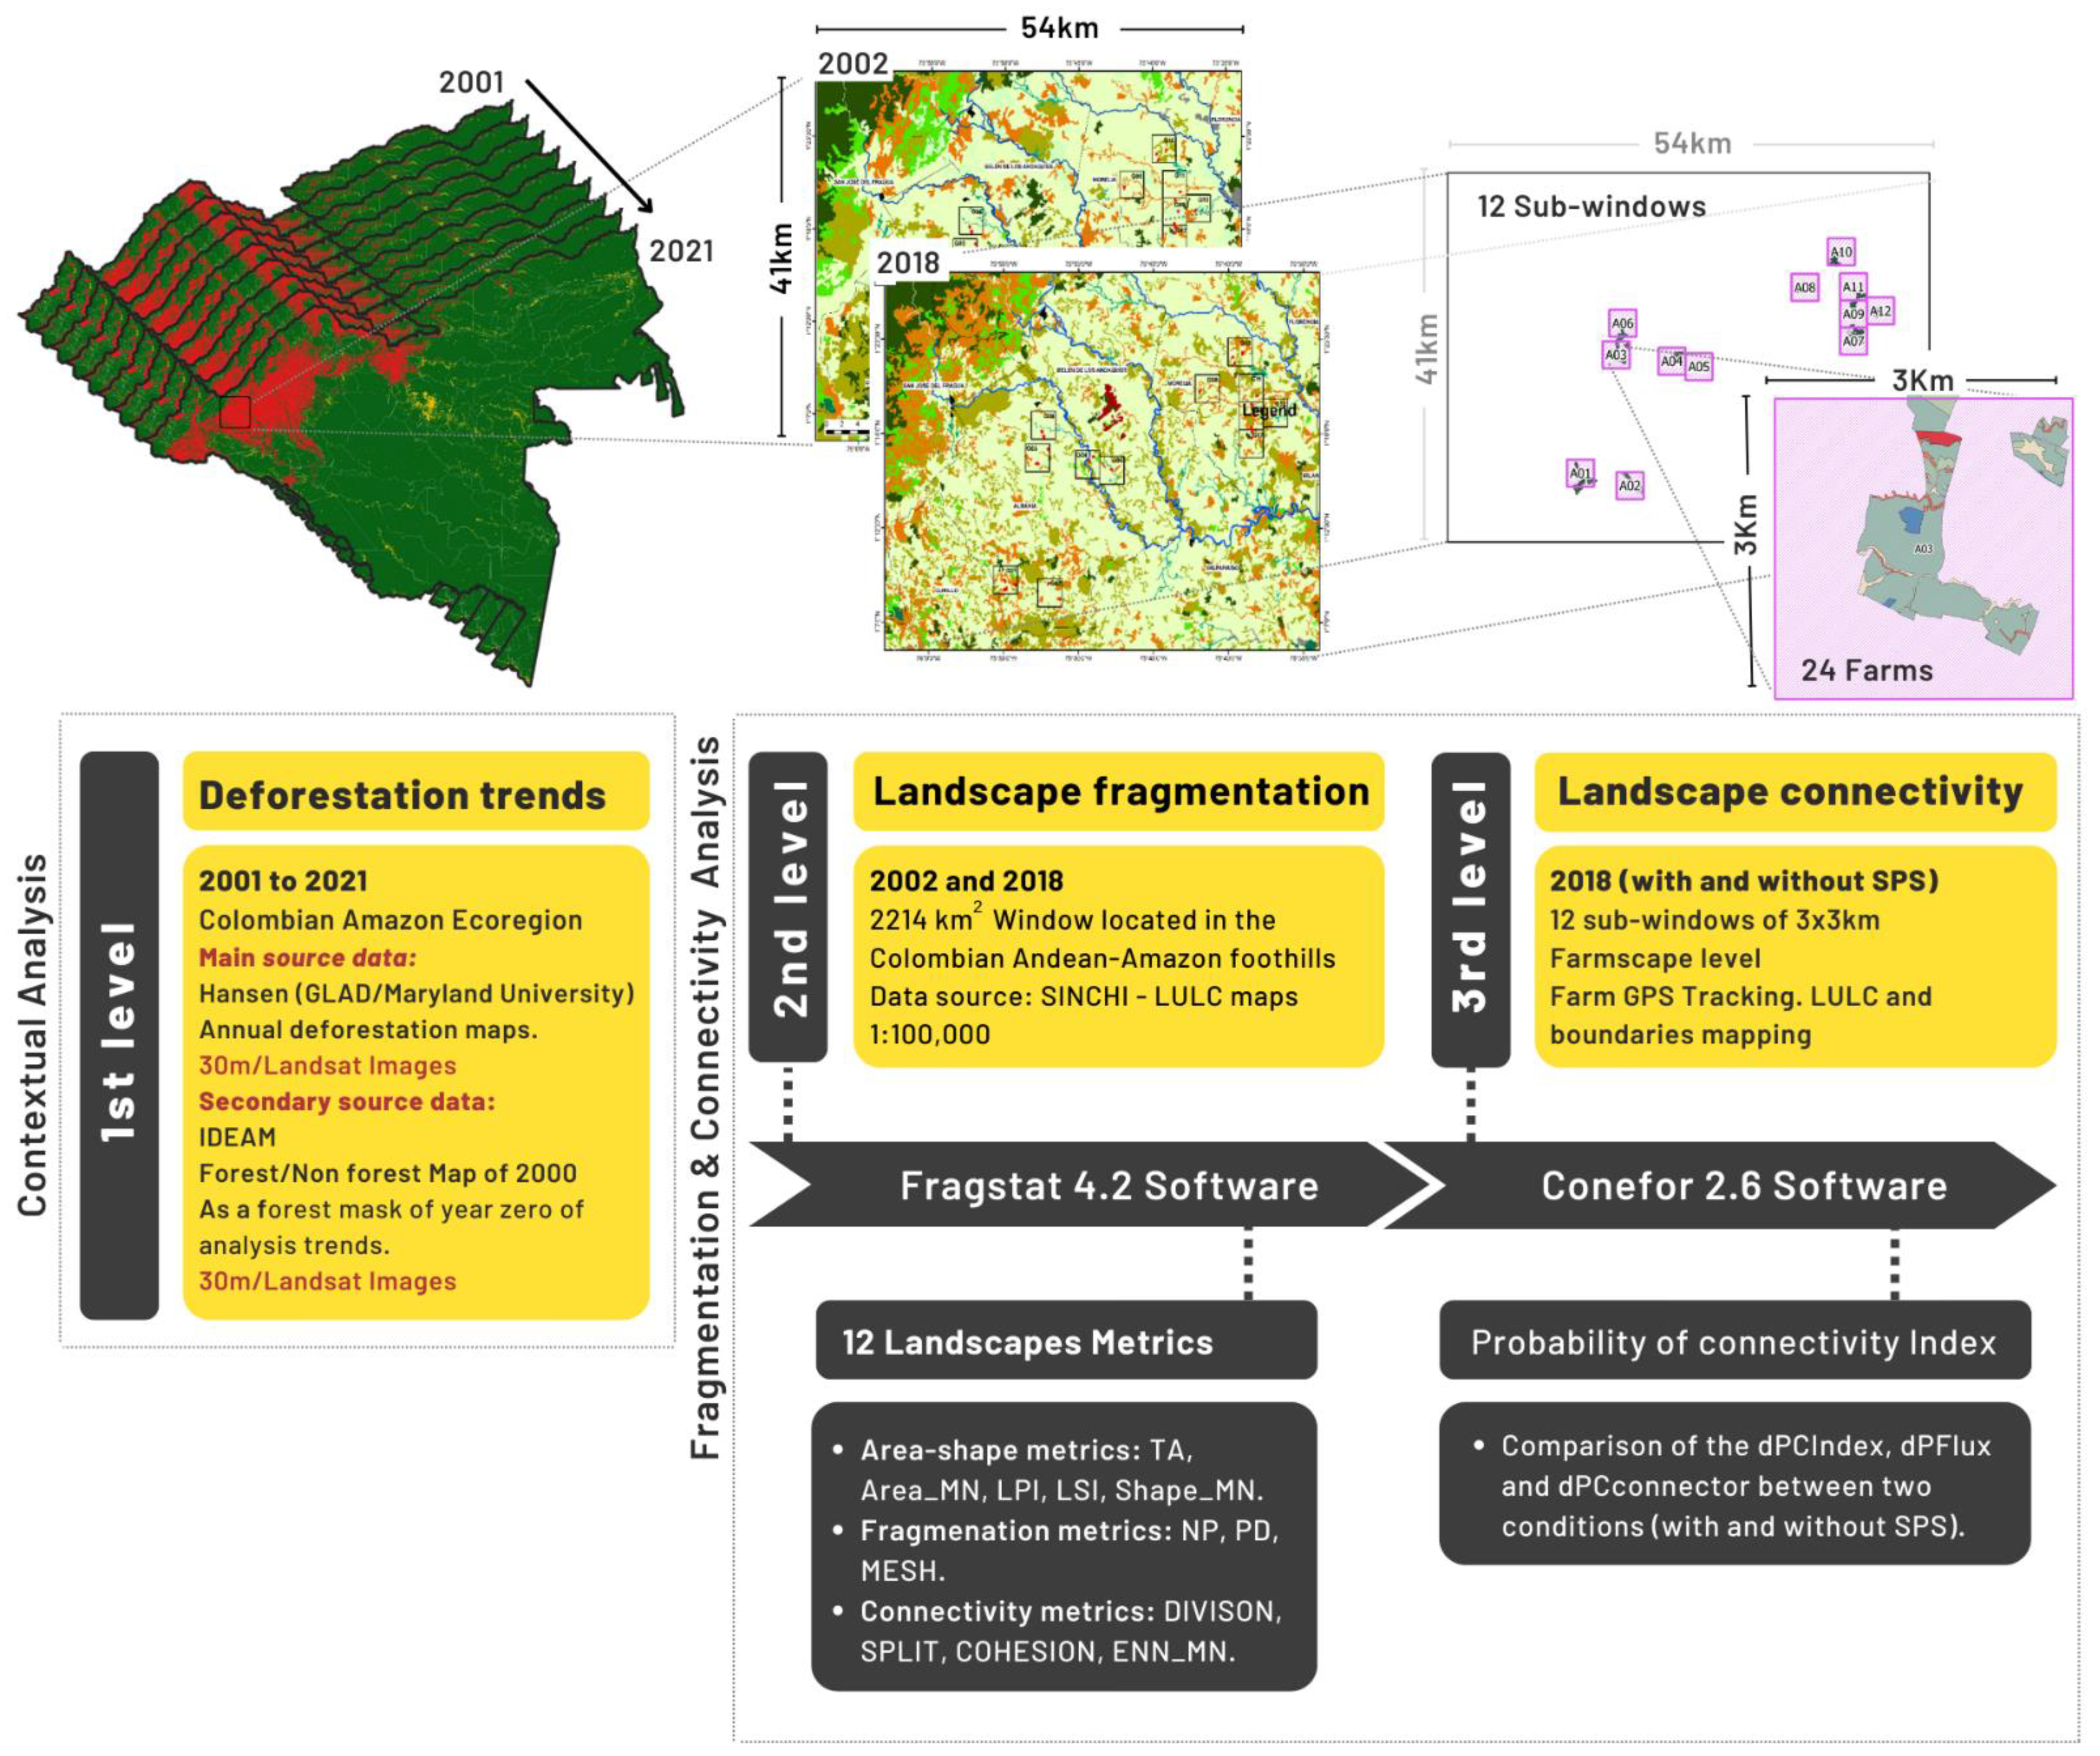
2.2. Methodology
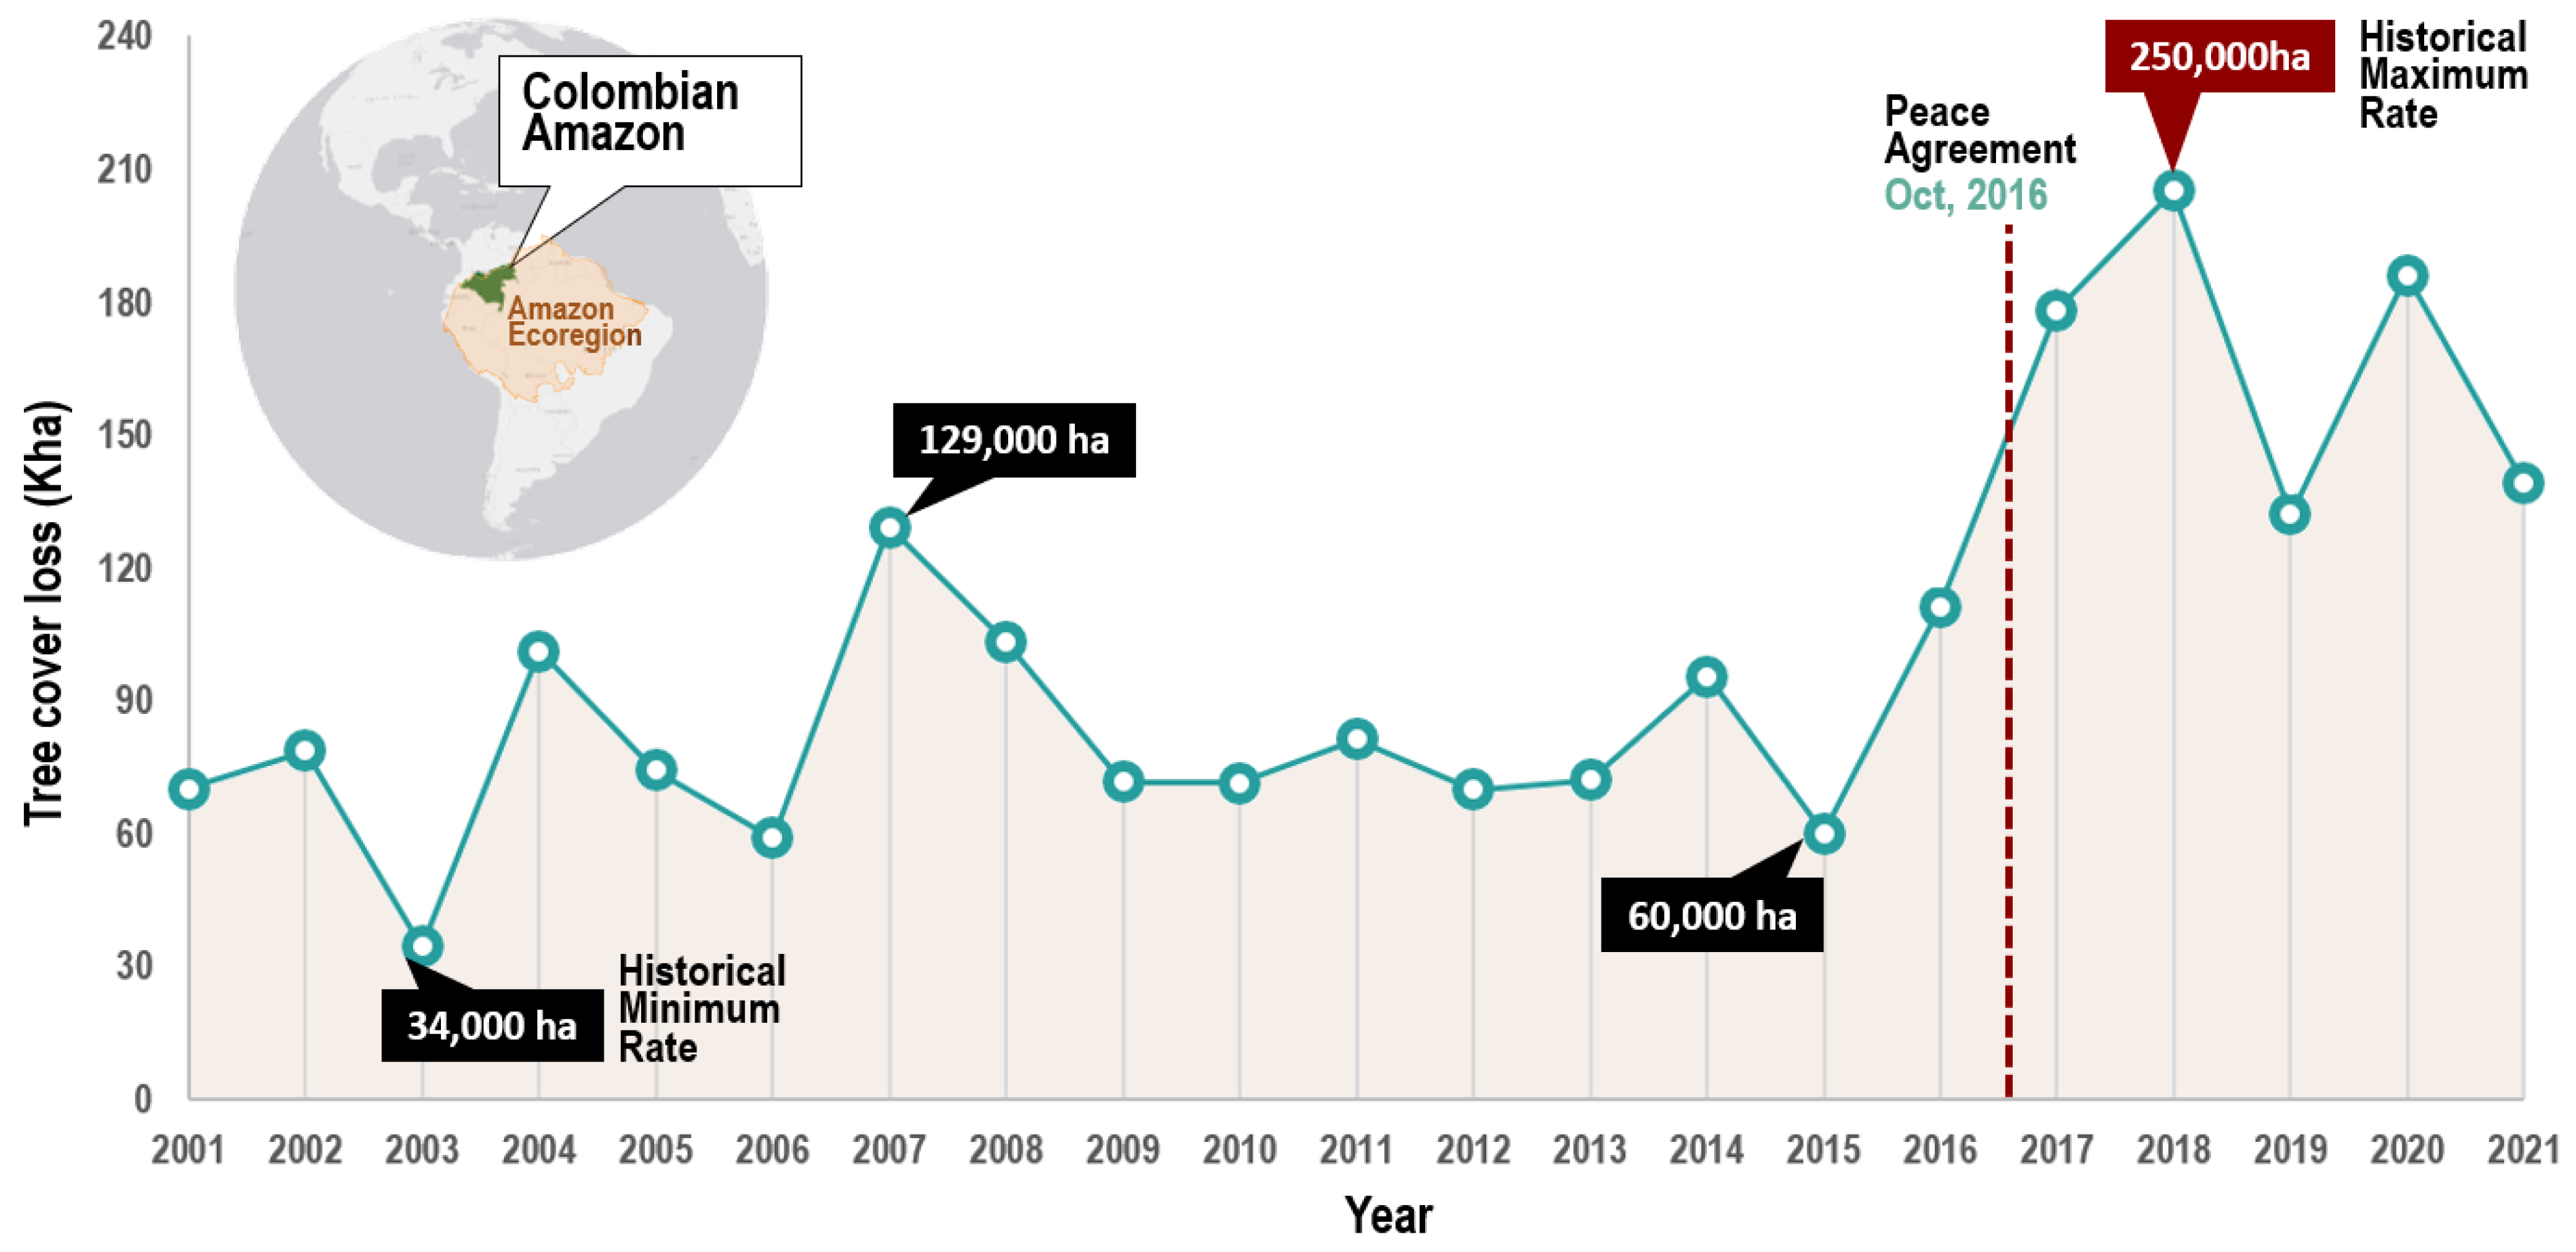
- The first level analysis provides the contextual information about deforestation trends between 2001 and 2021, using the annual maps of deforestation areas for the entire Colombian Amazon ecoregion.
- The second level analysis corresponds to a temporal analysis of the landscape fragmentation, using the land use/land cover maps (LULC) for 2002 and 2018, generated by the Amazonian Institute of Scientific Research (SINCHI) [25,26]. This analysis was carried out on a 2214 km2 window located in the Colombian Andean-Amazon foothills.
- The third level analysis compares the probability of the landscape connectivity in 2018, under two SPS conditions (with and without the implementation of silvopastoral systems). This analysis was carried out at the farm level (here called farmscape) on 12 sub-windows each of 3 × 3 km.
2.2.1. First Level Analysis: Deforestation Trends in the Amazon Ecoregion (2001–2021)
2.2.2. Second Level Analysis: Landscape Fragmentation
- Area-shape metrics: total area (TA), mean patch area (Area_MN), largest patch index (LPI), landscape shape index (LSI), mean shape index (shape_MN).
- Fragmentation metrics: number of patches (NP), patch density (PD), effective mesh size (MESH).
- Connectivity metrics: landscape division index (DIVISION), splitting index (SPLIT), patch cohesion index (COHESION) and Euclidean Nearest Neighbor Distance (ENN_MN).
2.2.3. Third Level: Landscape Connectivity at the Farmscape Level
3. Results
3.1. First Level Analysis: Deforestation Trends in the Amazon Ecoregion (2001–2021)
3.2. Second Level Analysis: Landscape Fragmentation
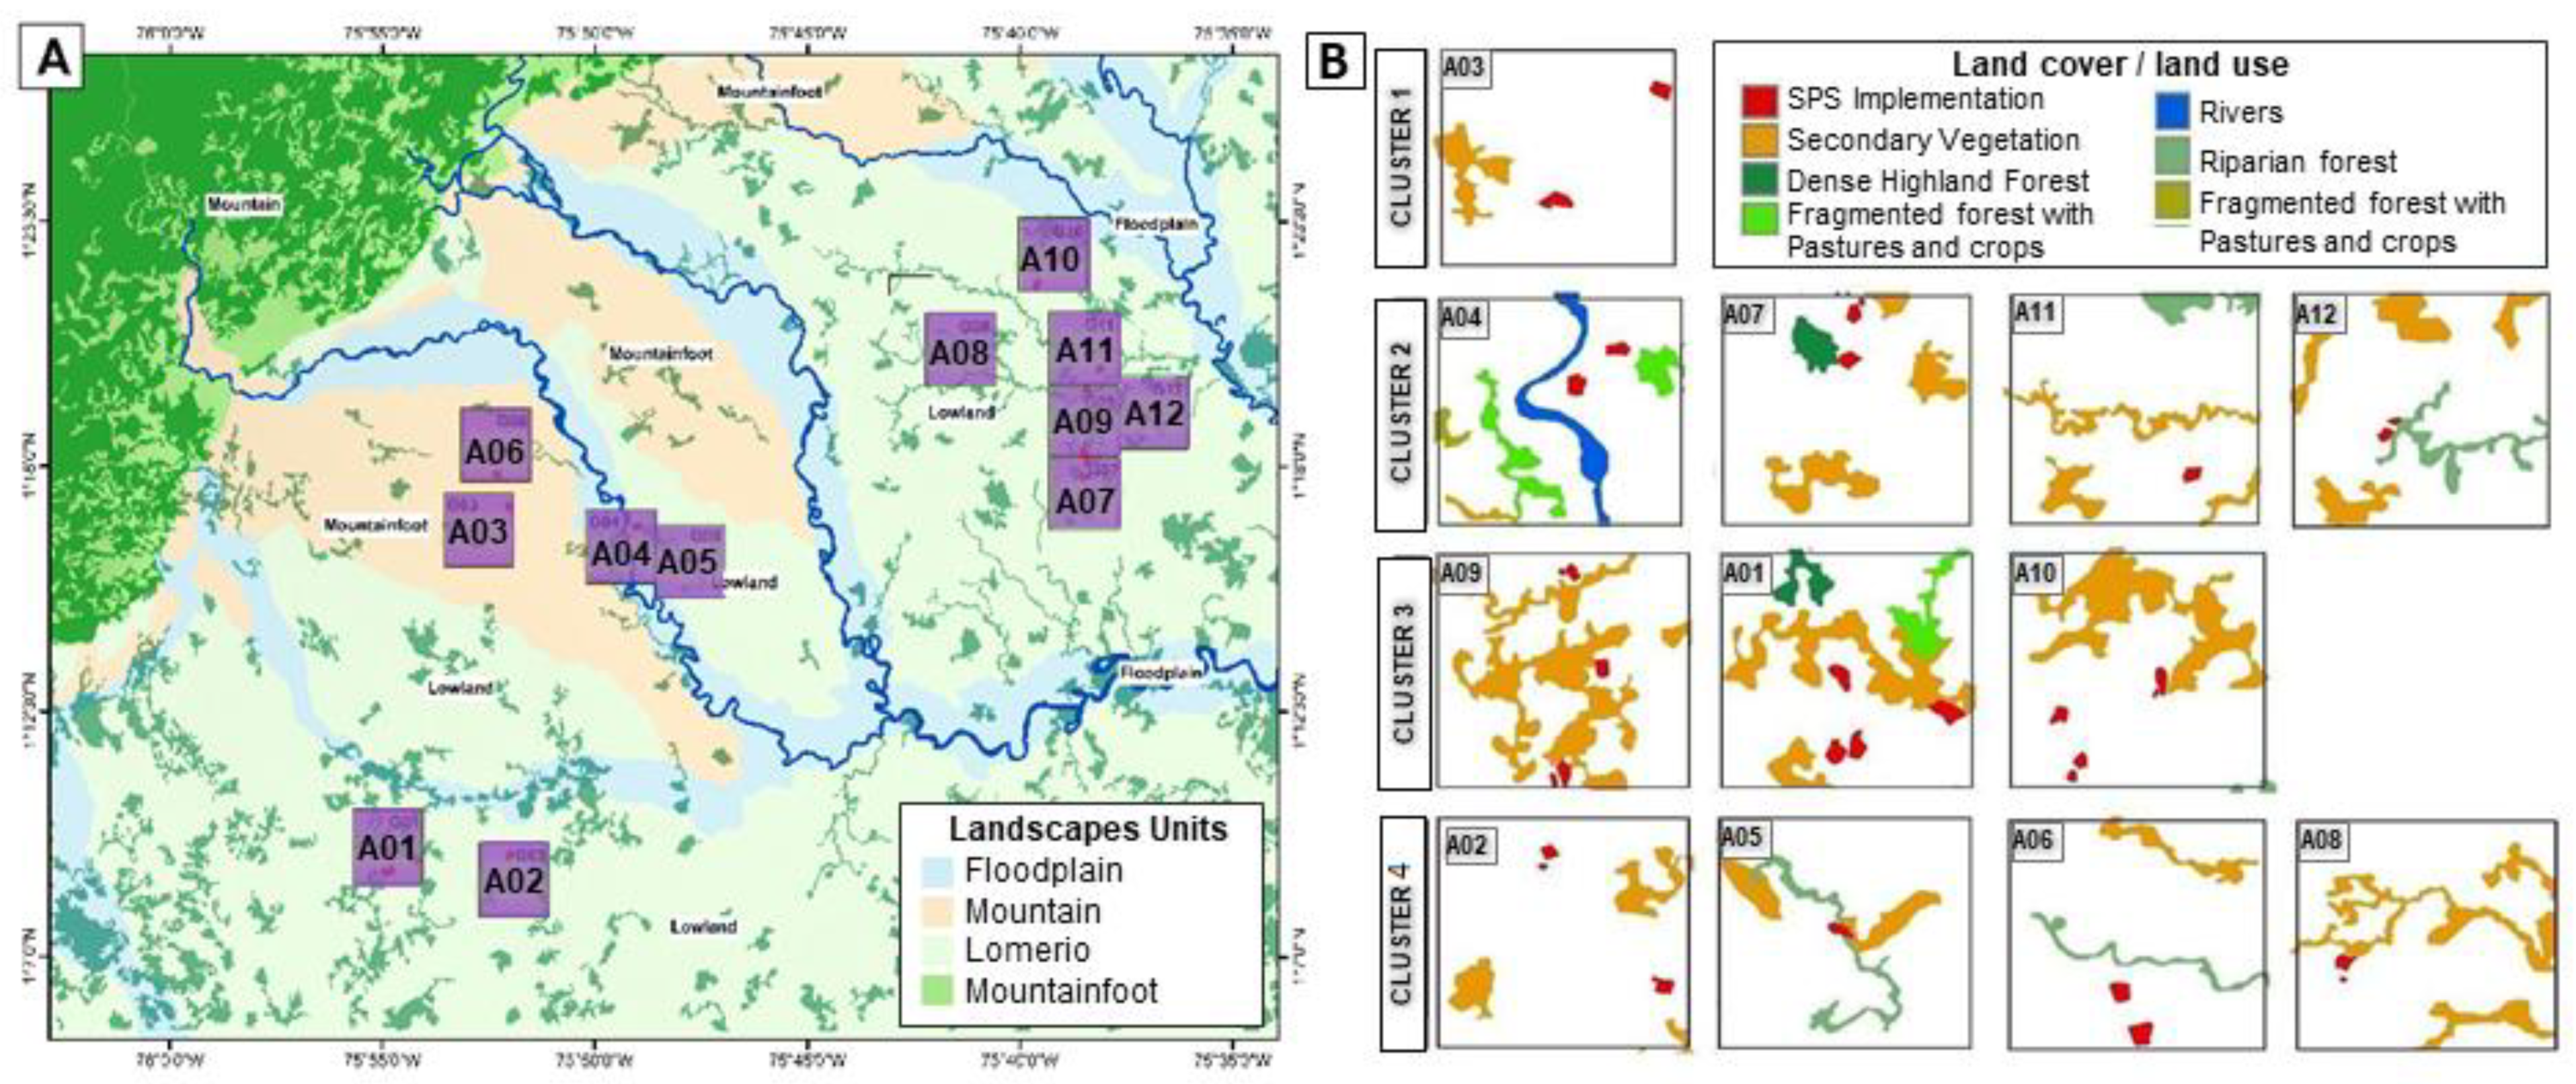
- i.
- Mountain Landscape: corresponds to the highest and most mountainous parts of the Amazon at the foot of the Andean region with slopes of 25–50%. Its forests have ecological and ecosystem characteristics of great importance, presenting high levels of diversity of fauna and flora species. This landscape is dominated by dense highland rainforest, fragmented woods, secondary vegetation, and small agricultural areas.
- ii.
- Mountain foot Landscape: represents a transition between the Andes and the Amazon plain, with slightly wavy reliefs and slopes > 25%. Loamy-sandy and loamy-clay soils with good drainage and low fertility. Entisols, Inceptisols, and Ultisols dominate. This landscape is dominated by clean pastures and recent oil palm monocultures.
- iii.
- Lowland Landscape (lomerio Landscape): have plain to wavy reliefs with slopes of 3–7% and 12–25%, drainage ranges from imperfect to excessive. Soils formed by sedimentary rocks of the tertiary, moderately deep, well drained, clayey texture, low fertility, very acidic, low saturation base, low content of organic matter. Dominance of Oxisols and Ultisols. This landscape is dominated by pastures, mosaics of pastures with agriculture and secondary vegetation. The main economic activity is extensive livestock raising.
- iv.
- Floodplain Landscape: are part of the floodplain of rivers that are born in the Andes mountain range. Flat relief, with slopes of 0–3%; they suffer occasional floods every 3 or 7 years. Clay soils with a dominance of Entisols and Inceptisols with poor drainage; superficial and limited by the water-table; fertility is average. This landscape is dominated by pastures and crop-fields.
- Area-shape metrics: In the lomerio landscape, the number of patches classified as “secondary vegetation” in 2002, increased by 31% compared to 2018. In contrast, the number of patches classified as “dense highland forests”, decreased by 58%. In the mountain landscape, 71% of all forest types (“dense highland forests”, “fragmented forest”, and “riparian forest”) reported in 2002, were lost in 2018. With a lower percentage, in the foothill landscape, 35% of all forest types were lost.
- Fragmentation metrics: The mountain landscape was the most fragmented area during the 15 years of analysis. In this landscape, the Effective MESH Size metric decreased by 48% between 2002 and 2018 in the landcover classified as “dense highland forest”, and by 99% in the landcover type called “fragmented forest”. Similarly, in the lomerio landscape, the Effective MESH Size metric decreased by 75% in the landcover classified as “dense highland forest”. This indicates that the primary forests (“dense highland forest”) were considerably reduced between 2002 and 2018, both in the mountain landscape and in the lomerio landscape. Two landscapes with completely different dynamics and drivers of change.
- Connectivity metrics: The Euclidean Nearest Neighbor Distance (ENN_MM) metric increased in several forest covers in all landscapes. For example, in floodplain landscape, this metric increased in the riparian strips by 40% and in the fragmented forest, by 43%. In the same way, in the lomerio landscape, the same metric, increased by 34% in the “dense floodplain forest”. In the mountain landscape, the ENN_MM metric increased by 46% in the “dense highland forest” and by 67% in the “fragmented forest”. Last, in mountain foothill landscape, the ENN_MM metric increased by 16% in the dense highland forest and by 91% in the fragmented forest.
3.3. Connectivity Comparison with and without the SPS Adoption at the Farmscape Level
3.3.1. Probability of Connectivity Index (PC)
3.3.2. Landscapes Metrics and PC Index
- Cluster 1 was composed by only one sub-window (A03) and identified as an outlier. The sub-window has a large patch of secondary vegetation in what would be a pasture dominated matrix. By implementing two SPS patches (of 4 and 5 ha), the PC index increased by 18%.
- Cluster 2 was composed of four sub-windows (A04, A07, A11, and A12) (Figure 4B). Their average forest habitat with the SPS implementations was 15%. The sub-windows grouped in this cluster are characterized by having a low percentage of crucial areas, but with different values of naturalness (secondary vegetation, fragmented forest with pastures and crops, fragmented forest with secondary vegetation, rivers, dense highland forest, and riparian forest). The average change in the landscape connectivity (PC index) within each sub-window increased by 3%, when comparing before and after the implementation of SPSs.
- Cluster 3 was composed of three sub-windows (A09, A01, and A10) (Figure 4B) with an average of 22% crucial area habitat without SPS implementations. The farmscape of this cluster are characterized by having a large crucial area patch, with an average size of 44.5 ha and made up of secondary vegetation. In each farmscape, a total of four SPS plots were adopted, each measuring about 4 ha. The change in the landscape connectivity (PC index) with the implementation of the SPS plots was an average increase of 6%.
- Cluster 4 was composed of four sub-windows (A 02, A05, A06, and A08) (Figure 4B). The amount of crucial area habitat without the SPS implementation was on average 10% per sub-window. This group contains the farmscapes with the least amount of crucial areas. The average change in the landscape connectivity (PC index) within the sub-windows with the implementation of SPSs was an increase of 5%.
4. Discussion
5. Conclusions
Supplementary Materials
Author Contributions
Funding
Institutional Review Board Statement
Data Availability Statement
Acknowledgments
Conflicts of Interest
References
- CBD. Colombia-Main Details: Status and Trends of Biodiversity, including Benefits from Biodiversity and Ecosystem Services. 2022. Available online: https://www.cbd.int/countries/profile/?country=co (accessed on 5 January 2022).
- Hansen, M.C.; Potapov, P.V.; Moore, R.; Hancher, M.; Turubanova, S.A.; Tyukavina, A.; Thau, D.; Stehman, S.V.; Goetz, S.J.; Loveland, T.R.; et al. High-Resolution Global Maps of 21st-Century Forest Cover Change. Science 2013, 342, 850–853. [Google Scholar] [CrossRef] [PubMed] [Green Version]
- IUCN. The IUCN Red List of Threatened Species. IUCN Red List of Threatened Species. 2021. Available online: https://www.iucnredlist.org/en (accessed on 1 April 2022).
- Armenteras, D.; Murcia, U.; González, T.M.; Barón, O.J.; Arias, J.E. Scenarios of land use and land cover change for NW Amazonia: Impact on forest intactness. Glob. Ecol. Conserv. 2019, 17, e00567. [Google Scholar] [CrossRef]
- IDEAM. Resultados Monitoreo de la Deforestación 2018. 2019. Available online: https://pidamazonia.com/content/resultados-monitoreo-de-la-deforestaci%C3%B3n-2018 (accessed on 6 February 2022).
- Landholm, D.M.; Pradhan, P.; Wegmann, P.; Sánchez, M.; Salazar, J.C.; Kropp, J.P. Reducing deforestation and improving livestock productivity: Greenhouse gas mitigation potential of silvopastoral systems in Caquetá. Environ. Res. Lett. 2019, 14, 114007. [Google Scholar] [CrossRef]
- Clerici, N.; Armenteras, D.; Kareiva, P.; Botero, R.; Ramírez-Delgado, J.P.; Forero-Medina, G.; Ochoa, J.; Pedraza, C.; Schneider, L.; Lora, C.; et al. Deforestation in Colombian protected areas increased during post-conflict periods. Sci. Rep. 2020, 10, 4971. [Google Scholar] [CrossRef] [PubMed] [Green Version]
- Arcila, O.; González, G.; Gutiérrez, F.; Rodríguez, A.; Ariel, C. Caquetá: Construcción de un Territorio Amazónico en el Siglo XX; Instituto Amazónico de Investigaciones Científicas, SINCHI: Bogotá, Colombia, 2000. [Google Scholar]
- Negret, P.J.; Allan, J.; Braczkowski, A.; Maron, M.; Watson, J.E.M. Need for conservation planning in postconflict Colombia. Conserv. Biol. 2017, 31, 499–500. [Google Scholar] [CrossRef]
- Morales, L. Peace and Environmental Protection in Colombia; The Dialogue Leadership for the Americas: Washington, DC, USA, 2017; Available online: https://www.thedialogue.org/wp-content/uploads/2017/01/Colombia-report-Eng_Web-Res_Final-for-web.pdf (accessed on 15 May 2022).
- Piccolino, G.; Ruette, K. The turn from peacebuilding to stabilisation: Colombia after the 2018 presidential election. Third World Q. 2021, 42, 2393–2412. [Google Scholar] [CrossRef]
- Taylor, P.D.; Fahrig, L.; With, K.A. Landscape connectivity: A return to the basics. In Connectivity Conservation; Crooks, K.R., Sanjayan, M., Eds.; Cambridge University Press: Cambridge, UK, 2006; pp. 29–43. [Google Scholar] [CrossRef]
- DANE. Censo Nacional Agropecuario 2014. DANE. 2014. Available online: https://www.dane.gov.co/index.php/estadisticas-por-tema/agropecuario/censo-nacional-agropecuario-2014 (accessed on 1 July 2022).
- Calle, A. Partnering with cattle ranchers for forest landscape restoration. Ambio 2020, 49, 593–604. [Google Scholar] [CrossRef]
- Chará, J.; Reyes, E.; Peri, P.; Otte, J.; Arce, E.; Schneider, F. Silvopastoral Systems and Their Contribution to Improved Resource Use and Sustainable Development Goals: Evidence from Latin America; FAO: Rome, Italy, 2019; ISBN 978-92-5-131192-9. [Google Scholar]
- Shibu, J.; Dollinger, J. Silvopasture: A sustainable livestock production system. Agrofor. Syst. 2019, 93, 1–9. [Google Scholar] [CrossRef] [Green Version]
- Yadav, A.; Gendley, M.K.; Sahu, J.; Patel, P.K.; Chandraker, K.; Dubey, A. Silvopastoral system: A prototype of livestock agroforestry. Pharma Innov. 2019, 8, 76–82. Available online: https://www.thepharmajournal.com/archives/?year=2019&vol=8&issue=2&ArticleId=2997 (accessed on 1 July 2022).
- Dagang, A.B.K.; Nair, P.K.R. Silvopastoral research and adoption in Central America: Recent findings and recommendations for future directions. Agrofor. Syst. 2003, 59, 149–155. [Google Scholar] [CrossRef]
- Mcadam, J.H.; Sibbald, A.R.; Teklehaimanot, Z.; Eason, W.R. Developing silvopastoral systems and their effects on diversity of fauna. Agroforest Syst. 2007, 70, 81–89. [Google Scholar] [CrossRef]
- Broom, D.M.; Galindo, F.A.; Murgueitio, E. Sustainable, efficient livestock production with high biodiversity and good welfare for animals. Proc. R. Soc. B Biol. Sci. 2013, 280, 20132025. [Google Scholar] [CrossRef] [PubMed] [Green Version]
- Amézquita, M.; Murgueitio, E.; Ibrahim, M.; Ramirez, B. Carbon Sequestration in Pasture and Silvo-Pastoral Systems under Conservation Management in Four Ecosystems of Tropical America; FAO: Rome, Italy, 2022. [Google Scholar]
- Murgueitio, E.; Calle, Z.; Uribe, F.; Calle, A.; Solorio, B. Native trees and shrubs for the productive rehabilitation of tropical cattle ranching lands. For. Ecol. Manag. 2011, 261, 1654–1663. [Google Scholar] [CrossRef]
- Cadavid-Florez, L.; Laborde, J.; Mclean, D.J. Isolated trees and small woody patches greatly contribute to connectivity in highly fragmented tropical landscapes. Landsc. Urban Plan. 2020, 196, 103745. [Google Scholar] [CrossRef]
- Castañeda-Álvarez, N.P.; Álvarez, F.; Arango, J.; Chanchy, L.; García, G.F.; Sánchez, V.; Solarte, A.; Sotelo, M.; Zapata, C. Especies Vegetales Útiles para Sistemas Silvopastoriles del Caquetá, Colombia; Deutsche Gesellschaft für Internationale Zusammenarbeit (GIZ) GmbH: Bonn, Germany; Centro Internacional de Agricultura Tropical (CIAT): Cali, Colombia, 2016; 84p. Available online: https://www.researchgate.net/publication/321197917_Especies_vegetales_utiles_para_sistemas_silvopastoriles_del_Caqueta_Colombia (accessed on 24 February 2021).
- MAC_DatosAbiertos/Cob_Region_100K_2002 (MapServer). (n.d.). 5 October 2022. Available online: https://gis.siatac.co/arcgis/rest/services/MAC_DatosAbiertos/Cob_Region_100K_2002/MapServer/WFSServer?request=GetCapabilities&service=WFS (accessed on 7 January 2019).
- MAC_DatosAbiertos/Cob_Region_100K_2018 (MapServer). (n.d.). 5 October 2022. Available online: https://gis.siatac.co/arcgis/rest/services/MAC_DatosAbiertos/Cob_Region_100K_2018/MapServer/WFSServer?request=GetCapabilities&service=WFS (accessed on 7 January 2019).
- PNN. Parques Nacionales Naturales de Colombia. 2022. Available online: https://www.parquesnacionales.gov.co/portal/en/ (accessed on 1 July 2022).
- Potapov, P.V.; Turubanova, S.A.; Tyukavina, A.; Krylov, A.M.; McCarty, J.L.; Radeloff, V.C.; Hansen, M.C. Eastern Europe’s forest cover dynamics from 1985 to 2012 quantified from the full Landsat archive. Remote Sens. Environ. 2015, 159, 28–43. [Google Scholar] [CrossRef]
- Hansen, M.C.; Loveland, T.R. A review of large area monitoring of land cover change using Landsat data. Remote Sens. Environ. 2012, 122, 66–74. [Google Scholar] [CrossRef]
- QGIS Development Team. QGIS 3.16 Hannover Geographic Information System. Open Source Geospatial Foundation. 2009. Available online: http://qgis.org (accessed on 22 April 2020).
- Etter, A. Introduccion a la Ecologia del Paisaje: Un Marco de Integración para los Levantamientos Ecológicos; IGAC: Bogotá, Colombia, 1991. [Google Scholar] [CrossRef]
- SIGOT. Geoservicios sig-ot|Sistema de Información Geográfica para la Planeación y el Ordenamiento Territorial. 2021. Available online: https://sigot.igac.gov.co/es/content/geoservicios-sig-ot (accessed on 15 May 2022).
- McGarigal, K.; Cushman, S.; Neel, M.; Ene, E. FRAGSTATS v4: Spatial Pattern Analysis Program for Categorical Maps. Computer Software Program Produced by the authors at the University of Massachusetts, Amherst. 2002. Available online: www.umass.edu/landeco/research/fragstats/fragstats.html (accessed on 11 January 2019).
- Machado, A. An index of naturalness. J. Nat. Conserv. 2004, 12, 95–110. [Google Scholar] [CrossRef]
- Pascual-Hortal, L.; Saura, S. Comparison and development of new graph-based landscape connectivity indices: Towards the priorization of habitat patches and corridors for conservation. Landsc. Ecol. 2006, 21, 959–967. [Google Scholar] [CrossRef]
- Saura, S.; Pascual-Hortal, L. A new habitat availability index to integrate connectivity in landscape conservation planning: Comparison with existing indices and application to a case study. Landsc. Urban Plan. 2007, 83, 91–103. [Google Scholar] [CrossRef]
- Saura, S.; Rubio, L. A common currency for the different waysin which patches and links can contribute to habitat availability andconnectivity in the landscape. Ecography 2010, 33, 523–537. [Google Scholar] [CrossRef]
- R Core Team. R: A Language and Environment for Statistical Computing; R Foundation for Statistical Computing: Vienna, Austria, 2021; Available online: https://www.R-project.org/ (accessed on 22 April 2020).
- Rodríguez-de-Francisco, J.C.; del Cairo, C.; Ortiz-Gallego, D.; Velez-Triana, J.S.; Vergara-Gutiérrez, T.; Hein, J. Post-conflict transition and REDD+ in Colombia: Challenges to reducing deforestation in the Amazon. For. Policy Econ. 2021, 127, 102450. [Google Scholar] [CrossRef]
- Ganzenmüller, R.; Sylvester, J.; Castro-Nunez, A. What Peace Means for Deforestation: An Analysis of Local Deforestation Dynamics in Times of Conflict and Peace in Colombia. Front. Environ. Sci. 2022, 10, 803368. [Google Scholar] [CrossRef]
- Bautista Céspedes, O.; Willemen, L.; Castro-Nunez, A.; Groen, T. The effects of armed conflict on forest cover changes across temporal and spatial scales in the Colombian Amazon. Reg. Environ. Chang. 2021, 21, 70. [Google Scholar] [CrossRef]
- Fahrig, L. Effects of Habitat Fragmentation on Biodiversity. Annu. Rev. Ecol. Evol. Syst. 2003, 34, 487–515. [Google Scholar] [CrossRef] [Green Version]
- Etter, A.; Mcalpine, C.; Phinn, S.; Pullar, D.; Possingham, H. Characterizing a tropical deforestation wave: A dynamic spatial analysis of a deforestation hotspot in the Colombian Amazon. Glob. Chang. Biol. 2006, 12, 1409–1420. [Google Scholar] [CrossRef]
- Armenteras, D.; Espelta, J.M.; Rodríguez, N.; Retana, J. Deforestation dynamics and drivers in different forest types in Latin America: Three decades of studies (1980–2010). Glob. Environ. Chang. 2017, 46, 139–147. [Google Scholar] [CrossRef]
- Francesconi, W.; Montagnini, F.; Ibrahim, M. Using bird distribution to evaluate the potential of living fences to restore landscape connectivity in pasturelands. In Agroforestry as a Tool for Landscape Restoration; Nova Science Publishers: New York, NY, USA, 2011; pp. 133–142. [Google Scholar]


| Naturalness Categories | Land Cover/Land Use | Rank | Land Use Validation Photographic Evidence |
|---|---|---|---|
| Natural system; dominance of wild native species, few exotic invader species; minimal artificial infrastructure, temporary or removable. | Dense Highland Forest | 9 |  |
| Dense Highland Floodplain Forest | |||
| Natural Water Bodies | |||
| Natural Sandy Areas | |||
| Natural Marshy Areas | |||
| Sub-natural system; presence of wild native species and possible extended presence of exotic invader species, but not dominant (low impact); artificial elements restricted, not widespread. | Fragmented Forest with Pastures and Crops | 8 |  |
| Fragmented Forest with Secondary Vegetation | |||
| Quasi-natural system; extensive anthropic activities of low physical impact; presence of wild native species but also exotic invader species well established but not dominant; natural structures modified but not distorted. Little alteration of water dynamics | Riparian Forest | 7 |  |
| Semi-natural system; presence of wild native species and possible extended presence of exotic invader species. Occasional addition of energy and/or extraction of renewable resources or of non-relevant materials. It may include abandoned cultural systems undergoing natural recovery. | Secondary Vegetation | 6 |  |
| Cultural assisted system that combine tree growing, forages, and shrubs/trees with the production of livestock. Presence of wild native species and possible extended presence of exotic invader species. Natural elements intermixed with artificial ones, as managed wooded pastures, in patches or corridors. Active management of the water cycle. | Silvopastoral Systems | 4 |  |
| Highly intervened system: permanent areas with agricultural production. Natural biodiversity is severely reduced; its elements are isolated (intense fragmentation). | Mosaic of crops, pastures, and natural Spaces | 3 |  |
| Pasture Mosaic with Natural Spaces | |||
| Pastures and Crops Mosaic | |||
| Transformed system; anthropic processes governing; clear dominance of artificial elements; frequent intensive vertical development; vestiges of natural elements. | Oil Palm | 1 |  |
| Weedy Pastures | |||
| Open Treeless Pastures | |||
| Artificial system | Hydrocarbon Exploitation | 0 |  |
| Urban Areas | |||
| Bare and Degraded Lands |
| Cluster | Sub- Window | Without SPS (Before Implementations) | With SPS (After Implementation) | |||||||||||||
|---|---|---|---|---|---|---|---|---|---|---|---|---|---|---|---|---|
| CA | NP | Average_PA | dPCintra | dPCflux | dPCconnector | dPC | Area_SPS | CA | NP | Average_PA | dPCintra | dPCflux | dPCconnector | dPC | ||
| 1 | A03 | 49.75 | 1 | 49.75 | 9.3 | 59.1 | 3 | 19.7 | 80.8 | 38.5 | 0.0 | 119.3 | ||||
| 2 | A04 | 150.78 | 6 | 23.83 | 33.1 | 133.7 | 6.0 | 172.9 | 7.8 | 158.6 | 8 | 18.9 | 29.2 | 141.5 | 9.7 | 180.5 |
| A07 | 124.89 | 4 | 29.58 | 42.7 | 114.6 | 0.1 | 157.4 | 6.6 | 131.5 | 7 | 17.8 | 37.8 | 124.5 | 2.5 | 164.8 | |
| A11 | 116.57 | 5 | 22.73 | 35.9 | 128.3 | 3.4 | 167.6 | 2.9 | 119.4 | 6 | 19.4 | 34.3 | 131.3 | 3.5 | 169.1 | |
| A12 | 153.46 | 5 | 30.23 | 28.4 | 143.2 | 4.1 | 175.7 | 2.5 | 155.9 | 7 | 21.9 | 27.4 | 145.1 | 4.1 | 176.7 | |
| 3 | A01 | 230.08 | 6 | 35.80 | 46.3 | 107.4 | 2.6 | 156.3 | 19.8 | 249.9 | 10 | 23.0 | 38.5 | 123.0 | 4.2 | 165.7 |
| A09 | 225.71 | 4 | 54.19 | 63.0 | 74.1 | 0.2 | 137.3 | 8.9 | 234.6 | 9 | 25.1 | 58.1 | 83.7 | 1.1 | 143.0 | |
| A10 | 183.07 | 4 | 43.57 | 99.5 | 1.1 | 0.0 | 100.5 | 8.8 | 191.9 | 9 | 20.3 | 91.9 | 16.2 | 0.2 | 108.2 | |
| 4 | A02 | 128.92 | 4 | 16.08 | 63.3 | 73.3 | 0.0 | 136.7 | 5.5 | 134.5 | 7 | 10.0 | 55.0 | 90.0 | 0.7 | 146.0 |
| A05 | 105.50 | 4 | 17.20 | 33.0 | 134.0 | 4.9 | 171.9 | 2.1 | 107.6 | 5 | 2.1 | 22.9 | 154.2 | 7.1 | 184.2 | |
| A06 | 65.80 | 2 | 28.00 | 61.0 | 77.9 | 0.0 | 139.0 | 9.7 | 75.5 | 4 | 16.4 | 47.7 | 104.6 | 2.6 | 154.9 | |
| A08 | 136.03 | 5 | 26.70 | 48.3 | 103.3 | 1.9 | 153.6 | 2.7 | 138.7 | 7 | 19.4 | 46.4 | 107.2 | 2.4 | 156.0 | |
Publisher’s Note: MDPI stays neutral with regard to jurisdictional claims in published maps and institutional affiliations. |
© 2022 by the authors. Licensee MDPI, Basel, Switzerland. This article is an open access article distributed under the terms and conditions of the Creative Commons Attribution (CC BY) license (https://creativecommons.org/licenses/by/4.0/).
Share and Cite
Argote, K.; Rodríguez-Sánchez, B.; Quintero, M.; Francesconi, W. One Tree at a Time: Restoring Landscape Connectivity through Silvopastoral Systems in Transformed Amazon Landscapes. Diversity 2022, 14, 846. https://doi.org/10.3390/d14100846
Argote K, Rodríguez-Sánchez B, Quintero M, Francesconi W. One Tree at a Time: Restoring Landscape Connectivity through Silvopastoral Systems in Transformed Amazon Landscapes. Diversity. 2022; 14(10):846. https://doi.org/10.3390/d14100846
Chicago/Turabian StyleArgote, Karolina, Beatriz Rodríguez-Sánchez, Marcela Quintero, and Wendy Francesconi. 2022. "One Tree at a Time: Restoring Landscape Connectivity through Silvopastoral Systems in Transformed Amazon Landscapes" Diversity 14, no. 10: 846. https://doi.org/10.3390/d14100846