Article

The Mitogenome Structure of Righteye Flounders (Pleuronectidae): Molecular Phylogeny and Systematics of the Family in East Asia

by
Alexander D. Redin
and
Yuri Ph. Kartavtsev
*
A.V. Zhirmunsky National Scientific Center of Marine Biology (NSCMB), Far Eastern Branch, Russian Academy of Sciences, 690041 Vladivostok, Russia
*
Author to whom correspondence should be addressed.
Diversity 2022, 14(10), 805; https://doi.org/10.3390/d14100805
Submission received: 26 August 2022 / Revised: 19 September 2022 / Accepted: 21 September 2022 / Published: 27 September 2022
(This article belongs to the Special Issue Aquatic Organisms Research with DNA Barcodes)

Abstract

:
This paper reports the first complete sequence of the mitochondrial genome (mitogenome) of the yellow-striped flounder Pseudopleuronectes herzensteini (Pleuronectoidei: Pleuronectidae). Mitogenome evolution, and molecular phylogenetic reconstruction based on four to six techniques, including coalescent analysis, were performed for flatfish. The genome size of the specimen sampled was 16,845 bp, including 13 protein-coding genes, 22 tRNA genes, 12S, and 16S rRNA genes, and the control region, CR. The composition and arrangement of the genes are similar to those in other teleost fish, including the second mitogenome reported in this paper. The frequency of A, C, G, and T nucleotides in the P. herzensteini mitogenome is 27%, 29.2%, 17.6%, and 26.2%, respectively. The ratio of complementary nucleotides in the mitogenome of this and other species of the family was A+T:G+C (53.2: 46.8%) and do not deviate significantly from the expected equilibrium proportion. The submission to the global database (GenBank) of two new mitogenomes along with 106 analyzed GenBank sequences will contribute to phylogenetic studies of flounders at the family and suborder levels. Based on 26 and 108 nucleotide sequences of protein-coding genes (PCGs), we investigated the molecular phylogeny of flounders and performed analysis for two sets of sequences, including those of members of the family Pleuronectidae and the suborder Pleuronectoidei and estimated their importance in establishing the taxonomy at these two levels. Data obtained by up to six techniques of multigene phylogenetic reconstructions support monophyly within the family Pleuronectidae with high statistical confidence; however, conclusions regarding the phylogenetics at the suborder level require further investigation. Our results also revealed paraphyletic and weakly supported branches that are especially numerous at the suborder level; thus, there is a clear need for taxonomic revisions at the suborder, and possibly family levels. Genetic distance analysis reveals the suitability for DNA barcoding of species specimens at single genes as well as at whole mitogenome data.

1. Introduction

The righteye flounder, family Pleuronectidae (Osteichthyes, Carangiformes, Pleuronectoidei), which is the main focus of this study, comprises one of the largest families within the suborder Pleuronectoidei (formerly order Pleuronectiformes), including 59 nominal species that are distributed in marine waters of the Northern Hemisphere [1,2]. Based on ten synapomorphies in morphological characters, Cooper and Chapleau [2] treated the family Pleuronectidae as a monophyletic taxon. Although previous research has attempted to classify the flounders by various approaches the morphological, anatomic, cytological, chromosome, and molecular-and-genetic, a consensus on the taxonomy of these fish is still lacking. In this paper, the authors would like to shed light on the systematics of some questionable flatfish taxa.
The yellow-stripe flounder Pseudopleuronectes herzensteini (Jordan and Snyder, 1901), for which one of the two mitogenomes reported in this paper is describing in more detail below, belongs to the well-established genus of the family Pleuronectidae. It is a bottom-dwelling marine fish found in temperate waters of the northwestern Pacific, from the Sea of Japan to the Kuril Islands, Sakhalin, Korea, the Yellow Sea, Bohai Bay, and the East China Sea [2]. Due to the fishery importance of this and other flounder species and the need to manage these valuable bioresources, both the accurate classification of specimens of species within genera and the upper taxa relationships for Pleuronectidae and other families of the suborder are vital.
Several classifications of flounders of the family Pleuronectidae were proposed by different authors [2,3,4,5]. There is also some controversy regarding the phylogenetic relationships of flounders inferred from morphological and molecular genetic data [2,6,7,8,9,10,11,12,13]. Complications regarding flatfish specimen identification, speciation, and evolutionary diversification resulting in the support for monophyly of Pleuronectidae and Pleuronectoidei/Pleuronectiformes indicate that these views are not universal nor have received clear support in phylogenetic studies [12,13]. Evidence for flatfish paraphyly was considered quite long ago [3,14,15] and later developed into a phyletic generalization that supports the monophyly of this taxon [6]. Chapleau’s [6] conclusion of pleuronectiform monophyly was accepted by many researchers and received certain molecular support [8,11,13,16]. Other molecular-based studies offered also opposite evidence, indicating flatfish paraphyly [9,10,17,18,19,20,21,22,23]. The complications surrounding DNA sequence analysis and judgments about the monophyly of flatfish are continuing and papers to validate these points have been written [12,13,16,24], including this paper.
In the current paper, we report the results of a thorough examination of the phylogenetic signal in the mitochondrial genome (mitogenome) to infer pleuronectiform relationships, mostly for Russian Far Eastern Pleuronectidae but with particular insight into the suborder level. Because of the limited space of the paper, we focus on these two issues and do not discuss higher taxa such as the Carangimorpha or the clade L sensu [17]. Mitogenomes offer several advantages for phylogenetic inference. They are highly conserved in organization and have uniparental/haploid inheritance and a large number of characters (variable nucleotides or amino acids, if translated) that are inherited as a single unit due to a circular DNA (mtDNA), with no, or a very low, recombination. Because mtDNA sequences show faster rates of substitution and a smaller effective population size if compared to nuclear DNA (nDNA) [25,26,27], they are often more suitable for recovering a phylogenetic signal for diversification events in lineages up to the order level (when the accumulated number of reverse mutations is not high). Previous studies showed that sequences of protein-coding genes (PCGs) in mitogenomes give very reliable information for recovering the diversity of flatfish lineages because tree topologies do not differ significantly from those based on complete mitogenome sequence [12,16]. For these reasons, this study exclusively uses PCGs for inferring a phylogenetic signal.
To our knowledge, this is the first study to present the composition of the complete mitochondrial genome of P. herzensteini. Also, the mitogenome of a new specimen of flounder Platichthys stellatus was sequenced and analyzed. A molecular phylogenetic study was performed based on the original nucleotide sequences of mtDNA of these two species, as well as on sets of GenBank sequences [28], a total of 26 and 108 sequences for the family Pleuronectidae and the suborder Pleuronectoidei, respectively. From these data, several types of gene trees were reconstructed and the divergence of taxa among recent members of the family Pleuronectidae and the suborder Pleuronectoidei were estimated. An approximation of these data into time scale by Bayesian skyline was performed as well.

2. Materials and Methods

2.1. Materials and General Analysis of Approaches

A total of 108 sequences belonging to the suborder Pleuronectoidei of the order Carangiformes were analyzed, including two presented in this paper (see below). Latin names are given in accordance with the classification [2].
Two specimens of Pseudopleuronectes herzensteini and Platichthys stellatus (pieces of muscle tissue fixed in 95% ethanol) were derived from the collection of the Laboratory of Molecular Systematics. The voucher specimens, 7K Pseudopleuronectes herzensteini stripe-yellow flounder fished by gill net in Vostok Bay Peter the Great Bay, Sea of Japan, and Platichthys stellatus labeled Ps2-011 obtained from bottom trawling in the Okhotsk Sea; both are stored at the Museum of the A.V. Zhirmunsky National Scientific Center of Marine Biology of the Far East Center of Russian Academy of Sciences (NSCMB FEB RAS). DNA was isolated using commercial kits (DNA Extran-2, Sintol, Moscow, Russia). Then, 350 ng of total DNA was collected for both samples and sent to Novogene (China) for sequencing. Sequencing was carried out on the Illumina platform (Novaseq 6000 sequencer, Peking, China).
According to the sequencing technique, the length of nucleotide fragment reads along the mitogenome was 150 bp. The fragments were assembled into a complete mitogenome sequence using the NOVOPlasty4.2.1 software (https://github.com/ndierckx/NOVOPlasty) on the Ubuntu 20.04 LTS subsystem [29]. Protein-coding genes, rRNAs, and tRNAs were annotated and mapped using the MitoAnnotator WEB bench [30].
Analysis of variability and divergence was carried out starting with relatively simple software packages, DNAsp-5 [31] and MEGA-X [32]. Molecular phylogenetic analysis was performed mainly on the basis of nucleotide sequences (below referred to as sequences) of PCGs using the software MrBayes 3.2.1 or 3.2.7 [33,34], MEGA-X [32], and BEAST-2 [35,36,37,38,39] (including the latest updates at: http://www.beast2.org/; accessed on 24 July 2021). Protein-coding genes were extracted from complete mitochondrial genomes based on the FishMitoPipe script (https://github.com/Sturcoal/FishMitoPipe#fishmitopipe-the-pipeline-for-fish-mitochondrial-genome-manipulation-before-phylogenetic-analysis; Vladivostok, Russia, accessed on 1 January 2020), then combined into a super-matrix of sequences using SequenceMatrix [40]. Sequences were aligned using the ClustalW program in MEGA-X (http://www.megasoftware.net; Tokyo, Japan) [32]. The gap opening and gap extension penalties were set at 15.0 and 5.0, respectively (for other settings of the alignment program, the default parameters were used). After the first alignment step, large gaps were manually removed; the final alignment in the second step was performed with reduced penalty levels (5.0 and 0.5 for the two options, respectively). All gaps were then manually removed again.
For a comparative analysis of mitogenomes, PhyloSuite software was additionally used [41]. To work in the PhyloSuite software, complete mitogenome sequences were previously downloaded from GenBank in the ID.gb format (where ID is, the sequence access number on the site with the extension code for the GenBank file, .gb). Then, all information about the sequences of PCGs, rRNAs, tRNAs, control region (CR), and other information was extracted from mitogenomes. After that, the resulting sequences were aligned in a program block (utility), MAFFT. Alignment was carried out in two stages. In the first stage, PCGs were aligned, and in the second stage, rRNAs, tRNAs, and CR were aligned. Next, the resulting fasta files (.fas, .fasta) for protein-coding, rRNA, and tRNA sequences were moved to one folder and then stitched into a single file using another program block, Concatenate Sequence.
The obtained concatenated sequences were analyzed using the software utility, PartitionFinder, to select the most appropriate mitogenome partition schemes and to define optimal models for the molecular substitution along sequences. For subsequent phylogenetic analysis, within this block, the model fitting options for the MrBayes software were selected (the desired option is selected in the menu window instead of the default option “all”) with an economical (“greedy”) search method. After working in PartitionFinder, the results were sent to the MrBayes software package integrated with PhyloSuite software.
When running MrBayes in the PhyloSuite software, additional options, such as the choice of an outgroup, the number of generations, and others that determine the probabilistic parameters of the tree reconstruction, are determined by software and manually. So, for the last case in the menu window, when starting this block, we set the number of generations (n) equal to n = 2 × 10⁶, and the number of Markov chains in digital Monte Carlo simulation (mcmc) equal to 4. However, for the former case, the tree special models for each gene were selected by PartitionFinder utility and automatically recorded in the command block of BA analysis.

2.2. Molecular Phylogenetic Analysis

The molecular phylogenetic analysis is aimed basically at building gene trees. Phylograms based on PCG sequences were generated using several approaches. Initially, the optimal substitution model for nucleotides in the lineages (their evolution) was estimated based on the sequence’s matrices that formed for the analysis. The best-suited model, as determined using MEGA-X software, was the GTR+G+I model (General Time Reversible, with G, Gamma mode variation across sites, and I, Invariable fraction of nucleotides). This model was defined as best for both 26 sequences that were chosen for the analysis of the family Pleuronectidae, as well as for 108 sequences of suborder Pleuronectoidei. Phylogenetic trees were constructed using four methods: Bayesian analysis (BA), maximum likelihood (ML), neighbor-joining (NJ), and maximum parsimony (MP). These techniques were performed by using an original software package (SP) MrBayes-3.2.7 (http://nbisweden.github.io/MrBayes/download.html; accessed on 2 June 2021) for BA [33,34], or by SP MEGA-X [32] for ML-, NJ- and MP-techniques; for the set of 13 PCGs and 26 Pleuronectidae sequences the additional gene tree reconstructions were performed using SP PhyloSuite and BEAST-2.
SP MrBayes-3.2.7 was used to do the BA analysis, as stated above. Before tunning BA, the SP SequenceMatrix-8.1 [42] was used and the super-matrix for the BA analysis was obtained as one of its output files (Fl-26seq-pt4.nex). Next, the numerical simulation for tree reconstruction by SP MrBayes-3.2.7 was run. Program parameters for such runs included: applying one million generations (n = 106), four parallel Markov chains using the program utility ‘mcmc’, the definitions of partitions for 13 PCGs, descriptors for coding of nucleotide positions within codons, that defined by SequenceMatrix, and several other options used in SP MrBayes-3.2.7; the output have the mode of BA consensus tree. Three other tree reconstructions ML, NJ, and MP run with k = 1000 bootstrap replications (providing bootstrap support for the branch nodes). As an outgroup for tree rooting one taxon for the family Pleuronectidae, Paralichthys olivaceus, and the two taxa Tetraodon mbu and Acrossocheilus monticola for suborder were used, which are known from literary sources as the most recent common ancestors (mrca), to Pleuronectidae I and Paralichthodidae, correspondingly [13], Table 1 in it; see more details in Results and Discussion sections). Dating of divergence time on paleontological records for the mrca pairs comprise reference points for calibration of molecular divergence. Calibration points for molecular divergence are 27.83 and 46.19 million years (Mya), correspondingly to Pleuronectidae and Pleuronectoidei from the two above taxa [13], Table 1 in it. Below in the second following paragraph, more details are given on this point.
As previously stated, molecular phylogenetic reconstructions for the Pleuronectidae family were undertaken using the base SPs the MrBayes and MEGA-X involving PCGs and four tree-building techniques: BA, ML, NJ, and MP. Topology and time divergence using coalescent analysis (CA) were reconstructed by SP BEAST-2 in addition to those four for all 13 PCGs and 26 sequences in the family, including the outgroup. CA parameters from four fundamental models were integrated for this: (I) Yule CA (Yule, 1924), (II) Bayesian Skyline CA, (III) CA for a population of constant size, and (IV) Extended Bayesian Skyline CA [38,39]. For each of the four CA models several files that designed in BEAUti2.6.6. utility, were run as explained below. Also, in one of the PS BEAST-2 simulation models the running file contained partitions and nucleotide positions that were created by the PhyloSuite software and its utility PartitionFinder.
SP BEAST-2, v2.6.5 [38,39] and its newest update v2.6.6 were applied to the 26 sequences matrix of 13 PCGs for the estimation of node ages in simulated trees. An independent GTR+G+I model of nucleotide substitution with gamma-distributed rate variation across sites (defined previously in MEGA as described above) with n = 5–15 categories and an uncorrelated relaxed exponential clock and lognormal relaxed clock [38,39,43] were selected in different runs. The random option for initial phylogenetic trees was used to generate the final set. Priors that followed a Yule CA branching model, Bayesian Skyline, Extended Bayesian Skyline, and CA for a constant size population were employed. Two points for fossil calibration were used in this analysis. The first point taken from the nearly oldest flatfish stem fossil, Eobothus mimus (Agassiz, 1833) from the Upper Eocene (50 Mya) of Monta Bolca (Italy) dates the time for the most recent common ancestor, TMRCA of Bottidae, Pleuronectidae, and Paralichthyidae [13]. In this paper, we used as the first reference TRMCA the date 46.19 Mya, close to the above dating back to the Paralichthodidae, the other superfamily Soleoidea representative, as given in Table 1 [13]. The second setting points to a more recent age constraint for the clade (Pleuronectidae I, Paralichthyidae I), equal to 27.83 Mya [13] Table 1 in it. These calibration points were modeled with a normal distribution with a mean of 46.2 Mya and a standard deviation of 1.0 Mya. Simulations were run by setting the option monophyly for the whole tree and the option outgroup definition to Paralichthys olivaceus. At least, six, fifteen, seven, and eleven independent runs for four tested basic model sets (I–IV) were performed using 50–70 million generations and sampling every 1000th tree with the specific sets of settings. All runs were checked for sufficient mixing, stable convergence on a unimodal posterior and tree priors, and with effective sample sizes (ESS) exceeded the score of 100–200 for all meaningful parameters using TRACER v1.5 [35,39] and its update TRACER v1.7. After 50% of the resulting trees were removed as burn-in, the remaining trees were summarized in a Maximum Clade Credibility consensus tree with TreeAnnotator v2.6.5 [39] and the update v2.6.6. Along with the SP BEAST-2.6.5-2.6.6, the BEAUTY-2.6.5-2.6.6 as its main utility was involved in the building of the main framework file for calculations in BEAST (BEAUTY-file performed in .xml format). Also, the BEAGLE database (Beagle 5.2; washington.edu) was used in most runs as recommended by SP BEAST-2 developers (Drummond, Bouckaert, 2015; Bouckaert et al., 2019).
Phylogenetic trees were visualized and edited, when necessary, using SP FigTree 1.4.0 [44] and MEGA-X. Additionally, beyond five basic gene tree reconstruction techniques (BA-, ML-, NJ-, MP-, and CA-trees), the IQ-TREE version 2.1.2 software (http://www.iqtree.org; Wien, Austria) [45] was used for ML-tree reconstructions that run with the default parameters and auto-detection the sequence type as well as with the best-fitting substitution model definition. IQ-TREE performed the Ultrafast Bootstrap [46] and the SH-aLRT branch test [47] to estimate the scores for nodes’ support; in this case, runs made with n = 2000–5000 replicates.
Sequences of complete mitogenome obtained by our team and presented here for two flounder species, Pseudopleuronectes herzensteini and Platichthys stellatus have been submitted to GenBank [28] and are listed in Table 1 along with sampled GenBank sequences. For the sake of brevity, the structure of the mitogenome is visually represented only for the species P. herzensteini. However, sequences of both species were used for molecular phylogenetic analysis as well as for comparison of mitogenome structure for other representatives of the family Pleuronectidae. The map of circular mitogenome of yellow-stripe flounder P. herzensteini was obtained with the usage of MitoFish WEB bench [48], CLOROBOX WEB resource, and the utility of the late, GeSeq; MPI-MP CHLOROBOX-GeSeq (mpg.de).
For the analysis of variability and divergence of sequences, several SP or their special utilities are used. The list included six main SP: MEGA-X, DNAsp, MrBayes, PhyloSuite, BEAST-2, and IQ-TREE. Ending the current section, it is suitable to exemplify the analytical resources developed for them. The amounts of calculations could be represented partly by the information capacity in the folders and files with their sizes in mega-bites, MB. For simplicity, let us take only the family Pleuronectidae. MEGA-X: The folder Pleuronectidae (created 8 June 2021) has the size 15 MB. This folder is comprised of four subfolders, including 88 files. DNAsp: The folder Pleuronectidae (created 7 September 2021), has the size 38 MB. In the calculations, 31 files were involved. MrBayes: The folder Flound2021-Pleuronectidae (created 2 June 2021), has the size 235 MB. The folder comprised of 18 subfolders, including 367 files. PhyloSuite: The folder PhyloSuite (created 14 September 2021), has the size 18.7 GB. The folder is comprised of 662 subfolders, including 2,187,119 files (here big fraction of files are comprised of the SP itself but not the calculation files). BEAST-2: The folder Pleuronectidae (created 24 July 2021), has the size 37.8 GB. The folder is comprised of 75 subfolders, including 1075 files. Remarkably, the most interesting results were obtained by CA simulations for a population of constant size (CA analysis, model III), but computing resources used were greatest for the CA model IV.

3. Results

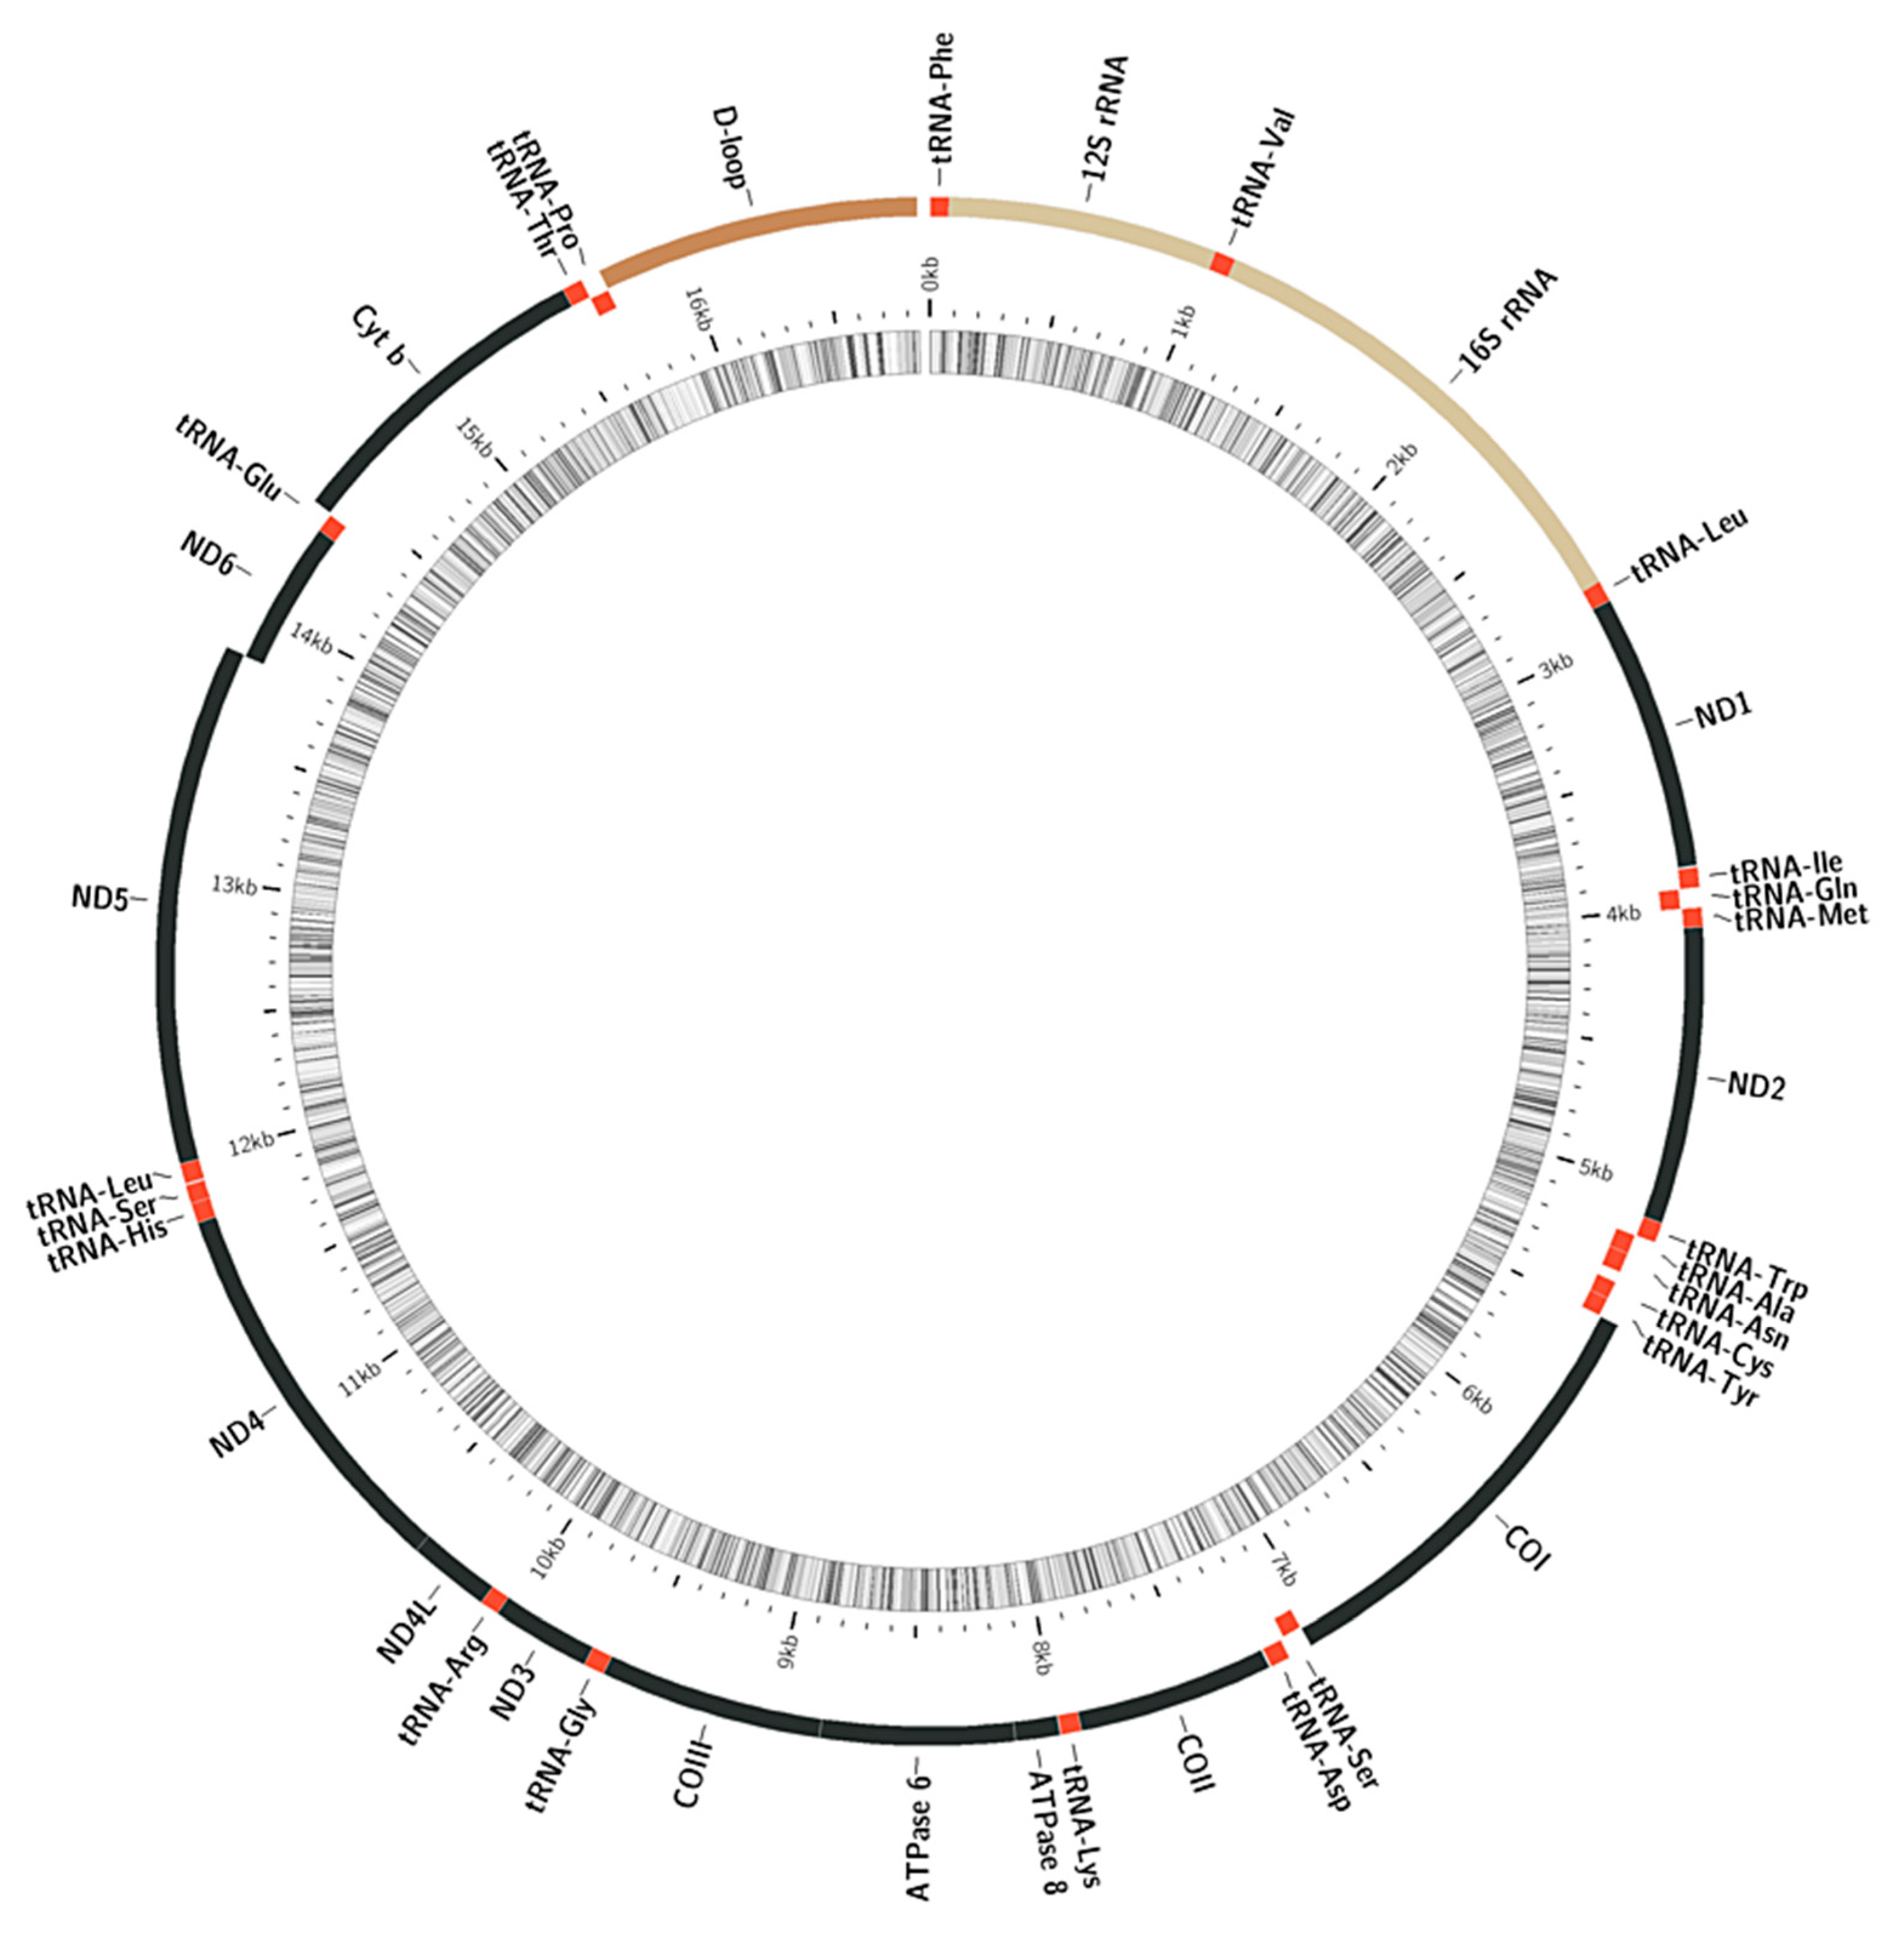
3.1. Structure and Variability of the Mitochondrial Genome of the Yellow-Stripe Flounder Pseudopleuronectes Herzensteini and Other Members of the Family Pleuronectidae

The complete mitogenome of P. herzensteini is 16,845 bp long (GenBank accession No: MW713061). It is including 13 protein-coding genes, 22 tRNAs, 12S rRNA and 16S rRNA genes, and a control region, CR (Figure 1). Most of the genes are located in the “+” strand, except ND6 and eight tRNA genes, which are located in the “−” strand (Figure 1). For greater clarity, data on the structure of the mitogenome are given in a separate table for three members of the Pleuronectidae, including the two species we describe herein (Table 2).
The 22 tRNA genes studied are located between the rRNA genes and the PCGs. Their length varies from 66 bp (tRNA-Cys) to 74 bp (tRNA-Leu, Lys, Thr) (Figure 1, Table 2). All tRNAs chains are capable of forming a typical clover-leaf structure, with the exception of tRNA-Cys, which forms a different secondary structure. The secondary structure of the studied tRNAs was clarified using the tRNAscan-SE software [49,50].
Most protein-coding genes (12) use the ATG start codon. The exception is the COI gene, which uses GTG. A complete three-nucleotide stop codon, TAA, is used in four protein-coding genes, ND5, COI, ND1, and ATP6. The ND4, Cyt-b, ND2, and COII genes have an incomplete stop codon using only T. The ND4L gene terminates with A; ATP8, with G; COIII, with TA; and ND3, with a TC combination. The ND6 gene has the TAG stop codon. Thirteen protein-coding genes of the P. herzensteini mitogenome encode 3708 amino acids. The most commonly used amino acid is leucine (17.53%), and cysteine is the least used (0.62%). The control region (CR, D-loop) 1142 bp long is located between tRNA-Pro and tRNA-Phe (Figure 1), as was the case in the study [51].
The arrangement of genes in the studied taxa of the Pleuronectidae is conserved, and the changes within the family are due only to sporadic rearrangements and duplications of tRNA genes (Figure 2). The analysis of the properties of the sequences presented showed very high variability and informative capacity of the 13 PCGs of the studied members of the flounder family Pleuronectidae. The overall heterogeneity of nucleotide frequencies of different types with a prevalence of purines (T+C) over pyrimidines (A+G) is well known for PCGs due to its hydrophobic impact on polypeptides, but herein it was provided with necessary statistical evaluation (Table S4). Nucleotide diversity along sequences of the 13 PCGs varied widely (Figure S3); however, it was fundamentally similar across genes (Table S5). The analysis showed that nucleotide diversity did not differ significantly between the 13 PCG sequences, averaging about 12%: Pi = 0.12 ± 0.03. In general, the structure of the mitogenome of 26 studied members of the Pleuronectidae with a representative of the outgroup is very conserved, which is illustrated in more detail with numerical data for three pleuronectids (Table 2). The visual representation for all 26 sequences clearly demonstrates differences for only one of two specimens of the genus Verasper, V. moseri (Figure 2). In this specimen, three amino acid sites are lost, which may result from an error by the authors during this mitogenome annotation or the SP ITOL [52], the online service itself; because when checking the sequence by the MitoAnnotator of the MitoFish online services and by GenBank itself, this sequence has the typical content of amino acid sites.

3.2. Analysis of Properties of Sequences

Shortly, the output information on the sequences analyzed by the DNAsp-5.10.02 software is listed as follows. Selected region: 1–11,401 bp, Number of sites: 11,401, Total number of sites (excluding sites with gaps/missing data): 11,400, Sites with alignment gaps or missing data: 1, Invariable (monomorphic) sites: 7200, Variable (polymorphic) sites: 4200 (Total number of mutations: 5729), Singleton variable sites: 457, Parsimony informative sites: 3743.
The ratio of pyrimidines (T, C) and purines (A, G) in aligned sequences deviated from the 50:50 ratio (Table S4) toward pyrimidines, thus indicating the heterogeneity of the composition of nucleotides with the predominance of C- and T-nucleotides (Table S4). The overall heterogeneity of nucleotide frequencies in each of the two sets (unaligned sequences and aligned) is significant: Wilk’s Lambda = 0.0054, F = 801, d.f. = 6; 380, p < 0.0001 (Table S4). The average values of nucleotide frequencies between the two sets of sequences do not differ significantly: Wilk’s Lambda = 0.9981, F = 0, d.f. = 6; 380, p < 0.9992. The proportion of G+C nucleotides varies in the range of 0.4024–0.5001 and totals G+Ctot = 0.46 ± 0.04, i.e., close to an expected value of 50% (Table S5; here and below, after the “±” sign, the standard errors of the mean values are given, SE). In this case, the proportions for the 13 coding sequences (G+Cc) and totals (G+Ctot) coincide, since the G+C proportion was not estimated for non-coding sequences (Table S5).
A general characterization of sequence variability for each of the 13 PCGs, including the analysis of 15 variables such as the number of variable sites (S), nucleotide diversity (π, for simplicity denoted as, Pi), etc., as well as the total values for these variables for PCGs, is presented in the Supplement table (Table S5). The data obtained indicate that, in general, the sequence variability of the 13 PCGs is quite high: the haplotype or gene diversity, Hd, varies between 13 PCG mitogenome sections in the range of 0.957–0.997, with a total value of Hd = 1; the number of variable sites, S, is rather large for the studied set of PCGs, S = 4200. The nucleotide diversity per site, Pi, which is the most representative measure of gene variability (Nei, 1987, equation 10.5), totaled to Pi = 0.12 (this is calculated value by DNAsp-5; Table S5). Our calculation of the average for this index based on data in Table S5 showed that Pi does not differ significantly between 13 PCGs: mean Pi = 0.12 ± 0.04. Tajima’s D values are negative for all 13 PCGs, with a total D value of −0.205, suggesting either cut-off or eliminative selection against non-synonymous substitutions (mutations). The possibility of such an interpretation of the data is evidenced by 2–3 times higher proportions of synonymous substitutions in codons, Pi(s), compared to non-synonymous ones, Pi(a): Pi(s) = 0.3450, while Pi(a) = 0.0536; thus, Pi(a)/Pi(s) ratio is 0.120. Recalculation of pairwise scores between all set of sequences in terms of distances or more precisely number of nucleotide substitutions (or segregating sites, K) Ks and Ka [53,54] (p. 219) yields similar to the above estimates of the range of variation but permit to evaluate approximately the degree of difference between these values: Ks = 0.4999 ± 0.0282 (n = 300, where n is the sample size) and Ka = 0.0536 ± 0.0097 (n = 300).
The genetic distances between intrageneric and intrafamily groups differ significantly (see discussion below in Section 3.3). Notably, the interspecies distance in the genus Pleuronichthys, which is represented by two specimens of Pleuronichthys cornutus and Pleuronichthys japonicus, the latter being considered a synonym of P. cornutus [55] is too large for intraspecific values.

3.3. Reconstruction of Gene Trees and Analysis of Molecular Phylogenetic Relationships

A generalized characterization of molecular phylogenetic relationships based on protein-coding gene (PCGs) sequences between the studied species of the Pleuronectidae and the chronology of divergence is presented, as noted earlier, for the 26 PCG sequences (Figure 2, Figure 3 and Figure 4). The topology of gene trees and the molecular systematics of the suborder Pleuronectoidei are considered separately also based on PGGs (Figure 5).

3.3.1. Molecular Phylogenetics and Dating of Divergence of Flounders of the Family Pleuronectidae

Reconstruction of molecular phylogenetic relationships based on the 26 PCGs of pleuronectids was performed using five different approaches: BA, ML, NJ, MP, and CA, as described in the Materials and Methods section. For brevity, reconstructions of gene trees visualized on the basis of the BA-tree and concordance of BA-inferred topology with other topologies represented by bootstrap support scores for nodes (Figure 3; BA-reconstruction using MrBayes 3.2.1–3.2.7 and ML-, NJ-, and MP-reconstructions using the MEGA-X software).
One other reconstruction of the topology of tree branches (nodes) based on CA of the 26 pleuronectids using BEAST-2 yields information that is completely congruent to the previous four depicted in Figure 3 (Figure S1, Supplement). A CA-analysis with divergence dating at the nodes of the gene tree is presented separately (Figure 4). The reconstructions based on the 26 PCG sequences show that the family Pleuronectidae has one highly supported node (100% for two variants of topology reconstruction, BA and ML) or monophyly, with the nearest close relative Paralichthys olivaceus from the family Paralichthyidae (more precisely, with representatives of its branch I; Figure 2, Figure 3 and Figure 4 and data of the next subsection). The internal topology includes three subfamilies and is well supported by all four methods in this case of tree reconstruction: Pleuronectinae, 92–100%, Hippoglossoidinae, 100%, and Hippoglossinae, 100% (Figure 3). It is important to note a very well-supported (100%) common, rather compact branch of the first two subfamilies (Figure 3). In addition to the tree topology data, the monophyly of the family Pleuronectidae is supported by the common structure of the mitogenome and the direction of genes’ location in the mitogenomes for all studied representatives, except one of the two specimens of V. moseri, which, as noted earlier, is rather due to a technical error in the description of one tRNA in this sequence (Figure 2).
Reconstruction of the time of divergence of phyletic lineages based on the sequences of 13 PCGs for the 26 representatives of taxa reveals an exact match of the gene tree topology with the previous four reconstructions given in Figure 2 and Figure 3 and yields a date of 32.293 Mya for the divergence of the family Pleuronectidae from the mrca, Paralichthys olivaceus (Figure 4). The common root of these two taxa is dated at 46.2 Mya and is calibrated to the time of divergence of the common ancestor of the Pleuronectidae-Paralichthyidae, that is, Paralichthodidae, as noted in the Materials and Methods section.
For building the tree depicted in Figure 4, special files with the sequence matrix (Fl26seq-pt8-11401-123ps4.nex; Table S1, Supplement) and the whole set of parameters that were used for tree simulation by CA of the constant population are used (Table S2, Supplement; File: Fl26seq-pt8-123ps4-tip-r24b1-n = 5E7-fix-pop-hm.xml). Table S2 in the supplementary file was built by BEAUti v2.6.6 utility of BEAST-2 software starting with exporting by BEAUti the file Fl26seq-pt8-11401-123ps4.nex. Basic model parameters could be read from this file using BEAUti v2.6.6. After running the main SP BEAST v2.6.6 utility implementing n = 5 × 10⁷ generations and other parameters necessary for appropriate simulation, sets of trees and other estimators were obtained; a brief description of the simulation procedure and parameters are given below for six items. The total number of trees was 50,002; 25,001 of them were used. So, 25,001 trees were processed after ignoring the first 50% = 25,000 trees. The final tree contained a total of 25 unique clades. A maximum credibility tree was constructed using TreeAnnotator v2.6.4 based on the file Fl26seq-pt8-11401-123ps4.trees (Table S3, Supplement) that are suitable for further processing in FigTree software, as recommended by the SP BEAST-2 creators. Properties of the quality of the model parameters for simulation were retrieved from several runs of Tracer v1.7.2 utility of SP BEAST-2. Principal files from Tracer for the simulation are placed in the Supplement in a special folder that includes .pdf- vs. .txt-files, and xml-file: Tracer_out_for_Fig4. The sequence partitions of the simulation run that was used for building Figure 4 and the main properties of the simulation schedule are as follows: (i) Sequence partitions of 26 specimens for all 13 PCGs are comprised main data set; details are implemented in the file Fl26seq-pt8-123ps4-tip-r24b1-n = 5E7-fix-pop-hm.xml (Table S2; Sequence partitions, see the menu folder) and can be viewed for inspection via BEAUti; (ii) Priors for the model of the Coalescent Constant Population are defined in the same file (Table S2; Priors); (iii) Tip dates are set numerically as scores of years for two calibration dates, 32.293 Mya vs. 46.19 Mya for mrca Pleuronectidae-Paralichthyidae as given above and three sequences were used: Paralichthys_olivaceus_AB028664 (age 4.619E7), Pleuronichthys_japonicus_KY038655 (age 2.783E), Pleuronichthys_cornutus_JQ639071 (age 2.783E7) (Table S2; Tip dates); (iv) Gamma Site Model is implemented for calculations (Table S2; Site Model: substitution rate = 2.0, G category count = 4, I = 0.477, shape = 1); (v) Clock Model is implemented by following options (Table S2; Relaxed Clock Exponential: Clock.rate = 2.0); (vi) mcmc setting is performed (Table S2; MCMC: Chain Length = 50000000). An independent analysis supports prior in the item (ii) indicating the appropriate choosing the model of the Coalescent Constant Population (Figure S4). Empirical data agreed with the expectation curve on constant population growth (changes) as depicted at miss-match distribution for 25 mitogenome sequences set of the Pleuronectidae flounders (Figure S4).
As noted above, the five tree building methods (BA, ML, NJ, MP, and CA) provide virtually the same topologies for the 26 pleuronectids when rotating branches within and between subfamilies in the images (Figure 2, Figure 3 and Figure 4). Data on the node ages in Figure 4 are fully concordant with data on the node probabilities and bootstrap supports given in Figure 3. Node ages for the sequences belonging to the same species do not differ judging on large sampling or standard errors (SEs), while ages for inter-genera (8–15 Mya), inter-subfamilies (21 Mya), and family (32 Mya) levels are more realistic (Figure 4). Other details on the tree lineage divergence estimated by the ultra-fast ML technique as implemented in SP IQTREE are given in Figure S1 and are provided in the Discussion section with the representation of confidence intervals for nodes/branches. In concluding the current section, we should emphasize the fine concordance of the five molecular genetic reconstructions with simulated lineage diversification in time.

3.3.2. Phylogenetic Relationships and Molecular Systematics of the Studied Representatives of the Suborder Pleuronectoidei

The main results of the molecular genetic reconstruction of the relationships between members of the suborder are shown in Figure 5
Family Pleuronectidae. According to the data of Section 2.1, the branches of three subfamilies Pleuronectinae, Hippoglossoidinae and Hippoglossinae are very well supported (100%) within the main representatives of the family (denoted as Pleuronectidae I) for all variants of tree reconstruction, with a separate external position of two members of the genus Pleuronichthys (Figure 5). The branch of species in the genus Limanda forms a common node with Cleisthenes pinetorum and Hippoglossoides platessoides, being placed in the subfamily Hippoglossoidinae (Figure 5). The species Colistium nudipinnis, Pelotretis flavilatus, and Peltorhamphus novaezeelandiae, formally belonging to the family Pleuronectidae (Pleuronectidae II), form a common branch with Neoachiropsetta milfordi from the family Achiropsettidae (Figure 5). These four species, in turn, form a single branch with members of the family Scophthalmidae (Figure 5).
Pleuronichhyinae branch. The divergence between Pleuronicthys cornutus (JQ639071) and Pleuronicthys japonicus (KY038655) are thought to have diverged around 6.5–13 Mya (Figure 4). As noted above, according to a recent revision [55] the current status of P. japonicus is defined as being a synonym of P. cornutus (Official status of Pleuronicthys japonicus: Synonym of Pleuronicthys cornutus (Temminck & Schlegel 1846). Basic taxa are Pleuronectidae: Pleuronichhyinae. Distribution: Sea of Japan and Pacific coast of Japan, to the southern East China Sea and the Seto Inland Sea [if valid]; CAS–Eschmeye’s Catalog of Fishes: Species; calacademy.org)). However, the above divergence dates and genetic distances for this pair are greater than some of the interspecies values (Tables S6 and S7). This is clearly evident for the genus Verasper data and for other taxa of the family Pleuronectidae (Figure 4). However, the confidence intervals for the divergence times overlap significantly (Supplement, Figure S1), hindering reliable interpretation.
Family Paralichthyidae. This group forms by two separate branches, Paralichthyidae I and Paralichthyidae II, i.e., is basically polyphyletic (Figure 5). Paralichthyidae I, as noted above, comprises the external branch to the Pleuronectidae with high levels of support (100%) for three of the four building techniques for the common node (Figure 5). The inner node for P. adspersus is not well-supported (Figure 5).
Family Cynoglossidae. This group is basically polyphyletic, as it is made up of two different branches, Cynoglossidae (I) and Cynoglossidae (II) (Figure 5). The primary branch, Cynoglossidae (I), is strongly supported by four tree-building techniques in this case with a single root, i.e., being monophyletic, but it is divided into two subdivisions, one of which contains partially African roots (Figure 5). The family Achiridae branch is attached as an external branch to the main branch of the family Cynoglossidae (I) (Figure 5). The branch of two representatives of the genus Symphurus, which is included in a separate paraphyletic branch of the family Cynoglossidae (II), forms a separate node with the family Samaridae. This complex of taxa constitutes the outer branch for the entire suborder, and is located immediately before members of the outgroup (Figure 5).
Family Citharidae. In all our reconstructions this group does not form a well-supported branch external to the family Pleuronectidae (Figure 5). According to the data presented, Psettodes erumei from the family Psettodidae forms a mixed cluster with the family Citharidae (Figure 5). However, the support levels for this node of topology are not high (60–70%) that require new investigation on this point in the future.
Family Bothidae. In all four reconstructions, this group forms well-supported branch with a variety of genera, with an external and also sharp branch comprised of Cyclopsetta fimbriata (Figure 5). The genus Arnoglossus is paraphyletic; one of its members, A. polyspilus, constitutes a common branch with a member of the genus Lophonectes, while another species, such as A. tenuis, forms a separate branch combined with the genus Crossorhombus. Cyclopsetta fimbriata which currently represents the family Paralichthyidae II, is an external and also sharp branch of the family Bothidae (Figure 5).

4. Discussion

4.1. The Structure and Variability of Mitogenome Yellow-Stripe Flounder Pseudopleuronectes Herzensteini and Other Studied Representatives of the Family Pleuronectidae

The structure of the mitogenome described herein (Figure 1) is the same as in other Teleosts; the mitogenome has a CR with a replication origin, 13 PCGs, two rRNA genes, and 22 tRNA genes [56,57,58]. These data, in combination with the signal on the topology of threes including ND6 gene usage and without it, which did not find topology differences [16], allow us to use all 13 PCGs in phylogenetic reconstructions in this paper. The total estimates of synonymous and non-synonymous substitutions in codons were: Pi(s) = 0.3450 and Pi(a) = 0.0536. The assessment of the degree of this difference could be calculated somewhat differently, for Ks and Ka or pairwise values between all sequence variants [54]. Such estimation, for pairwise estimates of the degree of difference between all sequence variants, showed that the variation rows of these values do not overlap: Ks = 0.4999 ± 0.0282 (n = 300), Ka = 0.0536 ± 0.0097 (n = 300) and that the Ka/Ks ratio is 0.122. A Student’s t-test revealed the statistical significance of the difference between the mean values of Ks and Ka: tKs/Ka = (0.4999 − 0.0536)/√(0.02822 + 0.00972) = 14.88, d.f. = 598, p < 0.001. However, selective neutrality testing of variability of 13 PCG using SP DNAsp did not reveal significant deviations: Tajima’s D = −0.20499, p > 0.10 (Statistical significance: Not significant, NS); test statistic Fu and Li’s D* = 0.62300, p > 0.10 (NS); test statistic Fu and Li’s F* = 0.41880, p > 0.10 (NS). Testing for the neutrality of PCGs of intraspecific clusters of three available different species gives a similar result: p > 0.10 (NS). That is, in accordance with the widely accepted [54] and logical hypothesis of natural cutoff selection, which acts against nucleotide substitutions in codons (deleterious mutations) leading to less active (ineffective) macromolecules. In other words, data on the significance tKs/Ka might be the evidence for a normalizing selection acting against mutations with a phenotypic effect in mtDNA sequences. This effect was derived from the relatively homogeneous material of PCG sequences of flounders of a single family. Unfortunately, one test of our data supported the hypothesis, while another did not. The proof appears to be insufficient.

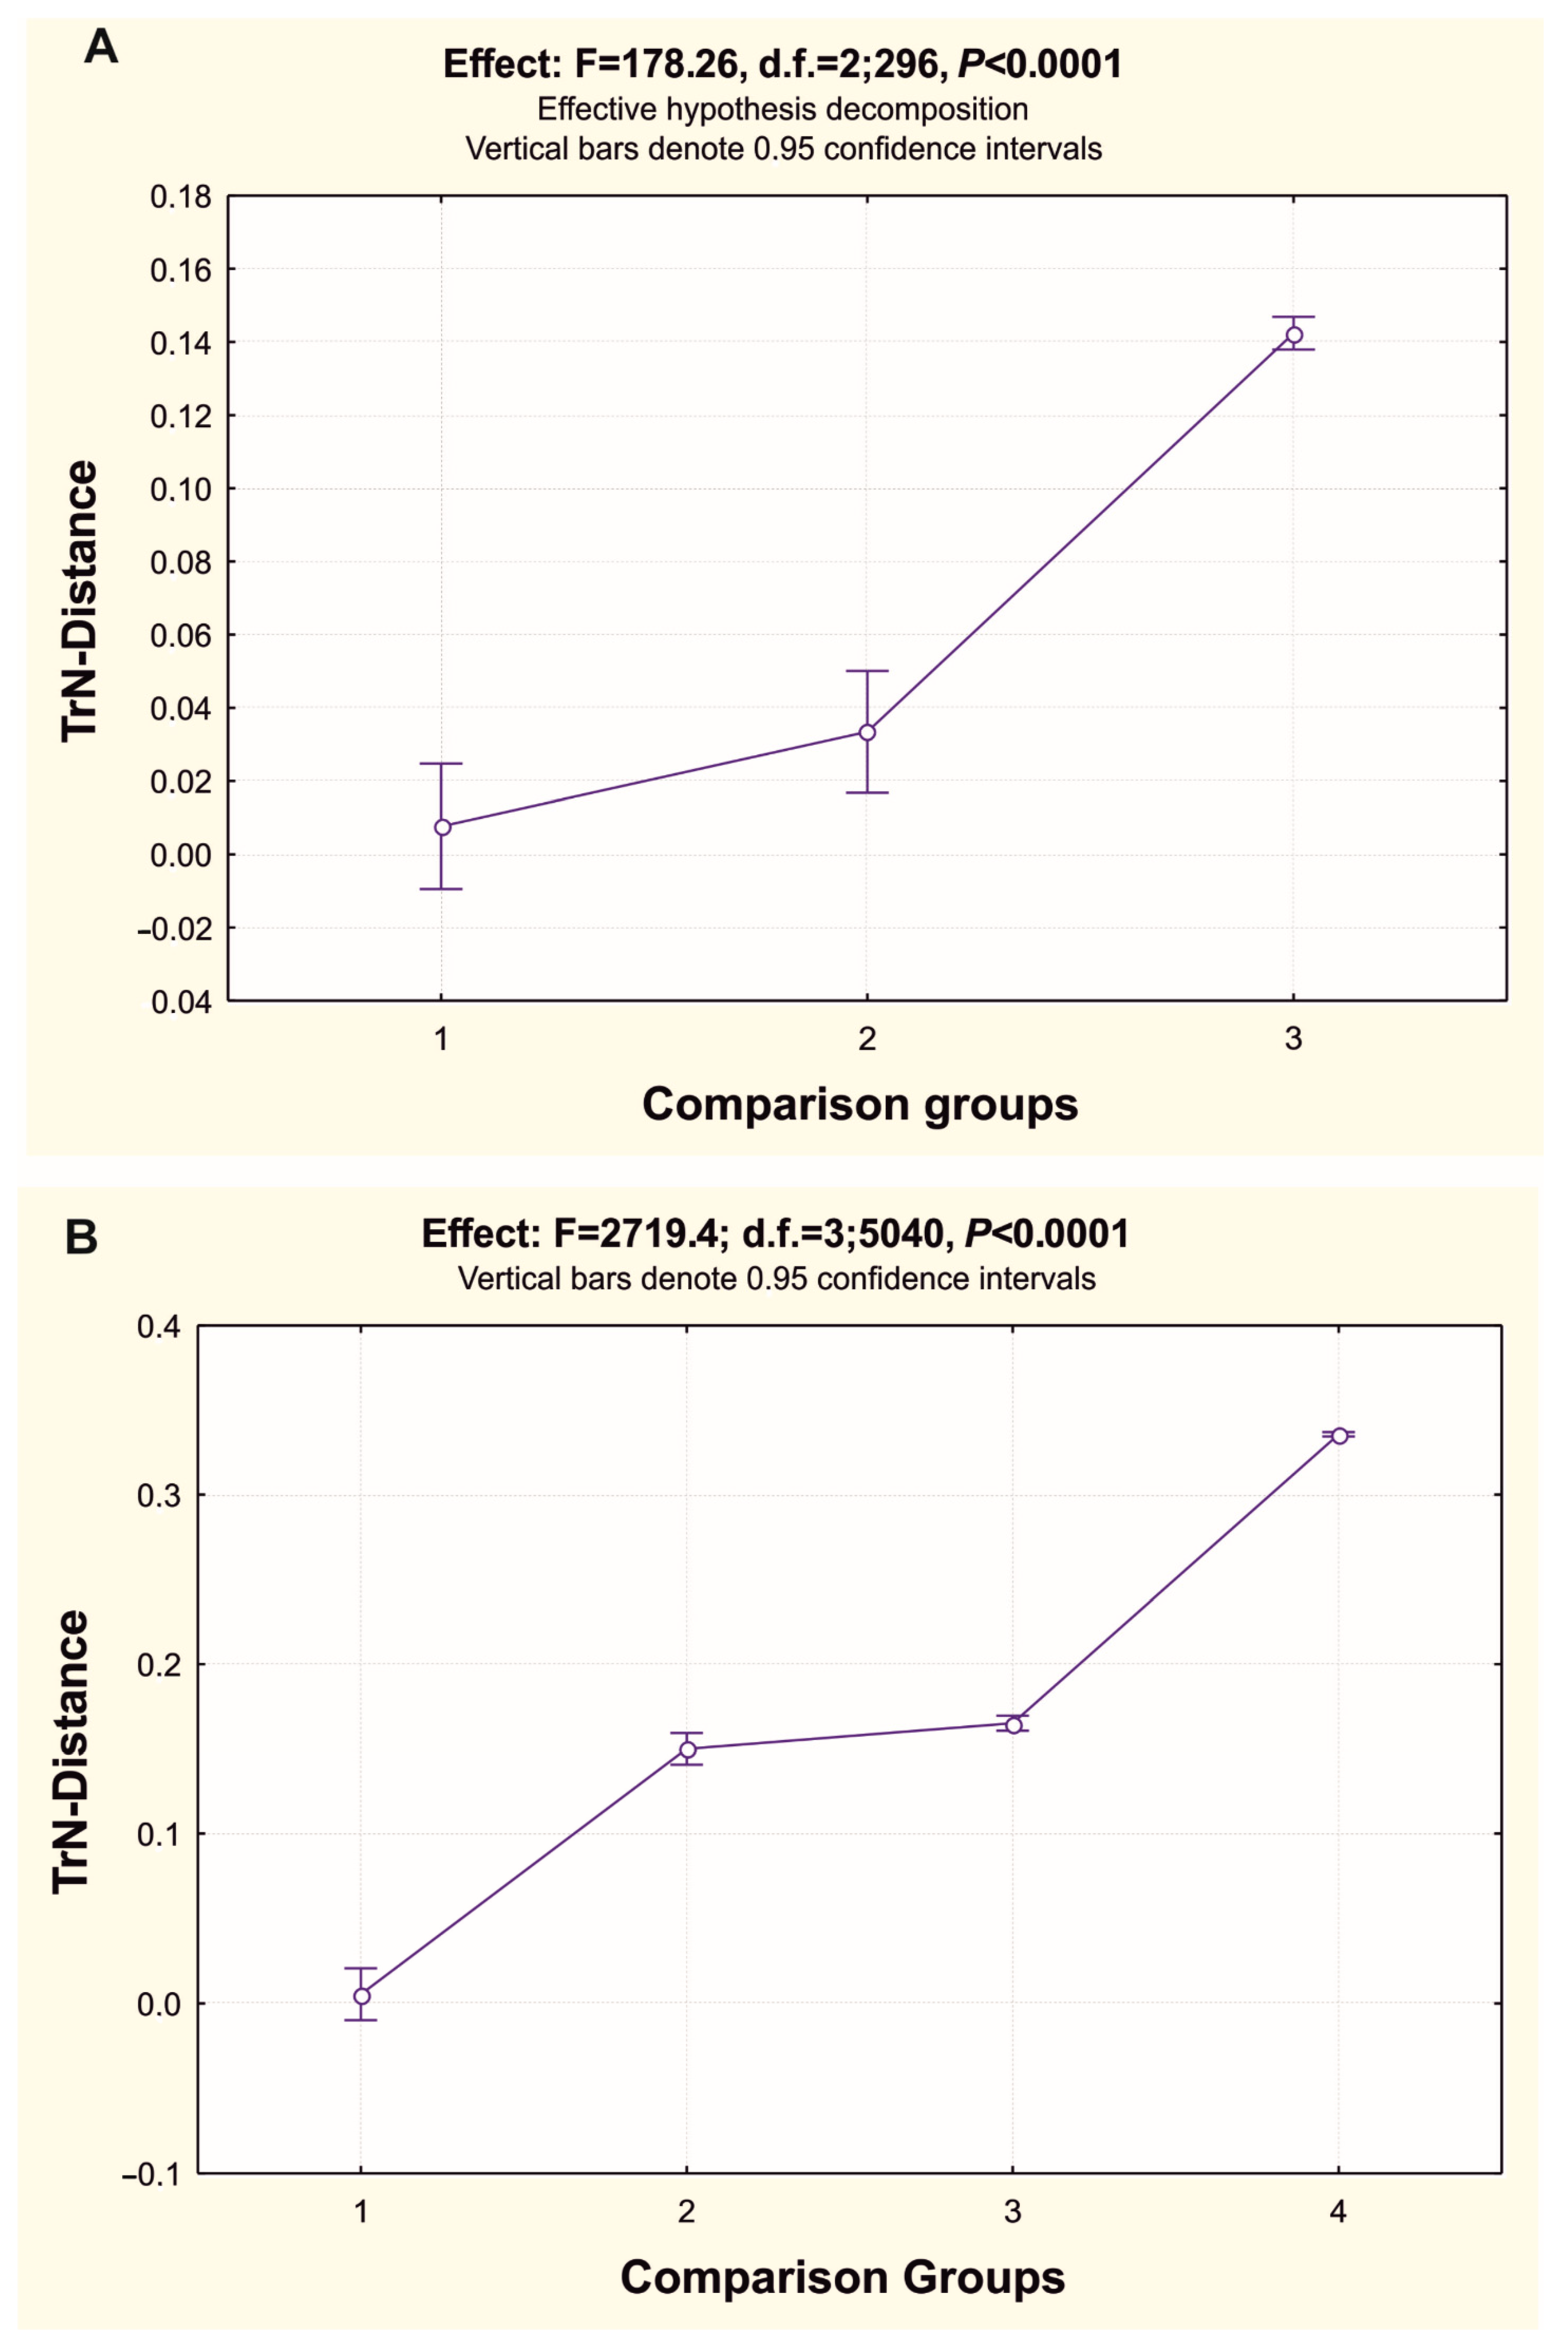
4.2. Gene tree Topology Analysis of the Molecular Phylogenetic Relationships in the Family Pleuronectidae and in the Suborder Pleuronectoidei, and Levels of Genetic Divergence in the Hierarchy of Evolutionary Units (Populations of Species and Ranked Taxa)

Family Pleuronectidae

Topological and chronological reconstructions for the family Pleuronectidae are well supported by various methods, as demonstrated in the Results (see Figure 2, Figure 3, Figure 4 and Figure 5, Figure S1, Supplement), and are consistent with relatively recent publications on molecular phylogenetics of flatfish [11,12,13,16,59]. Divergence dates obtained from simulation and CA-analysis in the BEAST-2 software, both visualized in the traditional format (Figure 4, Figure S1, Supplement) and via a DensiTree2.6.4 utility of BEAST-2 software in a more modern representation of phylogenetic relationships (Figure 6), indicate the origin of the main branch of the family Pleuronectidae I from a common ancestor with Paralichthyidae I (represented in this case by P. olivaceus) at about 32 million years ago. The previously reported data from a joint analysis of molecular divergence, combined with morphological and paleontological data [11,13], convincingly prove the reliability of this conclusion. There is a very close dating of 42.7–49.4 Mya for similar taxa [60], which, taking into account the topological and time estimation errors (see Figure 4 and Figure 6), coincides with the value presented in our work. The diversification of flounders of Pleuronectidae I occurred from ancestors from the Indo-West Pacific basin, and it was followed by two stages of migration and geographic radiation of the modern Pleuronectidae I species in the northeastern Atlantic and northern Pacific basins [13]. At the end of the Results section, significant differences in the time of divergence of taxa of the species rank are reported. Unfortunately, large sampling errors (Figure 4 and Figure 6) prohibit broad conclusions on the chronology of diversification within the Pleuronectidae I. This will be a task for future research based on a more representative sample of genes and taxa. However, intraspecific differences in the level of divergence, taking into account 95% HPDs of some taxa, differ significantly (see Figure 4). Moreover, for a pair of members of the genus Pleuronichthys, the differences from others in intraspecific divergence are so great that no doubt is left concerning their at least species rank, in contrast to the introduced synonymizing to single species (CAS—Eschmeyer’s Catalog of Fishes: Species; calacademy.org).
Our independent analysis of the genetic distances (TrN-distances) of 13 PCGs of 25 sequences of mitogenomes for (1) intraspecific comparisons, (2) interspecific comparisons within genera, and (3) intergeneric comparisons within the family Pleuronectidae revealed statistically significant differences for all three groups (Figure 7A). However, the data presented in Figure 7A also demonstrate a strong overlap of the average distances for groups 1 and 2, supporting the above doubt about the validity of combining two taxa, P. cornutus–P. japonicus, into one species, Pleuronicthys cornutus. These data convincingly show a slightly lower (although non-significant, p > 0.05) interspecific divergence of mitogenomes in the flounder genera of the Pleuronectidae, compared with other animals. This is based on two estimates from which the distances were estimated in the three comparison groups. Thus, for the Pleuronectidae flounders the TrN-distances are: 0.76 ± 0.87%, (2) 3.34 ± 0.85%, (3) 14.24 ± 0.23% (Figure 7A; F = 176.26, d.f. = 2; 296, p < 0.0001); for representatives of eight different groups of animals, the p-distance values were for three corresponding comparison groups: (1) 0.79 ± 0.04%, (2) 8.23 ± 0.22%, (3) 16.47 ± 0.29% [61] (Arthropods, Chordates, Echinoderms, Flatworms, Mollusks, Nematodes, Segmented worms, and Sponges included). Divergence values similar to those of flounders were reported in another review of whole mitogenome coding genes for two comparison groups in five different taxa of animals: (1) 0.92 ± 0.94%, (2) 4.64 ± 1.90% [62] (our approximate numerical estimate of K2P-distances from Figure 3 of the authors). Values obtained in the current study for PCGs of four comparison groups of all studied members of the suborder Pleuronectoidei are as follow: (1) 0.54 ± 0.78%, (2) 14.99 ± 0.48%, (3) 16.51 ± 0.22%, (4) 33.57 ± 0.07% (Figure 7B; comparison groups are representing four different hierarchies of the suborder taxa; F = 2719.4, d.f. = 3; 5040, p < 0.0001). Evidently, interspecies estimates of distances within genera (group 2) in above cases including the p-, K2P- and TrN-distance measures vary from 4–8% to 15%. As we revealed, minimal differences for flatfish between comparison groups 1 vs. 2 (Figure 7А) and 2 vs. 3 (Figure 7В), could create difficulties in determining molecular genetic delimitation of species, and obscure the systematics of this fish taxon. We will come once more to the latter matter in the ongoing paragraphs below.
The genetic divergence in the comparison groups (within species and in the hierarchy of taxa) for individual genes [59,61,63,64,65,66] corresponds well to divergence estimates based on mitogenomes [61,62,67,68,69]. As estimated elsewhere, distance estimates by different models including simple p-distance below 15–17% correspond with other measures and are consistent with simulated expectations based on random drift with time [63,70,71]. Thus, the sequences of individual mtDNA genes, such as COI, Cyt-b, 16S rRNA, quite well represent the divergence inferred from the analysis of complete mitogenomes or their PCGs. Furthermore, the near linear relationship of genetic divergence and the hierarchy of comparison groups (taxa) that was found for both mtDNA (Figure 7A,B and the above-cited works) and nDNA genes [68,69,72] supports at the molecular level, the current evolutionary paradigm: the Synthetic Theory of Evolution (STE) or Neo-Darwinism. This is well compatible with the predominance of the geographic model of speciation in nature [61,66,69].
This conclusion is critically important for understanding the fundamental mechanisms of speciation within the realm of evolutionary biology and evolutionary genetics [62,64,65,66]. Furthermore, our conclusions aid in practical needs such as identifying specimens in systematics, within the activity in international programs for biodiversity deciphering, e.g., iBOL [73], as well as in the fields of biomedicine and trade, where current erroneous identification (accidental or intentional) can lead to significant economic loss, both public and private [62,68,74,75]. This is far from being a complete list of applications of the approach we used in this study [61,68,69,73,76].
Below, we discuss the taxonomy of flounders from the standpoint of tree topologies. As noted above in Section 2.1 and evident in the tree topologies in Figure 3, members of the genus Limanda are included in the branch of the subfamily Hippoglossoidinae. A comparative anatomical study by Cooper and Chapleau (1998) did not confirm the monophyly of this genus within the family Pleuronectidae. In our study, as in other molecular phylogenetic investigations [8,11,16,59,77], some representatives of the genus Limanda were definitely placed in the subfamily Hippoglossoidinae, and some of them were included in the subfamily Pleuronectinae. Therefore, it is appropriate, following the opinion by Cooper and Chapleau [2] on L. sakhalinensis and our observations, to recommend a revision of the family and three of its genera, establishing a new taxon of a tribe rank Hippoglossoidini, and including in it the representatives of Far Eastern Limanda, as well as the genera Cleisthenes and Hippoglossoides, leaving the latter in the subfamily Hippoglossoidinae. Such a transformation is consistent with molecular genetic data on several mitochondrial and nuclear genes [11,16,59].
The interpretation of the topology and system of the family Pleuronectidae is generally similar to interpretations presented in previous studies [10,11,13,23,24,59,69,78]. According to the data presented above (see Figure 2, Figure 3, Figure 4, Figure 5 and Figure 6), as well as other reconstructions based on fast ML algorithms and complex models that take into account most demands to tree building, like gene partitions and nucleotide substitutions models using PhyloSuite software and its ultra-fast IQ-TREE utility (implementing the ultrafast bootstrap approximation results) (Figure S3, Supplement), the monophyly of the main branch of the family (Pleuronectidae I) is well-supported and agrees with other data [11,13,16,24,59,60]. Representatives of Pleuronectidae II (see Figure 5) are combined into a well-supported branch together with species of the family Scophthalmidae and a representative of the Achropsettidae, which certainly requires further analysis for disproving or support, and then giving taxonomic revision. The latter idea of placing Psettus-like flounders into separate suborder Psettoidei has already been put forward on the basis of valid data for a different set of taxa and markers, including nDNA sequences [13,78].
The topology of the gene tree of the entire suborder (Figure 5) is similar to the topology in some other studies [12,13,16,24] etc. However, there are clear differences since investigators used different markers, particularly in our case, only protein-coding regions of mtDNA. Moreover, in addition to the properties of genes and the informative capacity of sequences, also of importance are methods of analysis, how representative the species sampled within their taxa are, the degree of heterochrony of phyletic lineages for selected genes, and environmental and other factors [12,13,79], etc. The results presented in the paper are convincing evidence that the heterogeneity of the studied sequences, representing the phyletic lineages of flounders, were not responsible for any substantial errors in the molecular phylogenetic reconstructions in this work. The high congruence of tree topologies (similar support for most nodes) obtained using four methods of reconstruction for the suborder and five methods for the family Pleuronectidae (see Figure 2, Figure 3, Figure 4, Figure 5 and Figure 6, Figures S1, S2, and S5) points to the representativeness of the molecular phylogenetic reconstructions for the taxa discussed. Additional information about the sufficient compactness of the studied mitogenomes was obtained from estimates of the compositional distance (bias) in the sequences (Figure S5; numbers below the branches of the ML tree).
In addition to this conclusion, the values of the compositional distance for the two nominal taxa in the genus Pleuronichthys, which stand out in the within species range, confirm their reassignment to species rank. All the data concerning the structural conservatism of most of the analyzed mitogenomes (see Figure 2, Table 2, and the corresponding paragraphs in the context) indicate the validity of the evolutionary signal presented in this study and its significance for the taxonomy of the family Pleuronectidae and partly for the entire suborder. An important point for such reasoning is the saturation effect among the mitogenome sequences in our investigation for flounders that was calculated. Nucleotide composition saturation was firstly evaluated by comparing the Iss and Iss.c indices for the 26 mitogenomes of the family Pleuronectidae (Iss = 0.8021, Iss.c = 0.8463, t = 18.2051, d.f. = 5977, p < 0.0001; two-sided t-test, SP DAMBI [80,81]; significant differences between Iss and Iss.c define the absence of composition saturation and its impact on topology signal). For the suborder, Pleuronectoidei similar results were obtained on the 13 PCGs of 108 representatives (Table S8). For other flatfish mitogenomes, there is the study of the saturation of the nucleotide composition that involved a different, wider set of representatives of the order [12]. Thus, neither our findings nor literature sources [12] indicated any significant influence of nucleotide composition saturation on the topology at the family and even suborder/order level.
The data support a close-to-linear relationship between genetic distances and taxon rank for mitogenomes (Figure 7) [61,62,67,68,69] and individual genes of not only mtDNA but also nuclear DNA for a vast set of taxa [62,64,65,66,69,72]. To clarify the system of the suborder and individual families, a great deal of research is still required. This obviously follows from the paraphyletic nature of a number of branches denoted by duplication of the family names: Pleuronectidae I and II, Paralichthyidae I and II, etc. (see Figure 5), as was also noted earlier for these and other taxa [13], Figure 1. In our study, members of Pleuronichthys occupy a separate position relative to other members of the family, being an external branch and uniting with Paralichthys olivaceus, which was used as an external taxon for the family Pleuronectidae (see Figure 2, Figure 3, Figure 4, Figure 5 and Figure 6, Figures S1, S2, and S5). These data support the recently advanced (CAS—Eschmeyer’s Catalog of Fishes: Genera (calacademy.org)) idea of creating an independent pleuronichthoid subfamily, the Pleuronichthyinae, in contrast to the traditional view [82]. Nevertheless, the monophyly of the family Pleuronectidae and most of Pleuronectoidei leaves no serious doubt, despite the weak support for the monophyly of the suborder Pleuronectoidei, 22–46% in 18 out of 23 different assessments of mitogenome signal for the pattern marker’s combinations given in Figure 1 and Table 1 [13] and in other references [8,11,12,59,77].
The data shown in the Results section and discussed in the previous paragraph demonstrate the reliability of the gene tree topology and molecular phylogenetic reconstructions in our study. This view is based on the consistency of several tree reconstruction methodologies, as well as their analytic algorithms and numerical simulations. We did not include any topology restrictions or the influence of markers’ mitogenome partitions on the phylogenetic signal in the analysis, with the exception of outgroup (however, gene partitions and accounting for nucleotide positions in codons were used in BA- and ML-techniques in some SP, as explained in the Material and Methods section), as was conducted, for example, in [14] Table 1 and Table 2. Our findings on tree topology for the family Pleuronectidae and the suborder Pleuronectoidei, on the other hand, were consistent with the above-mentioned article. Consistent with Campbell and colleagues [12] Table 1, no serious discrepancies between topologies were observed during phylogenetic reconstructions that were completed with and without gene partitions and positions of nucleotides in codons (these data are not presented in the paper). This paper, as well as other recent works [78,83,84] suggest that, the compactness and composition within the Pleuronectoidei/Pleuronectiformes remain unresolved. E.g., in our observation, despite clustering with the family Citharidae (Figure 5), Psettodes ereumei is currently attributed to the family Psettodidae (CAS—Eschmeyer’s Catalog of Fishes: Genera (calacademy.org)) and placed in the suborder Pleuronectoidei according to some other molecular genetic evaluations [12,84], that were consistent with our own low-level support for this topology node as noted before.

Supplementary Materials

The following supporting information can be downloaded at: https://www.mdpi.com/article/10.3390/d14100805/s1, Figure S1: BEAST-2 and FigTree topology reconstruction based on 13 PCG-sequences of 26 analyzed flounder representatives of the family Pleuronectidae with posterior probabilities implemented. Figure S2: The phylogram built by PhyloSiut software and its IQ-TREE utility for gene tree reconstruction based on 13 PCG-sequences of 26 analyzed flounder representatives of the family Pleuronectidae with the out-group taxon Paralichthys olivaceus. Figure S3: Plot of the distribution on nucleotide diversity per site (Pi) along the whole length at 13 PCGs of flatfish mitogenome in Pleuronectidae. On the Y-axis the diversity scores are given, Pi. The red line presents Pi variation at nucleotide positions along DNA chain, X-axis. Figure S4: Plot of pairwise differences for 13 PCGs of flatfish mitogenome in the family Pleuronectidae. On Y-axis the frequency of pairwise differences for 12 sliding windows of divergence estimates are given. On X-axis with the red lines the observed scores of k presented. With green line shows the expected distribution for k. The average number of pairwise differences comprised, k = 1440.113. Figure S5: The phylogram built by MEGA-X software and its utility for ML-gene tree reconstruction based on 13 PCG-sequences of 26 analyzed flounder representatives of the family Pleuronectidae with the out-group taxon Paralichthys olivaceus; Table S1: Supplement File: Fl26seq-pt8-11401-123ps4.nex; Table S2: Supplement File: Fl26seq-pt8-123ps4-tip-r24b1-n=5E7-fix-pop-hm.xml; Table S3: Supplement File: Fl26seq-pt8-11401-123ps4.trees; Table S4: Nucleotide content of 25 mitogenome sequences of PCGs among Pleuronectidae; Table S5: Perdomain diversity and DNA varion data for 13 PCGs of 25 selected mitogenome sequences among representatives of Pleuronectidae family; Table S6: TrN-distance-mtx-13PCRs-Pleuronectidae-taxa-ranked; Table S7: TrN-distance-mtx-13PCGs-suborder-Pleuronectoidei-taxa-ranked; Table S8: Test of substitution saturation for Pleuronectoidei PCGs mitogenome sequences.

Author Contributions

Conceptualization, the authors are solely responsible for the content and the writing of this paper. Y.P.K. made an impact in all sections of the research: planning, funding, specimen’s collection, data analysis, MS writing, etc. A.D.R. took part in specimen’s collection, sequencing and work with GenBank, data analysis, MS writing. Methodology, Y.P.K. made an impact in it. Software, Y.P.K. and A.D.R. made a nearly equal impact in it. Validation, Y.P.K. and A.D.R. made a nearly equal impact in it. Formal analysis, Y.P.K. and A.D.R. made a nearly equal impact in it. Investigation, A.D.R. took part in specimen’s collection, sequencing and work with GenBank, data analysis, mostly for Pleuronectoidei, while Y.P.K. have impact mostly in this par to Pleuronectidae. Resources, Y.P.K. made most impact in it. Data curation, Y.P.K. made most impact in it. Writing—original draft preparation, Y.P.K. and A.D.R. made a nearly equal impact in it. Writing—review and editing, Y.P.K. made most impact in it. Supervision, Y.P.K. made most impact in it. Project administration and funding acquisition, Y.P.K. made most impact in it. All authors have read and agreed to the published version of the manuscript.

Funding

This research was supported by the Ministry of Science and Higher Education of the Russian Federation in the framework of the Federal Project #13.1902.21.0012 “Basic problems in the research and conservation of deep-water ecosystems…” (agreement no. 075-15-2020-796).

Institutional Review Board Statement

Not applicable.

Data Availability Statement

Data supporting reported results can be found in the Supplement and resources that given there, including links to publicly archived datasets analyzed or generated during the study.

Acknowledgments

Our thanks to J. Eimes, K. Saitoh for MS proofreading and advises. We like send our sincere gratitude to S.V. Turanov for sequencing support.

Conflicts of Interest

The authors have no conflicts of interest to declare.

References

  1. Keast, A.; Chapleau, F. A phylogenetic reassessment of the monophyletic status of the family Soleidae, with comments on the suborder Soleoidei (Pisces; Pleuronectiformes). Can. J. Zool. 1988, 66, 2797–2810. [Google Scholar] [CrossRef]
  2. Cooper, J.A.; Chapleau, F. Monophyly and intrarelationships of the family Pleuronectidae (Pleuronectiformes), with a revised classification. Fish. Bull. 1998, 96, 686–726. [Google Scholar]
  3. Norman, I.R. A Systematic Monograph of the Flatfishes (Heterosomata). Volume I. Psettodidae, Bothidae, Pleuronectidae; British Museum: London, UK, 1934; 459p. [Google Scholar]
  4. Sakamoto, K. Interrelationships of the family Pleuronectidae (Pisces: Pleuronectiformes). In Memoirs of the Faculty of Fisheries, Hokkaido University; Hokkaido University: Sapporo, Japan, 1984; Volume 31, pp. 95–215. [Google Scholar]
  5. Lindberg, G.U.; Fedorov, V.V. Fishes of Japan Sea and Nearby Parts of Okhotsk and Yellow Seas. Part 6. Teleostomi. Osteichthyes. Actinopterigii. XXXI. Pleuronectiformes; Sankt-Petersburg University Press: Sankt-Petersburg, Russia, 1993; p. 272. [Google Scholar]
  6. Chapleau, F. Pleuronectiform relationships: A cladistic reassessment. Bull. Mar. Sci. 1993, 52, 516–540. [Google Scholar]
  7. Vernau, O.; Moreau, C.; Catzeflis, F.M.; Renaud, F. Phylogeny of flatfishes (Pleuronectiformes): Comparisons and contradictions of molecular and morpho-anatomical data. J. Fish Biol. 1994, 45, 685–696. [Google Scholar] [CrossRef]
  8. Kartavtsev, Y.P.; Park, T.-J.; Vinnikov, K.A.; Ivankov, V.N.; Sharina, S.N.; Lee, J.-S. Cytochrome b (Cyt-b) gene sequence analysis in six flatfish species (Teleostei, Pleuronectidae), with phylogenetic and taxonomic insights. Mar. Biol. 2007, 152, 757–773. [Google Scholar] [CrossRef]
  9. Betancur-R, R.; Broughton, R.E.; Wiley, E.O.; Carpenter, K.; López, J.A.; Li, C.; Holcroft, N.I.; Arcila, D.; Sanciangco, M.; Cureton, J.C., II; et al. The tree of life and a new classification of bony fishes. PLoS Curr. 2013, 5. [Google Scholar] [CrossRef]
  10. Betancur-R, R.; Li, C.; Munroe, T.A.; Ballesteros, J.A.; Ortí, G. Addressing gene tree discordance and non-stationarity to resolve a multi-locus phylogeny of the flatfishes (Teleostei: Pleuronectiformes). Syst. Biol. 2013, 62, 763–785. [Google Scholar] [CrossRef]
  11. Vinnikov, K.A.; Thomson, R.C.; Munroe, T.A. Revised classification of the righteye flounders (Teleostei: Pleuronectidae) based on multilocus phylogeny with complete taxon sampling. Mol. Phylogenet. Evol. 2018, 125, 147–162. [Google Scholar] [CrossRef]
  12. Campbell, M.A.; López, J.A.; Satoh, T.P.; Chen, W.J.; Miya, M. Mitochondrial genomic investigation of flatfish monophyly. Gene 2014, 551, 176–182. [Google Scholar] [CrossRef]
  13. Campbell, M.A.; Chanet, B.; Chen, J.-N.; Lee, M.-Y. Origins and relationships of the Pleuronectoidei: Molecular and morphological analysis of living and fossil taxa. Zool. Scr. 2019, 48, 640–656. [Google Scholar] [CrossRef]
  14. Amaoka, K. Studies on the sinistral flounder found in the waters around Japan. Taxonomy, anatomy, and phylogeny. Shimonoseki Univ. Fish. 1969, 18, 65–340. [Google Scholar]
  15. Chabanaud, P. Le problème de la phylogénèse des Heterosomata. Bull. De L’institut Océanographique De Monaco 1949, 950, 1–24. [Google Scholar]
  16. Kartavtsev, Y.P.; Sharina, S.N.; Saitoh, K.; Imoto, J.M.; Hanzawa, N.; Redin, A.D. Phylogenetic relationships of Russian Far Eastern Flatfish (Pleuronectiformes, Pleuronectidae) based on two mitochondrial gene sequences, Co-1 and Cyt-b, with inferences in order phylogeny using complete mitogenome data. Mitochondrial DNA 2014, 27, 667–678. [Google Scholar] [CrossRef] [PubMed]
  17. Chen, W.-J.; Bonillo, C.; Lecointre, G. Repeatability of clades as a criterion of reliability: A case study for molecular phylogeny of Acanthomorpha (Teleostei) with larger number of taxa. Mol. Phylogenet. Evol. 2003, 26, 262–288. [Google Scholar] [CrossRef]
  18. Dettai, A.; Lecointre, G. Further support for the clades obtained by multiple molecular phylogenies in the acanthomorph bush. Comptes Rendus Biol. 2005, 328, 674–689. [Google Scholar] [CrossRef] [PubMed]
  19. Smith, W.L.; Wheeler, W.C. Venom evolution widespread in fishes: A phylogenetic road map for the bioprospecting of piscine venoms. J. Hered. 2006, 97, 206–217. [Google Scholar] [CrossRef]
  20. Li, B.; Dettaï, A.; Cruaud, C.; Couloux, A.; Desoutter-Meniger, M.; Lecointre, G. RNF213, a new nuclear marker for acanthomorph phylogeny. Mol. Phylogenet. Evol. 2009, 50, 345–363. [Google Scholar] [CrossRef]
  21. Near, T.J.; Eytan, R.I.; Dornburg, A.; Kuhn, K.L.; Moore, J.A.; Davis, M.P.; Wainwright, P.C.; Friedman, M.; Smith, W.L. Resolution of ray-finned fish phylogeny and timing of diversification. Proc. Natl. Acad. Sci. USA 2012, 109, 13698–13703. [Google Scholar] [CrossRef]
  22. Near, T.J.; Dornburg, A.; Eytan, R.I.; Keck, B.P.; Smith, W.L.; Kuhn, K.L.; Moore, J.A.; Price, S.A.; Burbrink, F.T.; Friedman, M.; et al. Phylogeny and tempo of diversification in the superradiation of spiny-rayed fishes. Proc. Natl. Acad. Sci. USA 2013, 110, 12738–12743. [Google Scholar] [CrossRef]
  23. Campbell, M.A.; Chen, W.-J.; López, J.A. Are flatfishes (Pleuronectiformes) monophyletic? Mol. Phylogenet. Evol. 2013, 69, 664–673. [Google Scholar] [CrossRef]
  24. Betancur-R, R.; Ortí, G. Molecular evidence for the monophyly of flatfishes (Carangimorpharia: Pleuronectiformes). Mol. Phylogenet. Evol. 2014, 73, 18–22. [Google Scholar] [CrossRef] [PubMed]
  25. Nei, M. Molecular Evolutionary Genetics; Columbia University Press: New York, NY, USA, 1987; 512p. [Google Scholar]
  26. Felsenstein, J. Inferring Phylogenies; Sinauer Associates, Inc.: Sunderland, MA, USA, 2004. [Google Scholar]
  27. Charlesworth, B. Effective population size and patterns of molecular evolution and variation. Nat. Rev. Genet. 2009, 10, 195–205. [Google Scholar] [CrossRef] [PubMed]
  28. GenBank NCBI. National Center for Biotechnology Information. Available online: https://www.ncbi.nlm.nih.gov/ (accessed on 1 January 2021).
  29. Dierckxsens, N.; Mardulyn, P.; Smits, G. NOVOPlasty: De novo assembly of organelle genomes from whole genome data. Nucleic Acids Res. 2016, 45, e18. [Google Scholar] [CrossRef]
  30. Iwasaki, W.; Fukunaga, T.; Isagozawa, R.; Yamada, K.; Maeda, Y.; Satoh, T.P.; Sado, T.; Mabuchi, K.; Takeshima, H.; Miya, M.; et al. MitoFish and MitoAnnotator: A Mitochondrial Genome Database of Fish with an Accurate and Automatic Annotation Pipeline. Mol. Biol. Evol. 2013, 30, 2531–2540. [Google Scholar] [CrossRef] [Green Version]
  31. Rozas, J.; Sánchez-DelBarrio, J.C.; Messegyer, X.; Rozas, R. DnaSP, DNA polymorphism analyses by the coalescent and other methods. Bioinformatics 2003, 19, 2496–2497. [Google Scholar] [CrossRef]
  32. Kumar, S.; Stecher, G.; Li, M.; Knyaz, C.; Tamura, K. MEGA X: Molecular Evolutionary Genetics Analysis across computing platforms. Mol. Biol. Evol. 2018, 35, 1547–1549. [Google Scholar] [CrossRef] [PubMed]
  33. Huelsenbeck, J.P.; Ronquist, F. MRBAYES: Bayesian inference of phylogenetic trees. Bioinformatics 2001, 17, 754–755. [Google Scholar] [CrossRef]
  34. Ronquist, F.; Huelsenbeck, J.P. MrBayes 3: Bayesian phylogenetic inference under mixed models. Bioinformatics 2003, 19, 1572–1574. [Google Scholar] [CrossRef]
  35. Drummond, A.J.; Rambaut, A. BEAST: Bayesian evolutionary analysis by sampling trees. BMC Evol. Biol. 2007, 7, 214. [Google Scholar] [CrossRef]
  36. Drummond, A.J.; Suchard, M.A.; Xie, D.; Rambaut, A. Bayesian phylogenetics with BEAUti and the BEAST 1.7. Mol. Biol. Evol. 2012, 29, 1969–1973. [Google Scholar] [CrossRef]
  37. Bouckaert, R.; Heled, J.; Kühnert, D.; Vaughan, T.; Wu, C.-H.; Xie, D.; Suchard, M.A.; Rambaut, A.; Drummond, A.J. BEAST 2: A software platform for Bayesian evolutionary analysis. PLoS Comput. Biol. 2014, 10, e1003537. [Google Scholar] [CrossRef] [PubMed]
  38. Drummond, A.J.; Bouckaert, R.R. Bayesian Evolutionary Analysis with BEAST; Cambridge University Press: Cambridge, UK, 2015. [Google Scholar]
  39. Bouckaert, R.; Vaughan, T.G.; Barido-Sottani, J.; Duchêne, S.; Fourment, M.; Gavryushkina, A.; Heled, J.; Jones, G.; Kühnert, D.; De Maio, N.; et al. BEAST 2.5: An advanced software platform for Bayesian evolutionary analysis. PLoS Comput. Biol. 2019, 15, e1006650. [Google Scholar] [CrossRef] [PubMed]
  40. Meier, R.; Kwong, S.; Vaidya, G.; Peter, K.; Ng, L. DNA Barcoding and Taxonomy in Diptera: A Tale of High Intraspecific Variability and Low Identification Success. Syst. Biol. 2006, 55, 715–728. [Google Scholar] [CrossRef] [PubMed]
  41. Zhang, D.; Gao, F.; Jakovlić, I.; Zou, H.; Zhang, J.; Li, W.X.; Wang, G.T. PhyloSuite: An integrated and scalable desktop platform for streamlined molecular sequence data management and evolutionary phylogenetics studies. Mol. Ecol. Resour. 2020, 20, 348–355. [Google Scholar] [CrossRef] [PubMed]
  42. Vadya, G.; Lohman, D.J.; Meier, R. SequenceMatrix: Concatenation software for the fast assembly of multi-gene datasets with character set and codon information. Cladistics 2011, 27, 171–180. [Google Scholar] [CrossRef]
  43. Drummond, A.J.; Ho, S.Y.W.; Phillips, M.J.; Rambaut, A. Relaxed Phylogenetics and Dating with Confidence. PLoS Biol. 2006, 4, e88. [Google Scholar] [CrossRef] [PubMed]
  44. Rambaut, A. FigTree v1.4.4. 2016. Available online: http://tree.bio.ed.ac.uk/software/figtree/ (accessed on 26 August 2022).
  45. Trifinopoulos, J.; Nguyen, L.T.; von Haeseler, A.; Minh, B.Q. W-IQ-TREE: A fast online phylogenetic tool for maximum likelihood analysis. Nucleic Acids Res. 2016, 44, W232–W235. [Google Scholar] [CrossRef]
  46. Hoang, D.T.; Chernomor, O.; Von Haeseler, A.; Minh, B.Q.; Vinh, L.S. UFBoot2: Improving the ultrafast bootstrap approximation. Mol. Biol. Evol. 2017, 35, 518–522. [Google Scholar] [CrossRef]
  47. Guindon, S.; Dufayard, J.F.; Lefort, V.; Anisimova, M.; Hordijk, W.; Gascuel, O. New algorithms and methods to estimate maximum-likelihood phylogenies: Assessing the performance of PhyML 3.0. Syst. Biol. 2010, 59, 307–321. [Google Scholar] [CrossRef]
  48. MitoFish WEB Bench. Available online: http://mitofish.aori.u-tokyo.ac.jp/annotation/input.html (accessed on 1 January 2022).
  49. Lowe, T.M.; Chan, P.P. tRNAscan-SE On-line: Search and Contextual Analysis of Transfer RNA Genes. Nucleic Acids Res. 2016, 44, W54–W57. [Google Scholar] [CrossRef]
  50. Lowe, T.M.; Eddy, S.R. tRNAscan-SE: A Program for Improved Detection of Transfer RNA Genes in Genomic Sequence. Nucleic Acids Res. 1997, 25, 955–964. [Google Scholar] [CrossRef] [PubMed]
  51. Saitoh, K.; Hayashizaki, K.; Yokoyama, Y.; Asahida, T.; Toyohara, H.; Yamashita, Y. Complete nucleotide sequence of Japanese flounder (Paralichthys olivaceus) mitochondrial genome: Structural properties and cue for resolving teleostean relationships. J. Hered. 2000, 91, 271–278. [Google Scholar] [CrossRef] [PubMed]
  52. Letunic, I.; Bork, P. Interactive Tree Of Life (iTOL) v5: An online tool for phylogenetic tree display and annotation. Nucleic Acids Res. 2021, 49, W293–W296. [Google Scholar] [CrossRef]
  53. Nei, M.; Gojobori, T. Simple methods for estimating the numbers of synonymous and nonsynonymous nucleotide substitutions. Mol. Biol. Evol. 1986, 3, 418–426. [Google Scholar] [PubMed]
  54. Li, W.H. Molecular Evolution; Sinauer Ass.: Sunderland, MA, USA, 1997. [Google Scholar]
  55. Fricke, R.; Eschmeyer, W.N.; Van der Laan, R. (Eds.) Eshmayer’s Catalog of Fishes: Genera, Species, References. California Academy of Sciences. 2022. Available online: https://researcharchive.calacademy.org/research/ichthyology/catalog/fishcatmain.asp (accessed on 15 February 2022).
  56. Clayton, D.A. Replication and transcription of vertebrate mitochondrial DNA. Annu. Rev. Cell Biol. 1991, 7, 453–478. [Google Scholar] [CrossRef]
  57. Boore, J.L. Animal mitochondrial genomes. Nucleic Acids Res. 1999, 27, 1767–1780. [Google Scholar] [CrossRef]
  58. Shi, W.; Kong, X.Y.; Wang, Z.M.; Jiang, J.X. Utility of tRNA genes from the complete mitochondrial genome of Psetta maxima for implying a possible sister-group relationship to the Pleuronectiformes. Zool Stud. 2011, 50, 665–681. [Google Scholar]
  59. Redin, A.D.; Kartavtsev, Y.P. Phylogenetic relationships of flounders from the family Pleuronectidae (Ostichties: Pleuronectiformes) based on S16 rRNA gene. Russ. J. Genet. 2021, 57, 348–360. [Google Scholar] [CrossRef]
  60. Shi, W.; Chen, S.; Kong, X.; Si, L.; Gong, L.; Zhang, Y.; Yu, H. Flatfish monophyly refereed by the relationship of Psettodes in Carangimorphariae. BMC Genom. 2018, 19, 400. [Google Scholar] [CrossRef]
  61. Kartavtsev, Y.P.; Redin, A.D. Estimates of genetic introgression, gene tree reticulation, taxon divergence, and sustainability of DNA barcoding based on genetic molecular markers. Biol. Bull. Rev. 2019, 9, 275–294. [Google Scholar] [CrossRef]
  62. Stoeckle, M.Y.; Thaler, D.S. Why should mitochondria define species? Hum. Evol. 2018, 33, 1–30. [Google Scholar] [CrossRef]
  63. Kartavtsev, Y.P. Chapter 1: Analysis of sequence diversity at mitochondrial genes on different taxonomic levels. Applicability of DNA Based Distance Data in Genetics of Speciation and Phylogenetics. In Genetic Diversity; Mahoney, C.L., Springer, D.A., Eds.; Nova Science Publishers, Inc.: New York, NY, USA, 2009; pp. 1–50. [Google Scholar]
  64. Kartavtsev, Y.P. Sequence divergence at mitochondrial genes in animals: Applicability of DNA data in genetics of speciation and molecular phylogenetics. Mar. Genom. 2011, 49, 71–81. [Google Scholar] [CrossRef] [PubMed]
  65. Kartavtsev, Y.P. Sequence divergence at Co-1 and Cyt-b mtDNA on different taxonomic levels and genetics of speciation in animals. Mitochondrial DNA 2011, 2, 55–65. [Google Scholar] [CrossRef] [PubMed]
  66. Kartavtsev, Y.P. Sequence Diversity at Cyt-b and Co-1 mtDNA Genes in Animal Taxa Proved Neo-Darwinism. Phylogenet. Evol. Biol. 2013, 1, 4. [Google Scholar] [CrossRef]
  67. Zolotova, A.O.; Kartavtsev, Y.P. Analysis of sequence divergence in redfin (Cypriniformes, Cyprinidae, Tribolodon) based on mtDNA and nDNA markers with inferences in systematics and genetics of speciation. Mitochondrial DNA Part A 2018, 29, 975–992. [Google Scholar] [CrossRef]
  68. Kartavtsev, Y.P. Sequence divergence provide a fit between molecular evolution, Neo-Darwinism and DNA barcoding. In HydromediT2018, Proceedings of the 3rd International Congress on Applied Ichthyology & Aquatic Environment, Volos, Greece, 8–11 November 2018; Berillis, P., Karapanagiotidis, I., Eds.; Department of Ichthyology and Aquatic Environment, School of Agricultural Sciences, University of Thessaly: Volos, Greece, 2018; pp. 463–479. ISBN 978-618-80242-5-0. Available online: www.hydromedit.gr (accessed on 10 March 2021).
  69. Kartavtsev, Y.P. Some examples of the use of molecular markers for needs of basic biology and modern society. Animals 2021, 11, 1473. [Google Scholar] [CrossRef] [PubMed]
  70. Nei, M.; Kumar, S. Molecular Evolution and Phylogenetics; Oxford University Press: Oxford, UK, 2000; 333p. [Google Scholar]
  71. Kartavtsev, Y.P.; Lee, J.-S. Analysis of nucleotide diversity at genes Cyt-b and Co-1 on population, species, and genera levels. Russ. J. Genet. 2006, 42, 341–362, (In Russian, Translated in English). [Google Scholar] [CrossRef]
  72. Hedges, S.B.; Marin, J.; Suleski, M.; Madeline, P.; Kumar, S. Tree of life reveals clock-like speciation and diversification. Mol. Biol. Evol. 2015, 32, 835–845. [Google Scholar] [CrossRef]
  73. Ratnasingham, S.; Hebert, P.D.N. BOLD: The Barcode of Life Data System. Mol. Ecol. Notes 2007, 7, 355–364. [Google Scholar] [CrossRef]
  74. Naaum, A.M.; Hanner, R. Community engagement in seafood identification using DNA barcoding reveals market substitution in Canadian seafood. DNA Barcodes 2015, 3, 74–79. [Google Scholar] [CrossRef]
  75. Nedunoori, A.; Turanov, S.V.; Kartavtsev, Y.P. Fish product mislabeling identified in the Russian far east using DNA barcoding. Gene Rep. 2017, 8, 144–149. [Google Scholar] [CrossRef]
  76. Shneyer, V.S.; Rodionov, A. Plant DNA Barcodes. Biol. Bull. Rev. 2019, 9, 295–300. [Google Scholar] [CrossRef]
  77. Kartavtsev, Y.P.; Sharina, S.N.; Goto, T.; Chichvarkhin, A.Y.; Balanov, A.A.; Vinnikov, K.A.; Ivankov, V.N.; Hanzawa, N. Cytochrome oxidase 1 gene sequence analysis in six flatfish species (Teleostei, Pleuronectidae) of Far East Russia with inferences in phylogeny and taxonomy. Mitochondrial DNA 2008, 19, 479–489. [Google Scholar] [CrossRef] [PubMed]
  78. Atta, C.J.; Yuan, H.; Li, C.; Arcila, D.; Betancur-R, R.; Hughes, L.C.; Ortí, G.; Tornabene, L. Exon-capture data and locus screening provide new insights into the phylogeny of flatfishes (Pleuronectoidei). Mol. Phylogenet. Evol. 2022, 166, 107315. [Google Scholar] [CrossRef] [PubMed]
  79. Hillis, D.M.; Mable, B.K.; Moritz, C. Application of molecular systematics: The state of the field and a look to the future. In Molecular Systematics; Hillis, D.M., Moritz, C., Mable, B., Eds.; Sinauer Associates, Inc.: Sunderland, MA, USA, 1996; pp. 515–543. [Google Scholar]
  80. Xia, X.; Xie, Z.; Salemi, M.; Chen, L.; Wang, Y. An index of substitution saturation and its application. Mol. Phylogenet. Evol. 2003, 26, 1–7. [Google Scholar] [CrossRef]
  81. Xia, X.; Lemey, P. Assessing substitution saturation with DAMBE. In The Phylogenetic Handbook; Lemey, P., Salemi, M., Vandamme, A.-M., Eds.; Cambridge University Press: Cambridge, UK, 2009; pp. 615–630. [Google Scholar]
  82. Nelson, C.S.; Beck, J.N.; Wilson, K.A.; Pilcher, E.R.; Kapahi, P.; Brem, R.B. Cross-phenotype association tests uncover genes mediating nutrient response in Drosophila. BMC Genom. 2016, 17, 867. [Google Scholar] [CrossRef] [PubMed]
  83. Luo, H.; Kong, X.; Chen, S.; Shi, W. Mechanisms of gene rearrangement in 13 bothids based on comparison with a newly completed mitogenome of the threespot flounder, Grammatobothus polyophthalmus (Pleuronectiformes: Bothidae. BMC Genom. 2019, 20, 792. [Google Scholar] [CrossRef]
  84. Lü, Z.; Gong, L.; Ren, Y.; Chen, Y.; Wang, Z.; Liu, L.; Li, H.; Chen, X.; Li, Z.; Luo, H.; et al. Large-scale sequencing of flatfish genomes provides insights into the polyphyletic origin of their specialized body plan. Nat. Genet. 2021, 53, 742–751. [Google Scholar] [CrossRef]
Figure 1. Map of the circular mitochondrial genome of the yellow-stripe flounder Pseudopleuronectes herzensteini. The external ring displays the abbreviations and composition for the main components of the mitogenome. It includes: 13 protein-coding genes (ATPase6, ATPase8, COI, COII, COIII, Cyt-b, ND1, ND2, ND3, ND4, ND4L, ND5, and ND6), 2 rRNA genes (12S rRNA and 16S rRNA), and 22 tRNA genes (tRNA-Val, -Leu, -Ile, -Met, -Trp, -Ala, -Asn, -Cys, -Tyr, -Ser, -Asp, -Lys, -Gly, -Arg, -His, -Ser, -Leu, -Glu, and -Pro). Shifted inside line display the components of the genome located in the “−”-chain. Most genes are located in the “+”-chain. Inside ring mapping, the whole mitogenome length (kb), spanning orientation, and its longevity.
Diversity 14 00805 g001
Figure 2. A map of the mitogenomes in linear mode for the 26 species of flounder of the family Pleuronectidae along with BA-tree. For simplicity, CRs are excluded from the comparison because of their variable numbers in flounders’ mitogenomes. Details of the phylogenetic reconstruction and tree topology will be presented in the next sections. Probabilities for all nodes in the gene tree that are depicted on the left are equal to 1.0 for all interspecies branches. The number of generations simulated in this case is equal to n = 2 × 10⁶.
Diversity 14 00805 g002
Figure 3. Molecular phylogenetic relationships of flounders of the family Pleuronectidae reconstructed using four approaches: BA, ML, NJ, and MP. Support values (%) at the tree nodes are shown in the direction: BA/ML/NJ/MP. For BA reconstructions, posterior probabilities for model generations, n = 106 as well as for the other three techniques, bootstrap replicas, k = 1000 are given. Supports for intraspecific nodes are omitted. The tree is rooted in the outgroup Paralichthys olivaceus.
Diversity 14 00805 g003
Figure 4. CA-based time-tree reconstruction via BEAST-2 and FigTree utilities that based on 13 PCG sequences of 26 analyzed representatives of flounder family Pleuronectidae and the outgroup. Details for the simulation of the tree in the current image are given in the text. Besides the nodes, their ages are given after rooting the tree with the outgroup taxon Paralichthys olivaceus and converting the scale in node ages to root age, which equated to 46.2 Mya. Bars are representing CA 95%HDP for the node ages.
Diversity 14 00805 g004
Figure 5. Rooted gene tree of the studied representatives of the suborder Pleuronectoidei constructed from PCGs of 108 mitogenomes. The topology of the gene tree is reconstructed using the BA approach. The numbers at the nodes are support values for the four tree reconstruction techniques that are placed in the order: MP/ML/NJ/BA. The posterior probabilities (%, n = 106 generations) are shown for the BA tree, the bootstrap support values (k = 1000 replicas) are given for the other three reconstructions. Dash means absence of support for the current node in the reconstruction by a certain technique. Support values that equal to 100% shown for convenience by the asterisks.
Diversity 14 00805 g005
Figure 6. Phylogenetic lineages reconstructed via BEAST-2 and visualized with DensyTree software based on 26 sequences of 13 PCGs of the flounder family Pleuronectidae. Simulated lineages are naturally rooted in three presumed ancestral taxa including the predefined outgroup taxon Paralichthys olivaceus. Wider violet lines depict the consensus trees constructed by computer simulations of coalescent process of molecular evolution in constant populations during 5 × 10⁷ generations by BEAST-2 as explained in detail in the Results and in the above paragraph in the main text. Thin lines show all possible trees that occurred during the time span as depicted in the scale given in node ages. DensyTree reconstructed time-tree interrelationships based on the same BEAST run and the output tree file as that used for building Figure 4. Source tree file available for use from Table S3, Supplement (File: Fl26seq-pt8-11401-123ps4.trees). Bars represent CA 95%HDP for the node ages. Circles with a dot inside show the support area and averages for clades. The main branches are stained with different colors.
Diversity 14 00805 g006
Figure 7. Univariate ANOVA showing the variability of the mean values of genetic distances (Y axis) for the comparison groups of the sequences in sampled taxa for 13 PCGs of 26 flatfish mitogenomes in Pleuronectidae (A, top) and 106 flatfish mitogenomes in Pleuronectoidei (B, bottom). Y axis, Tamura-Nei (TrN) variation in the mean values of distances (in frequencies) among three comparison groups for flatfish: (1) TrN distances within the species, between individuals of the same species; (2) TrN distances within genera, between individuals of different species of the same genus; (3) TrN distances within the family, between species of different genera of the same family, (4) TrN distances within suborder, between individuals of different families of the same suborder. Data on these two analyses were obtained on the sequences of the complete mitogenome of flatfish from GenBank in 2021.
Diversity 14 00805 g007
Table 1. Species list used in the study with the GenBank accession numbers.
SpeciesGenBank Number
   Acrossocheilus monticolaKT367805
   Achirus lineatusJQ639067
   Trinectes maculatusJQ639070
   Neoachiropsetta milfordiAP014593
   Arnoglossus polyspilusAP014586
   Arnoglossus tenuisKP134337
   Asterorhombus intermediusMK256952
   Bothus myriasterKJ433563
   Bothus pantherinusAP014587
   Chascanopsetta lugubrisAP017455
   Chascanopsetta lugubrisKJ433561
   Crossorhombus azureusJQ639068
   Crossorhombus kobensisAP014589
   Crossorhombus valderostratusKJ433566
   Grammatobothus polyophthalmusMK770643
   Laeops lanceolataAP014591
   Lophonectes gallusKJ433567
   Psettina iijimaeKP134336
   Citharoides macrolepidotusAP014588
   Lepidoblepharon ophthalmolepisAP014592
   Cynoglossus abbreviatusGQ380410
   Cynoglossus abbreviatusJQ349004
   Cynoglossus bilineatusJQ349000
   Cynoglossus gracilisKT809367
   Cynoglossus interruptusLC482306
   Cynoglossus itinusJQ639062
   Cynoglossus joyneriKU497492
   Cynoglossus joyneriKU754054
   Cynoglossus joyneriKY008569
   Cynoglossus nanhaiensisMT117229
   Cynoglossus puncticepsJQ349003
   Cynoglossus robustusLC482305
   Cynoglossus rouleiMK574671
   Cynoglossus rouleiMN966658
   Cynoglossus semilaevisEU366230
   Cynoglossus semilaevisGQ380409
   Cynoglossus senegalensisMH709122
   Cynoglossus trullaJQ348998
   Cynoglossus trigrammusKP057581
   Cynoglossus zanzibarensisKJ433559
   Paraplagusia bilineataJQ349001
   Paraplagusia bleekeriJQ349002
   Paraplagusia japonicaJQ639066
   Symphurus orientalisKP992899
   Symphurus plagiusaJQ639061
   Cyclopsetta fimbriataAP014590
   Paralichthys adspersusMW288827
   Paralichthys dentatusKU053334
   Paralichthys lethostigmaKT896534
   Paralichthys olivaceusAB028664
   Pseudorhombus cinnamoneusJQ639069
   Pseudorhombus dupliciocellatusKJ433562
   Cleisthenes pinetorumKT223828
   Clidoderma asperrimumMK210570
   Colistium nudipinnisJQ639063
   Hippoglossoides platessoidesMN122825
   Hippoglossus hippoglossusAM749122
   Hippoglossus hippoglossusAM749123
   Hippoglossus hippoglossusAM749124
   Hippoglossus stenolepisAM749126
   Hippoglossus stenolepisAM749127
   Hippoglossus stenolepisAM749128
   Hippoglossus stenolepisAM749129
   Limanda asperaKP013094
   Limanda limandaMN122886
   Pelotretis flavilatusKC554065
   Peltorhamphus novaezeelandiaeJQ639065
   Platichthys stellatusEF424428
   Platichthys stellatusMZ365029
   Pleuronichthys cornutusJQ639071
   Pleuronichthys cornutusKY038655
   Pseudopleuronectes herzensteiniMW713061
   Pseudopleuronectes yokohamaeKT224485
   Pseudopleuronectes yokohamaeKT878309
   Reinhardtius hippoglossoidesAM749130
   Reinhardtius hippoglossoidesAM749131
   Reinhardtius hippoglossoidesAM749132
   Reinhardtius hippoglossoidesAM749133
   Verasper moseriEF025506
   Verasper moseriLC583747
   Verasper variegatusDQ403797
   Verasper variegatusMK210571
   Psettodes erumeiFJ606835
   Samaris cristatusJQ700101
   Samariscus latusKF494223
   Scophthalmus maximusEU419747
   Zeugopterus punctatusMT410862
   Aesopia cornutaKF000065
   Aseraggodes kobensisKJ601760
   Brachirus orientalisKJ433558
   Brachirus orientalisKJ513134
   Heteromycteris japonicusJQ639060
   Liachirus melanospilosKF573188
   Pardachirus pavoninusAP006044
   Pardachirus pavoninusKJ433565
   Pardachirus pavoninusKJ461620
   Zebrias japonicusKJ433482
   Zebrias japonicusKJ433568
   Solea ovataKF142459
   Solea ovataKJ496338
   Solea senegalensisAB270760
   Zebrias crossolepisKJ433564
   Zebrias crossolepisKT367804
   Zebrias quaggaJQ348999
   Zebrias zebraJQ700100
   Zebrias zebrinusKC491209
   Zebrias zebrinusKC519737
   Tetraodon mbuAP011923
Note. The original sequences that were submitted by our team are in a bold font.
Table 2. Mitochondrial genome information on two flatfish sequences presented in the current paper (P. herzensteini and P. stellatus) and the third (P. yokohamae), retrieved from GenBank.
Genome Content/SequencesPseudopleuronectes herzensteini MW713061Platichthys stellatus MZ365029Pseudopleuronectes yokohamae KT224485
Size (bp)16,84516,99217,383
Gene number, PCGs131313
Gene number, rRNA222
Gene number tRNA222222
tRNA-Phe1.68 (+)1.68 (+)1.68 (+)
12S rRNA69.1017 (+)69.1017 (+)69.1017 (+)
tRNA-Val1018.1090 (+)1018.1090 (+)1018.1090 (+)
16S rRNA1091.2806 (+)1091.2805 (+)1091.2806 (+)
tRNA-Leu2807.2880 (+)2806.2879 (+)2807.2880 (+)
ND12881.3855 (+)2880.3854 (+)2881.3855 (+)
tRNA-Ile3861.3931 (+)3860.3930 (+)3861.3931 (+)
tRNA-Gln3931.4001 (−)3930.4000 (−)3931.4001 (−)
tRNA-Met4001.4069 (+)4000.4068 (+)4001.4069 (+)
ND24070.5114 (+)4069.5113 (+)4070.5114 (+)
tRNA-Trp5115.5186 (+)5114.5185 (+)5115.5186 (+)
tRNA-Ala5188.5256 (−)5187.5255 (−)5188.5256 (−)
tRNA-Asn5258.5330 (−)5257.5329 (−)5258.5330 (−)
tRNA-Cys5368.5432 (−)5368.5432 (−)5369.5433 (−)
tRNA-Tyr5433.5500 (−)5433.5500 (−)5434.5501 (−)
COI5502.7061 (+)5502.7061 (+)5503.7062 (+)
tRNA-Ser7062.7132 (−)7062.7132 (−)7063.7133 (−)
tRNA-Asp7147.7217 (+)7147.7217 (+)7148.7218 (+)
COII7224.7914 (+)7224.7914 (+)7225.7915 (+)
tRNA-Lys7915.7987 (+)7915.7987 (+)7916.7988 (+)
ATPase 87989.8156 (+)7989.8156 (+)7990.8157 (+)
ATPase 68147.8829 (+)8147.8829 (+)8148.8830 (+)
COIII8830.9614 (+)8830.9614 (+)8831.9615 (+)
tRNA-Gly9615.9686 (+)9615.9686 (+)9616.9687 (+)
ND39687.10035 (+)9687.10035 (+)9688.10036 (+)
tRNA-Arg10,036.10104 (+)10,036.10104 (+)10,037.10105 (+)
ND4L10105.10401 (+)10,105.10401 (+)10,106.10402 (+)
ND410,395.11775 (+)10,395.11775 (+)10,396.11776 (+)
tRNA-His11,776.11845 (+)11,776.11845 (+)11,777.11846 (+)
tRNA-Ser11,846.11912 (+)11,846.11912 (+)11,847.11913 (+)
tRNA-Leu11,917.11989 (+)11,917.11989 (+)11,918.11990 (+)
ND511,990.13828 (+)11,990.13828 (+)11,991.13829 (+)
ND613,825.14346 (−)13,825.14346 (−)13,826.14347 (−)
tRNA-Glu14,347.14415 (−)14,347.14415 (−)14,348.14416 (−)
Cyt b14,420.15560 (+)14,420.15560 (+)14,421.15561 (+)
tRNA-Thr15,561.15633 (+)15,561.15633 (+)15,562.15634 (+)
tRNA-Pro15,633.15703 (−)15,634.15704 (−)15,634.15704 (−)
control region15,704.16845 (+)15,705.16992 (+)15,705.17383 (+)
Note. Abbreviations are as follows: PCGs, protein-coding genes; NCR, noncoding region; +/−, location of genes at the “+/−” strand; tRNA genes are designated by three-letter amino acid codes.
Publisher’s Note: MDPI stays neutral with regard to jurisdictional claims in published maps and institutional affiliations.

