Article

Unrecognized Ant Megadiversity in Monsoonal Australia: Diversity and Its Distribution in the Hyperdiverse Monomorium nigrius Forel Group

by
Alan N. Andersen
1,*,
François Brassard
1 and
Benjamin D. Hoffmann
1,2
1
Research Institute for the Environment and Livelihoods, Charles Darwin University, Darwin, NT 0909, Australia
2
CSIRO Tropical Ecosystems Research Centre, PMB 44, Winnellie, NT 0822, Australia
*
Author to whom correspondence should be addressed.
Diversity 2022, 14(1), 46; https://doi.org/10.3390/d14010046
Submission received: 6 November 2021 / Revised: 4 January 2022 / Accepted: 5 January 2022 / Published: 11 January 2022
(This article belongs to the Special Issue 2021 Feature Papers by Diversity’s Editorial Board Members)

Abstract

:
We document diversity and its distribution within the hyperdiverse Monomorium nigrius Forel group of the Australian monsoonal tropics, an unrecognized global centre of ant diversity. The group includes a single described species, but several distinct morphotypes each with multiple clearly recognizable taxa are known. Our analysis is based on 401 CO1-sequenced specimens collected from throughout the Australian mainland but primarily in the monsoonal north and particularly from four bioregions: the Top End (northern third) of the Northern Territory (NT), the Sturt Plateau region of central NT, the Kimberley region of far northern Western Australia, and far North Queensland. Clade structure in the CO1 tree is highly congruent with the general morphotypes, although most morphotypes occur in multiple clades and are therefore shown as polyphyletic. We recognize 97 species among our sequenced specimens, and this is generally consistent (if not somewhat conservative) with PTP analyses of CO1 clustering. Species turnover is extremely high both within and among bioregions in monsoonal Australia, and the monsoonal fauna is highly distinct from that in southern Australia. We estimate that the M. nigrius group contains well over 200 species in monsoonal Australia, and 300 species overall. Our study provides further evidence that monsoonal Australia should be recognized as a global centre of ant diversity.

1. Introduction

The Australian monsoonal tropics, encompassing the vast tropical savanna landscapes of the northern third of the continent (Figure 1), is a centre of exceptional but largely unrecognized ant diversity. Many taxa that are formally recognized as single, widespread species are in fact hyperdiverse species complexes [1,2]. For example, Melophorus rufoniger Heterick, Castalanelli and Shattuck was recently described as a single species occurring throughout mainland Australia but most commonly in the monsoonal tropics [3]. However, a subsequent analysis that integrated genetic, morphological and distributional information revealed that at least 30 species within the taxon occur in the Top End (high rainfall northern third) of the Northern Territory (NT) alone. It was concluded that the total M. rufoniger fauna included up to 100 species from monsoonal Australia, none of which are described [4].
The Monomorium nigrius Forel group is another case in point. It is an intractably diverse assemblage of very small, brownish-black species with 11-segmented antenna occurring throughout mainland Australia but with its centre of diversity in the monsoonal north [5,6]. In a recent revision of the Australian Monomorium fauna the group was described as representing a single species, M. fieldi Forel [7], despite morphological variation that is obviously interspecific.
Six general morphotypes, each with multiple species, can be recognized based on variation in body size, length of antennal scapes, shape of the propodeum and petiolar node, and pilosity (the ‘fieldi’, ‘donisthorpei’, ‘sp. 50’, ‘sp. 14’, ‘sp. 13’ and ‘sp. 9’ morphotypes, using the species nomenclature of [8]: Figure 2). A key to the morphotypes is as follows:
  • Antennal scapes relatively long, reaching occipital margin or nearly so ….……………………………………………………………………………………………………………....... 1
    Antennal scapes relatively short, failing to reach occipital margin by a distance greater than their maximum width ……….………………………………………………………. 4
  • Mesosoma with particularly long hairs; metanotal notch deep and propodeum rather prominently rounded; petiole often unusually broad in profile (Figure 2a,b) …‘...fieldi
    Not as above …………………………………………………………………………...….…………………………………………………………………………………………………………2
  • Relatively large and robust, often with a squarish head; metanotal notch feeble and propodeum not at all prominently rounded (Figure 2c,d) ……..…….……… ‘donisthorpei
    Smaller, with a rectangular head; metanotal notch more pronounced and propodeum more rounded (Figure 2e,f) …………………………………………………….…… ‘sp. 50’
  • Petiolar node very small, lower than long in profile .…..……………………….….………………………………………………………………………………………………………….. 5
    Petiolar node as high as long in profile (Figure 2g,h) ..…………………………………………………………………………………………………………………………………. ‘sp. 14’
  • Tiny species, propodeum short and obliquely angled in profile (Figure 2i,j) .……………………………………………………………………………………………………….. ‘sp. 13’
    Larger species; propodeum more broadly rounded in profile (Figure 2k,l) …..……………………………………………………………………………………………………… ‘sp. 9’
The different morphotypes commonly occur in close sympatry; indeed, nine species shown to be differentiated genetically and morphologically, and representing all six morphotypes, have been recorded from a savanna woodland site (Territory Wildlife Park) near Darwin [8]. Remarkably, seven of these species were recorded from a single 10 × 10 m plot and six in another. If so many species of the M. nigrius group can occur at such a small spatial scale, and the species group occurs throughout most of mainland Australia, then how many species are there in total? A recent compilation of the known ant fauna of the Top End of the NT lists 17 species from the group [9], but otherwise there has been no attempt at a broader quantification of total diversity within the taxon.
In this paper, we present an integrated genetic (CO1), morphological and distributional analysis of the M. nigrius group in order to provide an estimate of the total number of species within it and to document spatial patterns of species richness and turnover. We specifically address the following questions:
What are indicative levels of total diversity based on available morphological, CO1 and distributional information?
What is the extent of congruence between the six general morphotypes and CO1 phylogeny?
How diverse is the M. nigrius-group fauna within Australia, and what are the spatial patterns of species richness and turnover?

2. Materials and Methods

This study was based on pinned specimens of the M. nigrius group held in the ant collection at the CSIRO laboratory in Darwin, which holds by far the most extensive collection of the taxon. For CO1 analysis we used the 40 M. nigrius-group sequences from [8] and obtained sequences from an additional 361 specimens collected from throughout mainland Australia (Supplementary Table S1). One of these (from urban Sydney) is a perfect morphological match with the New Zealand species M. antipodum Forel [10], and we refer to it as M.?antipodum. We also sequenced a specimen of the closely related M. carinatum Heterick group to be used as the outgroup for building a CO1 tree. Geographic coverage of samples within mainland Australia was extremely patchy (Figure 1). The most intensively sampled region was the Top End of the NT (1000–2000 mm mean annual rainfall), but even here large areas are unrepresented. Other regions of relatively high sampling intensity within monsoonal Australia are the Sturt Plateau region of central Northern Territory (550–800 mm), the Kimberley region of far northern Western Australia (500–1700 mm) and far North Queensland (north of the Townsville region) (Figure 1). Vast areas of central and southern Australia are not represented.
Many localities represent multiple sites. The four major biogeographic regions of relatively high collection effort in northern Australia are indicated. Total annual rainfall in the monsoonal zone ranges from approximately 2000 mm on the Tiwi Islands in the Top End to 500 mm on the southern boundary with the central arid zone.
DNA extraction (from foreleg or whole-body tissue) and CO1 sequencing were conducted through the Barcode of Life Data (BOLD) System (for extraction details, see http://ccdb.ca/resources, accessed on 4 January 2022). Each sequenced specimen was assigned a unique identification code that combines the batch within which it was processed, its number within the batch and the year of sequencing (e.g., MONO244-16). All specimens are labeled with their respective BOLD identification numbers in the Darwin collection.
DNA sequences were checked and edited in MEGA [11]. Sequences were aligned using the UPGMB clustering method in MUSCLE [12], and then translated into (invertebrate) proteins to check for stop codons and nuclear paralogues. The aligned sequences were trimmed accordingly, resulting in 822 base pairs.
To explore overall CO1 diversity in the samples, the mean genetic pairwise distances between sequences were calculated in MEGA. This was done using the Kimura-2 parameter (K2P) model [13] to ensure that results were comparable with those of most other studies of insect DNA barcoding, with 500 bootstrap replicates and the ‘pairwise deletion’ option of missing data (to remove all ambiguous positions for each sequences pair). Analysis involved all nucleotide sequences, excluding those of the outgroup. Codon positions included were 1st + 2nd + 3rd.
The level of CO1 variation within ant species is typically 1–3% [14] but there is no specific level of CO1 divergence that can be used to define a species. For species delimitation we adopted the species concept based on reproductive isolation and evolutionary independence as evidenced by morphological differentiation between sister (i.e., most closely related) clades (considering all available samples from the same collections as those of sequenced specimens) and sympatric distribution. We thus delimited species based on the integration of morphological variation, CO1 clustering and distance, and geographic distribution [15]. We compared our species delimitations using such an integrated approach with two statistical methods using CO1 data alone. We used the MEGA genetic distances to produce a tree file with IQ-TREE [16] and then ran this into two models. The first was the Poisson Tree Processes (PTP) model, which infers species boundaries using the number of substitutions within and between species in a maximum likelihood tree [17]. The second was the Bayesian implementation of the PTP model (bPTP), which adds Bayesian values to delimited species on the input tree [17]. We subjected trees including all specimens, as well as a tree of each major clade within the full tree separately, to PTP and bPTP algorithms on the web server (http://species.h-its.org/ptp/, accessed on 8 October 2021), using the settings of 500,000 MCMC generations, 100 thinning and 0.1 burn in. We elected to increase the number of MCMC generations from 100,000 to 500,000 to increase the rate of convergence for the MCMC chain. Nevertheless, we did not reach convergence for several clades, and thus discarded these results.
We imaged representative specimens using a Leica DMC4500 camera mounted on a Leica M205C dissecting microscope. We took image montages using the Leica Application suite v. 4.13 and stacked them in Zerene stacker.

3. Results

3.1. Diversity

By integrating morphological variation with CO1 data and distributional information we recognize 97 species among our sequenced samples. Nearly one-third (32) of these species are known from single records in the Darwin collection. The CO1 tree contains ten major clades (A–J) that collectively contain 388 of the 401 sequenced specimens and 91 of our recognized species (Figure 3, Table 1; see Supplementary Figure S1 for the full CO1 tree). The mean CO1 distance between species from different clades ranges from 13.1% (between species from clades A and F) to 19.5% (clades E and I). The number of species within a clade ranges from 3 (clade C) to 20 (clade A), with mean CO1 distances among species within a clade ranging from 4.9% (range 1.5–11.3%) in clade A to 15.8% (13.8–17.2%) in clade I (Table 1). The six ‘outlier’ species occur in five independent clades, one of which is represented by M. ?antipodum.
There is strong concordance between clade structure and the six recognized morphotypes: all major clades except B contained a single morphotype; and in clade B, 18 of the 19 recognized species are of the same (‘sp. 50’) morphotype (Figure 3). However, all morphotypes other than ‘fieldi’ (Figure 2a,b and Figure 4) occur in multiple clades. The ‘donisthorpei’ morphotype (Figure 2c,d and Figure 5) occurs in two clades, one containing ‘donisthorpei’ in the strict sense (clade C, with three species recognized) and the other including ‘sp. 37’ from the Territory Wildlife Park study [8] (clade D, five species). The ‘sp. 50’ morphotype (Figure 6) likewise occurs in two clades, represented by 18 of the 19 species in clade B and all nine species in clade E, whereas the ‘sp. 14’ morphotype (Figure 7) occurs in three clades (G, I and J). The ‘sp. 13’ (Figure 8) and ‘sp. 9’ (Figure 9) morphotypes each occur in a single major clade (H and F, respectively) but are both also represented by ‘outlier’ species (Figure 3).
PTP analyses provided variable results according to whether they were based on maximum likelihood or Bayesian probability, and whether the full tree was analyzed simultaneously or by individual clades (Table 1). The total number of indicated species by Bayesian analysis of the full tree (102) was very similar to our 97 recognized species (Figure S1). However, maximum likelihood analysis of the full tree indicated only 72 species (Figure S1). This difference is due primarily to clades A (‘fieldi’ morphotype) and H (‘sp. 13’ morphotype), where only two species were indicated in each compared with 20 and 10, respectively, recognized by integrated analysis (Figure S1). Mean CO1 distances among our recognized species in clade A (4.9%) are well above the typical 1–3% for conspecific variation but are the lowest for any clade, which appears to explain the low number of PTP-indicated species when the full tree is analyzed. Geographic distribution was a key factor in our recognition of 20 species within the clade (Figure S1). For example, specimens from south-western WA fall into two subclades that we recognize as separate species, A1 and A6. A1 belongs to a broader subclade that includes several species from the NT, whereas A6 represents a subclade separate to this. Such a distribution indicates that specimens from the two southwestern WA subclades are reproductively isolated and therefore represent different species. Similarly, specimens from the Top End are represented in subclades that are scattered throughout clade A, separated by subclades consisting of specimens from distant locations. Moreover, there is substantial morphological variation among the species relating to pilosity and shape of the promesonotum, propodeum and petiolar node (Figure 1a and Figure 4). Notably, when clade A is analyzed separately the number of PTP (maximum likelihood)-indicated species increases dramatically, from two to 31 (Table 1). The low number of PTP-indicated species in clade H appears to be driven by the outlier species H10 (Figure 8c and Figure S1), which has 14–19% CO1 distance from other species in the clade, compared with 2–7% among the other species. If clade H is analyzed separately without H10 then 14 species are indicated by PTP (maximum likelihood) analysis. PTP (maximum likelihood) analysis of each clade separately indicates a total of 120 species among our sequenced specimens (Table 1).

3.2. Geographic Distribution

The most widely distributed morphotype geographically is ‘fieldi’, which occurs throughout semi-arid southern Australia as well as throughout the monsoonal zone (Table S1). Of the 20 species we recognize within ‘fieldi’, five (A3, A4, A5, A9, A15; 3–5% CO1 distances among them) occur in the Top End of the NT, including three in each of Kakadu (A3, A4, A15) and Nitmiluk (A4, A9 and A15) National Parks (Table S1). The ‘sp. 14’ morphotype includes a species-rich clade (clade J, with 10 species) of exclusively southern Australian species (Table S1). Six of these occur in south-eastern Queensland (two of them also in South Australia, and so are likely distributed throughout semi-arid south-eastern Australia) and the other four are from southwestern Western Australia (one of these also occurs in South Australia). The clade includes four glabrous species (J1–4; Figure 7c,d), a condition unique to them. None of our sequenced specimens from the ‘donisthorpei’, ‘sp. 9’, ‘sp. 13’ or ‘sp. 50’ morphotypes are from southern Australia, but all these morphotypes occur throughout the monsoonal north (Table S1).
A total of 34 of our 97 recognized species occur in the Top End of the NT, where there is very high species turnover among subregions (Figure 10a). Of the combined 25 species recorded from the Kakadu/Nitmiluk and Darwin-Litchfield subregions, only two (8.0%) are in common, and only 6% of the 32 total species were recorded from all three subregions. Subregional richness is especially high in the central Kakadu/Nitmiluk subregion, where 20 of our recognized species have been recorded. Despite Kakadu and Nitmiluk National Parks being contiguous, only five (25%) of the 20 species are known from both.
Unsurprisingly, species turnover is even higher among broader regions across northern Australia. None of the 34 Top End species are among the seven species from far North Qld, and only one (C3) is among the 21 species from the Kimberley region of far northern WA. The Top End fauna is also very distinct from that of the Sturt Plateau bioregion of central NT, with only six of the combined 50 species recorded from both regions (Figure 10b).

4. Discussion

We have revealed remarkable hyperdiversity within the Monomorium nigrius group, recognizing 97 species from limited geographic coverage of sequenced specimens. PTP analysis of CO1 clustering suggests that this figure is conservative. Given (1) the high levels of spatial turnover, (2) the fact that much of the taxon’s range remains unsampled, (3) that nearly one-third of the species are known from single records, and (4) many additional species (that are too old to yield sequences) are held in the Darwin collection, the sequenced specimens are likely to represent just a fraction of total diversity within the group.
We acknowledge that our sampling is limited when viewed at a continental scale, but we do not believe that this significantly affects our species delimitations. More than one-third (34) of our 97 recognized species occurs in a single region (Top End of the NT), and this region has been the most intensively sampled. The Top End fauna has very limited overlap with those of the region immediately south (central NT) that connects the Top End with the rest of Australia, which has also been intensively sampled. This indicates that further sampling would not show that species from other regions that we have recognized as different from those from the Top End are in fact conspecific. A detailed examination of sister relationships among our recognized species (Figure S1) further supports our view that our species delimitations are not an artefact of limited sampling. For example, we recognize 20 species (all of the ‘
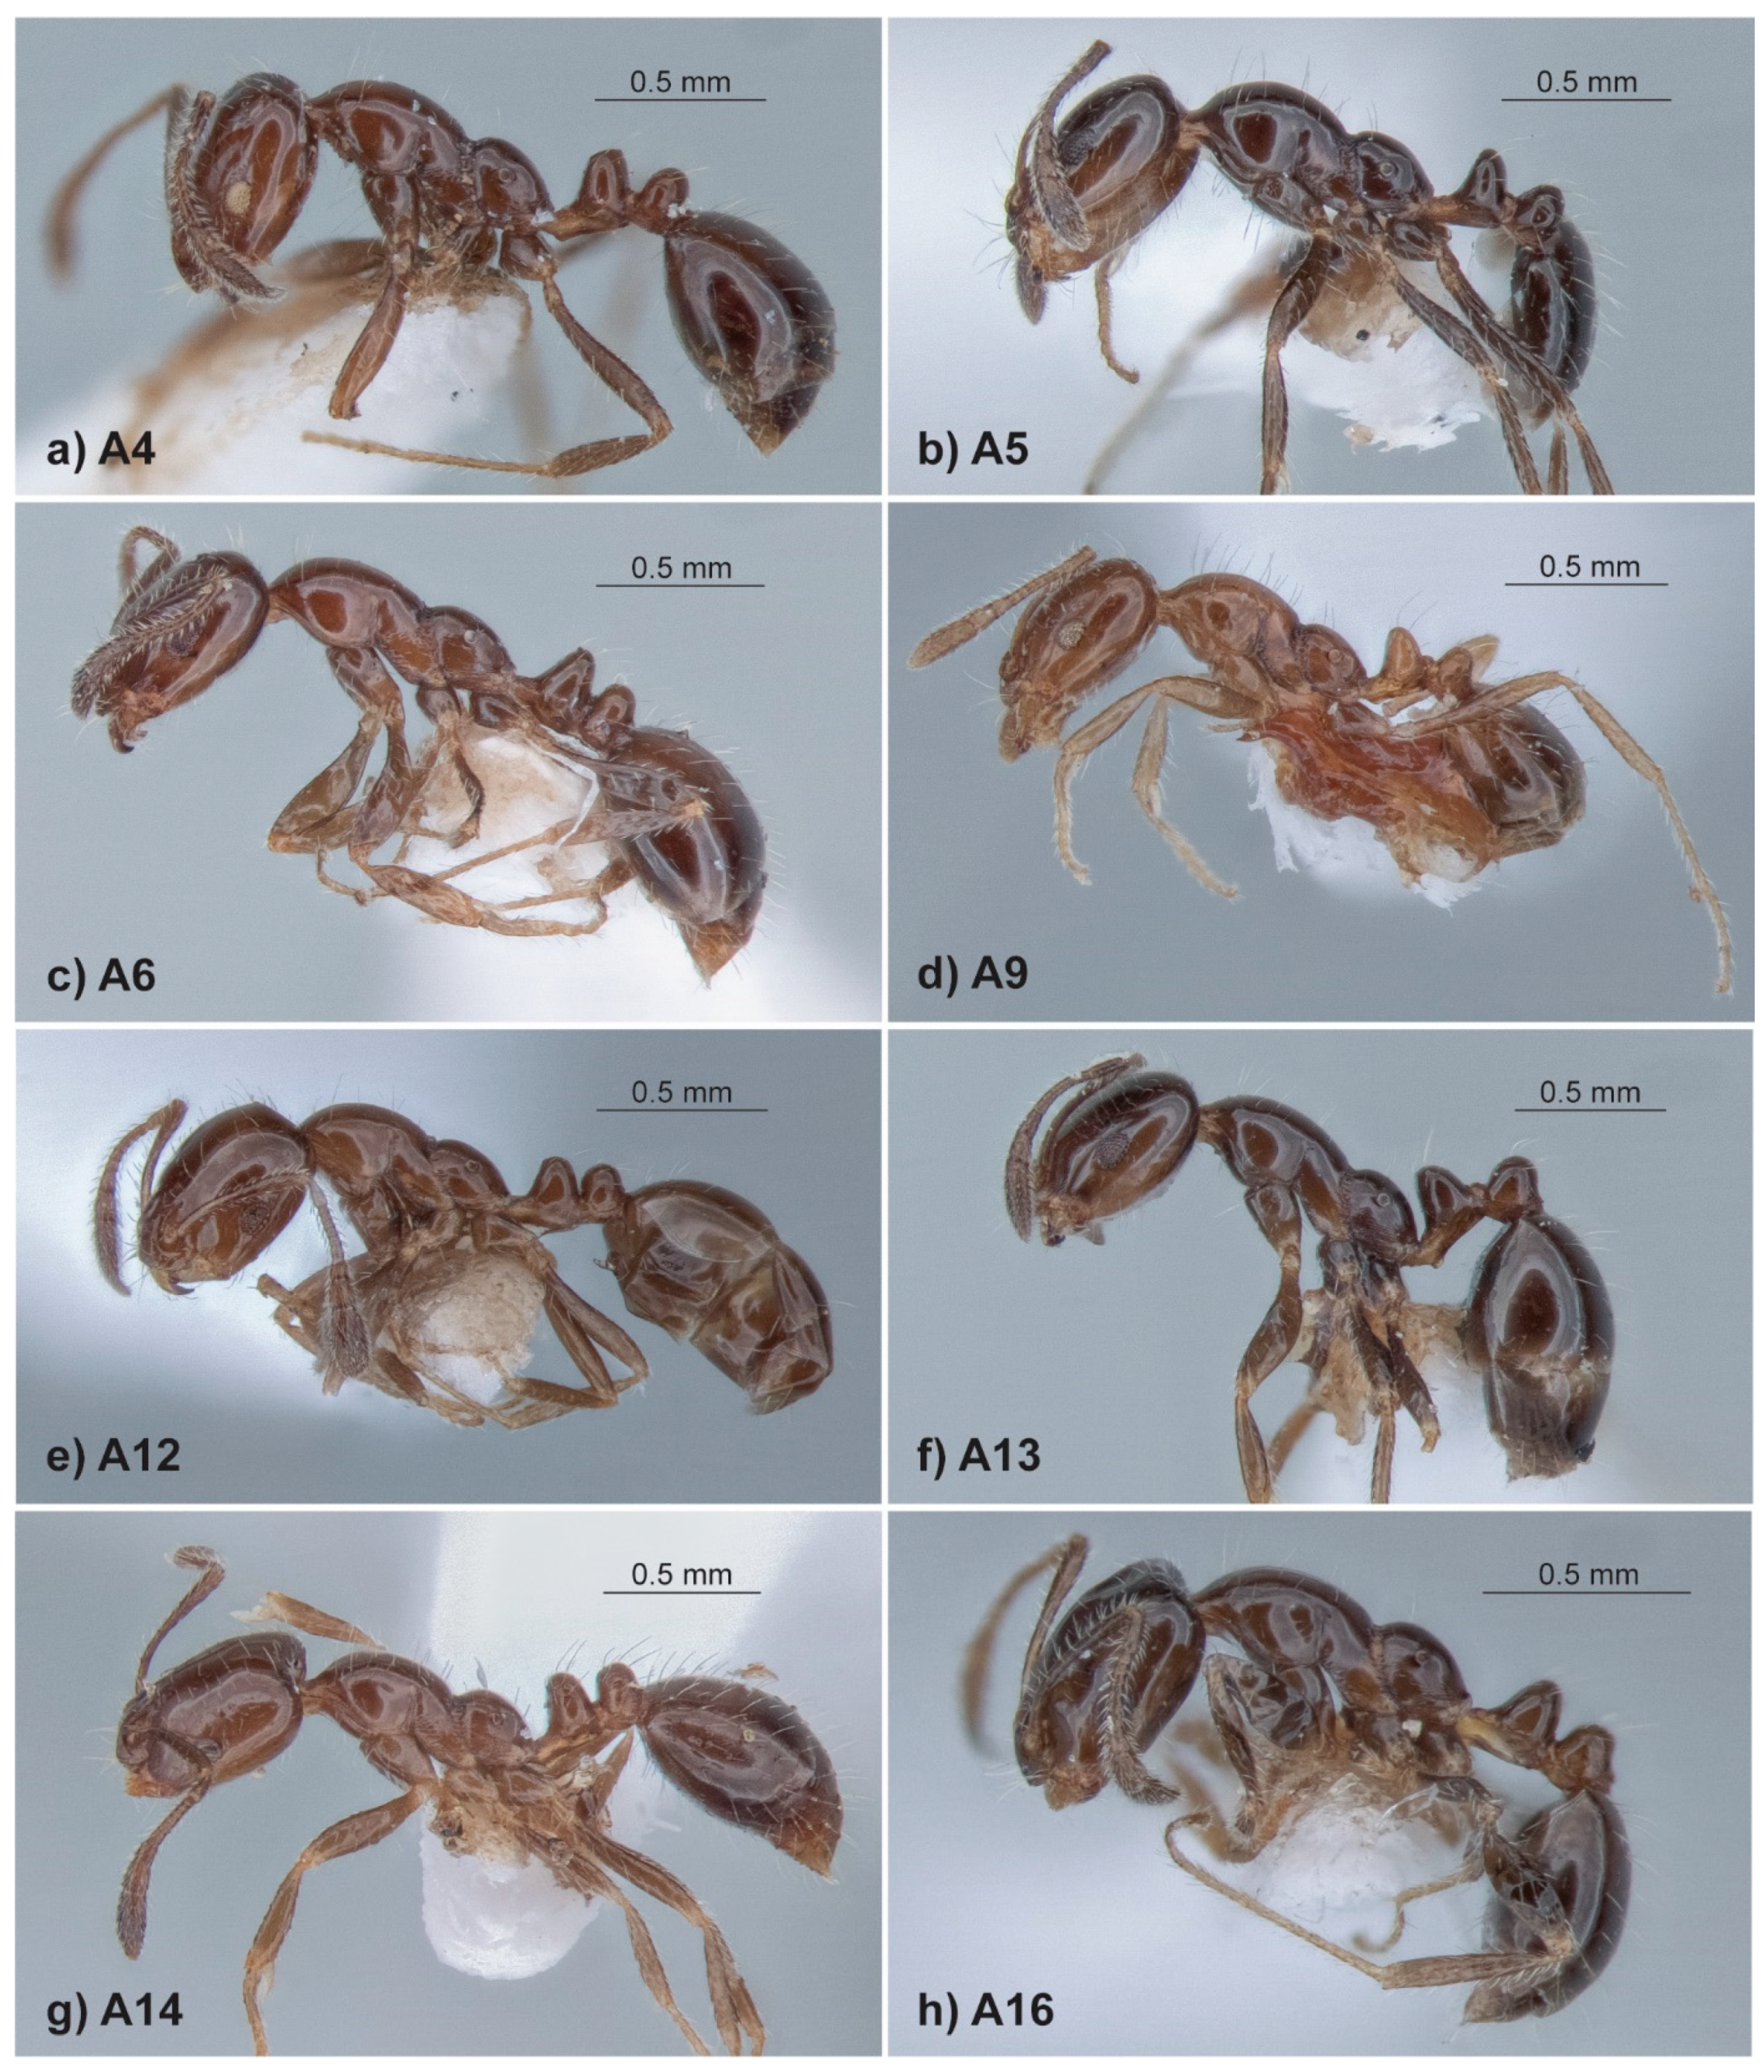
fieldi’ morphotype) in clade A. A1 is represented by ten specimens, all of which occur in southwestern western Australia. Its two sister species (A2 and A3) are from the Top End of the NT (furthest north) rather than from central or southern NT (which connect the Top End to southern Australia). These three species belong to a clade that includes two other, clearly distinct species, one (A4; Figure 4a) known only from the Top End and the other (A5; Figure 4b) occurring both in the Top End and central NT. The sister to this clade is another species from southwestern Australia (A6; Figure 4c), which obviously cannot be the same as A1. Similar reasoning can be applied to other species.
The 34 species that we recognize from the Top End of the NT is twice as many as listed by [9], and it does not include several species on that list (Figure 11). Many of the species appear to have narrow ranges. For example, species E1, H1 and L are all known only from the same one site near Darwin [8], and species G1 is known only within a 20 km range from that site. Given the limited spatial coverage of samples (Figure 1), it is likely that the total Top End fauna comprises at least 50 species.
We recorded far fewer species in the two other high-rainfall regions of northern Australia: the Kimberley with 21 species, and far North Queensland with only seven. However, these figures are proportionate to sampling effort (Figure 1, Table S1) and there is no reason to believe that the faunas of these regions are substantially less diverse than in the Top End. Given the very little species overlap among them, the three regions collectively can be expected to have around 150 species. The high diversity (22 species) of the Sturt Plateau subregion of central NT is presumably repeated throughout the semi-arid north of the continent, suggesting that over 200 species occur just in monsoonal Australia. Diversity is also high in semi-arid central and southern Australia, with virtually no overlap with the monsoonal fauna, and so a reasonable estimate of the total M. nigrius-group fauna is a phenomenally high 300 species.
An analysis of other (especially nuclear) genes is required for testing the robustness of the deeper clade structure within our CO1 tree. However, the high concordance between CO1 clade structure and our six previously recognized morphotypes suggests that they have a strong phylogenetic basis. Clade A contained all specimens of the ‘fieldi’ morphotype, and so this is likely to represent a phylogenetically robust species complex. However, all other morphotypes are shown in the CO1 tree as polyphyletic. The ‘donisthorpei’ morphotype occurs in two (disjunct) clades, one including ‘donisthorpei’ in the strict sense (clade C, with three recognized species), and the other including sp. 37 from [8] (clade D, with five recognized species). Despite their close morphological affinity (Figure 5) they likely represent separate species complexes. Notably, not only did two of the three ‘donisthorpei’ species from clade C occur at the same site but they did so in the same 10 × 10 m plot (plot 3 in [8]). One of these (C2; Figure 5b) is known only from the Top End, whereas the other (C1; Figure 2c,d) occurs also in the Kimberley region.
The ‘sp. 14’, ‘sp. 13’ and ‘sp. 9’ morphotypes appear to be particularly diverse phylogenetically. The ‘sp. 14’ morphotype occurs as three (G, I and J) of the ten major clades and is distributed throughout mainland Australia. Clade J consists exclusively of species from outside the monsoonal zone, ranging throughout southern semi-arid Australia from central Queensland to southwestern Western Australia. The only other sequenced specimens from southern Australia are from the ‘fieldi’ morphotype, one species (A6) of which is from southwestern Western Australia, and a distantly related species (A20) occurring throughout semi-arid southeastern Australia. Both are shown in the CO1 tree as being most closely related to (different) species from central NT.
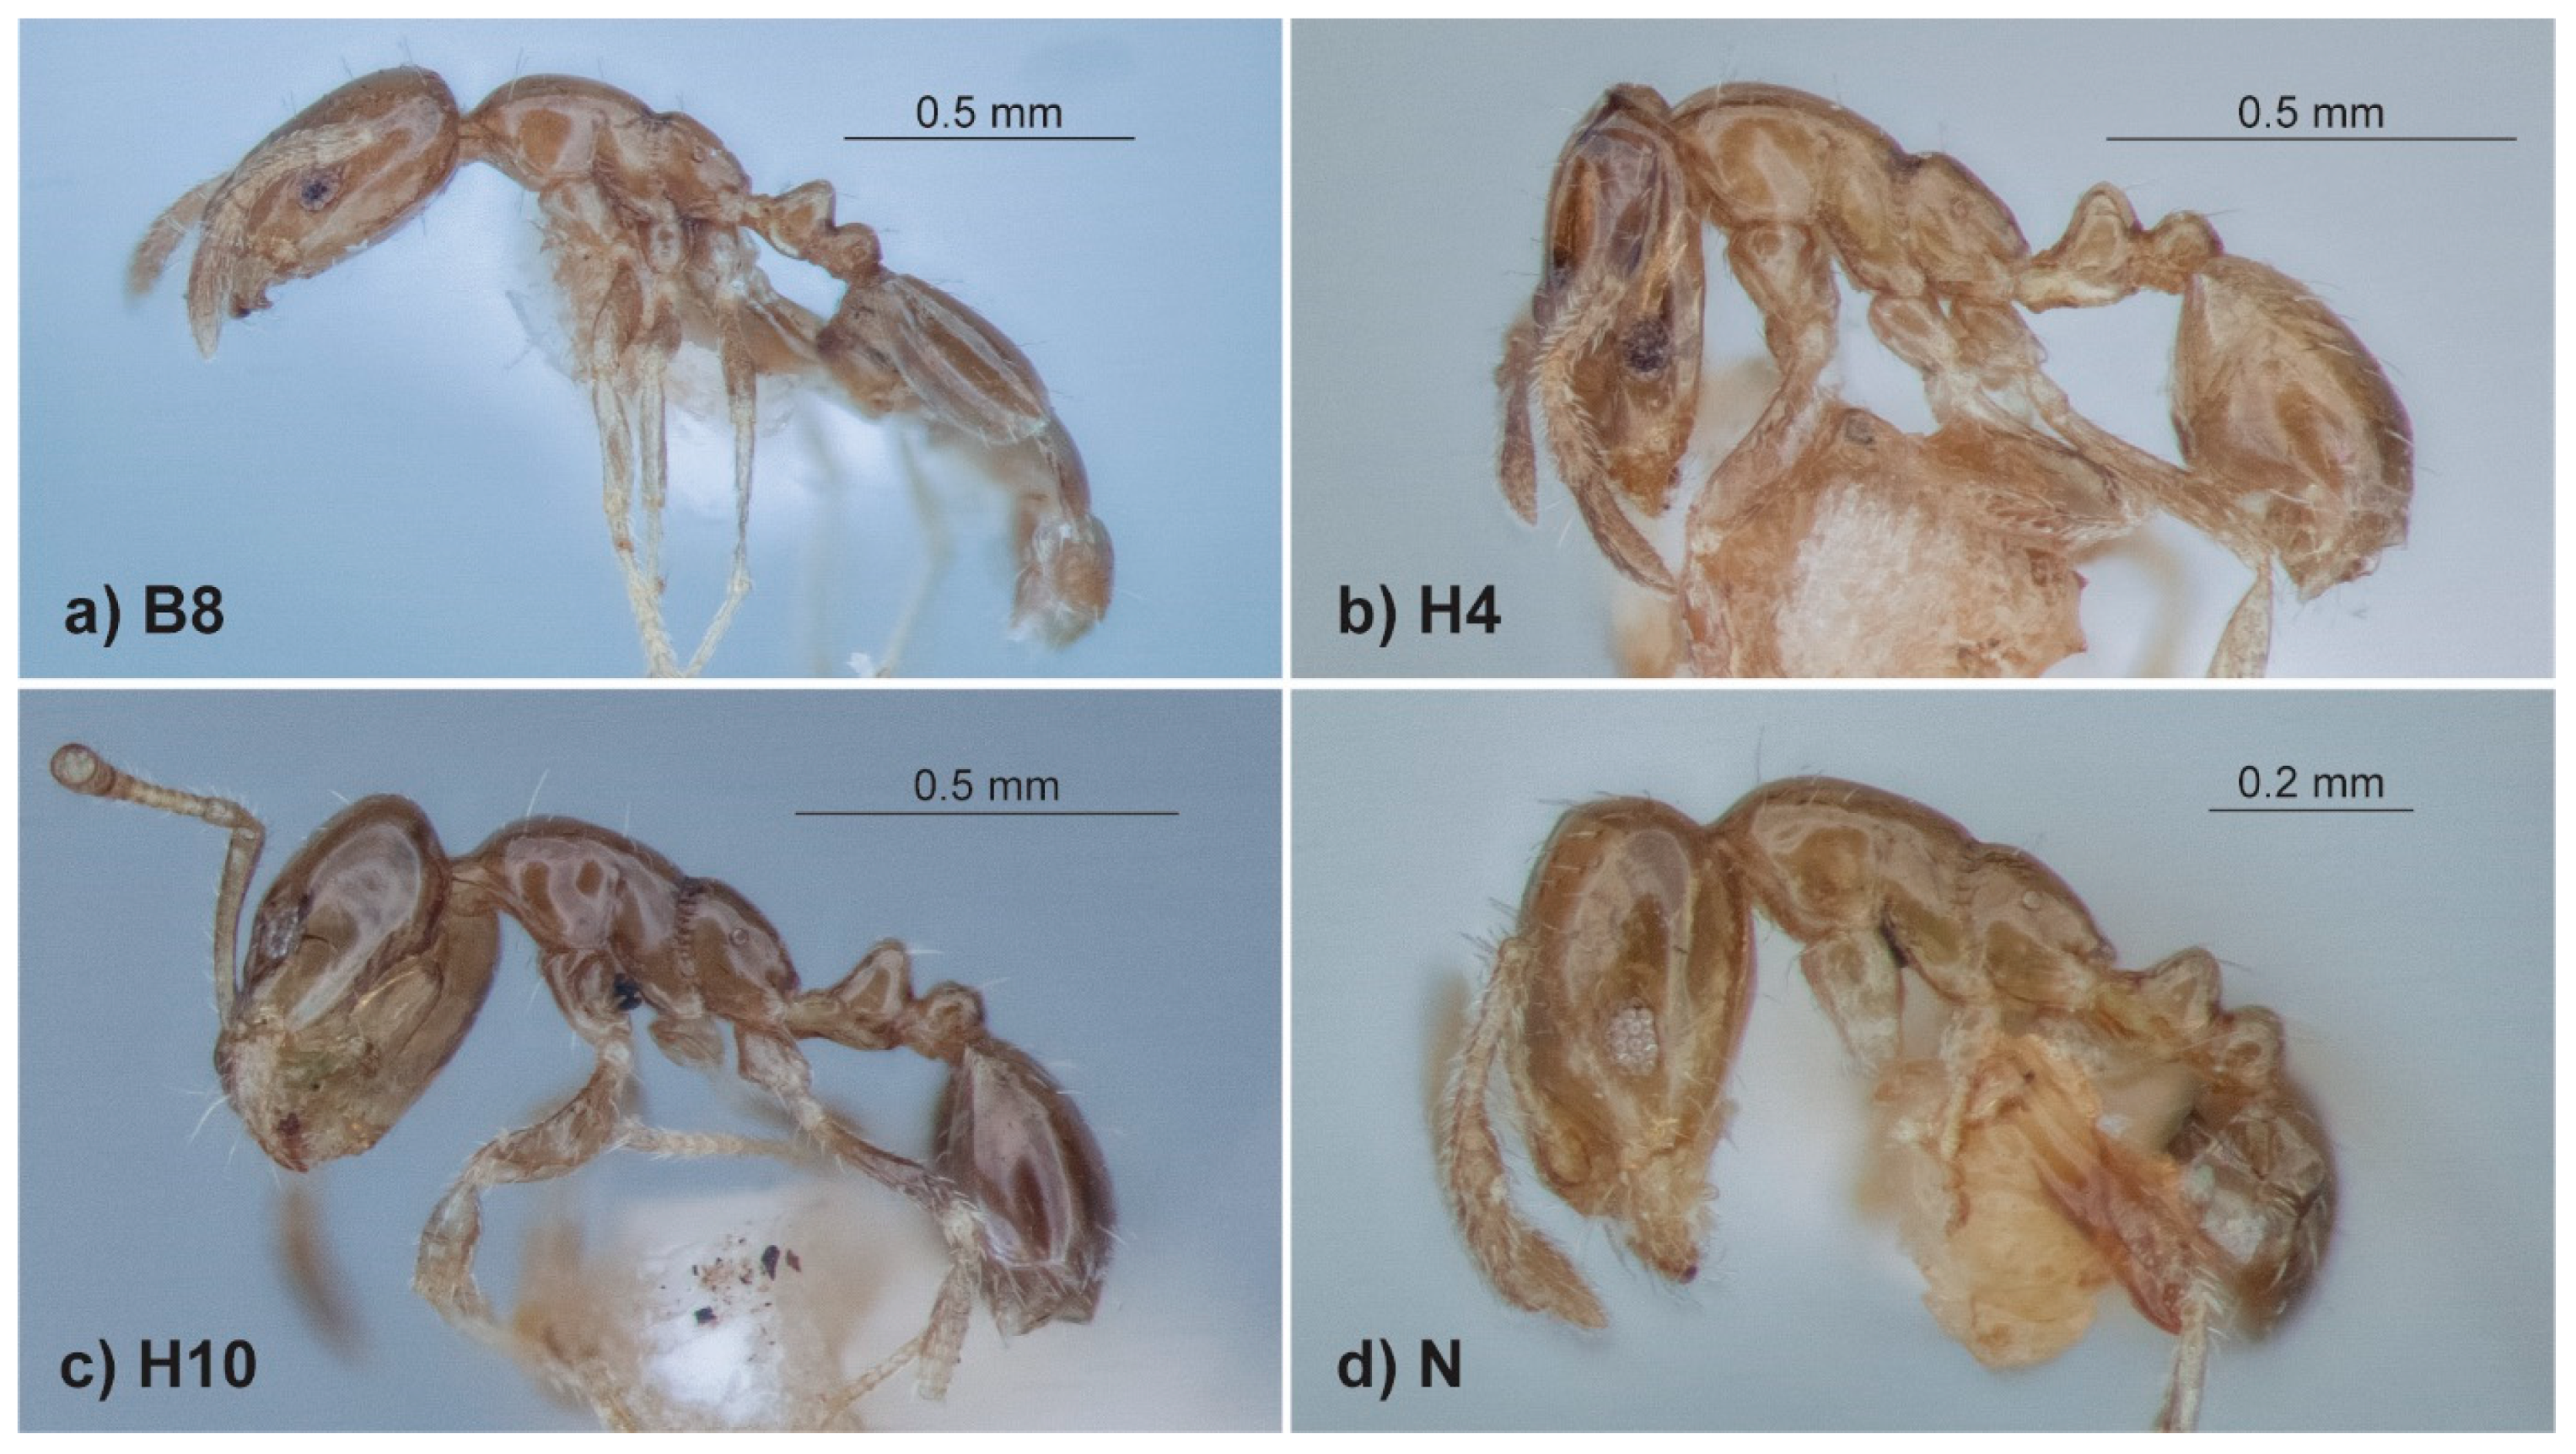
The ‘sp. 13’ morphotype is heavily concentrated in just one (H) of the ten major clades, but it is also represented in clade B (B8) and in two other locations on the CO1 tree (sp. M and sp. N; Figure 3). This strongly indicates that despite being highly distinctive and relatively uniform (Figure 2i,j and Figure 8), the morphotype has evolved multiple times. The ‘sp. 9’ morphotype occurs in three locations (clades F and K and sp. L) on the CO1 tree and these are associated with conspicuous morphological differences, suggesting that they represent three separate species complexes. Species L (sp. 9 from [8]) is unique among known species within the M. nigrius group in being somewhat polymorphic (with head size and shape showing considerable allometric variation) and having an anterior clypeal margin that is only weakly convex (Figure 2k). The two species from clade K (Figure 9c,d) are unusual in having a mesosoma that is conspicuously sculptured postero-laterally; the unsequenced sp. 64 (Figure 11c) shares this trait and presumably belongs to this complex.
Our M. ?antipodum sample is an outlier on the CO1 tree. It was collected from suburban Sydney and the only other specimens in the Darwin collection that match it morphologically are from suburban Brisbane. Together, this strongly suggests that it is introduced and is indeed M. antipodum from New Zealand, where it is commonly associated with human settlements (Don 2007).

5. Conclusions

What are the implications of our findings for total richness within the ant fauna of monsoonal Australia? Two decades ago, the fauna was estimated to contain approximately 1500 species, which at the time seemed remarkably high [6]. In that analysis, the Melophorus rufoniger group (then referred to as the M. aeneovirens group, before M. rufoniger was described) was estimated to contain ten species and the Monomorium nigrius group twenty, estimates that have now been shown to be an order of magnitude too low. The more recent analysis of the ant fauna of the Top End of the NT recognized 901 native species, with a remarkable 60% of these apparently endemic to the region [9]. Subsequent surveys in the Top End (e.g., [18]) have recorded over 100 additional species. Detailed analyses of the Melophorus rufoniger and Monomorium nigrius groups have revealed that richness in these taxa is at least twice as high as was then recognized, and that levels of regional endemism are far higher than 60%. Our unpublished CO1 data show that this is true for many other species groups within Melophorus and Monomorium, as well as in other genera such as Tetramorium, Rhytidoponera, Meranoplus, Camponotus and Iridomyrmex. Given the highly patchy sampling within the Top End (Figure 1), we estimate that its total ant fauna comprises at least 1300 species.
Ant diversity and endemism are also exceptionally high in the Kimberley region of far northern Western Australia [19,20,21]. Other biogeographical regions in monsoonal Australia have been even less intensively sampled, but their levels of species richness and endemism are also likely to be extremely high (see [21] for a broader discussion of this). This means that the total monsoonal fauna likely numbers in the several thousand.
Such diversity is truly remarkable for a tropical savanna landscape. For example, although the ant fauna of the similarly sized Brazilian savanna (‘cerrrado’) is considered particularly diverse [22], it is estimated to comprise only approximately 700 species (R. Feitosa, personal communication). Peak ant diversity globally is generally considered to occur in lowland tropical rainforest and especially in Amazonia [23]. However, our analysis suggests that monsoonal Australia may in fact be the true global centre of ant diversity. How can such remarkable richness—and that of arid Australia more generally, be explained? It is presumably a product of historical processes given that the contemporary Australian environment is not so dramatically different from elsewhere in the world. The remarkable diversity occurs within species complexes rather than at the genus level, indicating that it was generated over recent evolutionary time. One explanation [24] is that it is a product of the Pleistocene glaciations that caused massive movement of sand across Australia during these times of peak aridity, when up to 85% of the continent was covered by desert dunes. Such dunes are hostile for most ant species, whose distributions would have retracted to isolated refugia scattered within the vast sand-dominated landscape, allowing for speciation on a mass scale.

Supplementary Materials

The following supporting information can be downloaded at: https://www.mdpi.com/article/10.3390/d14010046/s1, Table S1: List of sequenced specimens of the Monommorium nigrius group, along with their collection localities. Figure S1: Full CO1 tree of sequenced specimens of the Monomorium nigrius group, showing recognized species delimited by an integration of morphological, genetic and distributional information, along with those indicated by PTP (maximum likelihood) and ePTP analyses of the full tree.

Author Contributions

A.N.A. conceived this study, led the development of the Darwin ant collection, and wrote the first draft of the manuscript. F.B. undertook the analysis of the CO1 data, prepared the figures and contributed to the writing of this paper. B.D.H. helped develop the Darwin ant collection and contributed to the writing of this paper. All authors have read and agreed to the published version of the manuscript.

Funding

This research received no external funding.

Institutional Review Board Statement

Not applicable.

Data Availability Statement

CO1 sequence data are available from the authors upon request.

Acknowledgments

We thank our many collaborators who collected the specimens analyzed in this study, and especially Magen Pettit, Tony Hertog and Jodie Hayward from CSIRO, as well as staff from the Flora and Fauna Division of the NT Department of Environment and Natural Resources who conducted biodiversity monitoring in Kakadu, Nitmiluk and Litchfield National Parks in the Northern Territory. We also thank Stefanie Oberprieler for providing access to imaging facilities.

Conflicts of Interest

The authors declare no conflict of interest.

References

  1. Oberprieler, S.K.; Andersen, A.N.; Moritz, C.C. Ants in Australia’s monsoonal tropics: CO1 barcoding reveals extensive unrecognised diversity. Diversity 2018, 10, 36. [Google Scholar] [CrossRef] [Green Version]
  2. Andersen, A.N.; Hoffmann, B.D.; Oberprieler, S.K. Integrated morphological, CO1 and distributional analysis confirms many species in the Iridomyrmex anceps (Roger) complex of ants. Zool. Syst. 2020, 45, 219–230. [Google Scholar]
  3. Heterick, B.E.; Castalanelli, M.; Shattuck, S.O. Revision of the ant genus Melophorus (Hymenoptera, Formicidae). Zookeys 2017, 1–420. [Google Scholar] [CrossRef] [PubMed]
  4. Andersen, A.N.; Hoffmann, B.D.; Oberprieler, S.K. Megadiversity in the ant genus Melophorus: The M. rufoniger Heterick, Castalanelli and Shattuck species group in the top end of Australia’s northern territory. Diversity 2020, 12, 386. [Google Scholar] [CrossRef]
  5. Andersen, A.N. Ant diversity in arid Australia: A systematic overview. In Advances in Ant Systematics (Hymenoptera: Formicidae): Homage to E. O. Wilson—50 Years of Contributions; Snellling, R.R., Fisher, B.L., Ward, P.S., Eds.; Memoirs American Entomological Institute Series; American Entomological Institute: Logan, UT, USA, 2007; pp. 19–51. [Google Scholar]
  6. Andersen, A. The Ants of Northern Australia: A Guide to the Monsoonal Fauna; CSIRO Publishing: Melbourne, Australia, 2000; ISBN 0643066039. [Google Scholar]
  7. Heterick, B.E. Revision of the Australian ants of the genus Monomorium (Hymenoptera: Formicidae). Invertebr. Syst. 2001, 15, 353–459. [Google Scholar] [CrossRef]
  8. Andersen, A.N.; Arnan, X.; Sparks, K. Limited niche differentiation within remarkable co-occurrences of congeneric species: Monomorium ants in the Australian seasonal tropics. Austral Ecol. 2013, 38, 557–567. [Google Scholar] [CrossRef]
  9. Andersen, A.N.; Hoffmann, B.D.; Oberprieler, S. Diversity and biogeography of a species-rich ant fauna of the Australian seasonal tropics. Insect Sci. 2018, 25, 519–526. [Google Scholar] [CrossRef] [PubMed]
  10. Don, W. Ants of New Zealand; Otago University Press: Dunedin, New Zealand, 2007; ISBN 1877372471. [Google Scholar]
  11. Kumar, S.; Stecher, G.; Li, M.; Knyaz, C.; Tamura, K. MEGA X: Molecular evolutionary genetics analysis across computing platforms. Mol. Biol. Evol. 2018, 35, 1547–1549. [Google Scholar] [CrossRef]
  12. Edgar, R.C. MUSCLE: Multiple sequence alignment with high accuracy and high throughput. Nucleic Acids Res. 2004, 32, 1792–1797. [Google Scholar] [CrossRef] [Green Version]
  13. Kimura, M. A simple method for estimating evolutionary rates of base substitutions through comparative studies of nucleotide sequences. J. Mol. Evol. 1980, 16, 111–120. [Google Scholar] [CrossRef] [PubMed]
  14. Smith, M.A.; Fisher, B.L.; Hebert, P. DNA barcoding for effective biodiversity assessment of a hyperdiverse arthropod group: The ants of Madagascar. Philos. Trans. R. Soc. B Biol. Sci. 2005, 360, 1825–1834. [Google Scholar] [CrossRef] [PubMed] [Green Version]
  15. Schlick-Steiner, B.C.; Steiner, F.M.; Moder, K.; Seifert, B.; Sanetra, M.; Dyreson, E.; Stauffer, C.; Christian, E. A multidisciplinary approach reveals cryptic diversity in Western Palearctic Tetramorium ants (Hymenoptera: Formicidae). Mol. Phylogenet. Evol. 2006, 40, 259–273. [Google Scholar] [CrossRef] [PubMed]
  16. Nguyen, L.T.; Schmidt, H.A.; Von Haeseler, A.; Minh, B.Q. IQ-TREE: A fast and effective stochastic algorithm for estimating maximum-likelihood phylogenies. Mol. Biol. Evol. 2015, 32, 268–274. [Google Scholar] [CrossRef] [PubMed]
  17. Zhang, J.; Kapli, P.; Pavlidis, P.; Stamatakis, A. A general species delimitation method with applications to phylogenetic placements. Bioinformatics 2013, 29, 2869–2876. [Google Scholar] [CrossRef] [PubMed] [Green Version]
  18. Oberprieler, S.K.; Andersen, A.N.; Yeates, D.K. Selecting complementary target taxa for representing terrestrial invertebrate diversity in the Australian seasonal tropics. Ecol. Indic. 2020, 109, 105836. [Google Scholar] [CrossRef]
  19. Andersen, A.N.; Lanoue, J.; Radford, I. The ant fauna of the remote Mitchell Falls area of tropical north-western Australia: Biogeography, environmental relationships and conservation significance. J. Ins. Cons. 2010, 14, 647–661. [Google Scholar] [CrossRef]
  20. Cross, A.T.; Myers, C.; Mitchell, C.N.A.; Cross, S.L.; Jackson, C.; Waina, R.; Mucina, L.; Dixon, K.W.; Andersen, A.N. Ant biodiversity and its environmental predictors in the North Kimberley region of Australia’s seasonal tropics. Biodivers. Conserv. 2016, 25, 1727–1759. [Google Scholar] [CrossRef]
  21. Bowman, D.M.J.S.; Brown, G.K.; Braby, M.F.; Brown, J.R.; Cook, L.G.; Crisp, M.D.; Ford, F.; Haberle, S.; Hughes, J.; Isagi, Y.; et al. Biogeography of the Australian monsoon tropics. J. Biogeogr. 2010, 37, 201–216. [Google Scholar] [CrossRef]
  22. Hölldobler, B.; Wilson, E.O. The Ants; Belknap Press of Harvard University Press: Cambridge, MA, USA, 1990; ISBN 0674040759. [Google Scholar]
  23. Campos, R.I.; Vasconcelos, H.L.; Andersen, A.N.; Frizzo, T.L.M.; Spena, K.C. Multi-scale ant diversity in savanna woodlands: An inter-continental comparison. Austral Ecol. 2011, 36, 983–992. [Google Scholar] [CrossRef] [Green Version]
  24. Andersen, A.N. Ant megadiversity and its origins in arid Australia. Austral Entomol. 2016, 55, 132–147. [Google Scholar] [CrossRef]
Figure 1. Map of Australia showing the approximate boundary of the monsoonal tropics (dashed line), where rainfall is very heavily concentrated in a summer wet season. Collection localities (red dots) for sequenced specimens of the Monomorium nigrius group are indicated, as are the four regions in the monsoonal zone where collections are concentrated.
Diversity 14 00046 g001
Figure 2. Images of the six general morphotypes of species within the Monomorium nigrius group. (a,b) ‘fieldi’ (sequenced specimen ID OZBOL4003-21; species A15); (c,d) ‘donisthorpei’ (OZBOL4454-21; species C3); (e,f) ‘sp. 50’ (MONO197-16; species B19); (g,h) ‘sp. 14’ (OZBOL4460-21; species G6); (i,j) ‘sp. 13’ (OZBOL4013-21; species H9); (k,l) ‘sp. 9’ (not sequenced, collected from the Territory Wildlife Park, near Darwin, NT; species L).
Diversity 14 00046 g002
Figure 3. Summary CO1 tree showing the ten major clades (A–J) and distribution of the six morphotypes (see Figure 2).
Diversity 14 00046 g003
Figure 4. Images of species from the ‘fieldi’ morphotype. (a) Specimen MONO237-16; Kakadu NP, NT; (b) specimen OZBOL1366-21; Douglas Daly, NT; (c) specimen DARW347-15; Eurardy Stn, WA; (d) specimen MONS028-18; Nitmiluk NP, NT; (e) specimen OZBOL1364-21; Lakefield NP, Qld; (f) specimen OZBOL4008-21; Forrest Hill Stn., NT; (g) specimen MONO254-16; Lizard Island, Qld; (h) specimen OZBOL4004-21; Hayfield Shenandoah Stn, NT.
Diversity 14 00046 g004
Figure 5. Images of species from the ‘donisthorpei’ morphotype. (a) Specimen OZBOL4021-16; Hayfield Shenandoah Stn; NT; (b) specimen OZBOL4451-21; Gove Peninsula, NT; (c) specimen MONO257-16; Mitchell Falls, WA; (d) specimen 318 from Andersen et al. 2013.
Diversity 14 00046 g005
Figure 6. Images of species from the ‘sp. 50’ morphotype. (a) Specimen OZBOL3995-16; Forrest Hill Stn, NT; (b) specimen OZBOL3996-21; Forrest Hill Stn, NT; (c) specimen MONO225-16; Pine Creek, NT; (d) specimen MONO266-16; Eurardy Stn, WA; (e) specimen OZBOL4005; Hayfield Shenandoah Stn, NT; (f) specimen OZBOL1353-21; Ranger Uranium Mine, NT; (g) specimen OZBOL1348-21; Gove Peninsula, NT; (h) specimen OZBOL4030-21; Hayfield Shenandoah Stn, NT.
Diversity 14 00046 g006
Figure 7. Images of species from the ‘sp. 14’ morphotype. (a) specimen MONM613-18; Mt Elizabeth, WA; (b) specimen DARW225-15; Currawarra Stm, Qld; (c) specimen MONO110-16; Claravale Stn, Qld; (d) specimen MONO111-16; Glendonnel Stn, Qld; (e) specimen MONO170-16; Jilbadji Nat Res, WA: (f) specimen DARW237-15; Eurardy Stn, WA.
Diversity 14 00046 g007
Figure 8. Images of species from the ‘sp. 13’ morphotype. (a) Specimen OZBOL1330-21; Maryfield Stn, NT; (b) specimen MONM594-18; Mt Elizabeth, WA; (c) MONOM595-18; Cascade Ck, WA; (d) specimen DARW206-15; Theda Stn, WA.
Diversity 14 00046 g008
Figure 9. Images of species from the ‘sp. 9’ morphotype. (a) Specimen DARW250-15; Maryfield Stn, NT; (b) specimen MONM591-18; Mt Elizabeth, Kimberley, WA; (c) specimen MONS008-18; Nitmiluk NP, NT; (d) specimen OZBOL4039-21; Hayfield Shenandoah Stn, NT.
Diversity 14 00046 g009
Figure 10. Species overlap among subregions within (a) the Top End of the NT, and (b) major regions in north-western Australia. Data are numbers of unique and shared species represented by the sequenced specimens.
Diversity 14 00046 g010
Figure 11. Additional species known from the Top End of the NT (not sequenced in this study). The species belong to the ‘sp. 14’ (a), ‘fieldi’ (b), ‘sp. 9’ (c) and ‘donisthorpei’ (d) morphotypes. Species codes follow [8].
Diversity 14 00046 g011
Table 1. Number of indicated species within each of the ten major clades (A–J; see Figure 3). Data are for PTP (maximum likelihood), bPTP (Bayesian inference), and integrated assessment (considering morphological, distributional and CO1 information). For PTP and bPTP analyses, data are provided for assessments of the full tree (A) and each clade individually (B). The totals include specimens outside the ten major clades. For the integrated assessment, the CO1 distances among species (calculated in MEGA) within each clade are shown.
CladeNo. Indicated SpeciesCO1 Distance (%)
PTPbPTPIntegratedMeanRange
ABAB
A23115nc204.91.5–11.3
B161416161910.92.3–15.9
C55934311.711.5–12.1
D3971555.63.7–7.2
E914121598.35.7–10.9
F565655.84.2–7.7
G86161066.82.9–8.9
H2152nc106.61.8–19.3
I4444415.813.8–17.2
J97981011.32.6–15.5
TOTAL72120102nc97
nc = not converged and so results have been discarded.
Publisher’s Note: MDPI stays neutral with regard to jurisdictional claims in published maps and institutional affiliations.

