Article

Consistent Grime’s CSR Strategy of Daisy Fleabane Erigeron annuus (L.) Pers. despite Its High Morphological Variability—A Case Study from Zagreb and Medvednica Mt., Croatia

Department of Biology, Faculty of Science, University of Zagreb, Rooseveltov Trg 6, 10000 Zagreb, Croatia
*
Author to whom correspondence should be addressed.
Diversity 2022, 14(1), 45; https://doi.org/10.3390/d14010045
Submission received: 13 December 2021 / Revised: 6 January 2022 / Accepted: 7 January 2022 / Published: 11 January 2022
(This article belongs to the Special Issue Biological Invasions: Selected Papers from NEOBIOTA 2020)

Abstract

:
Alongside the direct destruction of natural habitats and changes in land use, invasive species are considered one of the greatest threats to global biodiversity. Daisy fleabane Erigeron annuus (L.) Pers. is among the most widespread invasive plants in Croatia. Invasions of E. annuus may be aided by morphological variability, which this study investigates. The variability of life traits (stem height, fresh and dry leaf mass, length, width and leaf area, specific leaf area, and leaf dry matter content) was examined among 18 locations throughout Zagreb and Medvednica Mt. Overall, 87 plant specimens and 435 leaves were measured and analysed using univariate and multivariate statistics. Viable populations were recorded in diverse habitat types, mostly with marked human impact. We determined Grime’s CR plant life strategies for all, except for two localities with C/CR plant strategies. Two populations with a more pronounced competitive strategy had high leaf dry matter content, with smaller leaves and medium height stems. Significant differences between the localities were found, with the specific leaf area (SLA) and plant height being the most diverse. Despite its high morphological variability, daisy fleabane had a consistent CSR strategy, which likely enables its widespread invasions across variable habitats.

1. Introduction

Urban and industrial areas, along with intensively used agricultural land, suffer strong anthropogenic impacts and are highly exposed to colonization by invasive alien species (IASs) [1,2,3,4]. They threaten ecosystems, habitats, and biodiversity, as well as the economy and human health [5,6]. Common characteristics of IASs are hyperproduction and pronounced expansion of diaspores, long-lived seeds, wide ecological amplitude, pronounced phenotypic plasticity, and short and fast life cycles [7]. Ecological factors important for the invasive potential of species are adaptability, the sensitivity of specific habitats to invasions, and propagule pressure [8]. IASs are usually considered to not be better competitors than natives but make more efficient use of the conditions provided by disturbed habitats [9]; however, it seems that their competitive abilities have been underestimated. Nevertheless, a universal explanation for the invasion of individual alien plants has been elusive [10].
A list of IASs in Croatia is gathered in the Flora Croatica Database [11], within the module "Allochthonous plants", and currently counts 77 invasive foreign taxa (accessed on 25 June 2021). One of the most common species, Erigeron annuus (L.) Pers. is an annual, biennial, or perennial plant species from North America belonging to the Asteraceae family, with erect stems reaching heights of 40–150 cm [12]. The leaves are softly hairy, ovate at the base to linear-lanceolate at the top of the stem, and morphologically quite variable. The outer unisexual female ligulate and inner bisexual tubular flowers are collected in medium-sized heads and united in a racemose compound inflorescence that blooms from May (June) to September (October) [7,12]. Seeds usually germinate in late summer, creating a rosette in autumn in which form it overwinters. The following spring it grows, matures, and blooms [9,13]. Plants of this species sometimes surpass annuality by retaining the shape of a rosette until the second or third summer [13] or germinating only the following spring [14].
The species is triploid (2n = 3× = 27) and primarily apomictic, which produces large amounts of genetically identical seeds. Occasional sexual reproduction is a source of recombination and relatively large genotypic variability of populations [8,9,14,15]. Within the species, three subspecies are present in Croatia—Erigeron annuus (L.) Pers. ssp. annuus, Erigeron annuus (L.) Pers. ssp. septentrionalis (Fernald et Wiegand) Wagenitz, and Erigeron annuus (L.) Pers. ssp. strigosus (Mühlenb. Ex Willd.) Wagenitz [11].
Daisy fleabane is a common weed of early successional stages [13] spreading over all types of habitats, mostly disturbed, from lowland to hilly terrains. Populations are less common (about 50%) at altitudes above 700 m, although the record at the highest altitude was in the Swiss Alps at 1762 m above sea level [8,16]. As a strong competitor across variable environmental conditions, it negatively affects native species by forming dense and numerous stands. It also has significant negative economic impacts on vineyards and orchards by reducing yields [7,17,18].
As the phenotype of an organism is the result of the interaction between its genotype and environmental conditions, the same genotype may exhibit different phenotypes, which allows for adaptation to a wide range of habitats [19]. Altitude gradients of mountain systems (e.g., Medvednica Mt. in Croatia) are often used when testing stress gradient responses, with the assumption that stress increases with altitude because of, for example, lower temperatures and air pressure, shallow soil, and low nutrient availability. In contrast, conditions of low precipitation and high air temperatures in summer prevail at lower altitudes and in urban areas, harden the physiological regulation of water, and limit plant production [20]. In addition to high resource-use efficiency, pronounced phenotypic plasticity is one of the features that allows IASs to be successful in new habitats, especially in the early stages of development when the ability to adapt allows them to survive within a wide range of environmental factors [8,21]. Numerous species, such as E. annuus, are often characterized by high phenotypic plasticity within their natural range, which contributes to their invasiveness and supports their spread to higher altitudes in non-native ranges [16].
By measuring and monitoring a plant’s morphology, it is partially possible to interpret its ecology. The variability of each trait is important in a particular ecological context, but plant size, seed size, and leaf tissue structure are at the very core of the life cycle and are significant almost universally for their functional variability [22]. By knowing certain functional characteristics, we can determine Grime’s CSR strategies for plants [23], which describe how species adapt to environmental conditions.
Grime’s CSR classification [24] is a method of categorizing plants based on a triangular model of plant strategy theory [25,26,27], which ascribes functional types to plant species according to their responses to stress and disturbance gradients. According to Grime et al. [27], species adapt to three of the four combinations of environmental extremes. Thus, three basic functional types have been identified — competitors (C) dominant in low stress and disturbance conditions, stress tolerators (S) adapted to high stress levels and low disturbances, and ruderal species (R) prevalent in conditions of high disturbance and low stress.
Typical competitors are fast-growing, clonal, tall perennials with large leaves and dense biomass, with a medium-early onset and a medium-long flowering period and that thrive in conditions of high productivity [1,25,28,29]. Stress tolerators are slow growing, often evergreen perennials of small, firm, and unpalatable leaves, with short reproduction stages and relatively sustainable yields in nutrient-poor conditions [1,27,29]. Ruderal species are fast growing with short lifespans, and early-onset and extended reproductive periods [1,24,29,30]. Previous studies of IASs in Croatia noted that E. annuus is dominated by the CR strategy [31] with the emergence of the C/CR, R/CR and SR strategies depending on the levels of disturbances within the environment in which the population occurs [18].
The specific leaf area (SLA) is one of the characteristics suitable for determining the C-, S-, and R-components of plant strategies, and it is proportional to the leaf growth rate. High values are achieved by well-lit, photosynthetically active leaves with high water and nitrogen contents, while low values are associated with longer-lasting leaves with a higher input of carbon compounds and secondary metabolites, such as lignins and tannins [22,28]. Plants living in permanently or occasionally nutrient-rich habitats have higher SLA values by rapidly forming new leaves during early life. A faster organ replacement cycle increases plants’ adaptability to an uneven spatial distribution of light and soil [28].
The leaf dry matter content (LDMC) is a measure of tissue density that is crucial in the utilization of nutrients and their incorporation into biomass. Low-density leaves are associated with rapid growth and productive habitats, while high-density ones are usually firmer and more resistant to physical damage. LDMC is proportional to leaf life and inversely proportional to its potential growth rate [22,32,33]. Stem height, which expresses the growth rate between disturbances, and specific leaf area as an indicator of leaf longevity and chemical composition, strongly influence plants’ placements within the C–S axis [24,28].
The aim of this study was to determine whether and to what extent morphological variability, which can contribute to invasiveness, occurs in daisy fleabane Erigeron annuus (L.) Pers. on Medvednica Mt. and in Zagreb across different environmental conditions. Furthermore, the intention was to test whether the morphological variability, if present, would contribute to different daisy fleabane CSR strategies.

2. Materials and Methods

2.1. Population Sampling

The sampling area was in the temperate zone, stretching from the alluvial floodplains of the Sava River (mean annual temperature of 10.8 °C, 880 mm of annual precipitation) to near the peak of Medvednica Mt. (mean annual temperature of 6.9 °C, 1350 mm of annual precipitation). The elevation gradient includes several climatogenic forest vegetation communities (e.g., pedunculated oak—common hornbeam; beech; beech—silver fir). Unlike Medvednica Mt., which is a nature park and mostly covered with forest vegetation, the city of Zagreb sustains significant anthropogenic impacts, with mostly human-altered habitats, including ruderal and semi-natural grasslands (http://www.bioportal.hr/gis/, acessed on 21 July 2021).
Individuals of daisy fleabane Erigeron annuus (L.) Pers. were collected during the 2019 flowering season (5 June–20 September). Five to eight flowering and well-developed individuals were harvested from 18 localities throughout Zagreb and Medvednica Mt., labelled, and transferred to the laboratory. Sample locations were identified through active searches for daisy fleabane during 11 field workdays, with the dates of field work determined by weather conditions and logistical constraints. Coordinates of the sampling locations were recorded along with their altitudes using a GPS device. Locations were photographed and briefly described in the field log. Since individuals lost turgor very quickly after excavation, they were rehydrated in the laboratory before further analysis. A total of 87 individuals and their 435 leaves at 18 sites were sampled (Figure 1, Table 1).

2.2. Measuring Life Traits

From each population, five individuals were selected, and their stem heights were measured. In accordance with Pérez-Harguindeguy et al. [22], five relatively young but fully developed and undamaged leaves from each individual were chosen for further measurements. As the oldest leaves of daisy fleabane are at the stem bottom and the youngest at the top, leaves from the middle part of the stem were selected, and their fresh mass was measured. Weighed leaves were marked and scanned with an HP Scanjet G3110 scanner. Next, they were dried in a Memmert UFB500 universal oven at 80 °C for 24 h and weighed again for dry mass. Subsequently, the areas, lengths, and widths of the leaves were measured from the scanned pictures using computer software ImageJ 1.42q.
For the purpose of determining CSR strategies and further analysis, specific leaf area (SLA) and leaf dry matter content (LDMC) were calculated according to the following formulas:
SLA (mm2/mg) = (leaf area (mm2))/(dry leaf mass (mg)),
LDMC (mg/g) = (dry leaf mass (mg))/(fresh leaf mass (g)).

2.3. Determining CSR Strategies

The CSR strategies of individual populations were assigned using the methods and algorithms proposed by Hodgson et al. [24], which are based on seven life traits. For CSR determination, macros in Microsoft Excel that were developed by Hodgson et al. [24] were used by entering the stem height, leaf dry weight, dry matter content, and specific leaf area. Three life traits that we did not collect, including the beginning and ending flowering period and the lateral spread, were collected from the literature [7,11,17]. Based on the values for the plants from each locality, the corresponding CSR strategy was assigned. For more information on the complex background calculation, see the original paper [24].

2.4. Statistical Analyses

Statistical analysis was conducted in Statistica 13.5.0.17. (TIBCO Software Inc. (2020). Data Science Workbench, http://tibco.com. 3307 Hillview Avenue Palo Alto, CA 94304, USA), except for the principal component analysis (PCA), which was done using CANOCO 4.5 software (Microcomputer Power). In addition, descriptive statistics of measured traits were calculated for each locality.
The measured parameters were tested for normality using the Kolmogorov–Smirnov test and non-normal values were logarithm-transformed to achieve normality. Life traits between sampling sites were compared with ANOVA and Tukey post-hoc tests were used to determine statistical differences of the traits between sites.
Additionally, we tested for the Pearson correlation between the mean values of the measured parameters by localities with 11 environmental variables—altitude, easterly and northerly aspect, that is, eastness and northness, respectively, slope, mean temperature and precipitation in summer, mean temperature and precipitation in spring, total precipitation, and mean and minimum annual temperature (see Supplementary Material, Table S1).
To further examine the relationships between the sampled populations, a principal components analysis (PCA) was conducted in which the square of the Jaccard similarity index, based on the measured trait values, was used as a distance measure.

3. Results

3.1. Measurements of Life Traits

Table 2 shows the results of the overall descriptive statistics of the measured characteristics for 87 stems and 435 leaves. Table S2 in the Supplementary Materials contains the individual results of the descriptive statistics by sampling site, while all the measurements are in the Supplementary Materials, Table S3. On average, specimens with the highest average values of fresh and dry mass, area, and leaf length and width were recorded at site T5. The highest average LDMC value was recorded for site T18. The second-highest average LDMC and the lowest average SLA values were recorded at site T4. On average, the smallest individuals were measured at site T15. The lowest mean values of fresh leaf mass and leaf length were recorded at site T18, dry leaf mass at site T14, and leaf area and width at site T6. The highest mean SLA and lowest LDMC were recorded for locality T8.

3.2. Determining CSR Strategies

By determining the CSR strategies of the sampled populations, it was found that competitiveness (C component) and ruderality (R component) dominated almost all of them. A total of two subtypes of CSR strategies were recorded, among which CR (16 populations) predominated, while C/CR was recorded for two populations (T4 and T18). Four characteristics shown in Table 3 were calculated for each population using the data we collected, while the other three were species-specific and obtained from the literature [7,11,17] (beginning of flowering—June, flowering period—June–September, ability to spread laterally—plant short-lived, corresponding to value 1 according to the classification [24]). Populations with the C/CR strategy had the highest leaf dry matter content, with relatively low dry leaf mass and low SLA values.

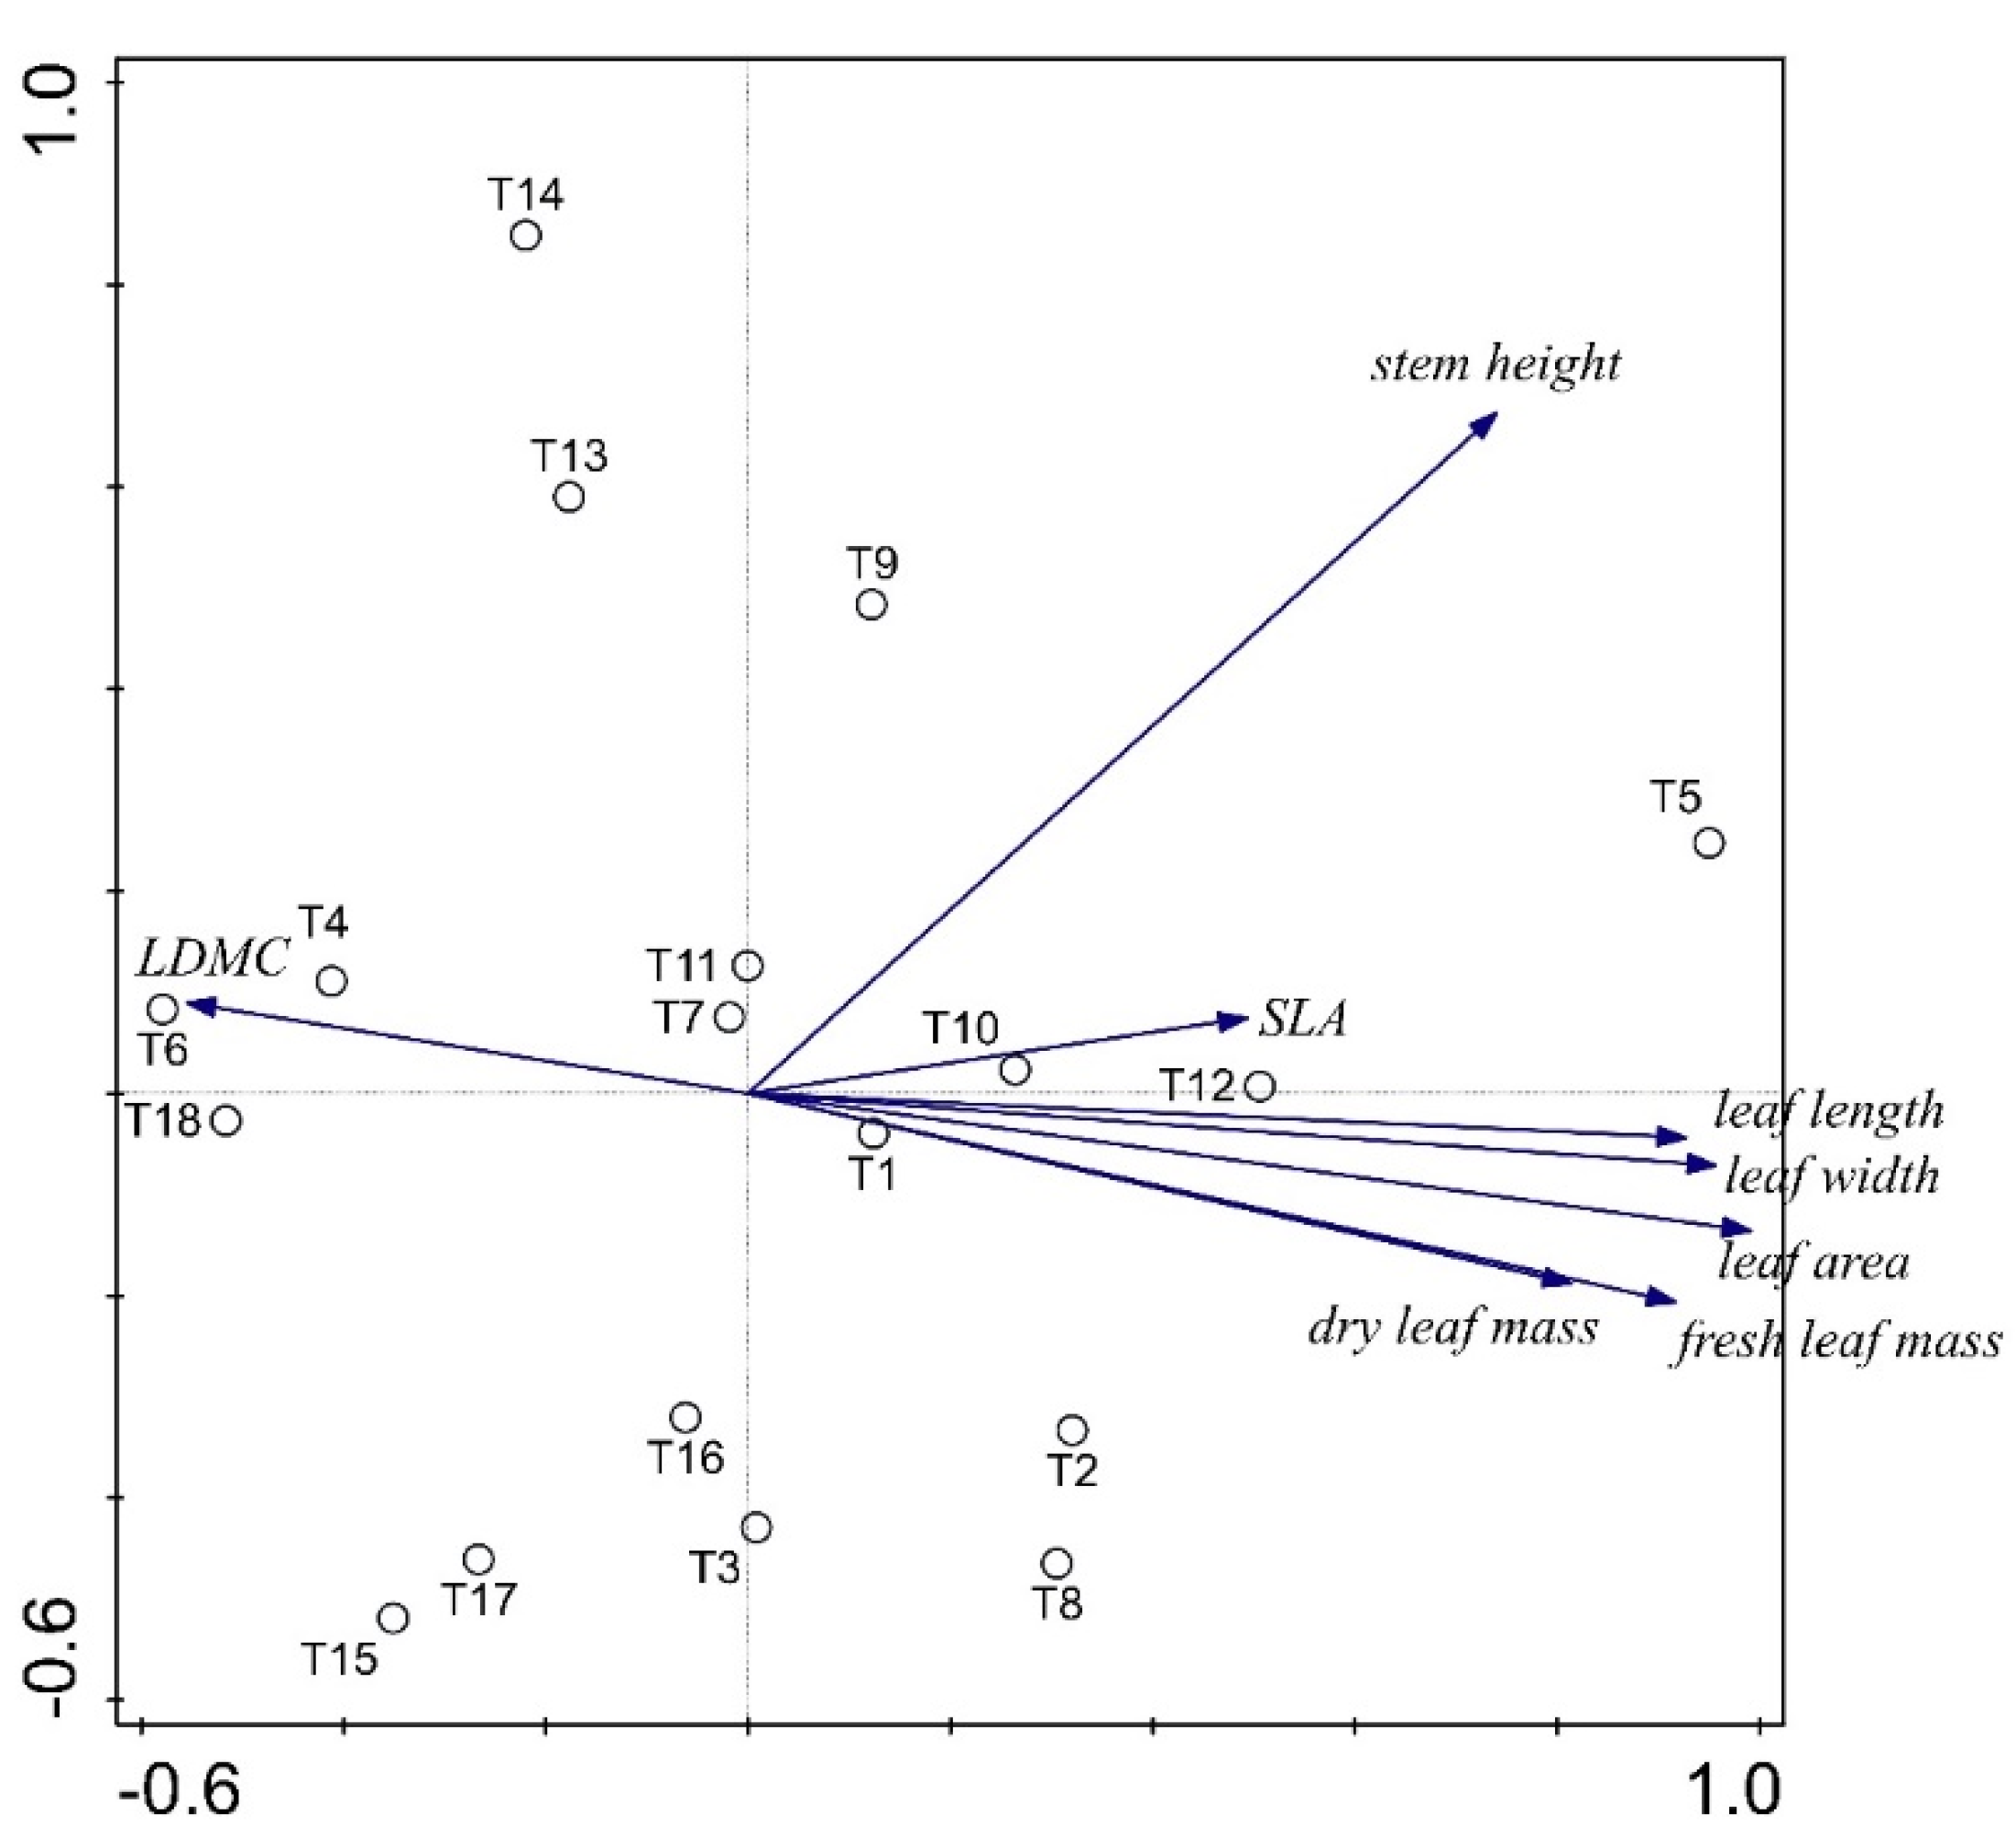
3.3. Comparison of Life Traits Variability between Sampled Populations

The ANOVA test showed that there were statistically significant differences in the measured characteristics of the stems and leaves among the localities (Table 4).
Among the sites, populations differed the most by stem height (Figure 2a) and SLA (Figure 2g), and the least by dry leaf mass (Figure 2c). Locality T5 had individuals with the largest fresh leaf mass and area, and with the longest and widest leaves. Locality T6 had the smallest leaf area, lengths and widths, while locality T4 had the smallest SLA (Figure 2g), and locality T18 had the largest LDMC (Figure 2h).
Based on the Tukey post-hoc tests (Supplementary Materials, Tables S8 and S9) of the length and width of leaves, populations recorded more statistically significant differences in leaf length than in leaf width. It was determined that SLA was one of the two measured life traits by which populations differed most (Supplementary Materials, Table S10), although the parameters by which it was calculated, that is, dry leaf mass and leaf area, showed a smaller number of statistically significant differences among the localities (Supplementary Materials Tables S6 and S7, respectively) than SLA itself.
The ordination biplot of the first two ordination axes of the PCAs is shown in Figure 3. The first axis explains 88.41% of the variability, while the second axis provides an additional 11.24%, which is cumulatively 99.65% for the first two axes. On the left side of the ordination biplot, the populations have higher LDMC values compared to those on the right side. Among them, the populations sampled in the open habitat along the river embankment (T6) and in the semi-open habitat (T18) had the highest values. In addition to having the lowest LDMC values, the populations on the right part of the biplot have the highest recorded values for all other measured life traits. Populations whose individuals had the largest, longest, and widest leaves were also the ones with the heaviest leaves. The ratio of fresh to dry leaf mass was almost equal among populations. Four out of the five populations sampled in September are placed in the third quadrant because they were the shortest, with smaller and lighter leaves. Almost all populations at altitudes higher than 300 m were placed in the upper part of the diagram due to their high growth. Populations with a more pronounced competitive strategy (T4 and T18) had a high dry matter content of leaves, which were both small and light, while their stems were of medium height.

3.4. Correlations of Life Traits with Environmental Variables

Pearson correlations of the measured life traits of E. annuus and environmental variables are expressed by correlation coefficients and corresponding “p” in Table 5. Two characteristics for which statistically significant correlations were recorded are dry leaf mass and SLA. The dry mass of the leaves was positively correlated with the minimum annual temperature. For SLA, there were positive correlations with the altitude, mean summer precipitation, and total precipitation, and a negative correlation with the mean summer, spring, and annual temperatures.

4. Discussion

Our results confirm the hypothesis that there is morphological variability among the populations of E. annuus. During the sampling, macroscopic differences of stems and leaves for individuals of different populations were noticeable, which was confirmed by further analysis. Significant differences among the populations were recorded for all measured parameters.
Although primarily apomictic and triploid, this species exhibits high genetic diversity with numerous phenotypes due to occasional sexual reproduction [8,9,14,15]. A greater diversity of phenotypes is present within its natural range in North America, while in Europe, it is somewhat less diverse, indicating the importance of apomixis during invasion [34].
During field research, populations of E. annuus species were recorded in a variety of habitat types with pronounced human influence. Lambdon et al. [35] discussed that the species shows the ability to naturalize among a wide range of niches, while its ideal niches are related to human activity. In open and sunny habitats, such as abandoned fields and meadows, the species often creates monocultures, but it is less common in marginal and forest habitats and higher altitudes [18]. Generally, the consequences of invasive species are more significant with increasing cover [36].
Roads are ideal for the spread and establishment of invasive populations [16], so it can be assumed that this is the path of invasion through Medvednica Mt. Stress gradients often increase with altitude and reduce species richness and abundance [37]. Possible reasons for the lack of populations at higher altitudes are less intensive land use due to poorer nutrient availability and a harsher climate, as well as fewer reproductive individuals and high winter germ mortality [8,16]. However, according to the research of Tritikova et al. [8], high altitudes do not limit plant growth or seed production. The reason for fewer populations and individuals within populations of E. annuus on Medvednica Mt. is most likely dense forest vegetation.
The taxonomic position, nomenclature, and determination of polymorphic taxon E. annuus has long been a challenge for scientists [38], which is supported by our research. The affiliation of E. annuus to subspecies bearing the epithets “annuus”, “septentrionalis”, and “strigosus”, according to Halliday [15], is determined based on the hairiness of the stem, the serration of the leaves, and the length and colour of the inflorescence. According to these criteria, all populations included in this study can, conditionally, be defined as Erigeron annuus ssp. septentrionalis. The determination of the subspecies level is hampered by unclear and insufficiently precise entries of the determination keys, as well as previously incorrectly determined individuals stored in herbariums. The first known individuals of this species to be introduced into Europe have so far been classified as E. annuus ssp. septentrionalis, but according to Sennikov and Kurtto [38], this subspecies should have been called E. annuus ssp. annuus. The same authors claim that a subspecies previously known as E. annuus ssp. annuus with purple petals and deeply incised leaves should be called E. annuus ssp. lilacinus Sennikov and Kurtto, subsp. Nov. For the subspecies E. annuus ssp. Strigosus, such revisions have not yet been proposed.
The results of the analysis of the CSR strategies indicate a pronounced competitiveness and ruderality of E. annuus, like many other invasive species [35,39]. The competitive strategy indicates the ability for rapid growth in favourable conditions and gains importance during the occupation of more isolated, colder, wetter, and less anthropogenic habitats, while for the occupation of more open and arid habitats, ruderality and adaptation to disturbances are important [1,28]. Populations (T4 and T18) with C/CR strategies grew in semi-open habitats of low altitudes. Their C component was more pronounced due to their more conservative leaf economy, possibly caused by growth in partial shade. In other populations with a CR strategy, ruderality is somewhat more pronounced because of the more wasteful leaf economy [29], although they were spread among habitats of varying openness. After the completion of the field research, populations of this species in bloom were observed in Zagreb for significantly longer than four months, June–September, which are often mentioned as blooming months in the literature. The last flowering populations were observed in December, which would extend the flowering period of this species to seven months (June–December). Adding an extended flowering period to the analysis of the CSR strategies changes the populations T4 and T18 from the assigned strategy C/CR to CR. The prolonged flowering period strengthens the ruderal component of the invasive species. However, the extended flowering period did not affect the strategies in populations with previously designated CR strategies. The latter was done solely for the discussion, while the determined CSR strategies presented in Table 3 are based on published data [7,11,17].
Stem height strongly indicates the assignment of a plant species to the C or S strategy [28], so the obtained strategies indicate that E. annuus has relatively tall stems, which the measurements confirm. Stems reached heights of 60–166 cm, which is similar to previous reports from the literature. Croatian flora [7] for this species states that the stem height ranges between 30–150 cm, Flora Europaea [15] between 80–150 cm, and Flora of North America [40] between 10–150 cm, while its height in Macedonia is between 30–150 cm [41].
The T5 population stood out as the one with the tallest stems and largest leaves, which could be partly explained by the environmental conditions to which it was exposed. Its habitat was open enough to allow light to reach individuals most days, and partially enclosed by a bush, which may have protected it from mowing. Presumably, the soil in which it grew was rich in nutrients, given that the site was located along a road [32].
Adaptations to the local conditions are necessary for species that spread to habitats of limited resources and/or shorter vegetation seasons, such as habitats of higher altitudes [8]. Tritikova [9] claims that plants can, to some extent, adapt to higher altitudes, that is, higher rates of UV radiation, using morphological and physiological plasticity. By calculating the specific leaf area (SLA) at different altitudes, they recorded values 19% lower on average at 1000 m above sea level compared to the values at the altitude of 400 m. In contrast, the SLA and stem height measured in this study were about 14% and 12% higher in populations growing at altitudes above 300 m compared to those growing at lower altitudes. The lowest stems were recorded in the population from Medvedgrad (T15) sampled in September. Due to the presence of a rosette, it is assumed that the stems of individuals of this population grew late and that at the time of sampling, although they were in bloom, they had not yet reached their full height. By overwintering in the form of a rosette capable of photosynthesis, individuals may store energy reserves that provide a competitive advantage over plants that germinate in the spring [9].
Trait differences in E. annuus among sampled sites were significant, with the specific leaf area and plant height being the most diverse. The observed high morphological variability of daisy fleabane points to its adaptability to various habitat conditions. Morphological plasticity might explain the wide distribution of E. annuus in different habitats and may underly the fact that it is among the most widespread IAS in Croatia. Despite its high morphological variability, daisy fleabane showed a consistent CSR strategy, which enables the successful expression of its invasive potential, and emphasizes the need to further investigate CSR strategies to determine the success of invasive plants.

Supplementary Materials

The following are available online at https://www.mdpi.com/article/10.3390/d14010045/s1, Table S1: Environmental variables measured at 18 sampled sites: altitude, eastness, northness, slope, mean summer temperature, mean summer precipitation, mean spring precipitation, mean spring temperature, total annual precipitation, mean annual temperature and minimum annual temperature, Table S2: Mean values and standard errors of measured life traits of E. annuus by sampling sites (SLA—specific leaf area, LDMC—leaf dry matter content). N for all sample sites were 25 (5 leaves per 5 individuals) except for T14, with 3 individuals (15 leaves), and T15, with 4 individuals (20 leaves)., Table S3: Measured and calculated values of eight life traits of E. annuus from 18 sampled sites throughout Zagreb and Medvednica Mt., Table S4: Tukey post-hoc test for comparison of stem height of E. annuus sampled at 18 localities (statistically significant values for p < 0.05 are printed in red), Table S5: Tukey post-hoc test for comparison of fresh leaf mass of E. annuus sampled at 18 localities (statistically significant values for p < 0.05 are printed in red), Table S6: Tukey post-hoc test for comparison of dry leaf mass of E. annuus sampled at 18 localities (statistically significant values for p < 0.05 are printed in red), Table S7: Tukey post-hoc test for comparison of leaf area of E. annuus sampled at 18 localities (statistically significant values for p < 0.05 are printed in red), Table S8: Tukey post-hoc test for comparison of leaf length of E. annuus sampled at 18 localities (statistically significant values for p < 0.05 are printed in red), Table S9: Tukey post-hoc test for comparison of leaf width of E. annuus sampled at 18 localities (statistically significant values for p < 0.05 are printed in red), Table S10: Tukey post-hoc test for comparison of specific leaf area (SLA) of E. annuus sampled at 18 localities (statistically significant values for p < 0.05 are printed in red), Table S11: Tukey post-hoc test for comparison of leaf dry matter content (LDMC) of E. annuus sampled at 18 localities (statistically significant values for p < 0.05 are printed in red).

Author Contributions

Conceptualization, S.D.J.; methodology, S.D.J., validation, S.D.J. and D.L.; formal analysis, D.L.; investigation, D.L.; resources, S.D.J.; data curation, S.D.J.; writing—original draft preparation, D.L.; writing—review and editing, S.D.J.; visualization, D.L. and S.D.J.; supervision, S.D.J.; project administration, S.D.J.; funding acquisition, S.D.J. All authors have read and agreed to the published version of the manuscript.

Funding

This research was funded by the University of Zagreb, Croatia, grant number 20285110—Distribution and ecological profiles of invasive plants.

Institutional Review Board Statement

Not applicable.

Data Availability Statement

All data are provided in the Supplementary Materials of this manuscript.

Acknowledgments

Four reviewers helped us with their comments and suggestions to clarify the text and improve the complete paper. Luke Flory, from the University of Florida, edited the revised version of the manuscript, and provided further invaluable comments that helped us to significantly improve the whole paper.

Conflicts of Interest

The authors declare no conflict of interest. The funders had no role in the design of the study; in the collection, analyses, or interpretation of data; in the writing of the manuscript, or in the decision to publish the results.

References

  1. Thompson, K.; Hodgson, J.G.; Rich, T.C.G. Native and alien invasive plants: More of the same? Ecography 1995, 18, 390–402. [Google Scholar] [CrossRef]
  2. Kühn, I.; Klotz, S. Urbanization and homogenization—Comparing the floras of urban and rural areas in Germany. Biol. Conserv. 2006, 127, 292–300. [Google Scholar] [CrossRef]
  3. Chytrý, M.; Pyšek, P.; Wild, J.; Pino, J.; Maskell, L.C.; Vilà, M. European map of alien plant invasions based on the quantitative assessment across habitats. Divers. Distrib. 2008, 15, 98–107. [Google Scholar] [CrossRef]
  4. Nikolić, T.; Mitić, B.; Milašinović, B.; Jelaska, S.D. Invasive vascular plants in Croatia: Distirbution pattern, range size and ecology. In Book of Abstracts of the 11th Croatian Biological Congress, Proceedings of 11th Croatian Biological Congress with International Participation, Šibenik, Croatia, 16–21 September 2012; Jelaska, S.D., Klobučar, G.I.V., Šerić Jelaska, L., Leljak Levanić, D., Lukša, Ž., Eds.; Croatian Biological Society: Zagreb, Croatia, 2012. [Google Scholar]
  5. IUCN. Red List Categories and Criteria. Version 14. Available online: http://www.iucnredlist.org/documents/RedListGuidelines.pdf (accessed on 21 July 2021).
  6. Hejda, M.; Pyšek, P.; Jarošík, V. Impact of invasive plants on the species richness, diversity and composition of invaded communities. J. Ecol. 2009, 97, 393–403. [Google Scholar] [CrossRef]
  7. Nikolić, T.; Mitić, B.; Boršić, I. Flora Hrvatske: Invazivne Biljke, 1st ed.; Alfa d.o.o.: Zagreb, Croatia, 2014; pp. 1–296. [Google Scholar]
  8. Trtikova, M.; Güsewell, S.; Baltisberger, M.; Edwards, P.J. Distribution, growth performance and genetic variation of Erigeron annuus in the Swiss Alps. Biol. Invasions 2010, 13, 413–422. [Google Scholar] [CrossRef]
  9. Trtikova, M. Effects of competition and mowing on growth and reproduction of the invasive plant Erigeron annuus at two contrasting altitudes. Bot. Helvetica 2009, 119, 1–6. [Google Scholar] [CrossRef]
  10. Vuković, N.; Pavičević, M.; Jelaska, S.D. Allelopatic effects of five invasive species on germination and seedling growth of Sinapis alba L. and Triticum aestivum L. In Book of Abstracts of the 11th Croatian Biological Congress, Proceedings of 11th Croatian Biological Congress with International Participation, Šibenik, Croatia, 16–21 September 2012; Jelaska, S.D., Klobučar, G.I.V., Šerić Jelaska, L., Leljak Levanić, D., Lukša, Ž., Eds.; Croatian Biological Society: Zagreb, Croatia, 2012. [Google Scholar]
  11. Flora Croatica Database Allochthonous Plants. Available online: https://hirc.botanic.hr/fcd/InvazivneVrste/ShowResults.aspx?hash=636268493 (accessed on 21 July 2021).
  12. Veenvliet, J.K.; Veenvliet, J.P.; de Groot, M.; Kutnar, L. A Field Guide to Invasive Alien Species in European Forests, 1st ed.; Institute Symbiosis, so. e. and The Silva Slovenica Publishing Centre, Slovenian Forestry Institute: Ljubljana, Slovenia, 2019; pp. 128–129. [Google Scholar]
  13. Stratton, D.A. Life-cycle components of selection in Erigeron annuus: I. Phenotypic selection. Evolution 1992, 46, 92–106. [Google Scholar] [CrossRef]
  14. Trtikova, M.; Edwards, P.J.; Güsewell, S. No adaptation to altitude in the invasive plantErigeron annuusin the Swiss Alps. Ecography 2010, 33, 556–564. [Google Scholar] [CrossRef]
  15. Halliday, G.; Erigeron, L. Flora Europaea 4, 7th ed.; Tutin, T.G., Heywood, V.H., Burges, N.A., Moore, D.M., Valentine, D.H., Walters, S.M., Webb, D.A., Chater, A.O., DeFilipps, R.A., Richardson, I.B.K., Eds.; Cambridge University Press: New York, NY, USA, 1976; Volume 4, pp. 116–120. [Google Scholar]
  16. Becker, T.; Dietz, H.; Billeter, R.; Buschmann, H.; Edwards, P.J. Altitudinal distribution of alien plant species in the Swiss Alps. Perspect. Plant Ecol. Evol. Syst. 2005, 7, 173–183. [Google Scholar] [CrossRef]
  17. Klotz, S.; Kühn, I.; Durka, W. BIOLFLOR- Eine Datenbank zu Biologisch-Ökologischen Merkmalen der Gefäßpflanzen in Deutschland; Schriftenreihe für Vegetationskunde: Bonn, Germany, 2002; pp. 1–5. [Google Scholar]
  18. Vuković, N. Ecogeography of the Invasive Flora of Croatia. Ph.D. Thesis, University of Zagreb, Faculty of Science, Zagreb, Croatia, 2015. [Google Scholar]
  19. Bradshaw, A. Evolutionary Significance of Phenotypic Plasticity in Plants. In Advances in Genetics; Caspari, E.W., Thoday, J.M., Eds.; Academic Press: San Diego, CA, USA, 1965; Volume 13, pp. 115–155. [Google Scholar] [CrossRef]
  20. Schöb, C.; Armas, C.; Guler, M.; Prieto, I.; Pugnaire, F.I. Variability in functional traits mediates plant interactions along stress gradients. J. Ecol. 2013, 101, 753–762. [Google Scholar] [CrossRef]
  21. Niinemets, Ü.; Valladares, F.; Ceulemans, R. Leaf-level phenotypic variability and plasticity of invasive Rhododendron ponticum and non-invasive Ilex aquifolium co-occurring at two contrasting European sites. Plant Cell Environ. 2003, 26, 941–956. [Google Scholar] [CrossRef] [Green Version]
  22. Pérez-Harguindeguy, N.; Díaz, S.; Garnier, E.; Lavorel, S.; Poorter, H.; Jaureguiberry, P.; Bret-Harte, M.S.; Cornwell, W.K.; Craine, J.M.; Gurvich, D.E.; et al. New handbook for standardised measurement of plant functional traits worldwide. Aust. J. Bot. 2013, 61, 167–234. [Google Scholar] [CrossRef]
  23. Grime, J.P. Evidence for the Existence of Three Primary Strategies in Plants and Its Relevance to Ecological and Evolutionary Theory. Am. Nat. 1977, 111, 1169–1194. [Google Scholar] [CrossRef]
  24. Hodgson, J.G.; Wilson, P.J.; Hunt, R.; Grime, J.P.; Thompson, K. Allocating C-S-R Plant Functional Types: A Soft Approach to a Hard Problem. Oikos 1999, 85, 282. [Google Scholar] [CrossRef]
  25. Grime, J.P. Plant Strategies and Vegetation Processes; John Wiley & Sons, Ltd.: Hoboken, NJ, USA, 1979; pp. 1–222. [Google Scholar]
  26. Grime, J.P. Manipulation of plant species and communities. In Ecology and Design in Landscape, 1st ed.; Bradshaw, A.D., Goode, D.A., Thorpe, E., Eds.; Backwell Scientific Publications: Oxford, UK, 1986; pp. 175–194. [Google Scholar]
  27. Grime, J.P.; Thompson, K.; Hunt, R.; Hodgson, J.G.; Cornelissen, J.H.C.; Rorison, I.H.; Hendry, G.A.F.; Ashenden, T.W.; Askew, A.P.; Band, S.R.; et al. Integrated Screening Validates Primary Axes of Specialisation in Plants. Oikos 1997, 79, 259. [Google Scholar] [CrossRef]
  28. Westoby, M. A leaf-height-seed (LHS) plant ecology strategy scheme. Plant Soil 1998, 199, 213–227. [Google Scholar] [CrossRef]
  29. Pierce, S.; Brusa, G.; Vagge, I.; Cerabolini, B.E.L. Allocating CSR plant functional types: The use of leaf economics and size traits to classify woody and herbaceous vascular plants. Funct. Ecol. 2013, 27, 1002–1010. [Google Scholar] [CrossRef] [Green Version]
  30. Zhao, Y.-T.; Ali, A.; Yan, E.-R. The plant economics spectrum is structured by leaf habits and growth forms across subtropical species. Tree Physiol. 2016, 37, 173–185. [Google Scholar] [CrossRef] [PubMed] [Green Version]
  31. Vuković, N.; Miletić, M.; Milović, M.; Jelaska, S.D. Grime’s CSR strategies of the invasive plants in Croatia. Period. Biol. 2014, 116, 323–329. [Google Scholar]
  32. Hunt, R.; Hodgson, J.; Thompson, K.; Bungener, P.; Dunnett, N.; Askew, A. A new practical tool for deriving a functional signature for herbaceous vegetation. Appl. Veg. Sci. 2004, 7, 163–170. [Google Scholar] [CrossRef]
  33. Knevel, I.C.; Bekker, R.M.; Kunzmann, D.; Stadler, M.; Thompson, K. The LEDA Traitbase Collecting and Measuring Standards of Life—History Traits of the Northern European Flora, 1st ed.; University of Groningen: Groningen, The Netherlands, 2005; pp. 49–60. [Google Scholar]
  34. Frey, D. Patterns of Variation within the Erigeron annuus Complex in the United States and Europe. Ph.D. Thesis, Swiss Federal Institute of Technology, Zürich, Switzerland, 2003. [Google Scholar]
  35. Lambdon, P.W.; Lloret, F.; Hulme, P.E. Do alien plants on Mediterranean islands tend to invade different niches from native species? Biol. Invasions 2007, 10, 703–716. [Google Scholar] [CrossRef]
  36. Meiners, S.J.; Pickett, S.T.A.; Cadenasso, M.L. Effects of plant invasions on the species richness of abandoned agricultural land. Ecography 2001, 24, 633–644. [Google Scholar] [CrossRef]
  37. Therriault, T.W.; Kolasa, J. Explicit links among physical stress, habitat heterogeneity and biodiversity. Oikos 2000, 89, 387–391. [Google Scholar] [CrossRef] [Green Version]
  38. Sennikov, A.N.; Kurtto, A. The taxonomy and invasion status assessment of Erigeron annuus s.l. (Asteraceae) in East Fennoscandia. Memo. Soc. Fauna Flora Fenn. 2019, 95, 40–59. [Google Scholar]
  39. Radford, I.J. Fluctuating resources, disturbance and plant strategies: Diverse mechanisms underlying plant invasions. J. Arid. Land 2013, 5, 284–297. [Google Scholar] [CrossRef]
  40. Flora of North America. Available online: http://www.efloras.org/florataxon.aspx?flora_id=1&taxon_id=200023888 (accessed on 21 July 2021).
  41. Pacanoski, Z. Current situation with invasive Erigeron annuus (l.) Pers. (daisy fleabane) in the Republic of Macedonia. EPPO Bull. 2017, 47, 118–124. [Google Scholar] [CrossRef]
Figure 1. Sampling locations of E. annuus populations in the area of Zagreb and Medvednica Mt. Croatia.
Diversity 14 00045 g001
Figure 2. Plots of life trait mean values for populations of E. annuus distributed throughout 18 localities (T1-T18) showing standard error (SE) and standard deviation (SD). Presented life traits are (a) stem height, (b) fresh leaf mass, (c) dry leaf mass, (d) leaf area, (e) leaf length, (f) leaf width, (g) specific leaf area (SLA), (h) leaf dry matter content (LDMC).
Diversity 14 00045 g002
Figure 3. Ordination biplot of the first two axes of PCA analysis (1st axis horizontal, 2nd axis vertical). Distance measure is the square of the Jaccard similarity index. The arrows indicate measured life traits (SLA-specific leaf area, LDMC-leaf dry matter content), and the circles indicate sampled population (labels correspond to those in Table 1).
Diversity 14 00045 g003
Table 1. Basic information on dates (during 2019) and sampling locations (with WGS84 coordinates) of E. annuus populations, along with short habitat descriptions and altitudes.
Site No.DateLocationHabitatAltitude (MASL)
T15 June15.9702° E, 45.8017° NOpen, ruderal, by the road. Several dozens of individuals on 30-m long strip of soil and gravel.118
T26 June15.9714° E, 45.8043° NSemi-open, SE part of the botanical garden, near fence adjacent to the railway. Approximately 10–15 individuals.118
T37 June15.9662° E, 45.8088° NShady, ruderal, adjacent to school playground and garbage containers. 5–10 individuals.120
T411 June15.9764° E, 45.7716° NPartial shade, adjacent to urban gardens with vegetables and surrounded by trees. 20–30 individuals.116
T513 June15.9797° E, 45.7936° NPartly open/closed, ruderal, next to bushes.111
T617 June16.0354° E, 45.7657° NOpen, within grasslands on, at a time of sampling, dry flood channel of a levee. Present with locally dense stands with numerous individuals.107
T718 June15.9637° E, 45.7788° NOpen, partly ruderal partly in secondary succession towards shrubs and trees. Few dozens of individuals scattered across an area of 200–300 m2.116
T819 June15. 9829° E, 45.8644° NSemi-open along the road and stream, ruderal. 20–30 individuals on an area of 100 m2.264
T919 June16.0853° E, 45.9641° NOpen on a slope, surrounded by grasslands and other agricultural areas (on the other side of the road is forest). Very dense stand on 1000 m2.351
T1019 June15.9733° E, 45.9320° NSemi-open and moist, by the road through forest. 10–20 individuals.569
T1119 June15.9544° E, 45.8994° NSemi-open on a slope, by the road through forest. 5–10 individuals.908
T1219 June15.9420° E, 45.8843° NSemi-open on a slope, by the road through forest. 10–20 individuals617
T1319 June15.9445° E, 45.8680° NOpen, by the road through forest. Several hundreds of individuals in dense stand on area adjacent to connection of main road with dirty road.443
T144 September15.9427° E, 45.8700° NSemi-open on a slope by the road. Several individuals.496
T154 September15.9408° E, 45.8691° NSemi-open, overgrown, beneath the remnants of a medieval fortress. Several individuals.554
T164 September16.0072° E, 45.8325° NOpen, ruderal/grasslands, several dozen individuals scattered across an area of 200 m2.152
T1719 September16.0554° E, 45.8843° NSemi-shaded on a slope, by the road through the settlement. Abandoned grassland. Several dozens of individuals scattered across an area of 500 m2.107
T1820 September16.0469° E, 45.8007° NSemi-open, ruderal, adjacent to shopping mall. 10–20 individuals.211
Table 2. Descriptive statistics of eight life traits for E. annuus for 87 individuals and 435 leaves sampled from 18 sites (SLA—specific leaf area, LDMC—leaf dry matter content).
Life TraitMeanMedianMinimumMaximumLower QuartileUpper QuartileStandard Error
Stem height (mm)1107.8210906001660960127010.89
Fresh leaf mass (mg)211.08207385521292654.59
Dry leaf mass (mg)43.96411112029530.93
Leaf area (mm2)1137.831105.40231.542883.26717.501453.2524.04
Leaf length (mm)79.4879.7410.28129.2564.7391.660.89
Leaf width (mm)22.7922.2310.3047.6116.1928.150.36
SLA (mm2 mg−1)26.3525.5115.3946.2422.0230.660.29
LDMC (mg g−1)215.07209.30135.22440.00191.67228.812.04
Table 3. Determined CSR types for populations of E. annuus across 18 sites.
Site No.Stem Height
(mm)
Dry Matter Content
(%)
Dry Leaf Mass
(mg)
SLA
(mm2 mg−1)
CSR Type
T11230216221CR
T21280226125CR
T31080203633CR
T41050283819C/CR
T51660206931CR
T61000242720CR
T71270225022CR
T81190164237CR
T91390194328CR
T101360194630CR
T111390183433CR
T121470226227CR
T131420213525CR
T141520222434CR
T151070213426CR
T161070194525CR
T171070234421CR
T181180323021C/CR
Table 4. Results of ANOVA for eight life traits at 18 localities throughout Zagreb and Medvednica Mt., with five individuals and five leaves per individual of E. annuus. Statistically significant differences are in bold (p < 0.05).
EffectTest NameValueFDegree of ConnectionConnectivity Degree Errorp
InterceptWilks0.0000521,127,89674110.00
LocalityWilks0.006365261192689.780640.00
Table 5. Pearson correlation coefficients of E. annuus life traits with environmental variables: altitude, eastness, northness, slope, mean summer temperature, mean summer precipitation, mean spring precipitation, mean spring temperature, total annual precipitation, mean annual temperature, and minimum annual temperature. Bold values with asterisks indicate statistically significant correlations (p < 0.05).
Life TraitAltitudeEastnessNorthnessSlopeMean Temp. in SummerMean Prec. in SummerMean Temp. in SpringMean Prec. in SpringTotal PrecipitationMean Annual TemperatureMin. Annual Temperature
Stem height (mm)0.22740.21190.21200.2192−0.23340.26620.2595−0.23210.2671−0.23080.0754
Fresh leaf mass (mg)−0.04160.1005−0.1498−0.09080.01950.00070.01070.02060.00380.02210.3985
Dry leaf mass (mg)−0.21390.2108−0.2470−0.22010.2089−0.1670−0.13790.2073−0.14660.21170.4937 *
Leaf area (mm2)0.05110.1404−0.17570.0022−0.08000.10340.1109−0.07930.1079−0.07710.3482
Leaf length (mm)0.18910.1824−0.03490.0430−0.18890.22510.2622−0.19370.2476−0.18590.2793
Leaf width (mm)0.11620.1641−0.21320.1110−0.15030.16810.1642−0.14820.1666−0.14750.3022
SLA (mm2 mg)0.4741 *−0.06980.09480.4101−0.5228 *0.4932 *0.4608−0.5197 *0.4708 *−0.5220 *−0.1282
LDMC (mg g−1)−0.38550.1967−0.2053−0.32870.4278−0.3944−0.35140.4212−0.36140.4263−0.0160
Publisher’s Note: MDPI stays neutral with regard to jurisdictional claims in published maps and institutional affiliations.

