Article

Insects in the City: Does Remnant Native Habitat Influence Insect Order Distributions?

1
Bio-Inspired Digital Sensing-Lab, School of Media and Communication, RMIT University, Melbourne, VIC 3001, Australia
2
Faculty of Information Technology, Monash University, Melbourne, VIC 3800, Australia
3
Disturbance Ecology, Bayreuth Center of Ecology and Environmental Research (BayCEER), University of Bayreuth, 95440 Bayreuth, Germany
4
Global, Urban and Social Studies, RMIT University, Melbourne, VIC 3001, Australia
5
Centre for Integrative Ecology, School of Life and Environmental Sciences, Deakin University, Burwood, VIC 3125, Australia
6
Laboratory of Biogeography and Ecology, Department of Geography, University of the Aegean University Hill, 81100 Mytilene, Greece
7
Division of Food Production and Society, Norwegian Institute of Bioeconomy Research, P.O. Box 115, NO-1431 Ås, Norway
*
Author to whom correspondence should be addressed.
Diversity 2021, 13(4), 148; https://doi.org/10.3390/d13040148
Submission received: 1 March 2021 / Revised: 27 March 2021 / Accepted: 27 March 2021 / Published: 30 March 2021

Abstract

:
There is increasing interest in developing urban design principles that incorporate good ecological management. Research on understanding the distribution and role of beneficial pollinating insects, in particular, is changing our view of the ecological value of cities. With the rapid expansion of the built environment comes a need to understand how insects may be affected in extensive urban areas. We therefore investigated insect pollinator capture rates in a rapidly growing and densely urbanized city (Melbourne, Australia). We identified a remnant native habitat contained within the expansive urban boundary, and established study sites at two nearby populated urban areas. We employed standard pan trap sampling techniques to passively sample insect orders in the different environments. Our results show that, even though the types of taxonomic groups of insects captured are comparable between locations, important pollinators like bees and hoverflies were more frequently captured in the remnant native habitat. By contrast, beetles (Coleoptera) and butterflies/moths (Lepidoptera) were more frequently observed in the urban residential regions. Our results suggest that the maintenance of native habitat zones within cities is likely to be valuable for the conservation of bees and the ecosystem services they provide.

1. Introduction

Since the industrial revolution in the mid-19th century the global population has become increasingly urbanized, and the majority of people now live in urban areas [1]. Whilst there is strong evidence that the health and wellbeing of urban residents is intrinsically linked to green spaces [2], there is also an emerging appreciation that these spaces may provide important benefits for the conservation of insects [3,4]. There are thus increased calls for cities to heed their duty of care for urban flora and fauna [5] and to conserve species by incorporating ecological design principles into urban developments [6,7,8,9]. A recent review predicted that 40% of species will become extinct over the coming decades [10], with habitat fragmentation [11,12] caused by industrial agriculture and urbanization being a contributing factor. In general, habitat fragmentation is predicted to be an important threat to biodiversity because particular species may require habitats that are of sufficient size, and/or are also sufficiently connected, to enable long-term ecological survival [12]. An important concept in building an understanding of the potential threat of habitat fragmentation is having target species to help develop planning strategies [12], which is formally embedded in the ecology literature via IUCN taxonomic nomenclature [13] that proposes having specific biodiversity targets and identified key stresses, such as habitat fragmentation. Pollinating insects are interesting target species because of their value in directly contributing to the reproductive success of other species, i.e., flowering plants. In particular, hymenopteran species incorporating wild bees in general, and specifically the honeybee (which may be managed or wild), present as interesting targets [14]. The second most important pollinator in many environments is flower-visiting flies (Syrphidae), especially hoverflies [15,16]. Whilst the emergence of studies on insects within urban environments is still in its infancy, partially due to the difficulties in collecting data within cities, which is discussed below; the very nature of cities, with many roads and altered landscapes, serves as a topical natural experiment for contributing to our knowledge of habitat fragmentation. Research on insects is changing our view of the ecological value of cities [5,7,17]. Many insects can survive in small habitat patches if critical resources are available [18]. Consequently, several studies have considered the distribution of insects within an urban environment [19,20,21,22,23,24,25,26], and how different insect orders may respond to changes caused by urbanization [27,28,29,30]. A recent review of insect conservation in Australia’s urban environments also highlighted the need for understanding insect distributions in these areas. Few data currently exist [5], and there are many gaps in our understanding of urban pollination, a key ecosystem service that some insects provide [31].
Insect conservation in urban Australia is an important case study due to the country’s under-appreciated insect diversity [32]. The mainland Australian island continent has been surrounded by a significant sea barrier for over 34 million years [33,34], making it an interesting comparative location for insect pollination studies [35,36,37,38,39]. Australian insects are highly endemic, often relict populations. A majority of species remain poorly or completely undocumented [40]. The extant insect fauna is under increasing pressure from habitat loss due to urbanization [5], but there is only a relatively small body of work on urban pollination in general, let alone on Australia’s unidentified insect species specifically [18].
Australian cities are characterized by rapid urban expansion into relatively intact native vegetation. These intrusions do sometimes leave patches of remnant vegetation within urban built up areas (city type III in [41]), and so data from Australia can contribute to our growing understanding of urban pollination in the world’s cities [31]. As an example of Australia’s urban developments, it is instructive to consider the city of Melbourne, where local government plans to cater for population increases by establishing 17 new suburbs over the coming decades [42]. Currently the city of Greater Melbourne is highly urbanized with a population of ca. 5.2 million people [43]. Melbourne is regarded as one of the world’s most livable cities for a variety of reasons, including its well-distributed city and suburban parks [44]. Monash University, one of our study sites, is close to the geometric center of Greater Melbourne (Figure 1). Shortly after the university was established, the Jock Marshall (nature) Reserve was permanently set aside (1961) to maintain native habitat typical of the region.
We investigate the insect communities in two different habitats within Greater Melbourne: (a) an urban remnant habitat with native vegetation in the Jock Marshall Reserve and, (b) residential habitat with alien vegetation that could be considered to be more stressful for pollinating insects such as bees. We address the following questions: (i) “Are there insect pollinators within the highly urbanized non-native plant environments of Melbourne city?”, and (ii) “Does remnant native habitat have a different insect order distribution than the residential habitats?”. Our study includes insects for which there is good evidence that they may be pollinators. These include bees, wasps, and ants (Hymenoptera) (e.g., [46,47,48,49]); moths and butterflies (Lepidoptera) (e.g., [49,50] and references within); flies (Diptera) [15,51,52,53,54,55,56,57]; and beetles (Coleoptera) [58,59,60]. Our review also revealed that some crickets (Orthoptera) may be pollinators of some flowering plants [61], and so these insects were retained in our analyses. Although they are not insects, Araneae (spiders) were collected by our sampling method. A review of the literature revealed evidence that some spiders can also visit flowers to prey on insect pollinators [62,63] or to collect nectar [64]. Hence, we included data on spiders as part of an extended pollination network [65]. We initially employ this broad sampling technique because the topic has not previously been explored within Melbourne, and we then also consider known important bee and hoverfly pollinators in a more focused comparison to see if the general results are consistent for key pollinators.

2. Materials and Methods
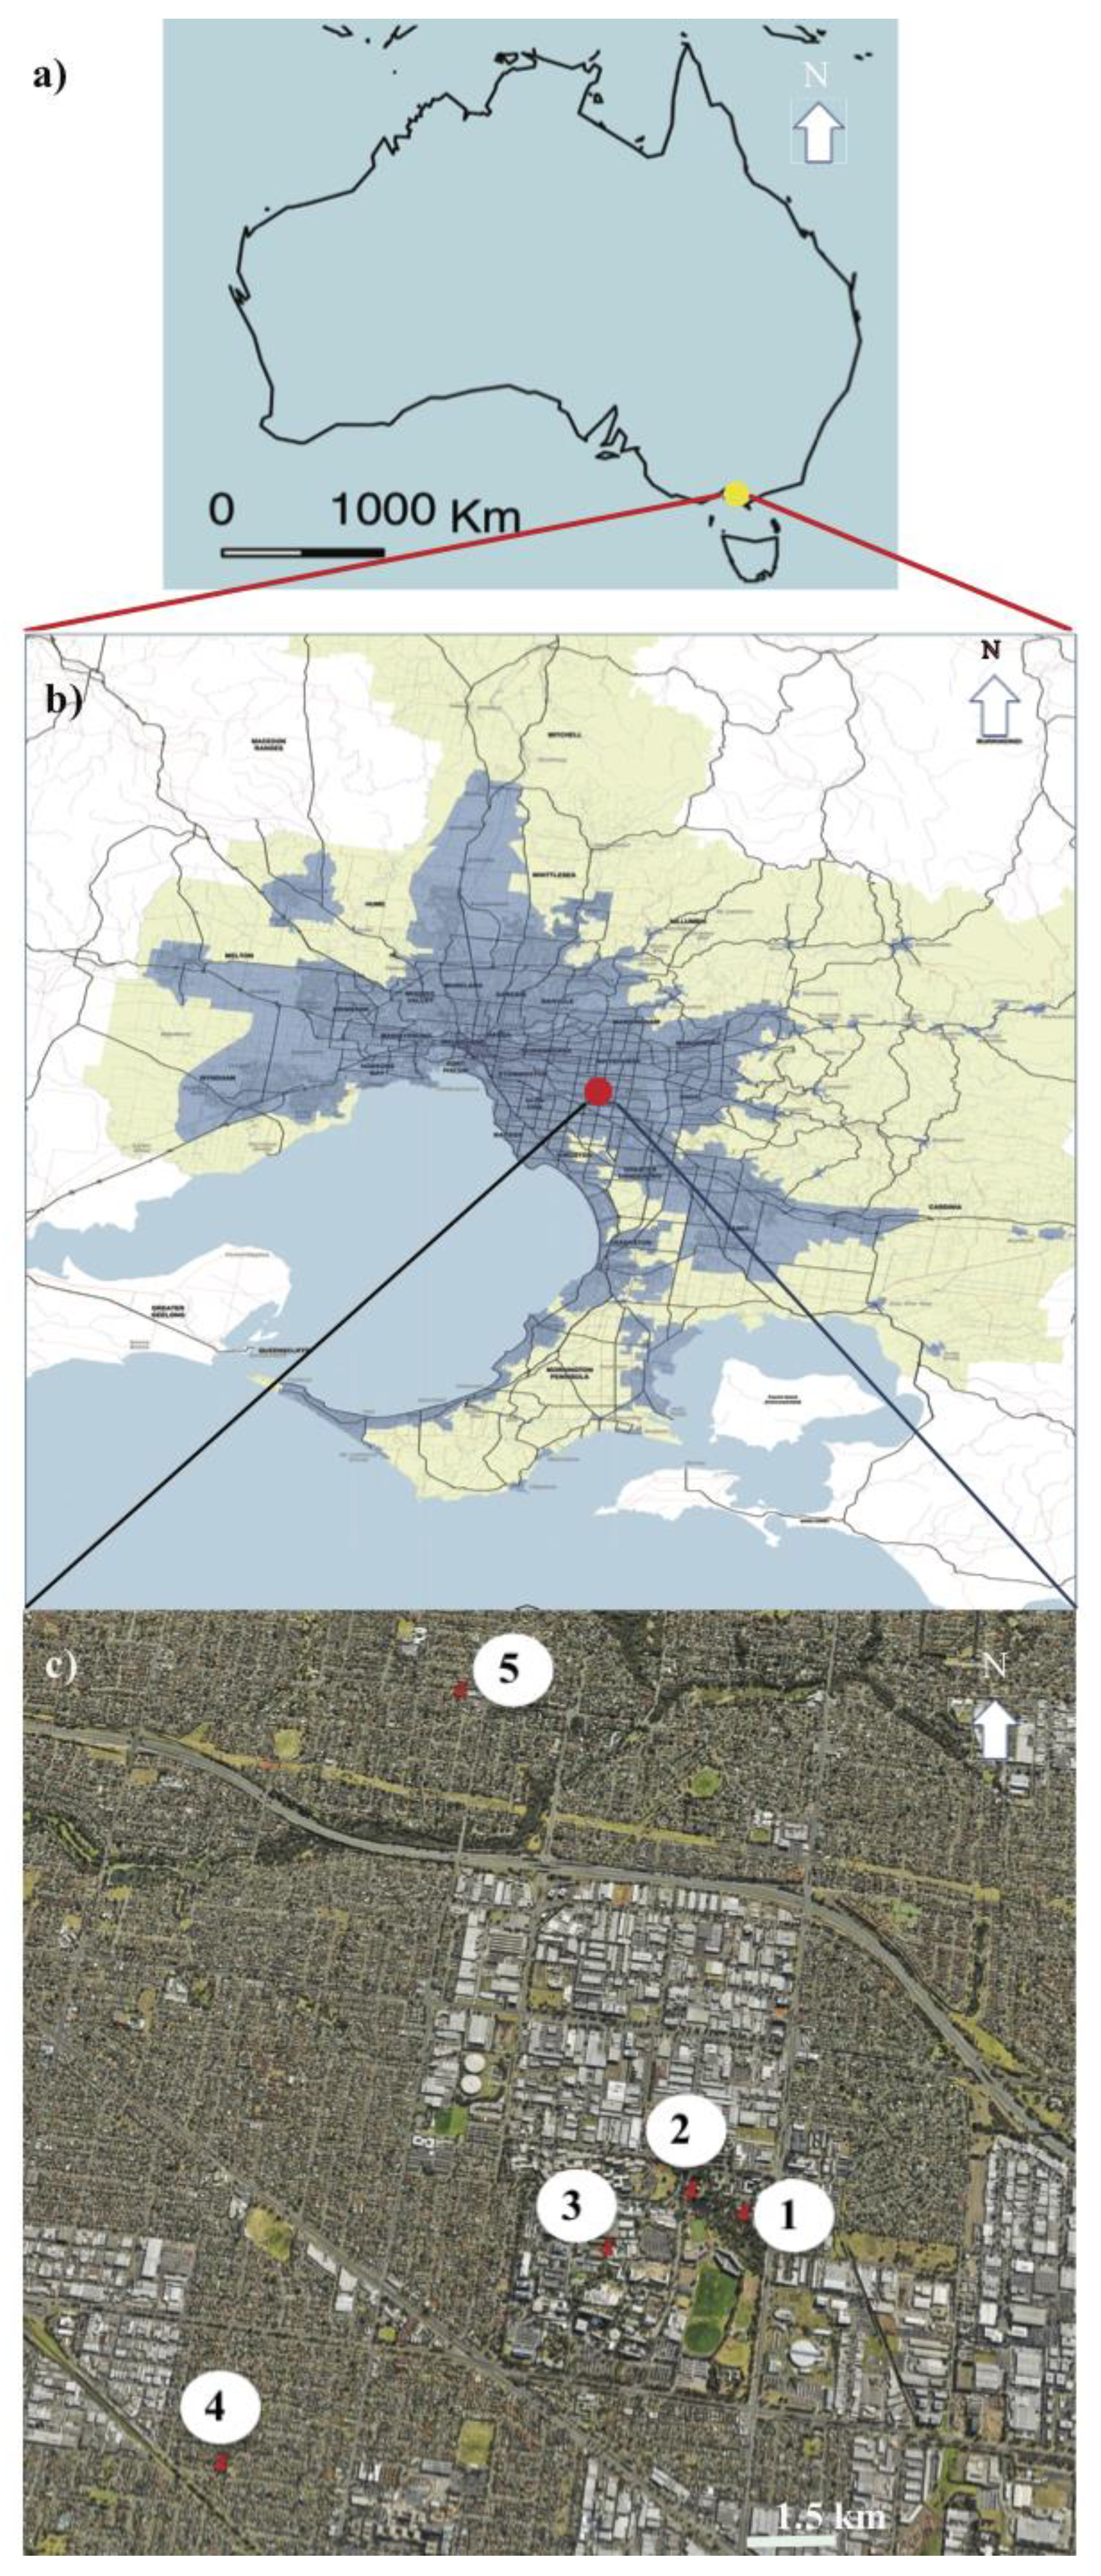
2.1. Study Area

The study was conducted at four urban sites in the Greater Melbourne region (in the state of Victoria, Australia). Sites were allocated within two different urban locations, classified based on their vegetation type (Figure 1, details in Table S1). Location 1 was the Jock Marshall Reserve (JMR) and a nearby indigenous plant garden. JMR contains natural remnant vegetation and undisturbed habitat within an area of three hectares, while the indigenous garden preserves native plants of high medicinal value to Indigenous Australians. Location 2 represents two typical residential urban areas with no natural habitat within a 1.5 km radius and a high proportion of introduced garden plants. We sampled insects during the Australian summer (January–May 2016, temperature 17–42 °C) over three different sessions. At each session we placed pan traps in the field for 48 h following the method used in [66]. We avoided windy and/or rainy days that were forecast in our sampling period. We supply raw data and taxonomic information in supplementary Tables S2 and S3.

2.2. Data Collection

We used colored pan trap arrays at each site to collect insects (details in [65,66]). Each array consisted of eight pan traps painted with different colors (blue, n = 2; white, n = 3; yellow, n = 2; or green, n = 1) in each of the study sites to sample pollinating insects that might visit flowers (details in [65]). Pans were painted with fluorescent or non-fluorescent blue, white, or yellow spray paints (Sparvar Leuchtfarbe, Spray-Color GmbH, Merzenich, Germany) following the same protocol as [65,66,67] to maximize capture of a wide variety of taxonomic insect groups [65]. Specifically, different insect orders perceive color in different ways. Since recent work shows that the sole use of either fluorescent or non-fluorescent pan traps may bias data [65], our combination minimizes this risk.

2.3. Insect Identification

It has been conservatively estimated that 75% of Australian arthropods have yet to be formally described or even discovered [40]. We nevertheless identify all collected insect specimens to either the order or genus level following the published literature [68,69,70,71]. All identifications were performed by a skilled field biologist (MS). We supply raw data and taxonomic information in supplementary Tables S2 and S3. However, we were unable to identify all taxa to genus level and have used order as the main group level in our analyses as suited to addressing the key question of this initial study concerning relative distributions. We document the number of insects captured at the study sites (each site falls within one of the main locations) in Figure 2.

2.4. Data Analyses

We used a generalized linear mixed model (GLMM) to test for differences in the proportion of insect orders captured per location. Generalized linear models were fitted using the routine ‘glm’ available as part of the base package of the R language for statistical programming v 4.02 [72]. We tested the significance of the model coefficients by employing type III sums of squares using the routine ANOVA available in the package ‘car’ [73]. We calculated the pairwise comparisons using the package ‘emmeans’ for R [74]. We initially considered insect order, location, and sampling time as fixed predictor variables. Sampling site was included as a random factor to account for repeated sampling. We calculated the proportions of insects captured for a given order relative to the total number of insects captured at each site. Thus, we assumed that the response variable followed a binomial distribution and used a logit function to link the binomial response variable with the predictors [75]. Insect order, urban location, and sampling time were categorical variables with six, two, and three levels, respectively.
The initial model included site as a random factor, but its estimated variance was close to zero. Variance estimates close to zero are common when there are not many levels within the random effect, in which case it is better to treat the variable as a fixed term within the model [76]. Site as a fixed term in the generalized linear model (GLM) was found to be non-significant (likelihood ratio χ2 < 1.00, p ≈ 0.999), and so it was not included as a predictor in the subsequent, reduced models. The effect of the remaining fixed terms, sampling time, location, and insect order, along with their respective two- and three-way interaction terms, were tested using a model simplification technique [77] assuming a quasi-binomial distribution to account for overdispersion [75,78]. Model selection stopped once we found a significant interaction term. Our final model describes the variation in the proportion of captured insects as a function of insect order, location, and a third term describing the interaction between these two variables.
We used a backward selection protocol to identify the model best describing the data, considering available predictors based on AIC scores [76] and the generalized coefficient of determination R2 [79]. The best model included the main effects of habitat location, insect order, and an interaction term between these two factors (R2 = 0.923, AIC = 451, AICnull = 2530). For each selection step, a model was fitted using the ‘glm’ routines available for the R language and environment for statistical analysis v 3.4.4 [45]. Significant effects were further analyzed using pairwise comparison on marginal means [80] with the package ‘emmeans’ [74].
The initial analysis was followed by a comparison of the number of Hymenopteran bees (honeybees and native bees) and Syrphids (hover flies) captured at the two locations. The comparison was made by means of a 2 × 2 contingency table using the number of insects captured as the dependent variable and insect group, i.e., bees or syrphid, and location as independent categorical predictors. The contingency table was analyzed using a GLM Poisson model to account for the discrete nature of the count data [75]. We initially fitted a full model including an interaction term between the two independent predictors. The intercept term was found to be non-significant (χ2 = 1.83, p = 0.177), so a reduced model excluding the interaction term was selected as the best model to explain the data.
Finally, we compared the number of introduced Apis mellifera and native bees captured at the two locations by using a similar 2 × 2 contingency table, with the number of insects captured as the dependent variable and bee type, either A. mellifera or native bee, and location as categorical predictors. The interaction term in the full model was found to be non-significant (χ2 = 2.72, p = 0.099, AIC = 27.45), so a reduced model excluding this term was selected as the best model to explain the data.

3. Results

3.1. Data Overview

We collected animals in the pan traps that were identifiable within the six orders of Hymenoptera, Diptera, Lepidoptera, Coleoptera, Orthoptera, or Araneae. There were 18 insects in the native habitat that were not identifiable even at order level, and 7 insects in the urban environment that could not be identified at order level and could not be included in the analyses (see supplementary Tables S2 and S3 for details).

3.2. Model Parameters

The selected model suggested a significant interaction between the study location and insect order (G = 144, p-value < 0.001, type III sums of squares). However, the model was over-dispersed (∅ = 3.35). Consequently, we re-tested the significance of the interaction term using a quasi-binomial distribution [78] to account for the over-dispersion. The interaction term remained significant after scaling the residual mean (F = 8.41, p-value = < 0.001). For this reason, we followed up the omnibus analysis using pairwise comparisons of the proportion of captures per location for each order.

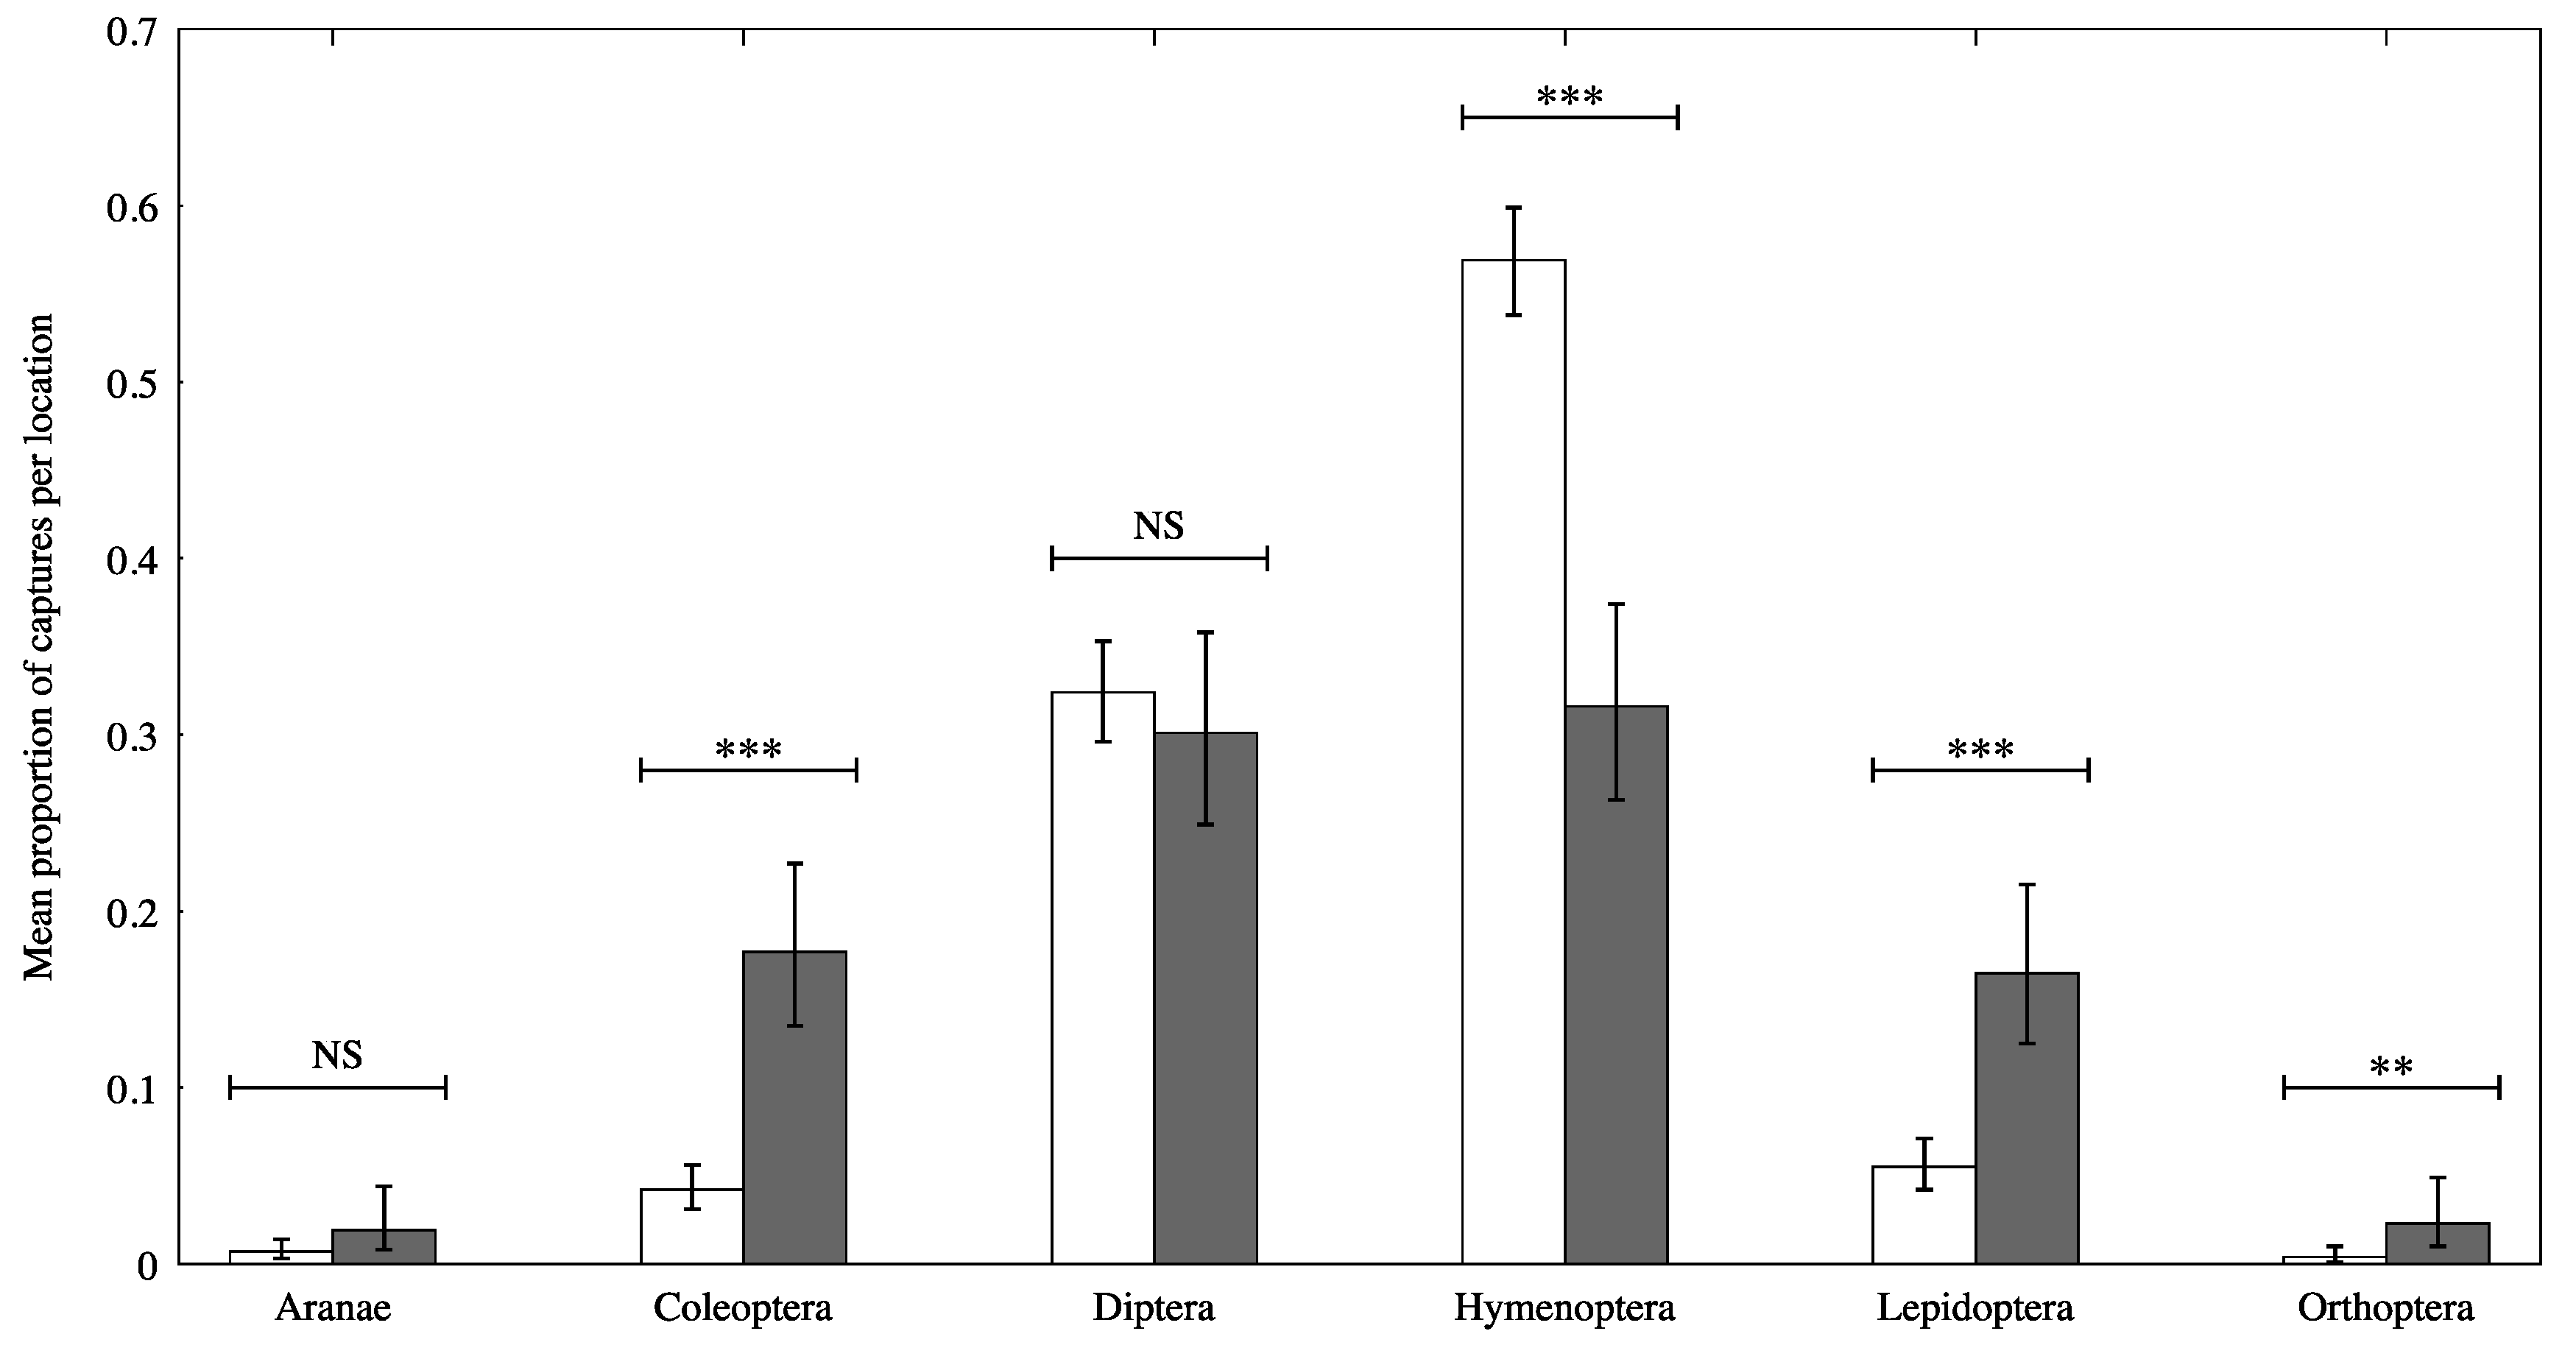
3.3. Pairwise Post Hoc Comparisons

Pairwise location comparison revealed significant differences in the proportion of captures for four of the six respective orders between locations (Figure 3). In particular, we observed significant differences in the proportion of captures of Coleoptera, Hymenoptera, Diptera, Lepidoptera, and Orthoptera (p < 0.006) (Table 1). We found that a higher proportion of Hymenoptera insect orders was captured in the location containing native vegetation (Location 1) than in the residential location (Location 2), whilst the opposite effects were observed for Coleoptera, Lepidoptera, and Orthoptera (Figure 2 and Figure 3, supplementary Table S2 raw data). The proportion of Araneae (spiders) and Diptera seemed to be similar between the two locations, although the low number of captures of the former group suggests that this result should be treated with caution.

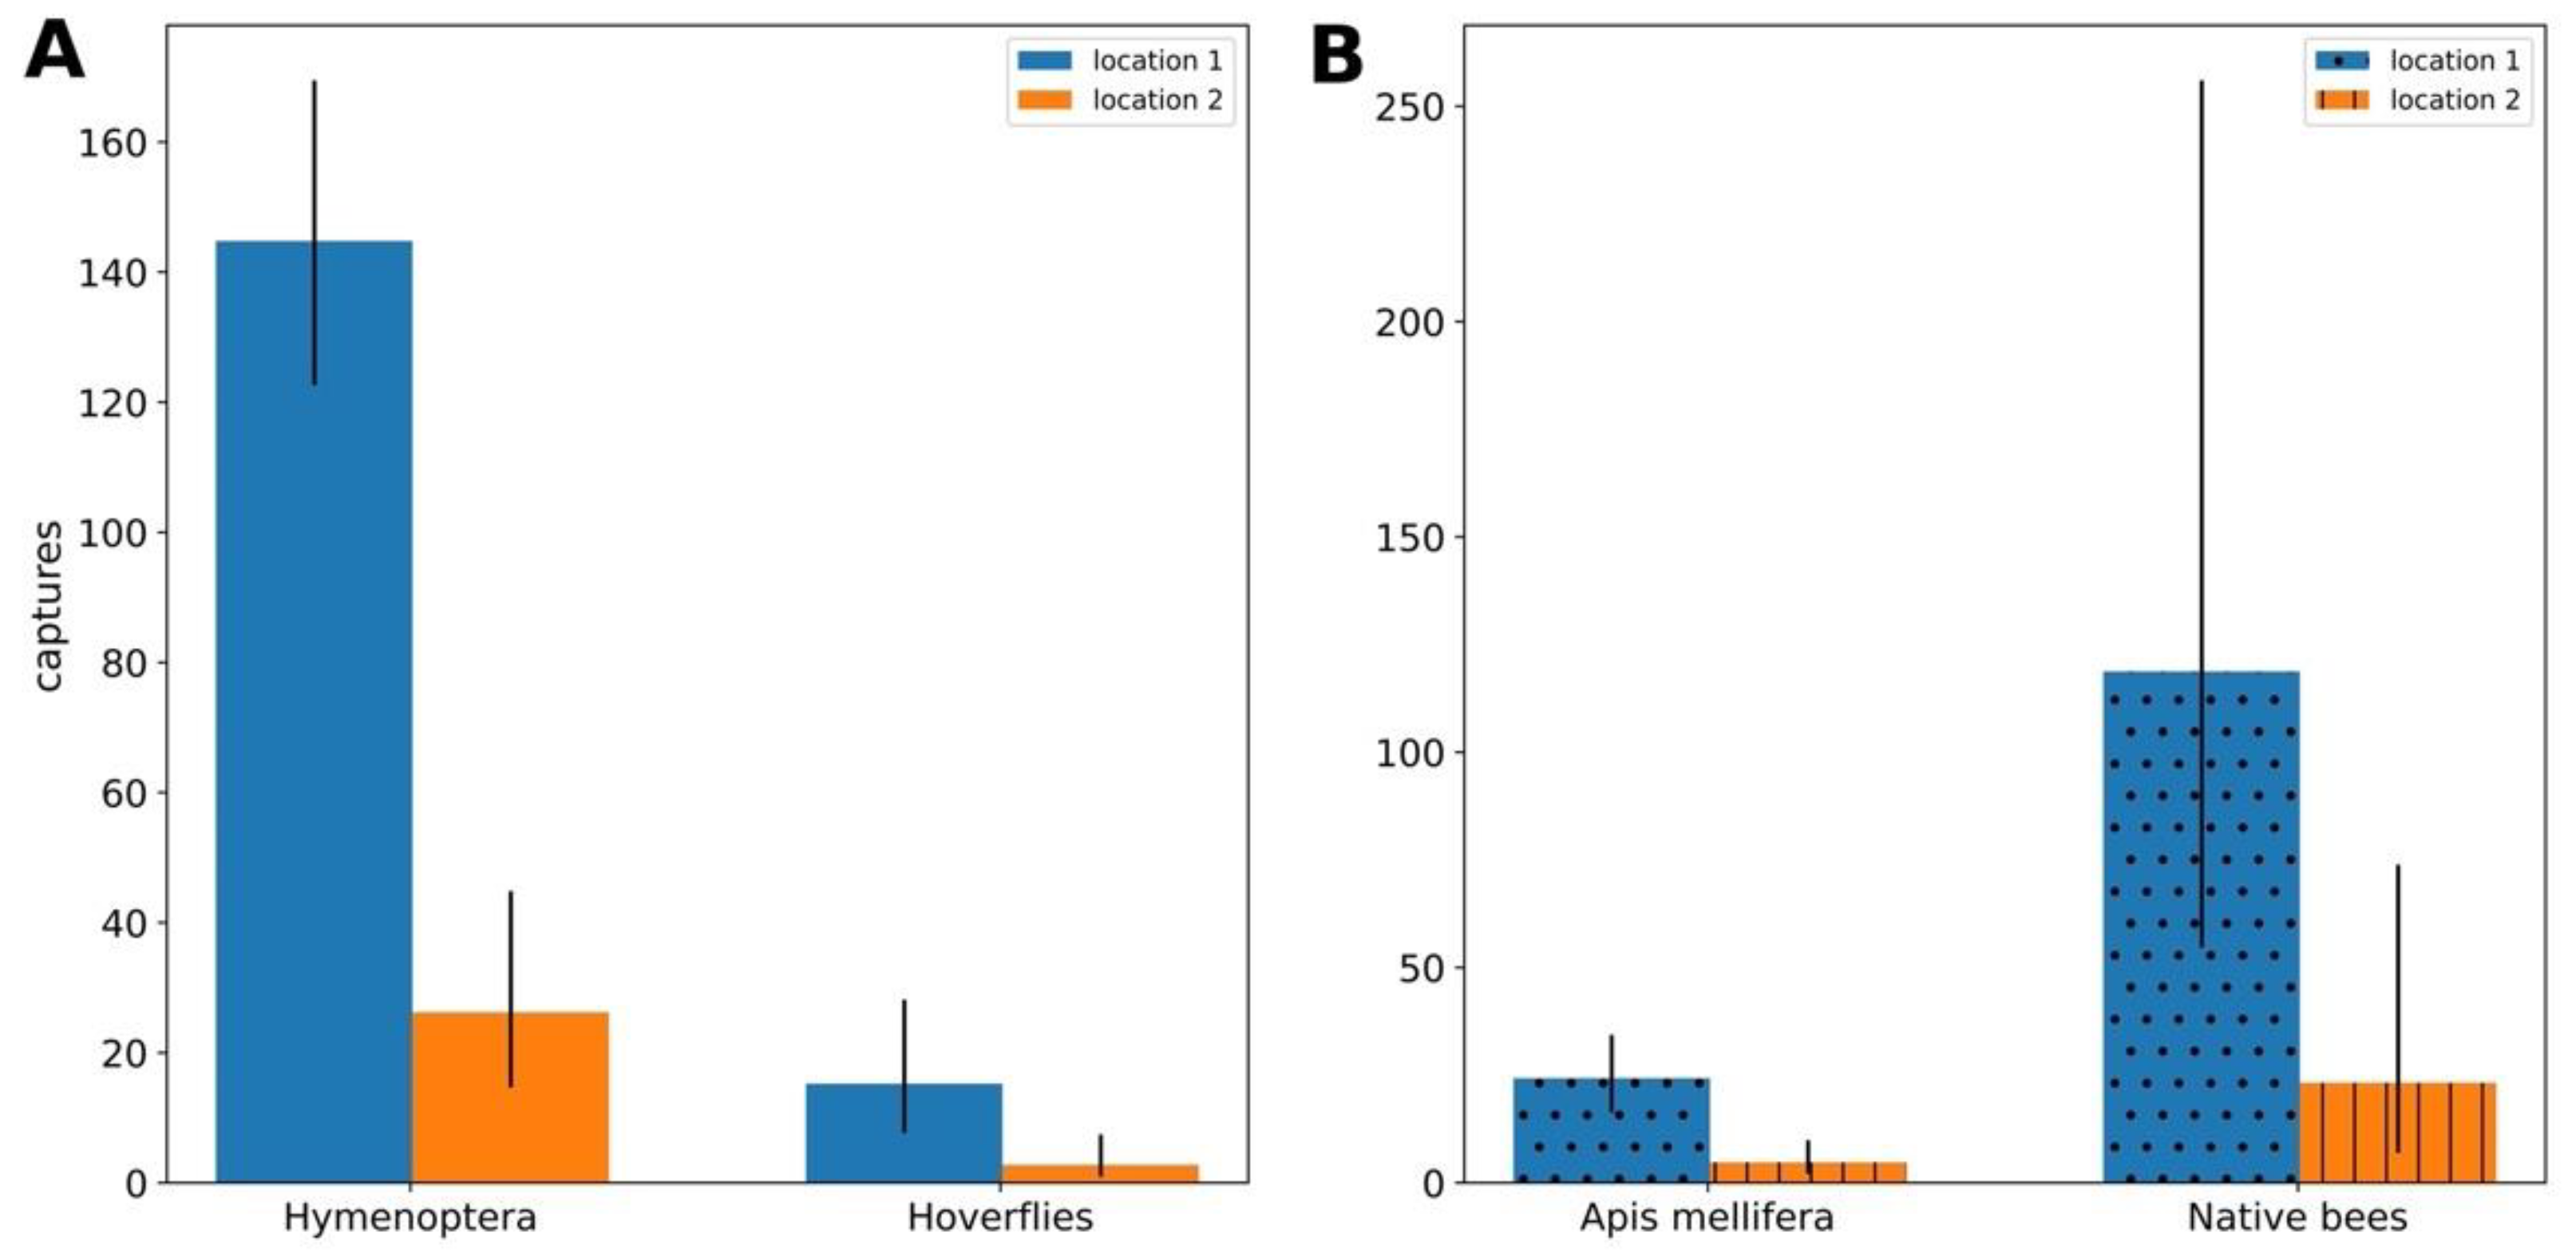
3.4. Hymenopteran Bee vs. Syrphidae Capture Comparison

The reduced model testing for an effect of either location or pollinator type, Hymenopteran bee or Syrphid, on the number of insects captured indicate that both predictors have a significant effect on the response variable (G ≥ 100, p < 0.001, ∅ = 1.47). More specifically, significantly less insects were captured at the residential, urban location (Location 2) than at the location with remnant, native vegetation (Location 1) (z = −8.46, p < 0.001), and significantly less hoverflies than Hymenopteran bees were captured in our experiment (z = −9.08, p < 0.001) (Figure 4A).

3.5. Apis Mellifera vs. Native Bee Captures Comparison

The reduced model testing for difference in the number of captures of A. mellifera and native bees at the two locations revealed that both parameters were significant (G > 35, p < 0.001, ∅ = 2.29). More specifically, the model evidenced that significantly less bees were captured at the residential, urban location (z = −7.891, p < 0.001) than at the location with remnant vegetation, and that more native bees were captured than Apis (z = 7.79, p < 0.001) at both sites (Figure 4B).

4. Discussion

In the current study we initially sought to learn whether remnant native habitat within an urban environment influenced insect order distributions. We considered a remnant habitat with native vegetation (Location 1) and a disrupted residential habitat including alien vegetation (Location 2), which could be predicted to act as a more stressful environment. As noted above, another study site was excluded from the study, but raw data are reported online (Tables S3 and S4). At Locations 1 and 3, we captured a wide taxonomic array of insects, including Hymenoptera (native bees, native wasps, introduced honeybees, introduced wasps), Diptera (hoverflies, flies), Lepidoptera (butterflies and moths), Orthoptera (crickets), Coleoptera (beetles), and some Araneae (spiders). The null hypothesis expectation was that, at order level, there should be equal presence of these insect orders in each habitat. This null is justified at the order level for a color trapping experiment since many insect species have similar color vision within order [81]. For example, all known bees have trichromatic vision and a preference for bluish colors [82,83], whilst flies have tetrachromatic vision and a preference for longer wavelength yellow colors [53,54]. Using these established order level analyses that are appropriate for Australia [65], we observed significant differences in the mean proportion of insect orders captured at either the remnant native habitat or residential site locations. Important flower-visiting Hymenoptera were significantly more frequently observed within the native habitat. Our initial analysis indeed suggests that the odds of capturing hymenopteran insects were almost three times higher in the location with native vegetation (Location 1) than in the residential site of introduced garden plants (Location 2) (Table 1). Taxonomy Australia and the Wheen Bee Foundation estimate that whilst about 1600 native bee species have been identified in Australia, there may be over 1000 (ca. 40%) that have yet to be formally identified [84]. Indeed, several bee species we sampled with the pan trap method could not be identified with the current taxonomic literature, justifying our order level analyses. A secondary analysis compared only bees and hoverflies, since these insects are the known most important pollinators [14,15,16,85], and achieved a similar conclusion that the location with native vegetation had significantly more bees (Figure 4A), and interestingly, also observed that hoverflies were more frequent in this location. However, overall bees were much more frequent that hoverflies considering each of the respective locations (Figure 4A). Interestingly, native bees were most frequently observed in the location with native habitat (Figure 4B).
The odds of capturing Coleoptera, Lepidoptera, or Orthoptera in the native location (Location 1) were less than half the odds of capturing these insects in the residential location (Location 2) (Table 1). However, due to the low number of orthopteran insects captured, our results for this order should be interpreted with caution. A similar recommendation applies to our results for Araneae (spiders) in particular, which may be under-sampled using pan traps. Considering the initial analysis, Diptera, including important hoverfly pollinators, were observed in frequencies not significantly different to chance expectation at either study location, whilst the second analysis suggests that hoverflies were significantly more frequent at the location with native vegetation. This secondary analysis shows that it will be important for Australia to improve species identification to enable future studies on diversity, and the results for hoverflies agree with the data for bees that remnant habitat enables the increased relative frequency of important pollinators. Spider observations were not significantly different from chance expectation, but this result is based on low capture rate and is reported for completeness of all animals collected by the pan trap method.
A plausible explanation for the more frequent observations of some insect orders in the residential environment may be the greater presence of night lighting, which can attract certain insects [86,87,88,89]. The availability of food and/or human-made shelter may also have attracted some insects to the residential site. For example, some studies [28,90,91] have suggested that urban residential environments enable and harbor insect diversity due to availability of resources like nectar and pollen from garden plants. However, the temporal dynamics of insect residence and feeding in this context requires further investigation.
While conducting urban studies, it is difficult to precisely control the spatial dimensions of research plots, since local regulations and unique mixtures of private and public land ownership make negotiating access to research space tricky. We were fortunate to gain access to the preserved Jock Marshall Reserve and two study sites in urban spaces. However, this study was still undertaken under some notable constraints. For instance, due to urban logistical limitations, we were unable to tightly control the spatial scale of the study sites. We attempted to control for such factors by accessing available urban environments that were greater than 1.5 km from any remnant native habitat (Figure 1), a distance that is likely to be beyond the typical flying range of insects, such as native bees, that nest in a fixed location [36].
Bees are important pollinators of flowering plants [14,39,92,93], and while there was evidence of both native bees and introduced honeybees in our samples from both the native habitat and residential locations, significantly more native bees were captured in the native habitat. This suggests a possible critical mass effect on bee distributions within a city, likely influenced by the availability of suitable flowering plants in the native habitat [28,90,91]. By contrast, residential gardens may be designed specifically for human satisfaction [94]. Some studies have reported a decline in bee species diversity and abundance with increased urbanization [27,95], while another study reports the opposite [96]. Thus, future urban studies could focus on the impact of introduced plant species in residential urban and native habitats.
Our study did not observe significant variation in the distribution of dipteran species overall in the initial analyses (Table 1), although the secondary analyses revealed that hoverfly pollinators were significantly more frequent at the location with native vegetation (Figure 4A). There is growing interest in fly pollination [65,97], due to reports of potential declines in some bee species [95]. Since different insect pollinators have very different flower color preferences [97,98], recent reports show that the pollinator (i.e., either bees or flies) can generate diverse fitness outcomes for flower color [16,54]. Therefore, to enable the diversity of flowering plants, adequate and properly resourced green space is likely to be required to promote both bees and other insect flower visitors.
While the current study does not directly seek to address the size of green space required to support an increase in bee numbers, our findings from the native habitat suggests that areas as small as about 3 ha. are valuable. Our finding that Hymenoptera were significantly more frequently observed within the native habitat agrees with research in Ohio, USA that reported the abundance of native and other bees to be greater in native plant gardens [99]. These findings are also consistent with research in Canada, where observations of bee pollinators in urban gardens were positively associated with the area of planted native species [100]. Previous work has indicated that habitat may be more important than corridors for the conservation of target species [101], and given that key pollinators were significantly less frequently observed in urban locations about 1.5 km from a native habitat, our finding is broadly in agreement, since the urban environment was well treed and did allow at least some important pollinators to be present. This highlights the potential for bee conservation even in densely populated environments. However, so far, it is difficult to ascertain a threshold area of native habitat for sustaining bees and floral resources. No systematic study has yet been conducted, and accessibility for data collection can be challenging due to the logistics of urban living. To enable such studies, the possibilities presented by open research (where smaller studies make raw data available for subsequent meta analyses) are likely to be a solution, especially in an under-studied field [31]. Such future studies could seek to compare insect diversity both within and beyond urban environments [20,102] to provide important data, furthering urban ecology.

Supplementary Materials

The following are available online at https://www.mdpi.com/article/10.3390/d13040148/s1. Figure S1. Mean proportion of insects captured at each one of the three locations; Table S1: Study sites and associated plants types; Table S2: Raw data of different insects’ groups sampled at different sampling times; Table S3: Raw count; Table S4: Results of the pairwise comparison of insect captures at each location per order.

Author Contributions

A.N., T.T., A.D., M.S., and A.G.D. designed the experiment; M.S., A.D., S.R.H., and A.G.D. collected the data; M.S. and J.H.J.C. imaged the insects for further identification; J.E.G., A.G.D., F.T. and M.S. analysed the data; all the authors edited and revised the manuscript and approved for final submission. All authors have read and agreed to the published version of the manuscript.

Funding

This research was supported under Australian Research Council’s Discovery projects funding scheme (project Funding: numbers DP160100161) for A.D. and A.G.D., ARC Linkage (LP160100324) for A.G.D., and from the MILJØ2015 program of the Research Council of Norway (project number 230279/E50, PolliClim) to A.N., T.T., and A.G.D.

Institutional Review Board Statement

Not applicable.

Informed Consent Statement

Not applicable.

Data Availability Statement

All the raw data available as Supplementary Tables S2 and S3.

Acknowledgments

We thank Ricky San Martin and School of Biological Sciences providing access to the Jock Marshall Reserve to conduct the experiments. We acknowledge Zoë Bukovac and David Lea for helping to set up the pan trap experiments. We also thank Martin Burd, School of Biological Sciences, Monash University for providing the lab facilities and equipment required for this experiment. We are very thankful to four anonymous reviewers for the comments and suggestion to improve our manuscript.

Conflicts of Interest

The authors declare no conflict of interest.

References

  1. United Nations. World Urbanization Prospects: The 2014 Revision, Highlights; United Nations, Department of Economic and Social Affairs, Population Division: New York, NY, USA, 2014. [Google Scholar]
  2. Elmqvist, T.; Michail, F.; Goodness, J.; Güneralp, B.; Marcotullio, P.J.; McDonald, R.I.; Parnell, S.; Schewenius, M.; Sendstad, M.; Seto, K.C.; et al. Urbanization, Biodiversity and Ecosystem Services: Challenges and Opportunities; Springer Nature: Basingstoke, UK, 2013; Volume 103, ISBN 0169-2046. [Google Scholar]
  3. Dearborn, D.C.; KARK, S. Motivations for Conserving Urban Biodiversity. Conserv. Biol. 2010, 24, 432–440. [Google Scholar] [CrossRef] [PubMed]
  4. Ives, C.D.; Lentini, P.E.; Threlfall, C.G.; Ikin, K.; Shanahan, D.F.; Garrard, G.E.; Bekessy, S.A.; Fuller, R.A.; Mumaw, L.; Rayner, L.; et al. Cities are hotspots for threatened species. Glob. Ecol. Biogeogr. 2016, 25, 117–126. [Google Scholar] [CrossRef]
  5. New, T.R. Promoting and developing insect conservation in Australia’s urban environments. Austral Entomol. 2018, 57, 182–193. [Google Scholar] [CrossRef]
  6. Cook, W.M.; Faeth, S.H. Irrigation and Land Use Drive Ground Arthropod Community Patterns in an Urban Desert. Environ. Entomol. 2006, 35, 1532–1540. [Google Scholar] [CrossRef]
  7. Hunter, M.R.; Hunter, M.D. Designing for conservation of insects in the built environment. Insect Conserv. Divers. 2008, 22, 189–196. [Google Scholar] [CrossRef] [Green Version]
  8. Ikin, K.; Le Roux, D.S.; Rayner, L.; Villaseñor, N.R.; Eyles, K.; Gibbons, P.; Manning, A.D.; Lindenmayer, D.B. Key lessons for achieving biodiversity-sensitive cities and towns. Ecol. Manag. Restor. 2015, 16, 206–214. [Google Scholar] [CrossRef]
  9. Garrard, G.E.; Williams, N.S.G.; Mata, L.; Thomas, J.; Bekessy, S.A. Biodiversity Sensitive Urban Design. Conserv. Lett. 2018, 11, e12411. [Google Scholar] [CrossRef]
  10. Sánchez-Bayo, F.; Wyckhuys, K.A.G. Worldwide decline of the entomofauna: A review of its drivers. Biol. Conserv. 2019, 232, 8–27. [Google Scholar] [CrossRef]
  11. Lindenmayer, D.B.; Fischer, J. Habitat Fragmentation and Landscape Change: An Ecological and Conservation Synthesis; Island Press: Washington, DC, USA, 2013; ISBN 159726606X. [Google Scholar]
  12. Battisti, C. Habitat fragmentation, fauna and ecological network planning: Toward a theoretical conceptual framework. Ital. J. Zool. 2003, 70, 241–247. [Google Scholar] [CrossRef]
  13. Salafsky, N.; Salzer, D.; Stattersfield, A.J.; Hilton-Taylor, C.; Neugarten, R.; Butchart, S.H.M.; Collen, B.; Cox, N.; Master, L.L.; O’Connor, S.; et al. A standard lexicon for biodiversity conservation: Unified classifications of threats and actions. Conserv. Biol. 2008, 22, 897–911. [Google Scholar] [CrossRef]
  14. Levin, M.D. Value of Bee Pollination to U.S. Agriculture. Bull. Entomol. Soc. Am. 1983, 29, 50–51. [Google Scholar] [CrossRef]
  15. Cook, D.F.; Voss, S.C.; Finch, J.T.D.; Rader, R.C.; Cook, J.M.; Spurr, C.J. The role of flies as pollinators of horticultural crops: An Australian case study with worldwide relevance. Insects 2020, 11, 341. [Google Scholar] [CrossRef]
  16. Shrestha, M.; Burd, M.; Garcia, J.E.; Dorin, A.; Dyer, A.G. Colour evolution within orchids depends on whether the pollinator is a bee or a fly. Plant Biol. 2019, 21, 745–752. [Google Scholar] [CrossRef]
  17. Hall, D.M.; Camilo, G.R.; Tonietto, R.K.; Ollerton, J.; Ahrné, K.; Arduser, M.; Ascher, J.S.; Baldock, K.C.R.; Fowler, R.; Frankie, G.; et al. The city as a refuge for insect pollinators. Conserv. Biol. 2017, 31, 24–29. [Google Scholar] [CrossRef] [PubMed]
  18. New, T.R. Insect Conservation and Urban Environments; Springer: Berlin/Heidelberg, Germany, 2015; ISBN 3319212230. [Google Scholar]
  19. Hostetler, N.E.; McIntyre, M.E.; McIntyre, N.E.; Hostetler, M.E. Effects of urban land use on pollinator (Hymenoptera: Apoidea) communities in a desert metropolis. Basic Appl. Ecol. 2001, 2, 209. [Google Scholar] [CrossRef] [Green Version]
  20. Goulson, D.; Lye, G.C.; Darvill, B. Decline and conservation of bumble bees. Annu. Rev. Entomol. 2008, 53, 191–208. [Google Scholar] [CrossRef]
  21. Matteson, K.C.; Ascher, J.S.; Langellotto, G.A. Bee Richness and Abundance in New York City Urban Gardens. Ann. Entomol. Soc. Am. 2008, 101, 140–150. [Google Scholar] [CrossRef]
  22. Winfree, R.; Aguilar, R.; Vázquez, D.P.; LeBuhn, G.; Aizen, M.A. A meta-analysis of bees’ responses to anthropogenic disturbance. Ecology 2009, 90, 2068–2076. [Google Scholar] [CrossRef]
  23. Leong, M.; Kremen, C.; Roderick, G.K. Pollinator Interactions with Yellow Starthistle (Centaurea solstitialis) across Urban, Agricultural, and Natural Landscapes. PLoS ONE 2014, 9, e086357. [Google Scholar]
  24. Baldock, K.C.R.; Goddard, M.A.; Hicks, D.M.; Kunin, W.E.; Mitschunas, N.; Osgathorpe, L.M.; Potts, S.G.; Robertson, K.M.; Scott, A.V.; Stone, G.N.; et al. Where is the UK’s pollinator biodiversity? The importance of urban areas for flower-visiting insects. Proc. R. Soc. Lond. B Biol. Sci. 2015, 282, 20142849. [Google Scholar] [CrossRef] [PubMed] [Green Version]
  25. Turrini, T.; Knop, E. A landscape ecology approach identifies important drivers of urban biodiversity. Glob. Chang. Biol. 2015, 21, 1652–1667. [Google Scholar] [CrossRef]
  26. Ziter, C. The biodiversity–ecosystem service relationship in urban areas: A quantitative review. Oikos 2016, 125, 761–768. [Google Scholar] [CrossRef]
  27. Ahrné, K.; Bengtsson, J.; Elmqvist, T. Bumble Bees (Bombus spp) along a Gradient of Increasing Urbanization. PLoS ONE 2009, 4, e05574. [Google Scholar] [CrossRef] [Green Version]
  28. Bates, A.J.; Sadler, J.P.; Fairbrass, A.J.; Falk, S.J.; Hale, J.D.; Matthews, T.J. Changing bee and hoverfly pollinator assemblages along an urban-rural gradient. PLoS ONE 2011, 6, e023459. [Google Scholar] [CrossRef] [PubMed]
  29. Yuen, S.W.; Bonebrake, T.C. Artificial night light alters nocturnal prey interception outcomes for morphologically variable spiders. PeerJ 2017, 5, e4070. [Google Scholar] [CrossRef] [PubMed]
  30. Czaczkes, T.J.; Bastidas-Urrutia, A.M.; Ghislandi, P.; Tuni, C. Reduced light avoidance in spiders from populations in light-polluted urban environments. Sci. Nat. 2018, 105, 64. [Google Scholar] [CrossRef] [PubMed]
  31. Harrison, T.; Winfree, R. Urban drivers of plant-pollinator interactions. Funct. Ecol. 2015, 29, 879–888. [Google Scholar] [CrossRef]
  32. Sands, D.P.A. Important issues facing insect conservation in Australia: Now and into the future. Austral Entomol. 2018, 57, 150–172. [Google Scholar] [CrossRef] [Green Version]
  33. McLoughlin, S. The breakup history of Gondwana and its impact on pre-Cenozoic floristic provincialism. Aust. J. Bot. 2001, 49, 271–300. [Google Scholar] [CrossRef]
  34. Exon, N.F.; Hill, P.J.; Lafoy, Y.; Heine, C.; Bernardel, G. Kenn Plateau off northeast Australia: A continental fragment in the southwest Pacific jigsaw. Aust. J. Earth Sci. 2006, 53, 541–564. [Google Scholar] [CrossRef]
  35. Armstrong, J.A. Biotic pollination mechanisms in the Australian flora—A review. N. Z. J. Bot. 1979, 17, 467–508. [Google Scholar] [CrossRef]
  36. Heard, T.A. The Australian Native Bee Book: Keeping Stingless Bee Hives for Pets, Pollination, and Sugarbag Honey; Sugarbag Bees: Brisbane, Australia, 2016. [Google Scholar]
  37. Gilpin, A.-M.; Denham, A.J.; Ayre, D.J. Are there magnet plants in Australian ecosystems: Pollinator visits to neighbouring plants are not affected by proximity to mass flowering plants. Basic Appl. Ecol. 2019, 35, 34–44. [Google Scholar] [CrossRef]
  38. Shrestha, M.; Dyer, A.G.; Bhattarai, P.; Burd, M. Flower colour and phylogeny along an altitudinal gradient in the Himalayas of Nepal. J. Ecol. 2014, 102, 126–135. [Google Scholar] [CrossRef]
  39. Dyer, A.G.; Boyd-Gerny, S.; McLoughlin, S.; Rosa, M.G.P.; Simonov, V.; Wong, B.B.M. Parallel evolution of angiosperm colour signals: Common evolutionary pressures linked to hymenopteran vision. Proc. R. Soc. B 2012, 279, 3606–3615. [Google Scholar] [CrossRef] [PubMed] [Green Version]
  40. Austin, A.D.; Yeates, D.K.; Cassis, G.; Fletcher, M.J.; Salle, J.L.; Lawrence, J.F.; McQuillan, P.B.; Mound, L.A.; Bickel, D.J.; Gullan, P.J.; et al. Insects ‘Down Under’—Diversity, endemism and evolution of the Australian insect fauna: Examples from select orders. Aust. J. Entomol. 2004, 43, 216–234. [Google Scholar] [CrossRef]
  41. Hahs, A.K.; McDonnell, M.J.; McCarthy, M.A.; Vesk, P.A.; Corlett, R.T.; Norton, B.A.; Clemants, S.E.; Duncan, R.P.; Thompson, K.; Schwartz, M.W.; et al. A global synthesis of plant extinction rates in urban areas. Ecol. Lett. 2009, 12, 1165–1173. [Google Scholar] [CrossRef]
  42. Victorian Planning Authority Announcement. Available online: https://vpa.vic.gov.au/ (accessed on 28 May 2019).
  43. Australian Bureau of Statistics, Australian Government. Available online: https://www.abs.gov.au/ (accessed on 28 May 2019).
  44. The Economist Intelligence Unit Limited. Available online: https://www.eiu.com/ (accessed on 28 May 2019).
  45. R Core Team R Core Team. R: A Language and Environment for Statistical Computing; Version 3.5.1.; R Foundation for Statistical Computing: Vienna, Austria, 2018; Available online: https://www.R-project.org/ (accessed on 28 May 2019).
  46. Heithaus, E.R. Community Structure of Neotropical Flower Visiting Bees and Wasps: Diversity and Phenology. Ecology 1979, 60, 190–202. [Google Scholar] [CrossRef]
  47. Peakall, R.; Beattie, A.J. Pollination of the Orchid Microtis parviflora R. Br. by Flightless Worker Ants. Funct. Ecol. 1989, 3, 515–522. [Google Scholar] [CrossRef]
  48. Shuttleworth, A.; Johnson, S. Specialized Pollination by Large Spider-Hunting Wasps and Self-Incompatibility in the African Milkweed Pachycarpus asperifolius. Int. J. Plant Sci. 2006, 167, 1177–1186. [Google Scholar] [CrossRef]
  49. Ollerton, J.; Liede-Schumann, S.; Endress, M.E.; Meve, U.; Rech, A.R.; Shuttleworth, A.; Keller, H.A.; Fishbein, M.; Alvarado-Cárdenas, L.O.; Amorim, F.W.; et al. The diversity and evolution of pollination systems in large plant clades: Apocynaceae as a case study. Ann. Bot. 2019, 123, 311–325. [Google Scholar] [CrossRef] [Green Version]
  50. Bawa, K.S.; Bullock, S.H.; Perry, D.R.; Coville, R.E.; Grayum, M.H. Reproductive biology of tropical lowland rain forest trees. II. Pollination systems. Am. J. Bot. 1985, 72, 346–356. [Google Scholar] [CrossRef]
  51. Paudel, B.R.; Shrestha, M.; Burd, M.; Adhikari, S.; Sun, Y.S.; Li, Q.J. Coevolutionary elaboration of pollination-related traits in an alpine ginger (Roscoea purpurea) and a tabanid fly in the Nepalese Himalayas. New Phytol. 2016, 211, 1402–1411. [Google Scholar] [CrossRef] [PubMed] [Green Version]
  52. Paudel, B.R.; Shrestha, M.; Dyer, A.G.; Zhu, X.F.; Abdusalam, A.; Li, Q.J. Out of Africa: Evidence of the obligate mutualism between long corolla tubed plant and long-tongued fly in the Himalayas. Ecol. Evol. 2015, 5, 5240–5251. [Google Scholar] [CrossRef] [PubMed] [Green Version]
  53. Lunau, K. Visual ecology of flies with particular reference to colour vision and colour preferences. J. Comp. Physiol. A 2014, 200, 497–512. [Google Scholar] [CrossRef] [PubMed]
  54. Shrestha, M.; Lunau, K.; Dorin, A.; Schulze, B.; Bischoff, M.; Burd, M.; Dyer, A.G. Floral colours in a world without birds and bees: The plants of Macquarie Island. Plant Biol. 2016, 18, 842–850. [Google Scholar] [CrossRef]
  55. Doyle, T.; Hawkes, W.L.S.; Massy, R.; Powney, G.D.; Menz, M.H.M.; Wotton, K.R. Pollination by hoverflies in the Anthropocene: Pollination by Hoverflies. Proc. R. Soc. B Biol. Sci. 2020, 287. [Google Scholar] [CrossRef]
  56. Orford, K.A.; Vaughan, I.P.; Memmott, J. The forgotten flies: The importance of non-syrphid Diptera as pollinators. Proc. R. Soc. B Biol. Sci. 2015, 282, doi. [Google Scholar] [CrossRef] [Green Version]
  57. Pauw, A.; Stofberg, J.; Waterman, R.J. Flies and Flowers in Darwin’s Race. Evolution 2009, 63, 268–279. [Google Scholar] [CrossRef]
  58. Gottsberger, G. Flowers and Beetles in the South American Tropics. Bot. Acta 1990, 103, 360–365. [Google Scholar] [CrossRef]
  59. Bernhardt, P. Convergent evolution and adaptive radiation of beetle-pollinated angiosperms. Plant Syst. Evol. 2000, 222, 293–320. [Google Scholar] [CrossRef]
  60. Paudel, B.R.; Shrestha, M.; Dyer, A.G.; Li, Q. Ginger and the beetle: Evidence of primitive pollination system in a Himalayan endemic alpine ginger (Roscoea alpina, Zingiberaceae). PLoS ONE 2017, 12, e0180460. [Google Scholar] [CrossRef] [Green Version]
  61. Micheneau, C.; Fournel, J.; Warren, B.H.; Hugel, S.; Gauvin-Bialecki, A.; Pailler, T.; Strasberg, D.; Chase, M.W. Orthoptera, a new order of pollinator. Ann. Bot. 2010, 105, 355–364. [Google Scholar] [CrossRef]
  62. Heiling, A.M.; Herberstein, M.E.; Chittka, L. Pollinator attraction: Crab-spiders manipulate flower signals. Nature 2003, 421, 334. [Google Scholar] [CrossRef] [PubMed]
  63. Huey, S.; Nieh, J.C. Foraging at a safe distance: Crab spider effects on pollinators. Ecol. Entomol. 2017, 42, 469–476. [Google Scholar] [CrossRef] [Green Version]
  64. Jackson, R.R.; Pollard, S.D.; Nelson, X.J.; Edwards, G.B.; Barrion, A.T. Jumping spiders (Araneae: Salticidae) that feed on nectar. J. Zool. 2001, 255, 25–29. [Google Scholar] [CrossRef]
  65. Shrestha, M.; Tscheulin, T.; Garcia, J.E.; Chua, J.H.J.; Howard, S.R.; Dorin, A.; Nielsen, A.; Dyer, A.G. Fluorescent pan traps affect the capture rate of insect orders in different ways. Insects 2019, 10, 40. [Google Scholar] [CrossRef] [PubMed] [Green Version]
  66. Nielsen, A.; Steffan-Dewenter, I.; Westphal, C.; Messinger, O.; Potts, S.G.; Roberts, S.P.M.; Settele, J.; Szentgyörgyi, H.; Vaissière, B.E.; Vaitis, M. Assessing bee species richness in two Mediterranean communities: Importance of habitat type and sampling techniques. Ecol. Res. 2011, 26, 969–983. [Google Scholar] [CrossRef]
  67. LeBuhn, G.; Droege, S.; Connor, E.; Gemmill-Herren, B.; Azzu, N. Protocol to Detect and Monitor Pollinator Communities: Guidance for Practitioners; Food and Agriculture Organization: Quebec City, QC, Canada, 2016. [Google Scholar]
  68. Michener, C.D. The Bees of the World, 2nd ed.; Johns Hopkins: Baltimore, MD, USA, 2007. [Google Scholar]
  69. Zborowski, P.; Storey, R. Field Guide to Insects in Australia; New Holand Publisher, CSIRO: Clayton, Australia, 2010; ISBN 0730104141. [Google Scholar]
  70. Dollin, A.; Batley, M.; Robinson, M.; Faulkner, B. Native Bees of the Sydney Region, A Field Guide; Australian Native Bee Research Centre: North Richmond, Australia, 2000. [Google Scholar]
  71. Gullan, P.J.; Cranston, P.S. The Insects: An Outline of Entomology; John Wiley & Sons: Hoboken, NJ, USA, 2009; ISBN 1405144572. [Google Scholar]
  72. The Core Team, R. R: A Language and Environment for Statistical Computing; V 4.02.; R Foundation for Statistical Computing: Vienna, Austria, 2020; Available online: https://www.r-project.org/ (accessed on 28 May 2019).
  73. Fox, J.; Weisberg, S. An R Companion to Applied Regression, 3rd ed.; Sage: Thousand Oaks, CA, USA, 2019. [Google Scholar]
  74. Lenth, R. Emmeans: Estimated Marginal Means, Aka Least-Squares Means. R Package Version 1.5-2-1. Available online: https://cran.r-project.org/package=emmeans (accessed on 29 October 2020).
  75. Faraway, J.J. Extending the Linear Model with R; Carlin, B.P., Chatfield, C., Tanner, M., Zidek, J., Eds.; Chapman & Hall/CRC: Boca Raton, FL, USA, 2006. [Google Scholar]
  76. Zuur, A.F.; Hilbe, J.M.; Ieno, E.N. A Beginner’s Guide to GLM and GLMM with R: A Frequentist and Bayesian Perspective for Ecologists; Highland Statistics Limited: New Burgh, NY, USA, 2013; ISBN 0957174144. [Google Scholar]
  77. Zuur Ieno, E.N.; Walker, N.; Saveliev, A.A.; Smith, G.M.A.; Zuur, I.E.N.; Walker, N.; Saveliev, A.A.; Smith, G.M.A. Mixed Effects Models and Extensions in Ecology with R; Springer: New York, NY, USA, 2009. [Google Scholar]
  78. Hardin, J.W.; Hilbe, J.M.; Hilbe, J. Generalized Linear Models and Extensions; Second Stata Press: College Station, TX, USA, 2007. [Google Scholar]
  79. Nagelkerke, N.J.D. A note on a general definition of the coefficient of determination miscellanea a note on a general definition of the coefficient of determination. Biometrika 1991, 78, 691–692. [Google Scholar] [CrossRef]
  80. Searle, S.R.; Speed, F.M.; Milliken, G.A. Population Marginal Means in the Linear Model: An Alternative to Least Squares Means. Am. Stat. 1980, 34, 216–221. [Google Scholar]
  81. Briscoe, A.D.; Chittka, L. The evolution of color vision in insects. Annu. Rev. Entomol. 2001, 46, 471–510. [Google Scholar] [CrossRef] [Green Version]
  82. Giurfa, M.; Núñez, J.; Chittka, L.; Menzel, R. Colour preferences of flower-naive honeybees. J. Comp. Physiol. A 1995, 177, 247–259. [Google Scholar] [CrossRef]
  83. Dyer, A.G.; Boyd-Gerny, S.; Shrestha, M.; Lunau, K.; Garcia, J.E.; Koethe, S.; Wong, B.B.M.M. Innate colour preferences of the Australian native stingless bee Tetragonula carbonaria Sm. J. Comp. Physiol. A 2016, 202, 603–613. [Google Scholar] [CrossRef] [PubMed]
  84. Discovering and Documenting Australia’s Native Bees. Available online: https://www.taxonomyaustralia.org.au/discoverbees (accessed on 28 May 2019).
  85. Gautam, G.; Paudel, A.; Poudel, L.; Shrestha, M. Limno-plankton diversity and water quality in shallow Lake Ecosystem in central Nepal. Int. J. Adv. Res. Biol. Sci 2016, 3, 131–139. [Google Scholar]
  86. Burkett, D.A.; Butler, J.F.; Kline, D.L. Field evaluation of colored light-emitting diodes as attractants for woodland mosquitoes and other Diptera in north central Florida. J. Am. Mosq. Control Assoc. News 1998, 14, 186–195. [Google Scholar]
  87. Cohnstaedt, L.W.; Gillen, J.I.; Munstermann, L.E. Light-emitting diode technology improves insect trapping. J. Am. Mosq. Control Assoc. 2008, 24, 331–334. [Google Scholar] [CrossRef] [PubMed] [Green Version]
  88. Horváth, G.; Kriska, G.; Malik, P.; Robertson, B. Polarized light pollution: A new kind of ecological photopollution. Front. Ecol. Environ. 2009, 7, 317–325. [Google Scholar] [CrossRef] [Green Version]
  89. Souza de Medeiros, B.A.; Barghini, A.; Souza de Medeiros, B.A. UV radiation as an attractor for insects. Leukos 2012, 9, 47–56. [Google Scholar]
  90. Kaluza, B.F.; Wallace, H.; Heard, T.A.; Klein, A.-M.; Leonhardt, S.D. Urban gardens promote bee foraging over natural habitats and plantations. Ecol. Evol. 2016, 6, 1304–1316. [Google Scholar] [CrossRef] [Green Version]
  91. Palma, E.; Catford, J.A.; Corlett, R.T.; Duncan, R.P.; Hahs, A.K.; McCarthy, M.A.; McDonnell, M.J.; Thompson, K.; Williams, N.S.G.; Vesk, P.A. Functional trait changes in the floras of 11 cities across the globe in response to urbanization. Ecography 2016, 40, 875–886. [Google Scholar] [CrossRef]
  92. Barth, F.G. Insects and Flowers. The Biology of a Partnership; Princeton University Press USA: Princeton, NJ, USA, 1985; ISBN 0045740291. [Google Scholar]
  93. Chittka, L.; Thomson, J.D.; Waser, N.M. Flower constancy, insect psychology, and plant evolution. Naturwissenschaften 1999, 86, 361–377. [Google Scholar] [CrossRef]
  94. Cruz-Cárdenas, J.; Oleas, N.H. Private Urban Garden Satisfaction and Its Determinants in Quito, Ecuador. SAGE Open 2018, 8. [Google Scholar] [CrossRef] [Green Version]
  95. Fortel, L.; Henry, M.; Guilbaud, L.; Guirao, A.L.; Kuhlmann, M.; Mouret, H.; Rollin, O.; Vaissière, B.E. Decreasing abundance, increasing diversity and changing structure of the wild bee community (Hymenoptera: Anthophila) along an urbanization gradient. PLoS ONE 2014, 9, e0104679. [Google Scholar] [CrossRef] [PubMed]
  96. Sirohi, M.H.; Jackson, J.; Edwards, M.; Ollerton, J. Diversity and abundance of solitary and primitively eusocial bees in an urban centre: A case study from Northampton (England). J. Insect Conserv. 2015, 19, 487–500. [Google Scholar] [CrossRef] [Green Version]
  97. Hannah, L.; Dyer, A.G.; Garcia, J.E.; Dorin, A.; Burd, M. Psychophysics of the hoverfly: Categorical or continuous color discrimination? Curr. Zool. 2019, 65, 483–492. [Google Scholar] [CrossRef]
  98. van der Kooi, C.J.; Dyer, A.G.; Kevan, P.G.; Lunau, K. Functional significance of the optical properties of flowers for visual signalling. Ann. Bot. 2018, 123, 263–276. [Google Scholar] [CrossRef] [PubMed] [Green Version]
  99. Pardee, G.L.; Philpott, S.M. Native plants are the bee’s knees: Local and landscape predictors of bee richness and abundance in backyard gardens. Urban Ecosyst. 2014, 17, 641–659. [Google Scholar] [CrossRef] [Green Version]
  100. Fukase, J.; Simons, A.M. Increased pollinator activity in urban gardens with more native flora. Appl. Ecol. Environ. Res. 2016, 14, 297–310. [Google Scholar] [CrossRef]
  101. Bennett, A.F. Habitat linkages: A key element in an integrated landscape approach to conservation. Parks 1997, 7, 43–49. [Google Scholar]
  102. Goulson, D.; Hughes, W.; Derwent, L.; Stout, J. Colony growth of the bumblebee, Bombus terrestris, in improved and conventional agricultural and suburban habitats. Oecologia 2002, 130, 267–273. [Google Scholar] [CrossRef] [PubMed]
Figure 1. Map of the study area. (a) Map of Australia showing the geographical location of the city of Melbourne (solid yellow circle) (b) Map showing the urban area of Greater Melbourne (dark blue shaded region) within the urban growth boundary (light green shaded region) and the sampling locations (Source: https://www.sro.vic.gov.au/greater-melbourne-map-and-urban-zones (accessed on 28 May 2019)). (c) Aerial view of the study location and sampling sites. The numbers and red marks show the study sites within three different locations (details in sect 2.1 Study area). Sites 1 and 2 have access to remnant native habitat (Jock Marshall Reserve), sites 4 and 5 are residential urban environments; site 3 data collected not considered in main manuscript. Maps a and c were prepared in R v3.5.1 using packages ‘maps’, ‘dismo’, and ‘raster’ [45].
Diversity 13 00148 g001
Figure 2. Proportion of insects captured at each one of the four sites contained within the two study locations considered in this study: remnant native habitat of Location 1 (Bars S1 and S2), and introduced garden plants habitat of residential locations, Location 2 (Bars S3 and S4), sampled at the three different times: early in the season (red bars), mid-season (yellow bars), and late in the season (blue bars) during the Australian summer of 2016–2017. Panels represent the various orders of insects captured as indicated by the respective labels. Numbers at the top of each bar indicate the total number of individuals captured at each site. Sampling details are provided in the sub-section Data collection under the section Materials and Methods (see also supplementary Table S1).
Diversity 13 00148 g002
Figure 3. Mean proportion of insect orders captured in Location 1 (sites with remnant vegetation, white bars), and Location 2 (residential sites, gray bars) predicted by the model. Error bars indicate the 95 % CI of the marginal means used to test for pairwise differences between sites for each insect order (Table S3, Figure S1). Significance of each pairwise test is represented by asterisks and letters: non-significant difference (NS), significant difference at α = 0.01 (**), significant difference at α = 0.001 (***). All p-values were adjusted for multiple comparisons using Tukey’s honestly significant difference (HSD) method. See Table 1 for details of the results of the statistical comparison.
Diversity 13 00148 g003
Figure 4. Comparison of pollinators captured at the location with remnant native vegetation (location 1, blue bars) and the urban, residential location (location 2, orange bars). Panel (A): mean number of hymenopterans and hoverflies captured at both sites. There were significantly more hymenopterans captured in location 1 than in location 2 (p < 0.001), with significantly more hymenopterans captured at both locations (p < 0.001). Panel (B): mean number of European honeybees (Apis mellifera) and native bees captured at the two locations. Significantly, more native bees than European honeybees were captured at both locations (p < 0.001), with more captures being made at the location with remnant native vegetation (p < 0.001). Error bars represent 95 % confidence intervals of the mean in all cases. Refer to the result section for details on the statistical analyses.
Diversity 13 00148 g004
Table 1. Statistical comparison of the mean proportion of insect captures for the remnant native locations (Location 1) and residential location (Location 2) by order (H0 = urban residential—urban remnant = 0) and odds ratio for each comparison. p-values were adjusted for multiple comparisons using Tukey’s honestly significant difference (HSD) method.
OrderMean Proportion Difference (95% CI)Odds Ratiozp
Araneae−1.02 (−2.18, 0.133)0.360−1.730.083
Coleoptera−1.59 (−2.03, −1.15)0.224−7.09<0.001
Diptera0.106 (−0.186, 0.398)1.110.7110.477
Hymenoptera1.05 (0.759, 1.34)2.867.18<0.001
Lepidopterans−1.23 (−1.65, −0.809)0.215−5.73<0.001
Orthopterans−1.77 (−3.04, −0.499)0.170−2.730.006
Publisher’s Note: MDPI stays neutral with regard to jurisdictional claims in published maps and institutional affiliations.

