Article

Transcriptome Analyses Reveal Circadian-Related Expression Features in the Visual Systems of Two Snakes

1
Institute of Qinghai-Tibetan Plateau, Southwest Minzu University, Chengdu 610041, China
2
CAS Key Laboratory of Mountain Ecological Restoration and Bioresource Utilization & Ecological Restoration and Biodiversity Conservation Key Laboratory of Sichuan Province, Chengdu Institute of Biology, Chinese Academy of Sciences, Chengdu 610041, China
3
University of Chinese Academy of Sciences, Beijing 100049, China
*
Authors to whom correspondence should be addressed.
Diversity 2021, 13(12), 621; https://doi.org/10.3390/d13120621
Submission received: 2 November 2021 / Revised: 20 November 2021 / Accepted: 23 November 2021 / Published: 26 November 2021
(This article belongs to the Special Issue 2021 Feature Papers by Diversity’s Editorial Board Members)

Abstract

:
The visual characteristics of animals with different circadian habits, especially colubrid snakes, exhibit highly variable photoreceptor morphology. While studies have reported on the diversity in retinal cell morphology among snakes with different circadian patterns, few studies have examined the expression of genes related to vision. To explore gene expression patterns in the eyes between diurnal and nocturnal snakes, we carried out RNA sequencing of six tissues (eye, heart, liver, lung, kidney, and muscle) in two colubrids with disparate circadian activities, i.e., diurnal Ahaetulla prasina and nocturnal Lycodon flavozonatum, followed by weighted gene co-expression network analysis (WGCNA). The genes in the two most correlated modules were primarily enriched in different functional pathways, thus suggesting different biological functions. Three opsin genes (RH1, LWS, and SWS) were differentially expressed between the two species. Moreover, in the phototransduction pathway, different genes were highly expressed in the eyes of both species, reflecting specific expression patterns in the eyes of snakes with different circadian activity. We also confirmed the dominance of cone- and rod-related genes in diurnal and nocturnal adaptation, respectively. This work provides an important foundation for genetic research on visual adaptation in snakes and provides further insight into the adaptive evolution of such species.

1. Introduction

The evolution of perception has long fascinated evolutionary biologists, especially the complex visual systems that have evolved over millions of years to adapt to diverse habitats with various spectral ranges and illumination intensities [1]. The initial process of vertebrate vision is the absorption of light by retinal photoreceptor cells (rods and cones), and subsequent activation of the biochemical phototransduction cascade, which converts light signals into electrical signals transmitted through nerves [2]. Visual pigments (or opsins) play a core role in visual photosensitivity. Photons are absorbed by visual pigments, i.e., G protein-coupled receptors [3]. Rhodopsin visual pigments are found in rod cells, whereas color visual pigments are found in cone cells [4]. Animal lifestyle often reflects the content of cones and rods [5]. Nocturnal terrestrial animals have an abundance of rods, which mediate dim-light vision, whereas diurnal vertebrates contain more cones with good color vision [6]. For instance, daytime visual capabilities, including cone densities, cone: rod ratios, and photopic a-wave amplitudes, can discriminate wading bird species [7]; among reptiles, the nocturnal gecko (Gekko gekko) has pure rod retinas [8] while the diurnal chameleon (Anolis carolinensis) has pure cone retinas [9].
Snakes are globally distributed taxa, and their distribution patterns are affected by diffusion corridors [10] or isolation barriers [11] produced by geological changes. More than 3500 extant snake species are currently recognized, which exhibit considerable diversity in habitat requirements and circadian patterns [12]. Snakes usually perceive their prey by chemosensory or visual stimuli, and exhibit diverse diurnal and nocturnal lifestyles [13]. Diversified constitute of photoreceptors in retinas of snakes was described, especially in colubrids [14] (e.g., pure cone retina in some diurnal colubrids, and pure rod retina in some nocturnal colubrids). Thus, snakes are good model animals for exploring adaptive molecular evolution of vertebrate vision. However, most related research has focused on mammals, birds, and fish, revealing the adaptations of retinal morphology [15]. Several studies have explored the evolutionary changes in snake opsin genes, indicating exceptional diversity in snake visual systems [16,17]. Different from other vertebrate taxa, most snakes only express three visual opsin genes [18], i.e., the rhodopsin (RH1) gene, which is mainly expressed in rods, the short-wavelength-sensitive (SWS1) gene, which is primarily located in small singles cones, and the long-wavelength-sensitive (LWS) gene, which is mainly found in large single cones [19]. Divergence in snake circadian activity has led to the adaptation of retinal morphology to either photopic or scotopic vision, which may result in differences in gene expression patterns [20,21].
To explore the similarities and differences in eye gene expression patterns in snakes with different habits, we performed transcriptome sequencing and weighted gene co-expression network analysis (WGCNA) of two Colubridae snakes: i.e., Ahaetulla prasina, a common arboreal snake with acute diurnal vision in Southeast Asia and Indochina [22], and Lycodon flavozonatum, a nocturnal snake with yellow stripes mainly distributed in southern China, northern Vietnam, and Myanmar [23]. The WGCNA results revealed that eye-related genes were assigned to two modules involved in different function. Moreover, the three opsin genes and several genes vital in phototransduction cascade showed disparate expression patterns between the two species. These expression changes were in accordance with their circadian activity patterns, indicating that differences in expression may be a key molecular basis for adaptation to different circadian rhythms. Our results showed that the expression patterns of vision-related genes differed between diurnal and nocturnal snakes, providing an important basis for further molecular evolution research of snake vision.

2. Materials and Methods

2.1. Sequencing Samples Collection

To understand the genetic mechanisms underlying the visual adaption between two snakes with different habits, we collected a total of six individuals for transcriptome sequencing. Three individuals of A. prasina were collected from Xishuangbanna, Yunnan Province and three L. flavozonatum were from Mangshan, Hunan Province. Six tissues (heart, liver, lung, kidney, muscle, eyes) of each snake were sampled, immediately frozen in liquid nitrogen for 10 min, and stored at −80 °C prior to RNA isolation.

2.2. cDNA Library Construction and mRNA Sequencing

QIAGEN® RNA Mini Kit was used to extract total RNA. After degradation and contamination monitored on 1% agarose gels, RNA purity was checked using the NanoPhotometer® spectrophotometer (IMPLEN, Calabasas, CA, USA). RNA concentration was measured using the Qubit® RNA Assay Kit in Qubit® 2.0 Flurometer (Life Technologies, Carlsbad, CA, USA). RNA integrity was assessed using the RNA Nano 6000 Assay Kit of the Agilent Bioanalyzer 2100 system (Agilent Technologies, Santa Clara, CA, USA). A total amount of 1.5 μg RNA per sample was used as input material for the RNA sample preparations. Sequencing libraries were generated using NEBNext® UltraTM RNA Library Prep Kit for Illumina® (NEB, Ipswich, MA, USA), following the manufacturer’s recommendations, and index codes were added to attribute sequences to each sample. The clustering of the index-coded samples was performed on a cBot Cluster Generation System using TruSeq PE Cluster Kit v3-cBot-HS (Illumina), according to the manufacturer’s instructions. After cluster generation, the library preparations were sequenced on an Illumina Novaseq 6000 platform, and 150 bp paired-end reads were generated.

2.3. De Novo Transcriptome Assembly and Transcription Abundance Statistic

Original reads data was processed using seqtk v1.3-r106 to remove low-quality reads for obtaining clean data. The high-quality filtered reads data of six tissues of one species (three biological replicates each) were pooled together for de novo assembly. Trinity v2.4.0 was used for de novo transcriptome assembly and to remove redundant sequences, yielding unigenes of each species. We compared the assembly results (Table S1) obtained by setting different parameters, and finally applied parameters “-group_pairs_distance 230 -min_contig_length 600 -min_glue 4”. Clean reads was aligned to unigenes using bowtie2 with parameters “-no-discordant -gbar 1000 -end-to-end -k 200 -q -X 800”. The longest transcripts were retrieved as the gene body to avoid redundant gene counts. Abundance of each unigene was calculated by RSEM tool, and the TPM (Transcripts Per Million) method was chosen to represent expression level of each unigene.

2.4. Transcriptome Assembly Statistics and Functional Annotation

We used TransDecoder v3.0.1 to predict open reading frames (ORFs) and predict amino acid sequence of each unigene. BUSCO (Benchmarking Universal Single-Copy Orthologs) was used to evaluate the completeness of the unigenes against the vertebrate lineages (vertebrata_odb9, based on 2586 vertebrate core BUSCOs). Local ncbi-blast-2.7.1+ was used for the homology search of unigenes against the non-redundant SWISS-Prot database (https://ftp.uniprot.org/pub/databases/uniprot/, accessed on 22 September 2021), using a BLASTP algorithm with parameters “-line 2 -word_size 4 -evalue 1e-5 -top 3” to retrieve the best hit results of unigenes; the same protocol was processed against NCBI non-redundant protein database (NR) and Kyoto Encyclopedia of Genes and Genomes (KEGG) database. Gene ontology (GO) functional categorization analysis of unigenes was performed using in-house perl scripts, based on the SWISS-Prot annotated results retrieved associated GO terms from idmapping.tb.gz (ftp://ftp.pir.georgetown.edu/databases/idmapping/, accessed on 22 September 2021). Gene ontology (GO) annotation classified unigenes into various pathways and functions through three sub catalogs: biological process, molecular function, and cellular component. Statistics of functional prediction and GO annotation results were performed through jvenn (http://jvenn.toulouse.inra.fr/app/example.html, accessed on 2 September 2021) [24] and WEGO 2.0 (https://wego.genomics.cn/, accessed on 22 September 2021) [25], respectively.

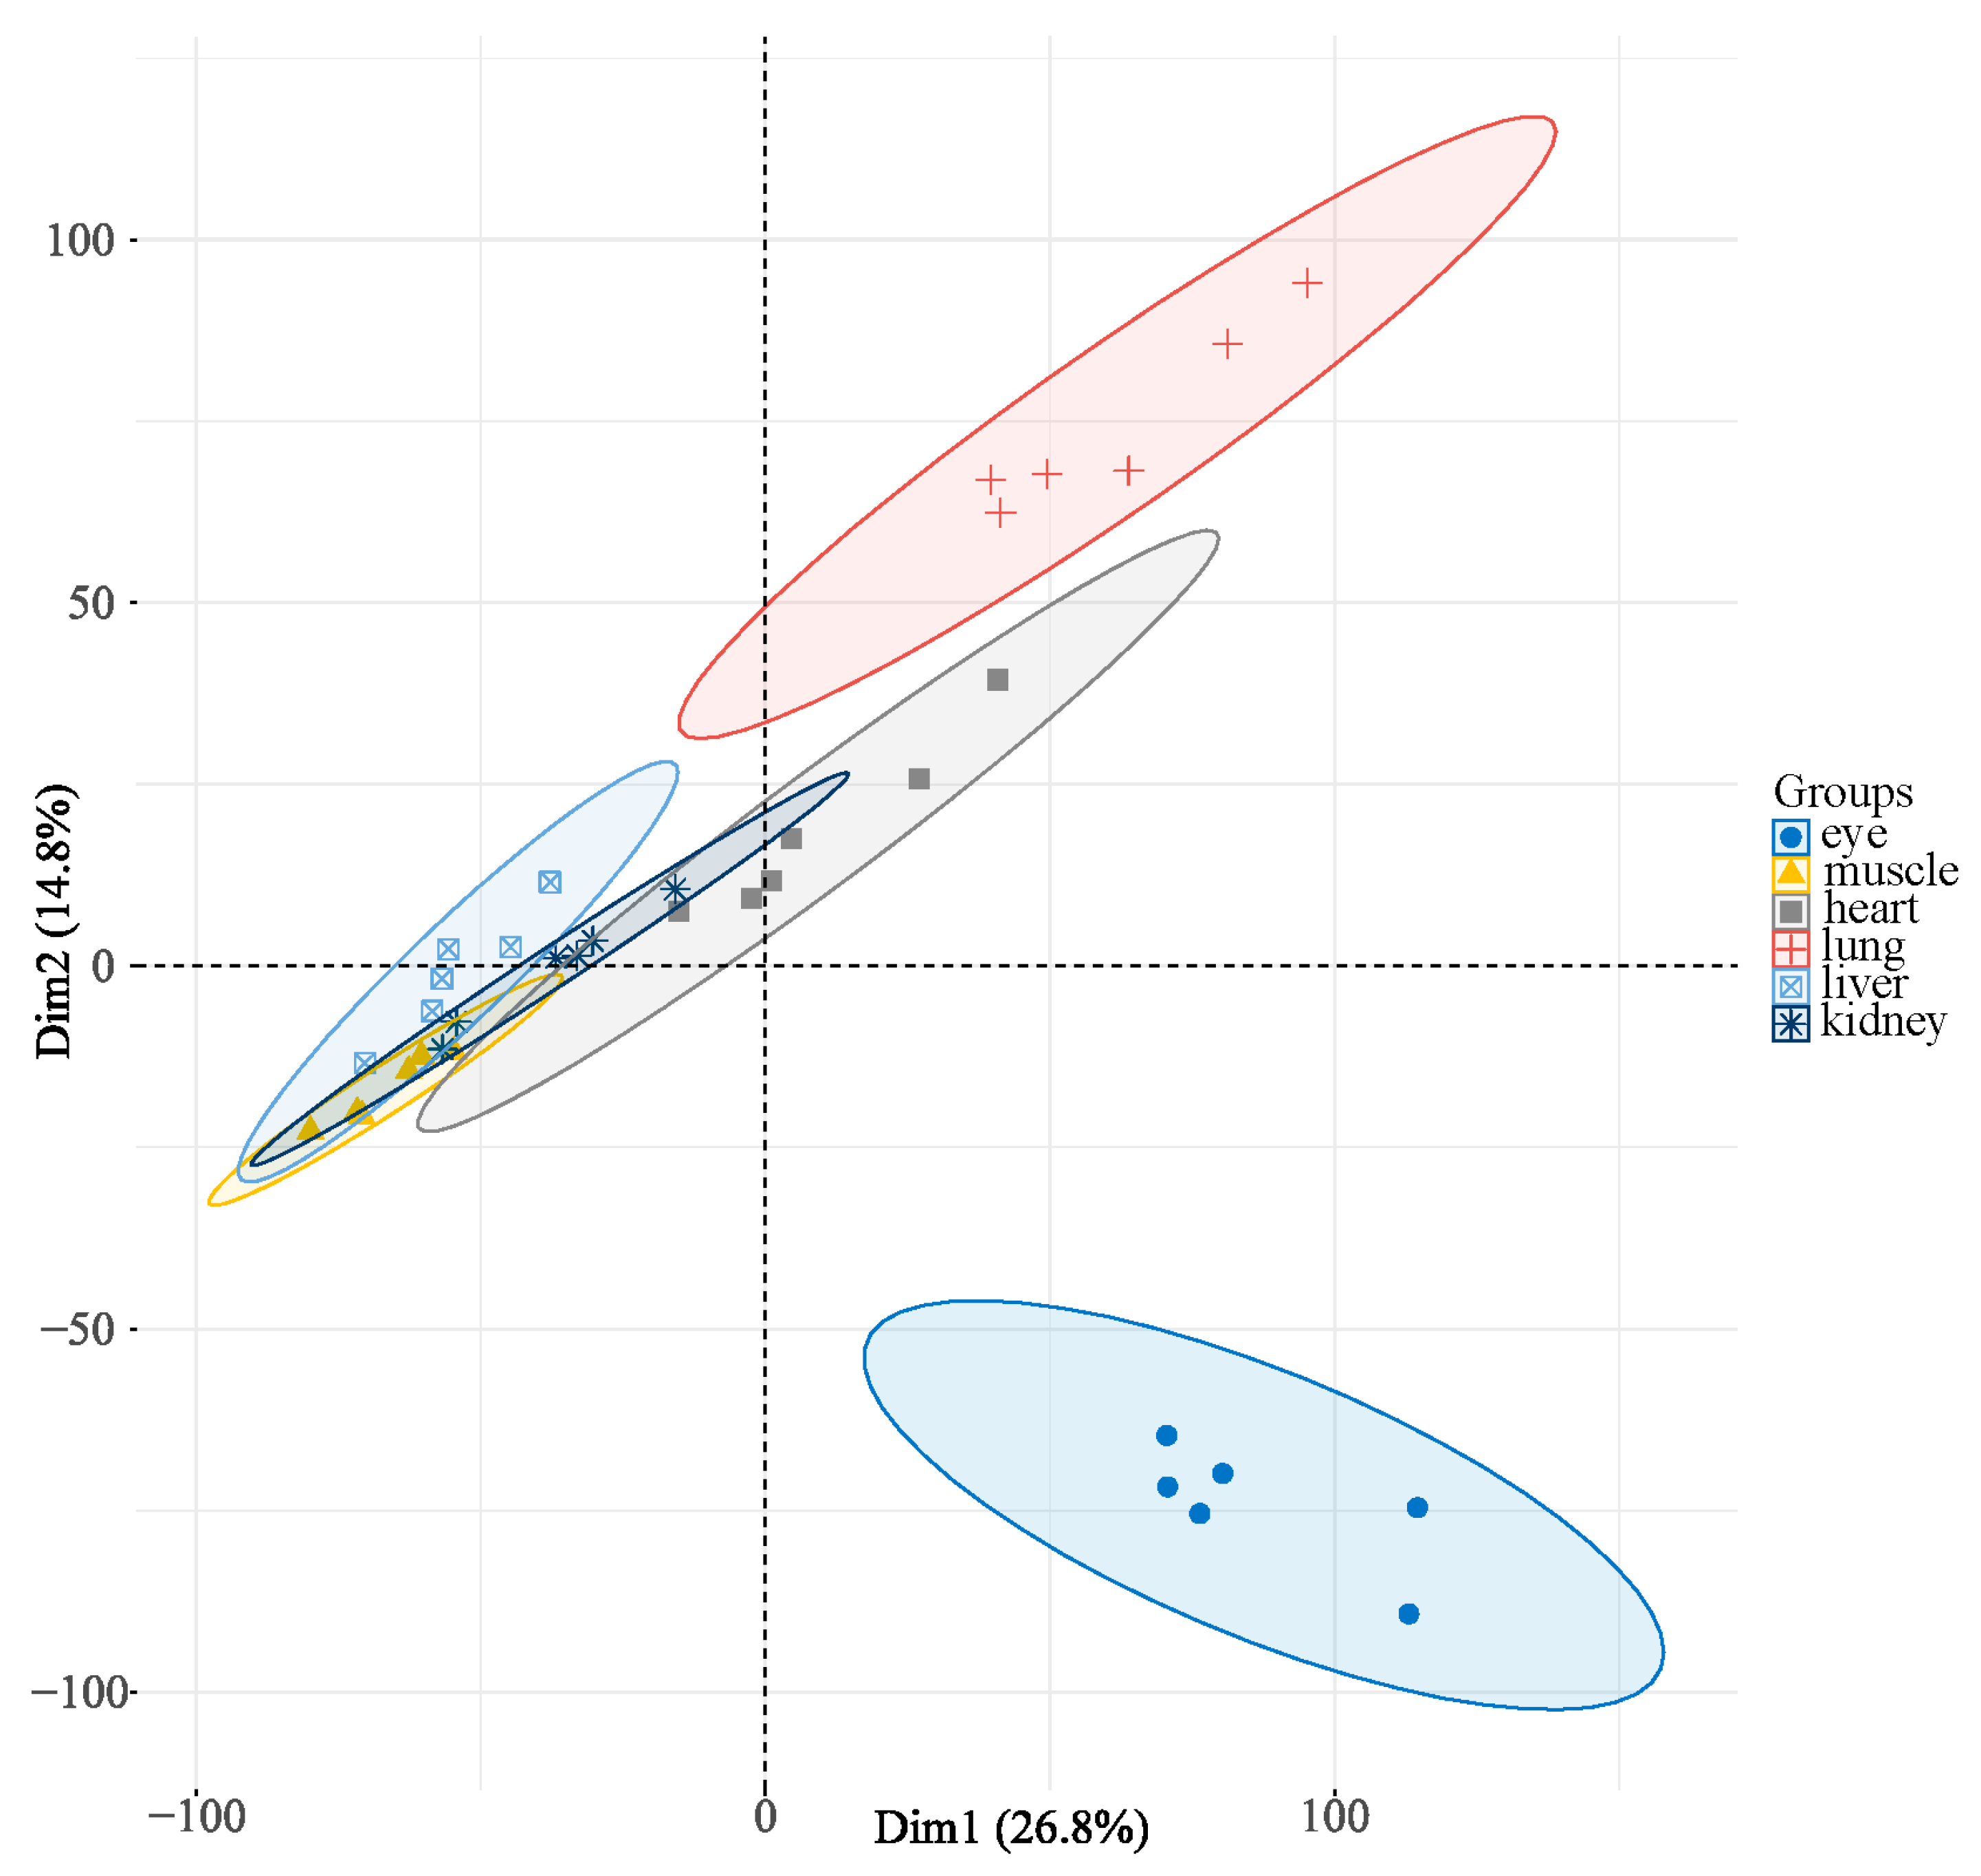
2.5. Orthologous Genes Identification and Principal Component Analysis (PCA)

Based on amino acid sequence of two species, we identified orthologous genes using BLASTP algorithm. Sequence alignments were conducted for transcripts between two species with parameter E-value of 1e-5; reciprocal best hits in each pair were obtained, and orthologous genes shared by both species were retained. Principal component analysis (PCA) was proceeded to check the cluster of tissues based on expression data of orthologous genes by using R package FactoMineR and factoextra.

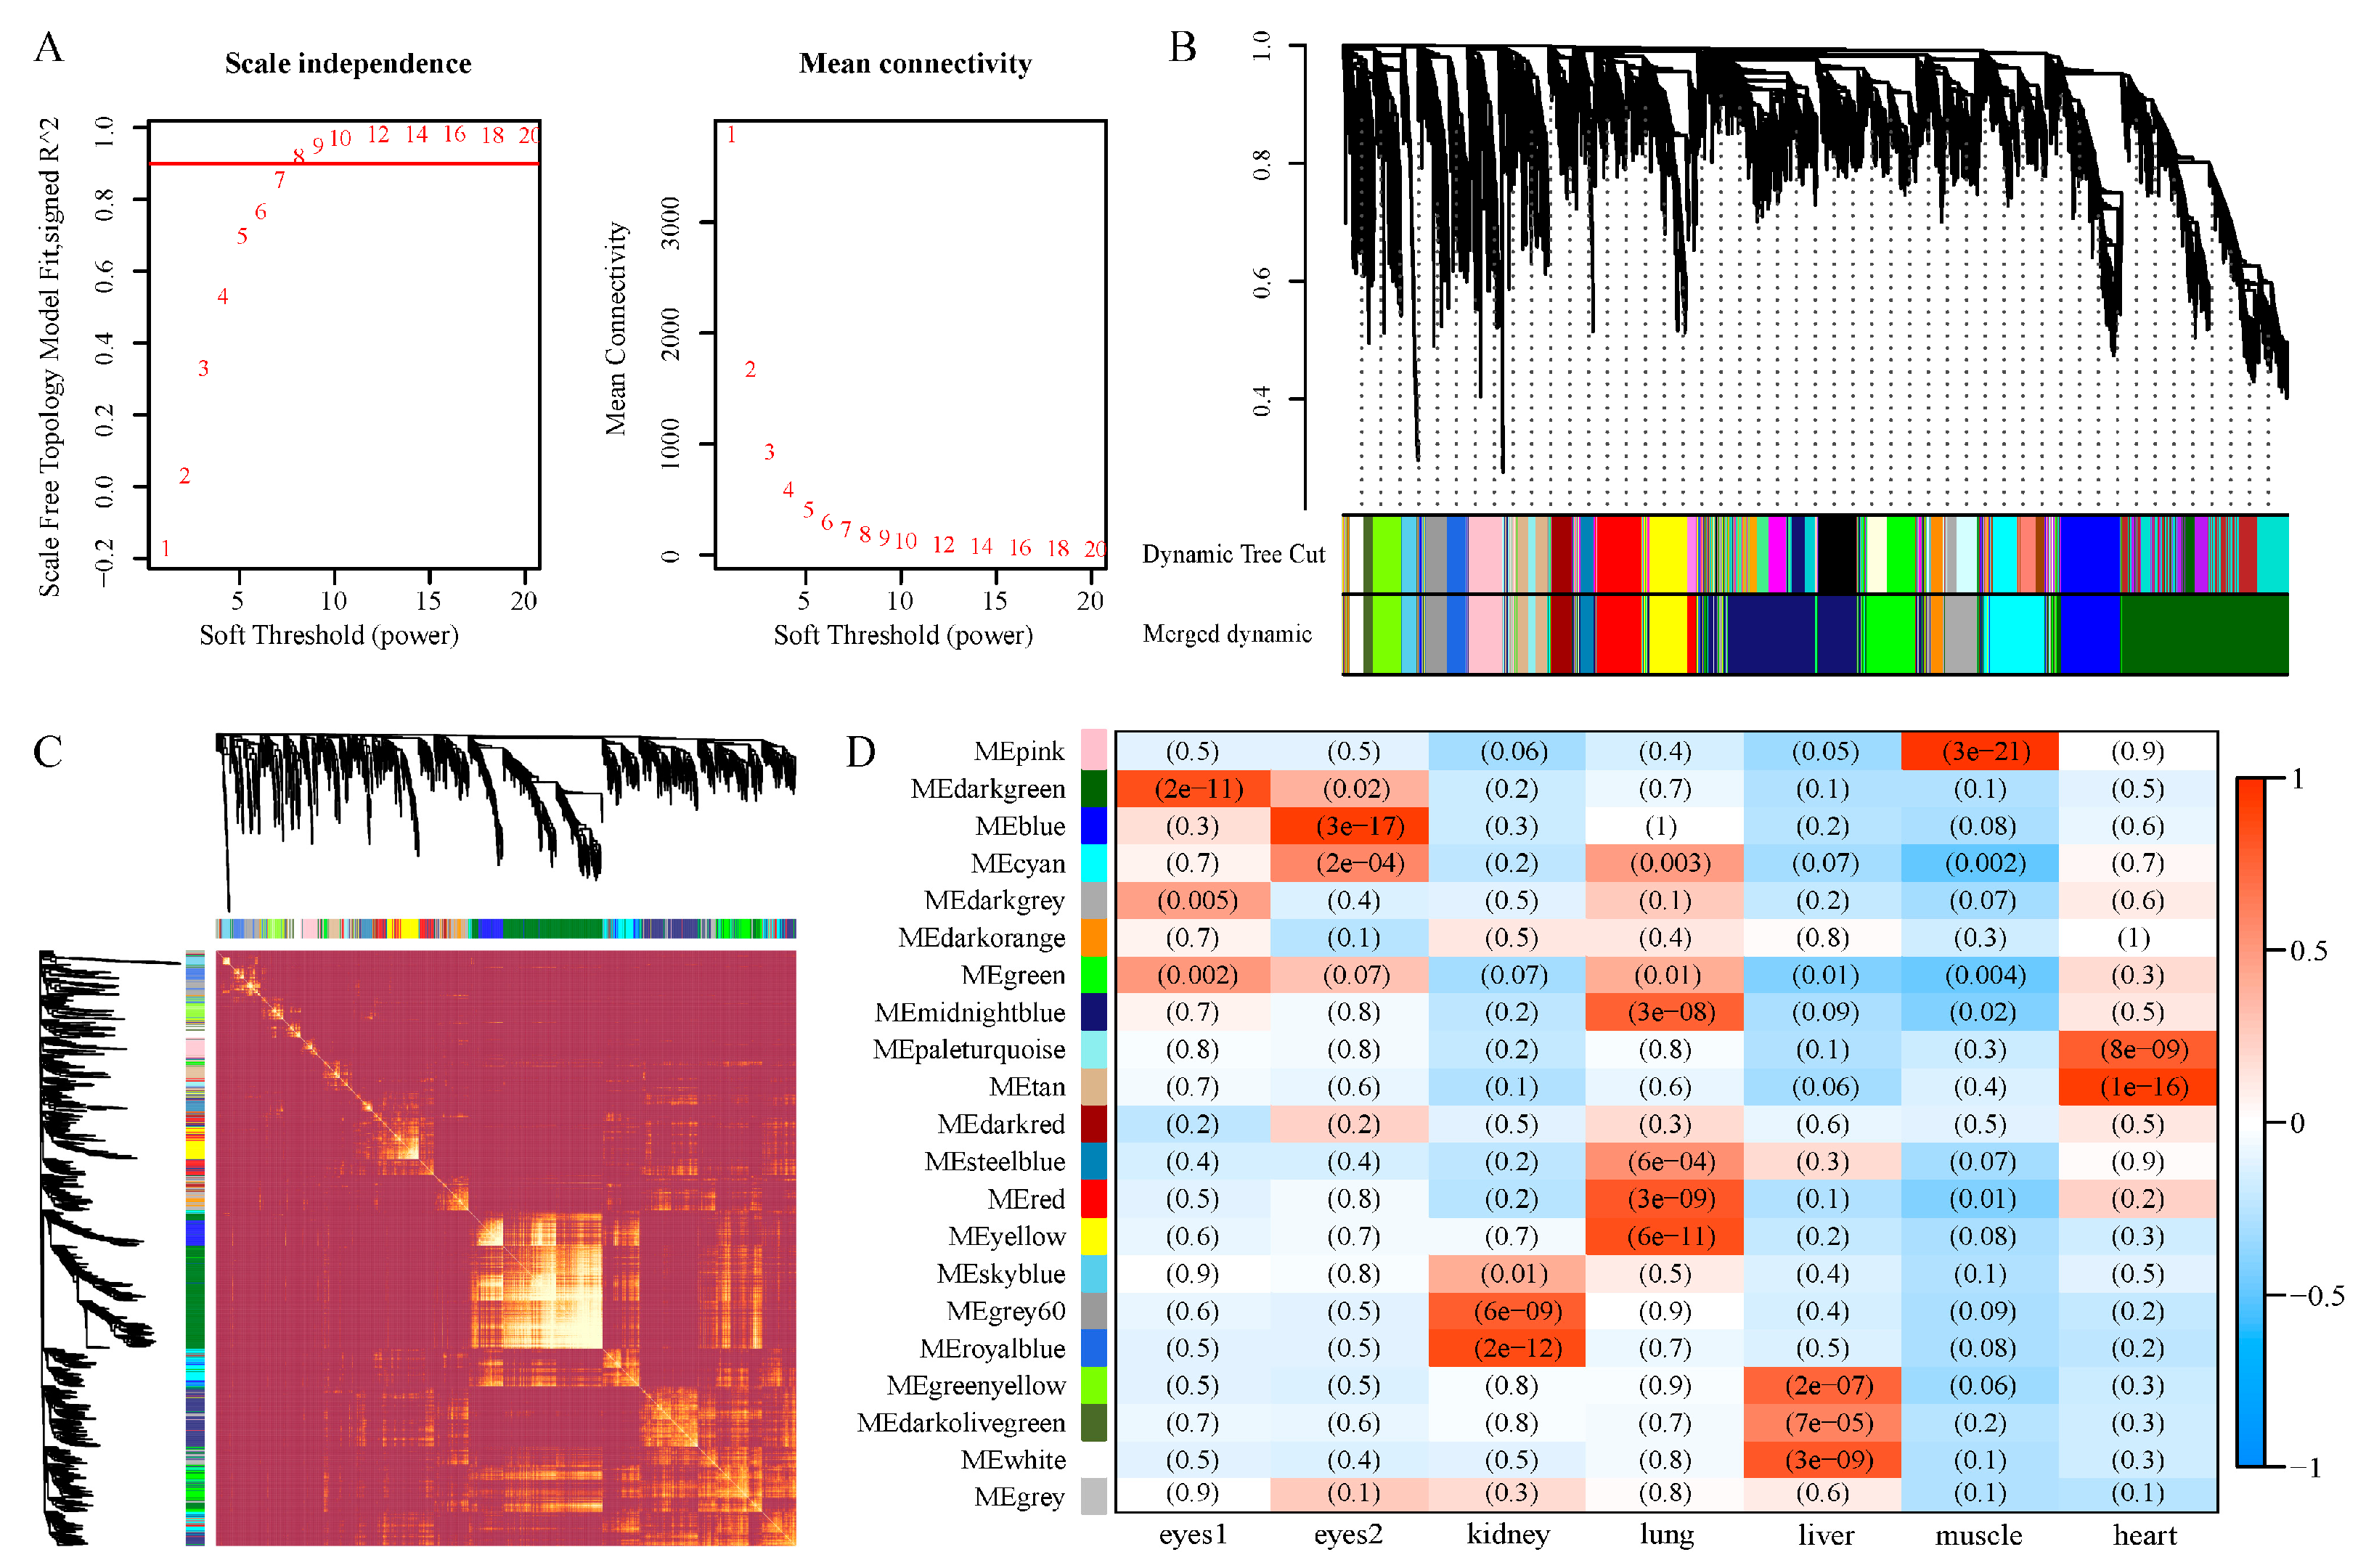
2.6. Weighted Gene Co-Expression Network Analysis (WGCNA) and Screening of Differential Expression Genes

The co-expression network of the orthologous genes was constructed using R package WGCNA v1.69 based on expression level (TPM). A network based on the approximate scale-free topology was constructed by selecting the most suitable soft threshold power of 10, which resulted in a scale-free R2 fit. A topological overlap dendrogram was used to define modules with a minimum module size of 100 genes, and the threshold cut height for merging modules was set to 0.2. Genes were clustered with similar expression patterns into a co-expression module with specific molecular mechanisms. The module eigengenes (ME) were subsequently calculated for each module. We treated the eyes of two snakes as different phenotypes, and identified the most relevant gene modules respectively. Pearson’s correlation coefficient was used to analyze the correlation between the module eigengene and eyes, and the modules with the highest correlations were selected as eye-correlated module. Gene significance (GS) and module membership (MM), which represented the correlation of gene expression profile with the ME, were identified. We compared the TPM results of key genes in correlation modules between two species to identify different expression genes (DEGs) by using R package limma v3.48.2. To reduce the false positive rate, only genes with adjusted p-value < 0.05 and |log2FC| ≥ 1 were recognized as DEGs.

2.7. Gene Functional Enrichment and Pathways Analysis

Gene ontology enrichment analysis of genes in eye-correlated modules was performed using R package clusterProfiler v3.14.3 [26]. We identified significantly enriched GO terms of genes in eye-correlated modules by using the GO annotations of all annotated unigenes as the background. The p-value was adjusted by Benjamini–Hochberg FDR, and terms with adjusted p-value of <0.05 were recognized as significant. REViGO [27] was then used to cluster the overrepresented GO terms, and construct the interactions of terms. KEGG pathway mapping analysis was utilized by using KEGG mapping tools (https://www.kegg.jp/kegg/mapper/, accessed on 12 October 2021). We searched genes annotated from KEGG by KOs against KEGG pathway maps and other network entities. Of all the results, we concentrated on KEGG pathways of interest and crucial genes in the pathway.

3. Results

3.1. Transcriptome De Novo Assembly

We collected three individuals of A. prasina (Figure 1A) and L. flavozonatum (Figure 1B), respectively. cDNA libraries were constructed for both species, with three replicates per group. In total, 307.77 Gb of raw data were obtained from 36 samples (six tissues per individual) using the Illumina sequencing platform (Table S2). After quality control, a total of 298.35 Gb of clean reads were generated for downstream analysis. Using Trinity tools, 218,220 transcripts and 90,635 unigenes with a contig N50 of 3345 were assembled for A. prasina, and 226,292 transcripts and 98,838 unigenes with a contig N50 of 2996 were assembled for L. flavozonatum (Table S3). Of all transcripts, 73,147 and 78,359 contained open reading frames (ORFs) that predicted peptides >100 amino acids (aa) in length, respectively, of which, 36,902 and 40,445 were full-length for predicting coding protein sequence. After removing redundancy and clustering, 26,540 and 29,877 longest sequences were obtained for orthologous gene analysis, respectively. Transcriptome assembly quality was evaluated using benchmarking universal single-copy orthologs (BUSCO) with protein mode and lineage data from vertebrates, which showed comparable completeness (65.6% and 68.3%) (Table S4).

3.2. Unigene Functional Annotation

Unigenes from A. prasina and L. flavozonatum were searched against the NR, SwissProt, Gene Ontology (GO), and Kyoto Encyclopedia of Genes and Genomes (KEGG) databases. In total, 17,978 unigenes (67.74% of 26,540) and 20,868 unigenes (69.85% of 29,877) were annotated to one or more functions for A. prasina (Figure 2A) and L. flavozonatum (Figure 2B), respectively. Subsequently, 15,616 and 17,932 unigenes were co-annotated in all databases for A. prasina and L. flavozonatum, respectively. Based on GO functional annotation, 15,734 and 18,082 unigenes were assigned to three categories: biological processes, molecular function, and cellular component. Results revealed that unigenes related to cellular process (GO: 0009987), biological regulation (GO: 0065007), metabolic process (GO: 0008152), and regulation of biological process (GO: 0050789) were highly represented in the biological processes category; unigenes related to binding (GO: 0005488) and catalytic activity (GO: 0003824) were highly represented in the molecular function category; and unigenes related to cell (GO: 0005623), cell part (GO: 0044464), and organelle (GO: 0043226) were highly represented in the cellular component category in both species (Figure 2C).

3.3. Gene Expression and Cluster Analysis

A total of 13,605 orthologous genes were identified by BLASTP. WGCNA and gene expression analysis were based on these orthologous genes. We first performed principal component analysis (PCA) to assess differences in expression between the eyes and other tissues. Results revealed that the 36 samples could be assigned to six groups, according to tissue types, and the first two PCs explained 41.6% of the variance (Figure 3). The same tissues from all six individuals clustered together, indicating that the transcriptome data could be used for further analysis. Furthermore, the eyes were well distinguished, suggesting differences in the expression patterns between eyes and other tissues.

3.4. Co-Expression Network Construction

Co-expression analysis is commonly used to clarify gene association patterns in samples or species [28]. Through WGCNA, connectivity among genes in the network showed scale-free network distribution when the correlation coefficient threshold was set to 0.9, the best soft-thresholding power was set to 10 (Figure 4A), and modules with high ME correlations (R > 0.8) were merged (Figure 4B). A total of 13,605 orthologous genes were divided into 21 co-expression modules, which were independent of each other (Figure 4C). The dark-green module contained the most genes, followed by the midnight blue module. Genes that could not be assigned to any module were placed in the gray module, which contained genes identified as not co-expressed.

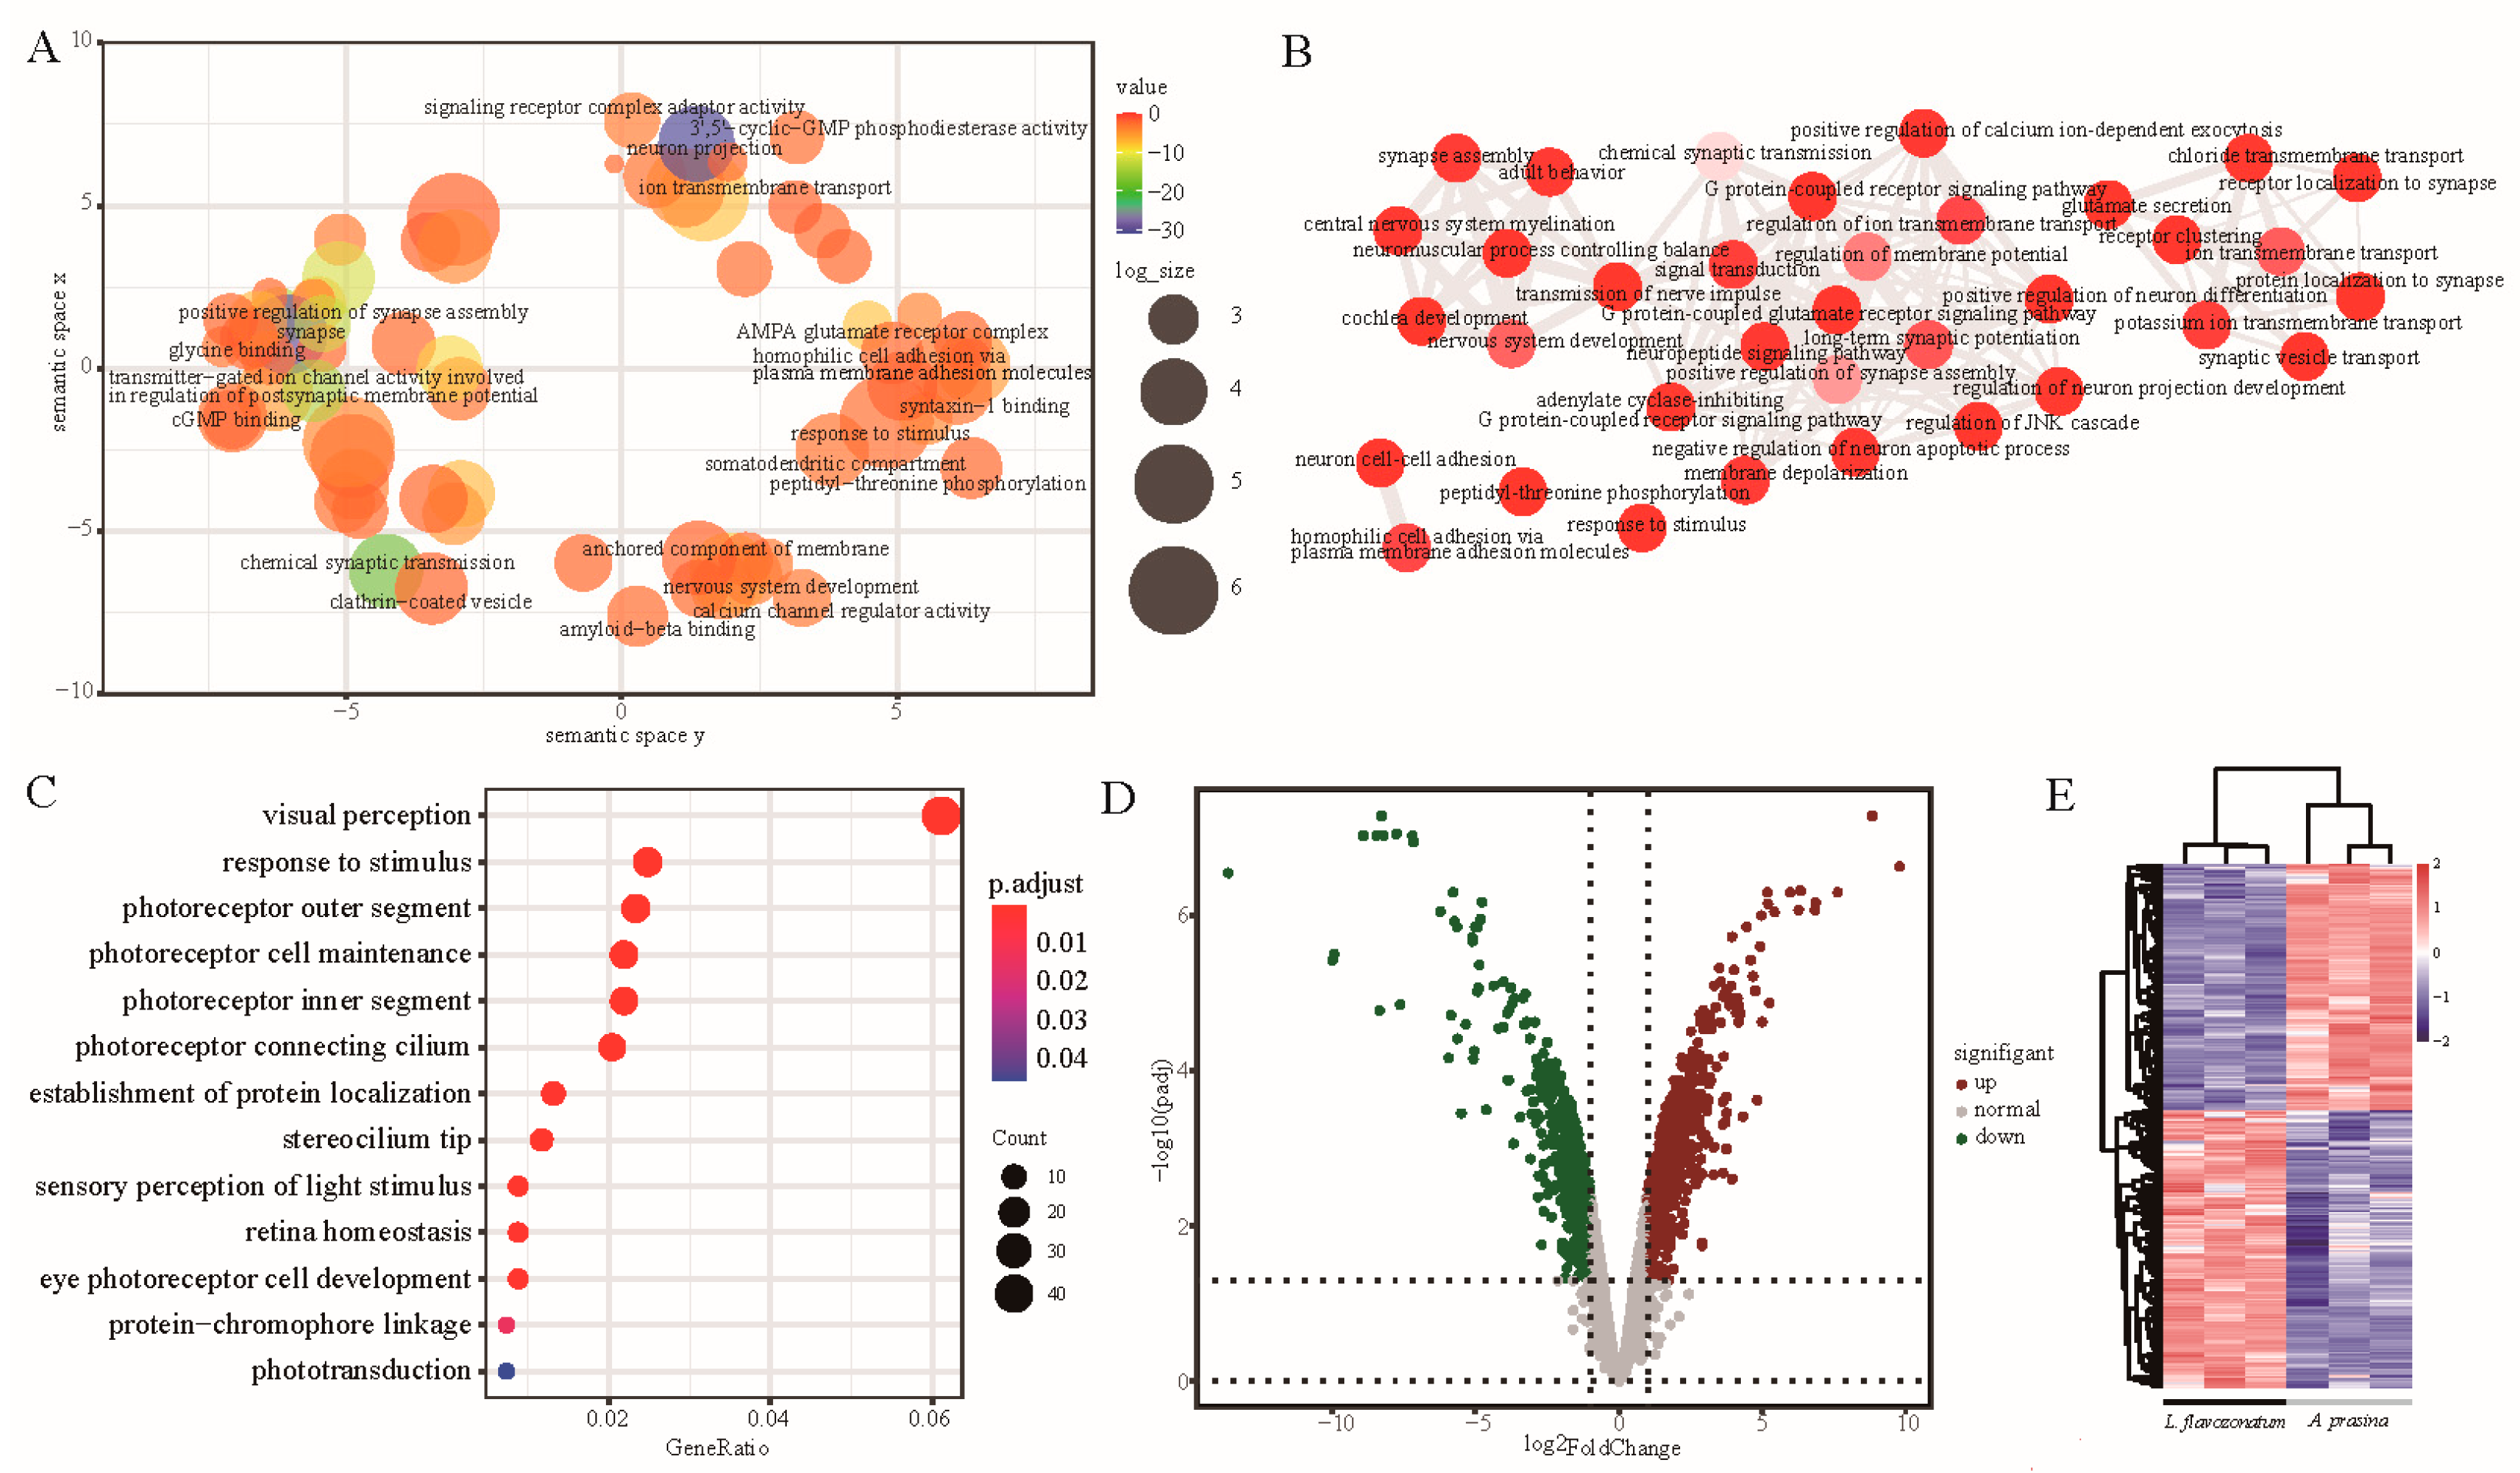
3.5. Identification and GO Enrichment of Significant Eye Correlation Modules

To identify the modules most relevant to phenotype, we performed correlation analysis between module and trait. Results showed that the dark-green (R = 0.86, p = 2e-11) and blue (R = 0.94, p = 3e-17) modules were the best correlated modules for the eyes of the two species, and included 2641 and 878 genes, respectively (Figure 4D). GO functional enrichment analysis of the key modules showed that genes in dark-green module were mainly enriched in biological processes related to response to stimulus (GO: 0050896), signal transduction (GO: 0007165), ion transmembrane transport (GO: 0034220), G protein-coupled receptor signaling pathway (GO: 0007186), and nervous system development (GO: 0007399), which were mainly related to signal transmission (Figure 5A,B, Table S5). The top GO terms enriched by genes in the blue module included visual perception (GO: 0007601), photoreceptor cell maintenance (GO: 0045494), and response to stimulus (GO: 0050896), suggesting that these genes were highly related to vision formation and light perception (Figure 5C, Table S6).

3.6. Expression Pattern and Screening of Genes in Phototransduction Pathway

Of the eye-related genes, 596 were up-regulated in the eyes of A. prasina and 673 were up-regulated in the eyes of L. flavozonatum (Figure 5D, Table S7), and gene expression showed opposite trends (Figure 5E). To explore the differences in gene expression patterns between the two species, we concentrated on genes in the key modules enriched in visual-related pathways. For KEGG pathway mapping analysis, 1799 and 528 genes in the key modules were assigned to the KEGG database, respectively. In addition, 354 and 330 pathways were mapped by all these genes, with phototransduction (map04744) found to be the most concerned, due to its key role in light perception (Figure 6). In the dark-green module, LWS was significant, with high GS and MM scores. Rhodopsin kinase GRK7 (GRK7), regulator of G-protein signaling 9 (RGS9), calmodulin-2 B (CALM2B), cyclic nucleotide-gated cation channel beta-3 (CNGB3), cyclic nucleotide-gated channel cone photoreceptor subunit alpha 3 (CNGA3), and cone cGMP-specific 3’, 5’-cyclic phosphodiesterase subunit alpha (PDE6C) were noticed particularly in the phototransduction pathway. Most of these genes are involved in signal transmission, especially in cone cells. In the blue module, SWS1, RH1, cyclic nucleotide gated channel alpha 1 (CNGA1), cyclic nucleotide gated channel beta 1 (CNGB1), guanylate cyclase activator 1 (GUCA1), and retinal guanylyl cyclase 2D/E (GUCY2E) were key genes involved in the phototransduction pathway. They mostly play a part in rod cells.

4. Discussion

Different diurnal and nocturnal habits can lead to differences in the adaptive evolution of visual systems. For instance, activity patterns can be well discriminated based on morphometric analysis and signatures of selection [15,16,29]. However, studies on differences in gene expression remain limited. In the current study, we explored the expression patterns of vision-related genes based on transcriptome data of multiple tissues from two snakes with diverse circadian activity. De novo assembly of the transcriptome uncovered 13,605 orthologous genes between the two snake species, providing important support for snake vision research.
Based on PCA, we showed that gene expression patterns in the eyes differed from those in other tissues in both species, which proves the high specificity of gene expression and functional specialization of eyes. Furthermore, WGCNA showed that 2641 genes in the diurnal vision-related module were involved in nervous system development, ion transmembrane transport, and the G protein-coupled receptor signaling pathway, indicating dominance of light signal transmission. Diurnal snakes generally contain a higher density of ganglion cells, which contact directly onto cones with synaptic for responding rapidly [6,30]. In retinal photoreceptor cells, when the status of ion channels varies due to photon absorption, the concentration of ions in the outer segment changes quickly, and transforms the polarization state of the photoreceptors, resulting in visual regulation [31]. Ion transport can affect the synthesis and degradation of cGMP [32] and modulate the sensitivity of visual pigment itself [33]. Based on our analysis of L. flavozonatum eyes, we identified 878 correlated genes in the blue module, most of which were related to visual perception, photoreceptors, and phototransduction. In nocturnal vertebrates, rod cells serve as dim-light photoreceptors, and are normally related to night vision [6,34]. Due to night-based activities and predation, nocturnal snakes always have a higher density of rod photoreceptors to increase sensitivity for light perception [35]. The significant expression of genes enriched in visual signal transmission in A. prasina eyes increases its adaptability to daylight conditions and rapid reactions, whereas the significant expression of photosensory-related genes in L. flavozonatum eyes increases its sensitivity to light in dark environments. Thus, the main functions of the genes expressed in the eye were specific to the circadian activities of the two snakes.
During phototransduction cascade, opsins in retinal photoreceptor cells perform crucial functions in light perception [36,37]. Previous research has demonstrated that the density of cones in the retina of diurnal animals is significantly higher, while the number of rods in the retina of nocturnal animals is markedly higher [38]. Moreover, gene loss and signatures of selection of opsins were discovered in owls, which possess large and rod-dominant retinas as a kind of special night-time raptor [39]; in snakes, visual opsin genes were detected containing signals of positive selection in sites of functional importance that are associated with shifts in ecology and retinal anatomy [29]. Thus, changes in opsin genes may affect circadian activities. Here, we concentrated on the expression of three opsin genes (i.e., RH1, SWS1, and LWS) in two snake species. Although all three photopigment genes (RH1, LWS, and SWS1) were expressed in the eyes of both snakes, only LWS was highly expressed in A. prasina, and only SWS1 and RH1 were highly expressed in L. flavozonatum. Research shows that some diurnal snakes cut out shorter wavelength (including UVA), whereas UV vision is predicted to be widely present in most nocturnal snakes [16]. Of note, removal of UV light has been linked to increased visual acuity [40], and it is supported by morphological research on Ahaetulla species, which are highly visual hunters with the least transparent lenses, horizontal pupils, binocular vision, and a fovea in eyes that are indicative of high visual acuity [41]. Photoreceptors can display evolutionarily transitions between cell types in squamates [42], as supported by the expression of cone-like rod photoreceptors in the all-cone retina of garter snake, which restore spectral sensitivity and chromatic discrimination [43]. As such, transmuted rod photoreceptors may exist in the retinas of A. prasina. The expression difference in our analysis acts as a reminder that, as nocturnal snake, rod photoreceptor genes highly express in eyes of L. flavozonatum for adapting dim-light condition, and shows sensitivity to short-wavelength light, versus eyes of A. prasina is more sensitive to long-wavelength light with a preponderance of cones photoreceptor, probably due to filtering shorter wavelength, which shows consistency with previous circadian activity studies.
Visual phototransduction represents one of the best-characterized signaling pathways in vertebrate vision [44]. In Shaw’s sea snake (Hydrophis curtus), phototransduction-related genes are reported to be under positive selection to improve visual sensitivity [45]. The expression level of phototransduction proteins in visual cells also accounts for visual adaption to light [6]. Our WGCNA results demonstrated specific expression of phototransduction-related genes in the eyes of both snakes. We identified six genes (GRK7, CNGB3, CNGA3, PDE6C, RGS9, and CALM2B) involved in the phototransduction pathway in A. prasina, four of which were cone-specific, thus showing the dominant role of cones in the eyes of A. prasina. GRK7 encodes a member of the G protein-coupled receptor kinase subfamily, which is involved in shutting down the light response and adapting to changing light conditions through opsin phosphorylation [46]. CNGB3 encodes the beta subunit of a cyclic nucleotide-gated ion channel, which plays a role in modulation of channel function in cone photoreceptors and is essential for the generation of light-evoked electrical responses in the red-, green-, and blue-sensitive cones [47]. CNGA3 plays a role in cation channel opening and causes depolarization of cone photoreceptors after activation by cGMP [48]. As a cone-specific cGMP phosphodiesterase, PDE6C participates in light detection and cone phototransduction by rapidly reducing the intracellular levels of cGMP [49]. RGS9 and CALM2B play crucial roles in signal transduction [50] and regulation of calcium ion concentrations [51] in photoreceptor light adaptation, respectively.
Of note, differences in the expression of cone-specific genes may indicate changes in cone cells, and high cone cell density may indicate increased color discrimination [52], similar to the double cones found in A. prasina with skin color polymorphism [16,53]. Since skin color can be used in mate-choice and other intraspecific signals, or may be involved in predator avoidance (e.g., aposematism and mimicry), color vision is very important [54]. However, further research is required to elucidate this ability in A. prasina.
In the correlation module of the L. flavozonatum eyes, several important genes related to rods were mapped to the same pathway, including CNGA1, CNGB1, GUCA1, and GUCY2E. CNGA1 encodes a subunit of the rod cyclic GMP-gated cation channel to depolarize rod photoreceptors in the last step of the phototransduction pathway [55]. Analogously, CNGB1 is involved in the regulation of ion flow in rod photoreceptor outer segments in response to light-induced changes in the levels of intracellular cGMP associated with CNGA1 [56]. GUCA1 and GUCY2E play essential roles in regulating retinal guanylyl cyclase-1 (GC1) [57] and mediating cGMP replenishment during phototransduction [58], respectively. Thus, these genes suggest the vital role of rods in L. flavozonatum of light perception.
In summary, we used WGCNA to identify key co-expression modules and functional pathways related to the vision of two snakes with different circadian activities. We also revealed the different expression patterns in phototransduction in the two species. Although our research is preliminary and needs further verification, these findings provide new insights into the genetic adaptations of vision related to circadian activity.

Supplementary Materials

The following are available online at https://www.mdpi.com/article/10.3390/d13120621/s1, Table S1: Summary of transcriptome de novo assembly tests of two snakes, Table S2: Summary of samples and RNA sequencing, Table S3: Summary of transcriptome assembly of two snakes, Table S4: BUSCO scores of transcriptome assembly of two snakes, Table S5: Significant GO terms enriched by genes in dark-green module, Table S6: Significant GO terms enriched by genes in blue module, Table S7: Differential expression of genes in two modules correlated to eyes.

Author Contributions

J.-T.L. and K.Y. conceived the study; C.-Y.T. and Z.-L.P. collected experimental samples; C.-Y.T. and C.P. performed data analyses; J.-T.L. and C.-Y.T. prepared the initial manuscript draft; M.-H.S. and W.W. worked on the approval of the manuscript. All authors have read and agreed to the published version of the manuscript.

Funding

This work was supported by the National Natural Science Foundation of China (32000296); the International Partnership Program of Chinese Academy of Sciences (151751KYSB20190024); Key Research Program of Frontier Sciences, CAS (QYZDB-SSW-SMC058); the Sichuan Science and Technology Program (2021JDJQ0002); and the CAS “Light of West China” Program (2018XBZG_JCTD_001).

Institutional Review Board Statement

Not applicable.

Informed Consent Statement

Not applicable.

Data Availability Statement

The RNA-seq data generated in this study are available in the China National GeneBank DataBase (CNGBdb), under accession number CNP0002398.

Acknowledgments

We would like to thank Di-Hao Wu and Dan Wang for snake samples; and Jin-Long Ren for photos and insightful suggestions.

Conflicts of Interest

The authors declare no conflict of interest.

References

  1. Katti, C.; Stacey-Solis, M.; Coronel-Rojas, N.A.; Davies, W.I.L. Opsin-based photopigments expressed in the retina of a South American pit viper, Bothrops atrox (Viperidae). Vis. Neurosci. 2018, 35, E027. [Google Scholar] [CrossRef]
  2. Strader, C.D.; Fong, T.M.; Tota, M.R.; Underwood, D. Structure and Function of G Protein-Coupled Receptors. Annu. Rev. Biochem. 1994, 63, 101–132. [Google Scholar] [CrossRef]
  3. Kefalov, V.J. Rod and cone visual pigments and phototransduction through pharmacological, genetic, and physiological approaches. J. Biol. Chem. 2012, 287, 1635–1641. [Google Scholar] [CrossRef] [Green Version]
  4. Sakmar, T.P.; Fahmy, K. Properties and Photoactivity of Rhodopsin Mutants. Isr. J. Chem. 1995, 35, 325–337. [Google Scholar] [CrossRef]
  5. Yokoyama, S. Molecular evolution of vertebrate visual pigments. Prog. Retin. Eye Res. 2000, 19, 385–419. [Google Scholar] [CrossRef]
  6. Lamb, T.D. Evolution of phototransduction, vertebrate photoreceptors and retina. Prog. Retin. Eye Res. 2013, 36, 52–119. [Google Scholar] [CrossRef] [Green Version]
  7. Rojasa, L.M.; McNeila, R.; Cabanaa, T.; Lachapelleb, P. Behavioral, Morphological and Physiological Correlates of Diurnal and Nocturnal Vision in Selected Wading Bird Species. Brain Behav. Evol. 1999, 53, 227–242. [Google Scholar] [CrossRef] [PubMed]
  8. Yokoyama, S.; Blow, N.S. Molecular evolution of the cone visual pigments in the pure rod-retina of the nocturnal gecko, Gekko gekko. Gene 2001, 276, 117–125. [Google Scholar] [CrossRef]
  9. Crescitelli, F. The Visual Cells and Visual Pigments of the Vertebrate Eye; Springer: Berlin, Germany, 1972; Volume VII/1, pp. 245–363. [Google Scholar]
  10. Jiang, D.; Klaus, S.; Zhang, Y.P.; Hillis, D.M.; Li, J.T. Asymmetric biotic interchange across the Bering land bridge between Eurasia and North America. Natl. Sci. Rev. 2019, 6, 739–745. [Google Scholar] [CrossRef] [PubMed]
  11. Hu, Y.; Fan, H.; Chen, Y.; Chang, J.; Zhan, X.; Wu, H.; Zhang, B.; Wang, M.; Zhang, W.; Yang, L.; et al. Spatial patterns and conservation of genetic and phylogenetic diversity of wildlife in China. Sci. Adv. 2021, 7, eabd5725. [Google Scholar] [CrossRef]
  12. Torello-Viera, N.F.; Marques, O.A.V. Daily Activity of Neotropical Dipsadid Snakes. South Am. J. Herpetol. 2017, 12, 128–135. [Google Scholar] [CrossRef]
  13. Mullin, S.J.; Cooper, R.J. The Foraging Ecology of the Gray Rat Snake (Elaphe obsoleta spiloides)—Visual Stimuli Facilitate Location of Arboreal Prey. Am. Midl. Nat. 1998, 140, 397–401. [Google Scholar] [CrossRef]
  14. Hauzman, E. Adaptations and evolutionary trajectories of the snake rod and cone photoreceptors. Semin. Cell Dev. Biol. 2020, 106, 86–93. [Google Scholar] [CrossRef]
  15. Schmitz, L.; Motani, R. Morphological differences between the eyeballs of nocturnal and diurnal amniotes revisited from optical perspectives of visual environments. Vis. Res. 2010, 50, 936–946. [Google Scholar] [CrossRef] [Green Version]
  16. Simoes, B.F.; Sampaio, F.L.; Douglas, R.H.; Kodandaramaiah, U.; Casewell, N.R.; Harrison, R.A.; Hart, N.S.; Partridge, J.C.; Hunt, D.M.; Gower, D.J. Visual Pigments, Ocular Filters and the Evolution of Snake Vision. Mol. Biol. Evol. 2016, 33, 2483–2495. [Google Scholar] [CrossRef] [Green Version]
  17. Cronin, T.W. Sensory Ecology: In Sea Snake Vision, One Plus One Makes Three. Curr. Biol. 2020, 30, R763–R766. [Google Scholar] [CrossRef]
  18. Simoes, B.F.; Sampaio, F.L.; Jared, C.; Antoniazzi, M.M.; Loew, E.R.; Bowmaker, J.K.; Rodriguez, A.; Hart, N.S.; Hunt, D.M.; Partridge, J.C.; et al. Visual system evolution and the nature of the ancestral snake. J. Evol. Biol. 2015, 28, 1309–1320. [Google Scholar] [CrossRef]
  19. Davies, W.L.; Cowing, J.A.; Bowmaker, J.K.; Carvalho, L.S.; Gower, D.J.; Hunt, D.M. Shedding light on serpent sight: The visual pigments of henophidian snakes. J. Neurosci. 2009, 29, 7519–7525. [Google Scholar] [CrossRef]
  20. Bhattacharyya, N.; Darren, B.; Schott, R.K.; Tropepe, V.; Chang, B.S.W. Cone-like rhodopsin expressed in the all-cone retina of the colubrid pine snake as a potential adaptation to diurnality. J. Exp. Biol. 2017, 220, 2418–2425. [Google Scholar] [CrossRef] [PubMed] [Green Version]
  21. Simoes, B.F.; Sampaio, F.L.; Loew, E.R.; Sanders, K.L.; Fisher, R.N.; Hart, N.S.; Hunt, D.M.; Partridge, J.C.; Gower, D.J. Multiple rod-cone and cone-rod photoreceptor transmutations in snakes: Evidence from visual opsin gene expression. Proc. Biol. Sci. 2016, 283, 20152624. [Google Scholar] [CrossRef] [Green Version]
  22. Amber, E.D.; Strine, C.T.; Suwanwaree, P.; Waengsothorn, S. Intra-Population Color Dimorphism of Ahaetulla prasina (Serpentes: Colubridae) in Northeastern Thailand. Curr. Herpetol. 2017, 36, 98–104. [Google Scholar] [CrossRef]
  23. Zhao, E. Snakes of China; Anhui Science Technology Publishing House: Hefei, China, 2006; p. 372. [Google Scholar]
  24. Bardou, P.; Mariette, J.; Escudié, F.; Djemiel, C.; Klopp, C. jvenn: An interactive Venn diagram viewer. BMC Bioinform. 2014, 15, 293. [Google Scholar] [CrossRef] [Green Version]
  25. Ye, J.; Zhang, Y.; Cui, H.; Liu, J.; Wu, Y.; Cheng, Y.; Xu, H.; Huang, X.; Li, S.; Zhou, A.; et al. WEGO 2.0: A web tool for analyzing and plotting GO annotations, 2018 update. Nucleic Acids Res. 2018, 46, W71–W75. [Google Scholar] [CrossRef] [PubMed]
  26. Yu, G.; Wang, L.G.; Han, Y.; He, Q.Y. clusterProfiler: An R package for comparing biological themes among gene clusters. OMICS 2012, 16, 284–287. [Google Scholar] [CrossRef]
  27. Supek, F.; Bosnjak, M.; Skunca, N.; Smuc, T. REVIGO summarizes and visualizes long lists of gene ontology terms. PLoS ONE 2011, 6, e21800. [Google Scholar] [CrossRef] [Green Version]
  28. Langfelder, P.; Horvath, S. WGCNA: An R package for weighted correlation network analysis. BMC Bioinform. 2008, 9, 559. [Google Scholar] [CrossRef] [PubMed] [Green Version]
  29. Hauzman, E.; Bonci, D.M.O.; Suarez-Villota, E.Y.; Neitz, M.; Ventura, D.F. Daily activity patterns influence retinal morphology, signatures of selection, and spectral tuning of opsin genes in colubrid snakes. BMC Evol. Biol. 2017, 17, 249. [Google Scholar] [CrossRef] [Green Version]
  30. Hauzman, E.; Bonci, D.M.O.; Ventura, D.F. Visual ecology of snakes: Comparative study of the density and distribution of retinal neurons in diurnal and nocturnal species. Investig. Ophthalmol. Vis. Sci. 2016, 57, 4667. [Google Scholar]
  31. Krizaj, D.; Copenhagen, D.R. Calcium regulation in photoreceptors. Front. Biosci. 2002, 7, d2023–d2044. [Google Scholar] [CrossRef] [PubMed] [Green Version]
  32. Koch, K.-W.; Stryer, L. Highly cooperative feedback control of retinal rod guanylate cyclase by calcium ions. Nature 1988, 334, 64–66. [Google Scholar] [CrossRef] [PubMed]
  33. Dizhoor, A.M.; Ray, S.; Kumar, S.; Niemi, G.; Spencer, M.; Brolley, D.; Walsh, K.A.; Philipov, P.P.; Hurley, J.B.; Stryer, L. Recoverin: A Calcium Sensitive Activator of Retinal Rod Guanylate Cyclase. Science 1991, 251, 915–918. [Google Scholar] [CrossRef] [PubMed]
  34. Ridge, K.D.; Palczewski, K. Visual rhodopsin sees the light: Structure and mechanism of G protein signaling. J. Biol. Chem. 2007, 282, 9297–9301. [Google Scholar] [CrossRef] [Green Version]
  35. Baylor, D.A.; Lamb, T.D.; Yau, K.W. Responses of retinal rods to single photons. J. Physiol. 1979, 288, 613–634. [Google Scholar] [CrossRef] [PubMed]
  36. Fain, G.L.; Hardie, R.; Laughlin, S.B. Phototransduction and the evolution of photoreceptors. Curr. Biol. 2010, 20, R114–R124. [Google Scholar] [CrossRef] [Green Version]
  37. Bowmaker, J.K. Evolution of vertebrate visual pigments. Vision Res. 2008, 48, 2022–2041. [Google Scholar] [CrossRef] [PubMed] [Green Version]
  38. Wikler, K.C.; Rakic, P. Distribution of photoreceptor subtypes in the retina of diurnal and nocturnal primates. J. Neurosci. 1990, 10, 3390–3401. [Google Scholar] [CrossRef] [PubMed]
  39. Wu, Y.; Hadly, E.A.; Teng, W.; Hao, Y.; Liang, W.; Liu, Y.; Wang, H. Retinal transcriptome sequencing sheds light on the adaptation to nocturnal and diurnal lifestyles in raptors. Sci. Rep. 2016, 6, 33578. [Google Scholar] [CrossRef] [Green Version]
  40. Douglas, R.H.; Jeffery, G. The spectral transmission of ocular media suggests ultraviolet sensitivity is widespread among mammals. Proc. R. Soc. B Biol. Sci. 2014, 281, 20132995. [Google Scholar] [CrossRef] [Green Version]
  41. Rasmussen, J.B. The retina of Psammodynastes pulverulentus (Boie, 1827) and Telescopus fallax (Fleischmann, 1831) with a discussion of their phylogenetic significance (Colubroidea, Serpentes). J. Zool. Syst. Evol. 1990, 28, 269–276. [Google Scholar] [CrossRef]
  42. Walls, G. The Vertebrate Eye and Its Adaptive Radiation; Fafner Publishing Company: New York, NY, USA, 1942. [Google Scholar]
  43. Schott, R.K.; Muller, J.; Yang, C.G.; Bhattacharyya, N.; Chan, N.; Xu, M.; Morrow, J.M.; Ghenu, A.H.; Loew, E.R.; Tropepe, V.; et al. Evolutionary transformation of rod photoreceptors in the all-cone retina of a diurnal garter snake. Proc. Natl. Acad. Sci. USA 2016, 113, 356–361. [Google Scholar] [CrossRef] [Green Version]
  44. Ridge, K.D.; Abdulaev, N.G.; Sousa, M.; Palczewski, K. Phototransduction: Crystal clear. Trends Biochem. Sci. 2003, 28, 479–487. [Google Scholar] [CrossRef]
  45. Peng, C.; Ren, J.L.; Deng, C.; Jiang, D.; Wang, J.; Qu, J.; Chang, J.; Yan, C.; Jiang, K.; Murphy, R.W.; et al. The Genome of Shaw’s Sea Snake (Hydrophis curtus) Reveals Secondary Adaptation to Its Marine Environment. Mol. Biol. Evol. 2020, 37, 1744–1760. [Google Scholar] [CrossRef]
  46. Osawa, S.; Weiss, E.R. A tale of two kinases in rods and cones. Adv. Exp. Med. Biol. 2012, 723, 821–827. [Google Scholar] [CrossRef] [PubMed] [Green Version]
  47. Kohl, S.; Baumann, B.; Broghammer, M.; Jägle, H.; Sieving, P.; Kellner, U.; Spegal, R.; Anastasi, M.; Zrenner, E.; Sharpe, L.T.; et al. Mutations in the CNGB3 gene encoding the β-subunit of the cone photoreceptor cGMP-gated channel are responsible for achromatopsia (ACHM3) linked to chromosome 8q21. Hum. Mol. Genet. 2000, 9, 2107–2116. [Google Scholar] [CrossRef]
  48. Gerstner, A.; Zong, X.; Hofmann, F.; Biel, M. Molecular Cloning and Functional Characterization of a New Modulatory Cyclic Nucleotide-Gated Channel Subunit from Mouse Retina. J. Neurosci. 2000, 20, 1324–1332. [Google Scholar] [CrossRef]
  49. Grau, T.; Artemyev, N.O.; Rosenberg, T.; Dollfus, H.; Haugen, O.H.; Cumhur Sener, E.; Jurklies, B.; Andreasson, S.; Kernstock, C.; Larsen, M.; et al. Decreased catalytic activity and altered activation properties of PDE6C mutants associated with autosomal recessive achromatopsia. Hum. Mol. Genet. 2011, 20, 719–730. [Google Scholar] [CrossRef] [PubMed] [Green Version]
  50. Nishiguchi, K.M.; Sandberg, M.A.; Kooijman, A.C.; Martemyanov, K.A.; Pott, J.W.R.; Hagstrom, S.A.; Arshavsky, V.Y.; Berson, E.L.; Dryja, T.P. Defects in RGS9 or its anchor protein R9AP in patients with slow photoreceptor deactivation. Nature 2004, 427, 75–78. [Google Scholar] [CrossRef] [PubMed]
  51. Hsu, Y.-T.; Molday, R.S. Modulation of the cGMP-gated channel of rod photoreceptor cells by calmodulin. Nature 1993, 361, 76–79. [Google Scholar] [CrossRef]
  52. Burns, M.E.; Lamb, T.D. Visual Transduction by Rod and Cone Photoreceptors; MIT Press: Cambridge, MA, USA, 2004; Volume 1, pp. 215–233. [Google Scholar]
  53. Pignatelli, V.; Champ, C.; Marshall, J.; Vorobyev, M. Double cones are used for colour discrimination in the reef fish, Rhinecanthus aculeatus. Biol. Lett. 2010, 6, 537–539. [Google Scholar] [CrossRef] [PubMed] [Green Version]
  54. Cyriac, V.P.; Kodandaramaiah, U. Conspicuous colours reduce predation rates in fossorial uropeltid snakes. PeerJ 2019, 7, e7508. [Google Scholar] [CrossRef] [PubMed] [Green Version]
  55. Kaupp, U.B.; Niidome, T.; Tanabe, T.; Terada, S.; Bonigk, W.; Stiihmert, W.; Cooka, N.J.; Kangawa, K.; Matsuo, H.; Hirosell, T.; et al. Primary structure and functional expression from complementary DNA of the rod photoreceptor cyclic GMP.gated channel. Nature 1989, 342, 762–766. [Google Scholar] [CrossRef] [PubMed] [Green Version]
  56. Chen, T.Y.; Illing, M.; Molday, L.L.; Hsu, Y.T.; Yau, K.W.; Molday, R.S. Subunit 2 (or β) of retinal rod cGMP-gated cation channel is a component of the 240-kDa channel-associated protein and mediates Ca2+-calmodulin modulation. Proc. Natl. Acad. Sci. USA 1994, 91, 11757–11761. [Google Scholar] [CrossRef] [PubMed] [Green Version]
  57. Kitiratschky, V.B.D.; Behnen, P.; Kellner, U.; Heckenlively, J.R.; Zrenner, E.; Jägle, H.; Kohl, S.; Wissinger, B.; Koch, K.-W. Mutations in the GUCA1A Gene Involved in Hereditary Cone Dystrophies Impair Calciummediated Regulation of Guanylate Cyclase. Hum. Mutat. 2009, 30, E782–E796. [Google Scholar] [CrossRef] [PubMed]
  58. Baehr, W.; Karan, S.; Maeda, T.; Luo, D.-G.; Li, S.; Bronson, J.D.; Watt, C.B.; Yau, K.-W.; Frederick, J.M.; Palczewski, K. The Function of Guanylate Cyclase 1 and Guanylate Cyclase 2 in Rod and Cone Photoreceptors. J. Biol. Chem. 2007, 282, 8837–8847. [Google Scholar] [CrossRef] [Green Version]
Figure 1. Schematic diagram of the eyes of (A) Ahaetulla prasina (diurnal) and (B) Lycodon flavozonatum (nocturnal). Photos by Chen-Yang Tang and Jin-Long Ren.
Diversity 13 00621 g001
Figure 2. Annotative summary of de novo transcriptome assembly. (A) Annotated unigenes of A. prasina and (B) L. flavozonatum from 4 different databases. (C) Comparison of Gene Ontology (GO) classifications based on de novo transcriptome assembly of two snakes.
Diversity 13 00621 g002
Figure 3. PCA plot of 36 samples from two snakes.
Diversity 13 00621 g003
Figure 4. Co-expression analysis for orthologous genes from two snakes. (A) Analysis of soft-thresholding powers based on scale independence (left) and mean connectivity (right). (B) The cluster dendrogram of genes. Modules considered with high similarity were merged. (C) Network heatmap plots of all genes in WGCNA. (D) Heatmap of correlation between modules and traits. Shades of color represent correlation and the numbers in parentheses represent p-value.
Diversity 13 00621 g004
Figure 5. GO terms enriched by module genes and differential expression pattern. (A) REVIGO clusters of significantly overrepresented GO terms for genes in dark-green module. (B) Interactive graph of significantly overrepresented GO terms in dark-green module. (C) Dot plot of significant GO terms enriched by genes in blue module. (D) Volcano plot of differential expression genes (DEGs) in two modules between two snakes. The green dots indicate the genes upregulated in eyes of A. prasina and red dots represent genes upregulated in L. flavozonatum (E) Heatmap shows expression pattern of DEGs in two modules.
Diversity 13 00621 g005
Figure 6. Genes of interest involved in phototransduction pathway (modified from KEGG pathway: map04744). Genes not involved in this study are shown in white. Genes assigned to modules correlated with eyes of A. prasina and L. flavozonatum are shown in green and red, respectively. The genes specifically involved in phototransduction in cones are shown in bold, and in rods shown in regular font, while underlined texts indicate genes in both cones and rods.
Diversity 13 00621 g006
Publisher’s Note: MDPI stays neutral with regard to jurisdictional claims in published maps and institutional affiliations.

