Article

Beta Diversity along an Elevational Gradient at the Pico da Neblina (Brazil): Is Spider (Arachnida-Araneae) Community Composition Congruent with the Guayana Region Elevational Zonation?

by
André A. Nogueira
1,*,
Antonio D. Brescovit
2,
Gilmar Perbiche-Neves
1,3 and
Eduardo M. Venticinque
4
1
Programa de Pós-Graduação em Ciências Biológicas (Zoologia), Instituto de Biociências, Campus de Botucatu, Universidade Estadual Paulista–UNESP, Botucatu 18618-689, SP, Brazil
2
Laboratório de Artrópodes, Instituto Butantan, Av. Vital Brazil 1500, São Paulo 05503-900, SP, Brazil
3
Laboratório de Plâncton, Departamento de Hidrobiologia, Centro de Ciências Biológicas e da Saúde CCBS, Universidade Federal de São Carlos, São Carlos 13565-905, SP, Brazil
4
Centro de Biociências, Departamento de Ecologia, Campus Universitário—Lagoa Nova, Universidade Federal do Rio Grande do Norte—UFRN, Natal 59072-970, RN, Brazil
*
Author to whom correspondence should be addressed.
Diversity 2021, 13(12), 620; https://doi.org/10.3390/d13120620
Submission received: 15 October 2021 / Revised: 12 November 2021 / Accepted: 16 November 2021 / Published: 26 November 2021

Abstract

:
Beta diversity is usually high along elevational gradients. We studied a spider community at the Pico da Neblina (Brazil), an Amazonian mountain which is one of the southern components of the Guayana region. We sampled six elevations and investigated if beta diversity patterns correspond to the elevational division proposed for the region, between lowlands (up to 500 m), uplands (500 m to 1500 m), and highlands (>1500 m). Patterns of dominance increased with elevation along the gradient, especially at the two highest elevations, indicating that changes in composition may be accompanied by changes in species abundance distribution. Beta diversity recorded was very high, but the pattern observed was not in accordance with the elevationaldivision proposed for the region. While the highlands indeed harbored different fauna, the three lowest elevationshad similar species compositions, indicating that the lowlands spider community extends into the uplands zone. Other measures of compositional change, such as similarity indices and species indicator analysis, also support this pattern. Our results, in addition to a revision of the literature, confirm the high diversity and endemism rates of montane spider communities, and we stress the importance of protecting those environments, especially considering the climate crisis.

1. Introduction

Montane biotas have always been a main source of interest for biologists. The drastic environmental changes observed in relatively short distances make mountain systems ideal for studies on diversity patterns [1,2,3,4] and for use as natural laboratories [5,6,7]. Montane biota also draws attention due to its usually large species richness and endemism levels [8,9]. Finally, due to the strong environmental gradients, montane biotas are also characterized by large beta diversity values, with several compositional changes in their communities along the gradients.
There is evidence of a gradual compositional change along elevational gradients [1,10,11,12] instead of important and localized discontinuities at a specific point. This could be attributed to the fact that some important environmental factors, such as temperature, decline continuously with elevation [13,14]. However, there are some empirical examples of more abrupt changes within elevational gradients [15,16]; evidence of well-defined elevational zonation of biotic communities.
In this study, we quantify the beta diversity component of a spider meta-community at an elevational gradient in Amazonia, the Pico da Neblina, the highest Brazilian mountain, as well as highest place in South America outside the Andes [17]. This mountain is part of the Guayana region, a very remote place in northern South America famous for its table-top mountains. A physiographical division based on elevation and temperature proposed for the region distinguished three main units, lowlands (up to 500 m, >24 °C annual average), uplands (from 500 to 1500 m, 18–24 °C), and highlands (>1500 m, 8–18 °C) [18], and the elevational distribution of the vegetation seems to support this division [19,20].
Spiders are good models for diversity studies [21,22]. One of the most species-rich orders (circa 49,700 species [23]), spiders are conspicuous elements in most ecosystems and can be sampled in large numbers in relatively short time and using low-cost sampling methods, such as nocturnal hand collecting, pitfall traps, and beating trays [24,25].
Our main interest is to verify the patterns of beta diversity of the spider community along the elevational gradient, and to assess if they are in accordance with the elevational division proposed for the Guayana region. We expect that changes in the composition ofspider communities are connected to those observed for vegetation, since the structure of the vegetation is considered an important environmental factor for spider species [26,27]. We also measure and discuss patterns of dominance (i.e., the relative importance of the most abundant species) and community structures along the gradient, as there is evidence for larger dominance at higher elevations [5,11,28]. Finally, we use species indicator analysis (SIA) to identify the degree of associations of the species with different elevations or elevational zones, which may represent an additional test of the fit of our data to the elevational division proposed for the region.
It is worth noting that knowledge on spider mountain fauna has been increasing in the last decades, with a few studies on the diversity of spider communities along elevational gradients [29,30,31], as well as several species described from montane ecosystems [32,33,34]. The results reported in these studies provide examples of the large diversity characteristic of mountain ecosystems, and also reports important compositional changes along the gradients. This increase of knowledge on montane spider fauna will allow us to evaluate our results in a broader context, and to look for more general patterns of spider beta diversity in elevational gradients, as well as to make some comments on the conservation of these mountain communities.

2. Material and Methods
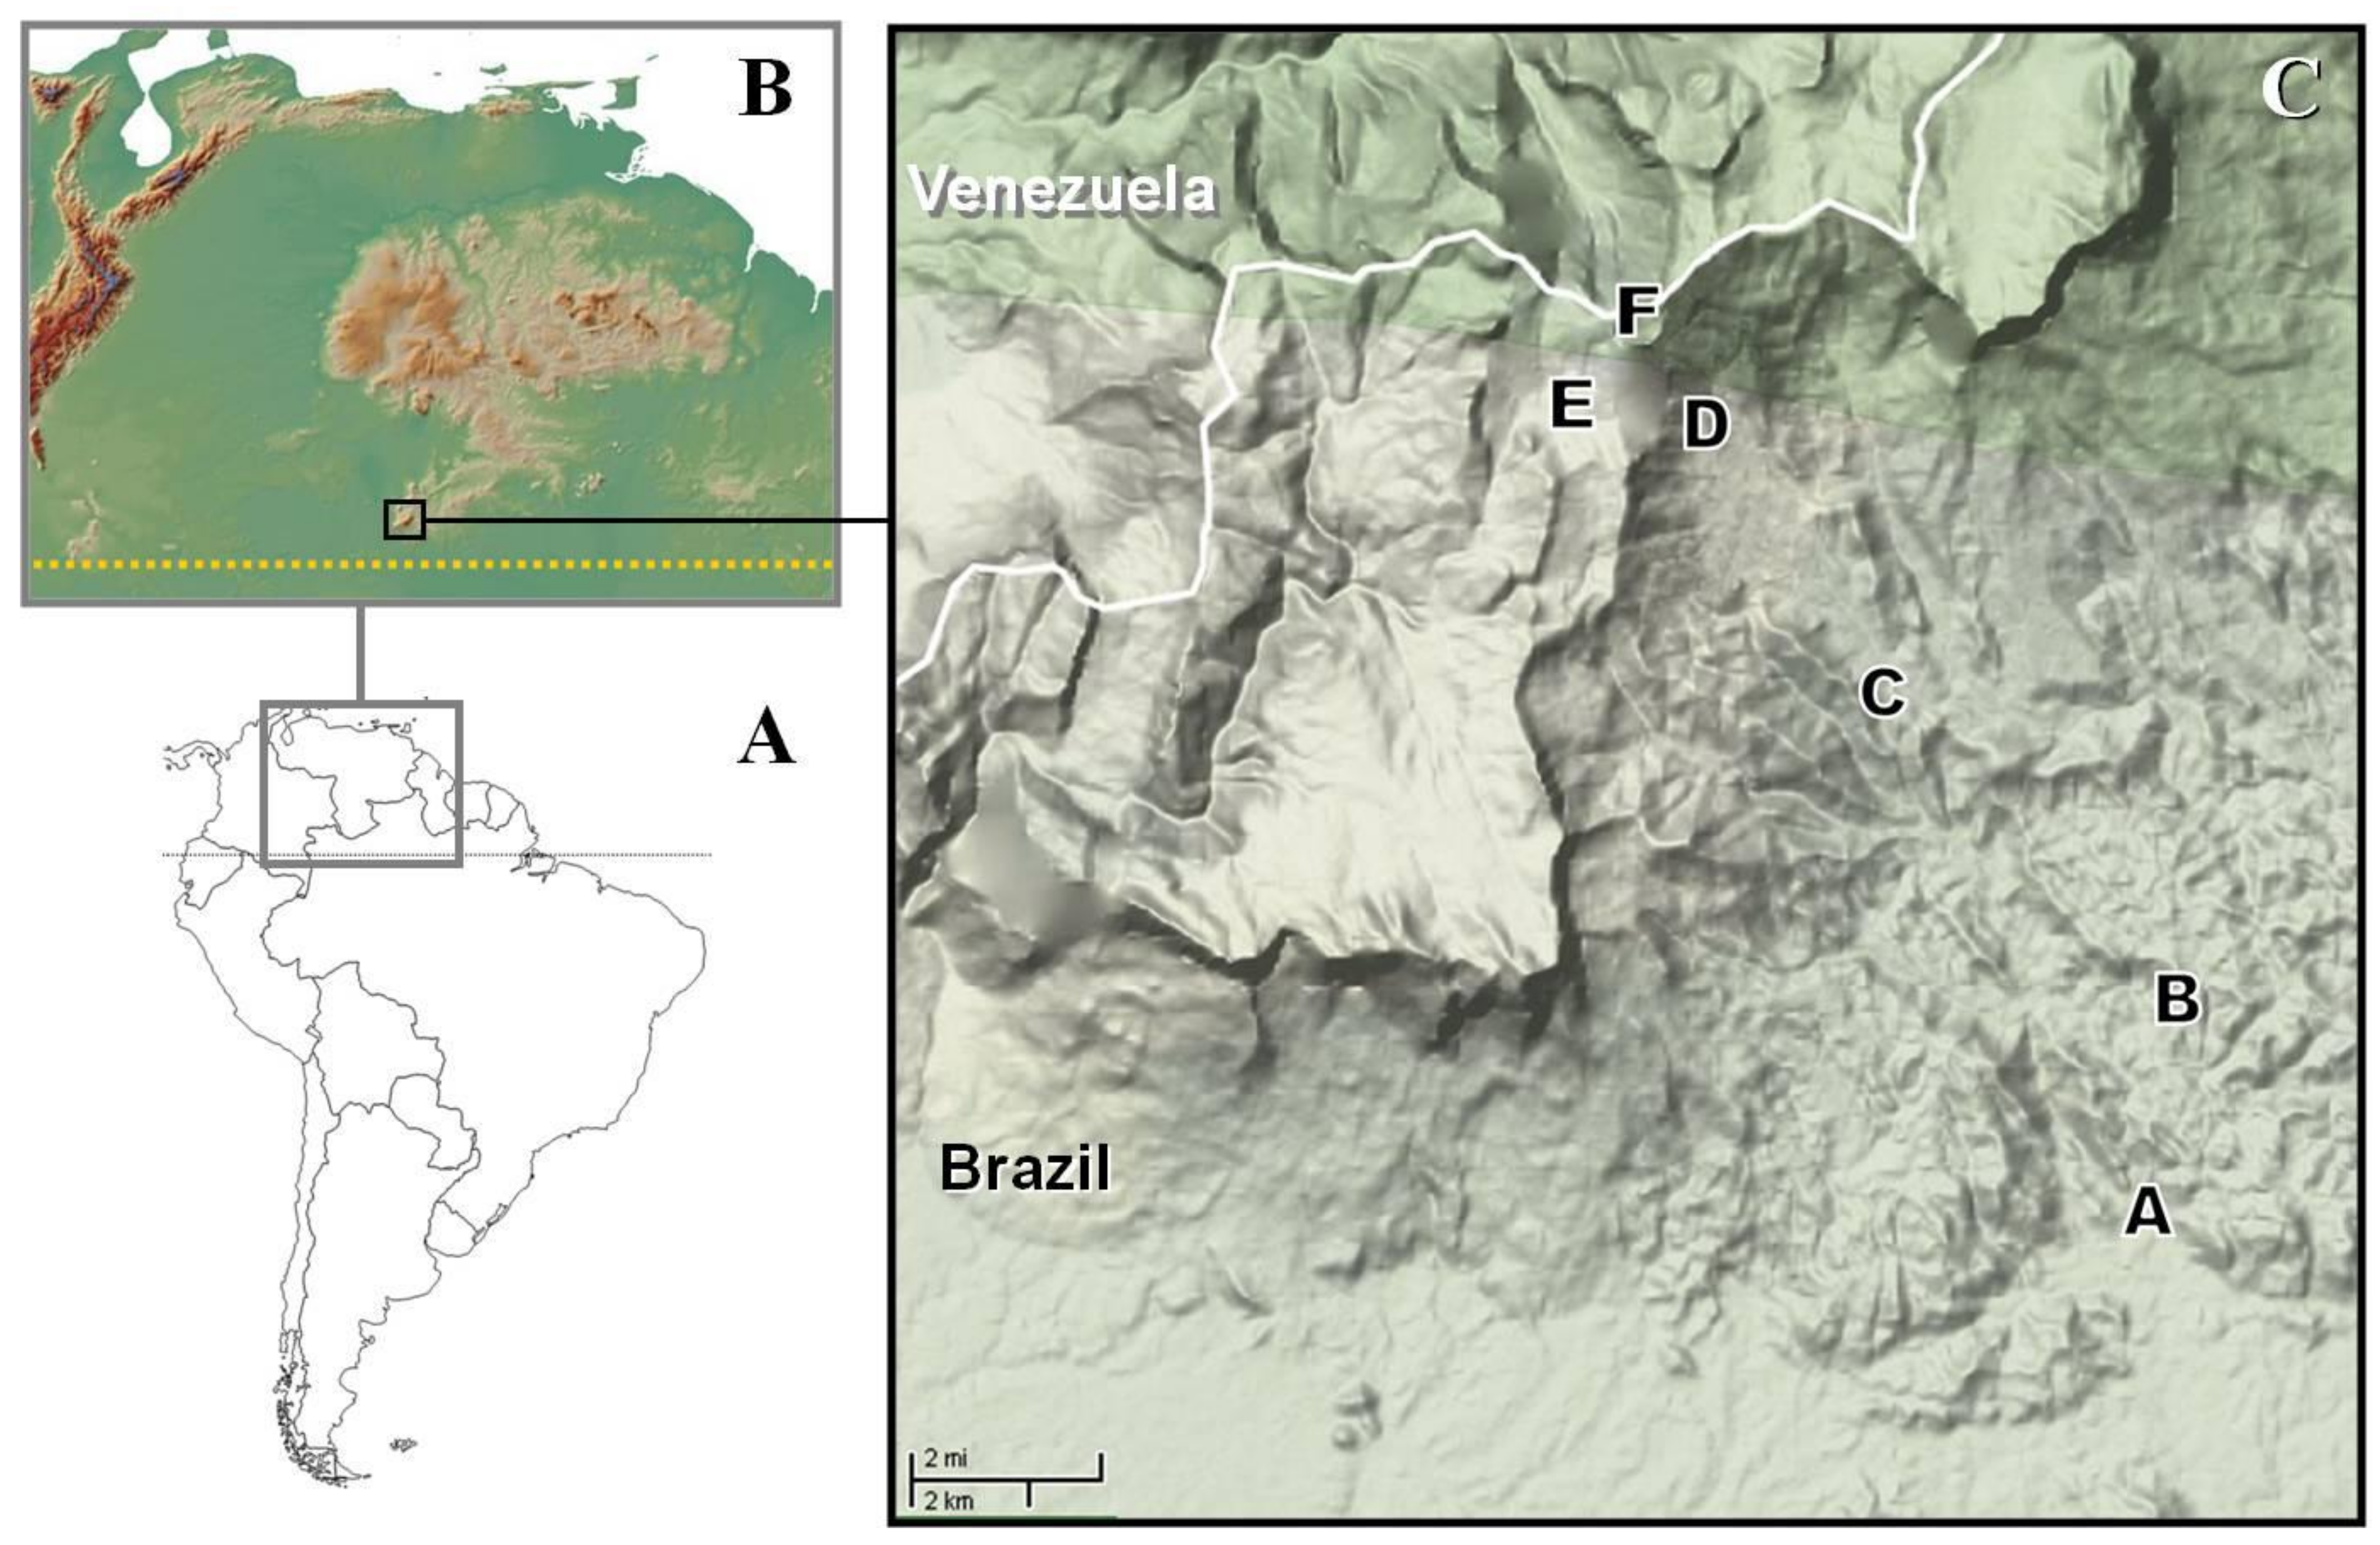
2.1. Study Area

The study was conducted at the Pico da Neblina (00°48′07″ N e 66°00′40″ W). It belongs to the Pico da Neblina National Park (municipality of São Gabriel da Cachoeira, state of Amazonas, Brazil), one of the largest conservations units in Brazil (2,260,344.15 ha), and also to the Yanomami Indigenous Land, with which the Park overlaps. The Pico da Neblina lies in a mountain region which represents the watershed between the Amazon and Orenoco basins, as well as the boundary between Brazil and Venezuela [35].
As mentioned above, the Pico da Neblina is part of one of the southern and more isolated mountain components of the Guayana region (Figure 1), and is characterized by extensive high elevation plateaus (2000 to 2400 masl), although it does not present the typical tepui, table-top shape [18]. The annual average rainfall at lowlands is 3000 mm/year, without a dry season, and the average humidity is about 85–90% [33]. Rainfall increases with elevation until around 1800 m, being gradually replaced by a constant mist, and the average humidity reaches almost 100% [35].
Vegetation in the lowlands is composed ofa tall, evergreen forest, and the uplands are covered by montane forests, which havedecreasing biomass and tree size, especially when declivity is accentuated, leading to shallower soils [36]. In the highlands, forests are replaced by more open types of vegetation like high elevation scrublands and broad leave meadows, which grow on organic peat soils and on rocky substrates. At the Neblina, forests formation occurs almost up to 2000 m, and above that elevation their high-altitude formations stand out for their diversity and endemism [19]. Species from the families Bromeliacea, Rapateacea and Theacea are among the most characteristics elements of this flora. The flora of the region, especially from high altitudes is renowned for its high diversity and endemism [19], and the Guayanas highlands are considered as a discontinuous biogeographical province, also called Pantepui. Detailed information on the geology and vegetation of the region can be found in Berry and collaborators [37] and Berry and Riina [19].

2.2. Sampling Methods

Spiders were collected with two traditional methods in spider inventories [24]; beating tray and manual active search (i.e., hand collecting). In the first method, the understory vegetation, such as shrubs and small trees, is sampled through the beating of leaves, branches, vines, and other parts of the vegetation with a stick, while holding a 1 m2 tray under it. The spiders falling in the tray are collected, and the sampling unit consisted of 20 of those beating events, in different plants, along a 30 m long transect. In the second method, spiders from the forest floor and from the understory are directly collected with the help of tweezers and/or plastic vials. The sampling unit represents one hour of search along an approximate area of 300 m2 (30 × 10 m). The first method was employed during the day, from 8:00 to 11:00 h, and the second at night from 19:30 to 23:00 h. All spiders collected with both methods were immediately fixed in 70% ethanol.
Sampling was carried out by three collectors at six elevations, 100, 400, 860, 1550, 2000 and 2400 m. At each elevation we investigated three sites, about 100 m apart from each other. We obtained a total of 54 samples by elevation (27 of each method) resulting in a final count of 324 samples (162 of each method) for the Pico da Neblina. The sampling expedition occurred from 22 September 2007 to 13 October 2007, the local “dry season”. We only identified adult spiders. Specimens were sorted into morphospecies usually by the first author and then identified until the lowest taxonomic level by specialists. Voucher specimens weredeposited at the collection of the Instituto Nacional de Pesquisas da Amazônia (INPA), at Manaus (AM), and duplicates weredeposited at the Instituto Butantan (IBSP), São Paulo (SP) and at the Museu Paraense Emílio Goeldi (MPEG), Belém (PA).

2.3. Analyses

For each elevation (considering the pooled data from the three sites by elevation), we calculated and present the following parameters: species richness, abundance, diversity, dominance, and proportion of singletons. In this study, we will refer to the number of species captured in our samples as species richness, and the number of specimens captured in our samples as abundance, although we are aware that the results of our sampling represent only an estimation of the real richness and abundance of the community.
As a diversity measure we used the exponential of the Shannon–Wiener Index, also known as the “numbers equivalent” or “effective number of species” of a given community. It represents the number of equally likely elements needed to produce the value of the diversity index. The use of number equivalents (D) over raw diversity indexes has been recommended [38] as this transformation allows a more intuitive interpretation. Unlike raw diversity indexes, which are nonlinear, number equivalents possess doubling propriety, i.e., if two completely distinct communities of equal size with a diversity D = X are combined, their diversity will be D = 2X [38]. Finally, it is convenient to stress the importance of using a measure of diversity that takes into account species abundance. Changes in relative abundances can be as perceptible as changes in species composition and their study allow a more accurate picture of the community than just species richness, for which dominant and rare species, often represented by just one individual, are given the same weight [38,39]. To measure the dominance, we used the Berger–Parker index [40], which is based on the proportional abundance of the single most dominant species. Dominance patterns by elevation were also assessed by the visual inspections of rank abundance plots. The proportion of singletons refers to the number of species represented by just one individual in a given elevation, regardless of the species total abundance. We also present the proportional distribution of absolute singletons, i.e., species represented by just one individual considering the total inventory, by elevation.
We calculated the beta diversity for three levels: among the three sampling sites within the same elevations; between different elevations, pooling the communities at each elevation and generating a distance matrix; and for the total inventory, including all elevations. We used a beta diversity based on the number equivalents (D), where beta D = gamma D/alpha D [39]. This procedure allows obtaining independent alpha and beta components, a logical principle often violated by traditional diversity indices [39]. The alpha is calculated as the sum of the weighted Shannon–Wiener index of each community (sites or elevations), and the weight represents the proportional abundance of each community in relation to the pooled abundance of all communities being compared.Gamma diversity is obtained by simply calculating the Shannon–Wiener index for the pooled community in question. After we obtained the alpha and gamma diversity, we converted them to its equivalent numbers (D gamma and D alpha) to calculated the beta diversity, which is expressed in number of communities, ranging from 1 (when all communities compared are identical) to N, which is the total number of communities being compared, when they are all completely different [39]. In our case, the maximum possible beta diversity, N, is either two, for pairwise comparisons between different elevations; three, for comparisons within elevations; or six, considering the six elevations of the whole gradient.
We used the Bray–Curtis index of similarity to generate a distance matrix for the 18 sampling sites and for the 6elevations sampled. We also constructed a matrix based on the proportion of species shared (in relation to the total richness for the pair of sites or elevations) between the 18 sampling sites and the 6elevations. We used the Bray–Curtis matrix (18 sampling sites) to perform a NMDS [41] and checked the stress, a measure of the fit between the final solution of the analysis and the original distance matrix of the community. This ordination technique has already been positively evaluated [42,43] even for dealing with species of rich and under sampled communities [44].
To assess the relation between beta diversity, similarity, spatial distance, and elevation, we generated distances matrices of those parameters for the six elevations and performed partial Mantel tests, based on 10,000 permutations for each test (α = 0.05). Partial Mantel tests, through the Pearson correlation coefficient, assess the relation between two distances matrices, while controlling for the effect of a third matrix [45]. We related the two similarity indices between each other and to the two distance measures (spatial and elevation), successively controlling for space and elevation, and also without a control factor. We followed an approach suggested by Legendre [46] and performed the permutation on the residuals of a null model assuming the absence of effect of the third factor in a partial regression.
To verify if the changes in composition werein accordance with the division proposed for the Guayana region, we performed an analysis of similarity (ANOSIM), a non-parametric permutation procedure to test for significant differences in composition among differently grouped sampling units [47].We compared the fauna of three elevational groups; Lowlands (100 m and 400 m), Uplands (860 m and 1550 m), and Highlands (2000 m and 2400 m). To measure the similarity, we used the Bray–Curtis index. Significance levels were adjusted by a Bonferroni correction.
Finally, we used species indicator analysis (SIA) [48] to verify the association of the 157 most abundant species (represented by at least five individuals) with the different elevations. SIA calculates an indicator value (IV) based on the frequency and abundance with which a species occurs at the sites of a given category, and then tests if the IV differs significantly from random based on a Monte Carlo permutation (n = 1000). The higher the frequency and exclusivity of distribution in a given category, the higher the IVwill be of a species, which ranges from 0 (absence of a category) to 100 (present in all sites of a category). SIA hasthe advantages that they treat each species independently, and allows the comparison of the adequacy of the data to different typologies of the categories being compared, through the sum of species indicator values [48].
We analyzed the distribution of species under three different partitions of the gradient, which ranged from a coarser to a more refined elevational typology. This represents another approach to check the adjustment of our community with the elevational division proposed for the region. The first partition split the gradient in two categories, Lower Half (100 m, 400 m and 860 m) and Upper Half (1550 m, 2000 m and 2400 m). The second, based on the division proposed for the Guayana region, considered three categories: Lowlands (100 m and 400 m), Uplands (860 m and 1550 m) and Highlands (2000 m and 2400 m). In the last partition, we considered each elevation as a category. The presence of the species was verified at every sampling site at each elevation.
We used the software EstimateS [49] to obtain the number of shared species, and the software PAST [50] to calculate the Bray–Curtis similarity, Shannon–Wiener, and Berger–Parker Indexes, and also to perform the ANOSIM. The NMDS was performed with the R program [51], and the Partial Mantel with the software PASSAGE [52]. We ran the ISA with the software PC-ORD [53].

3. Results

We obtained 3140 adult spiders, which were assigned to 529 morphospecies from 39 families. A complete list of the species collected at the Pico da Neblina is presented in Nogueira et al. [54].

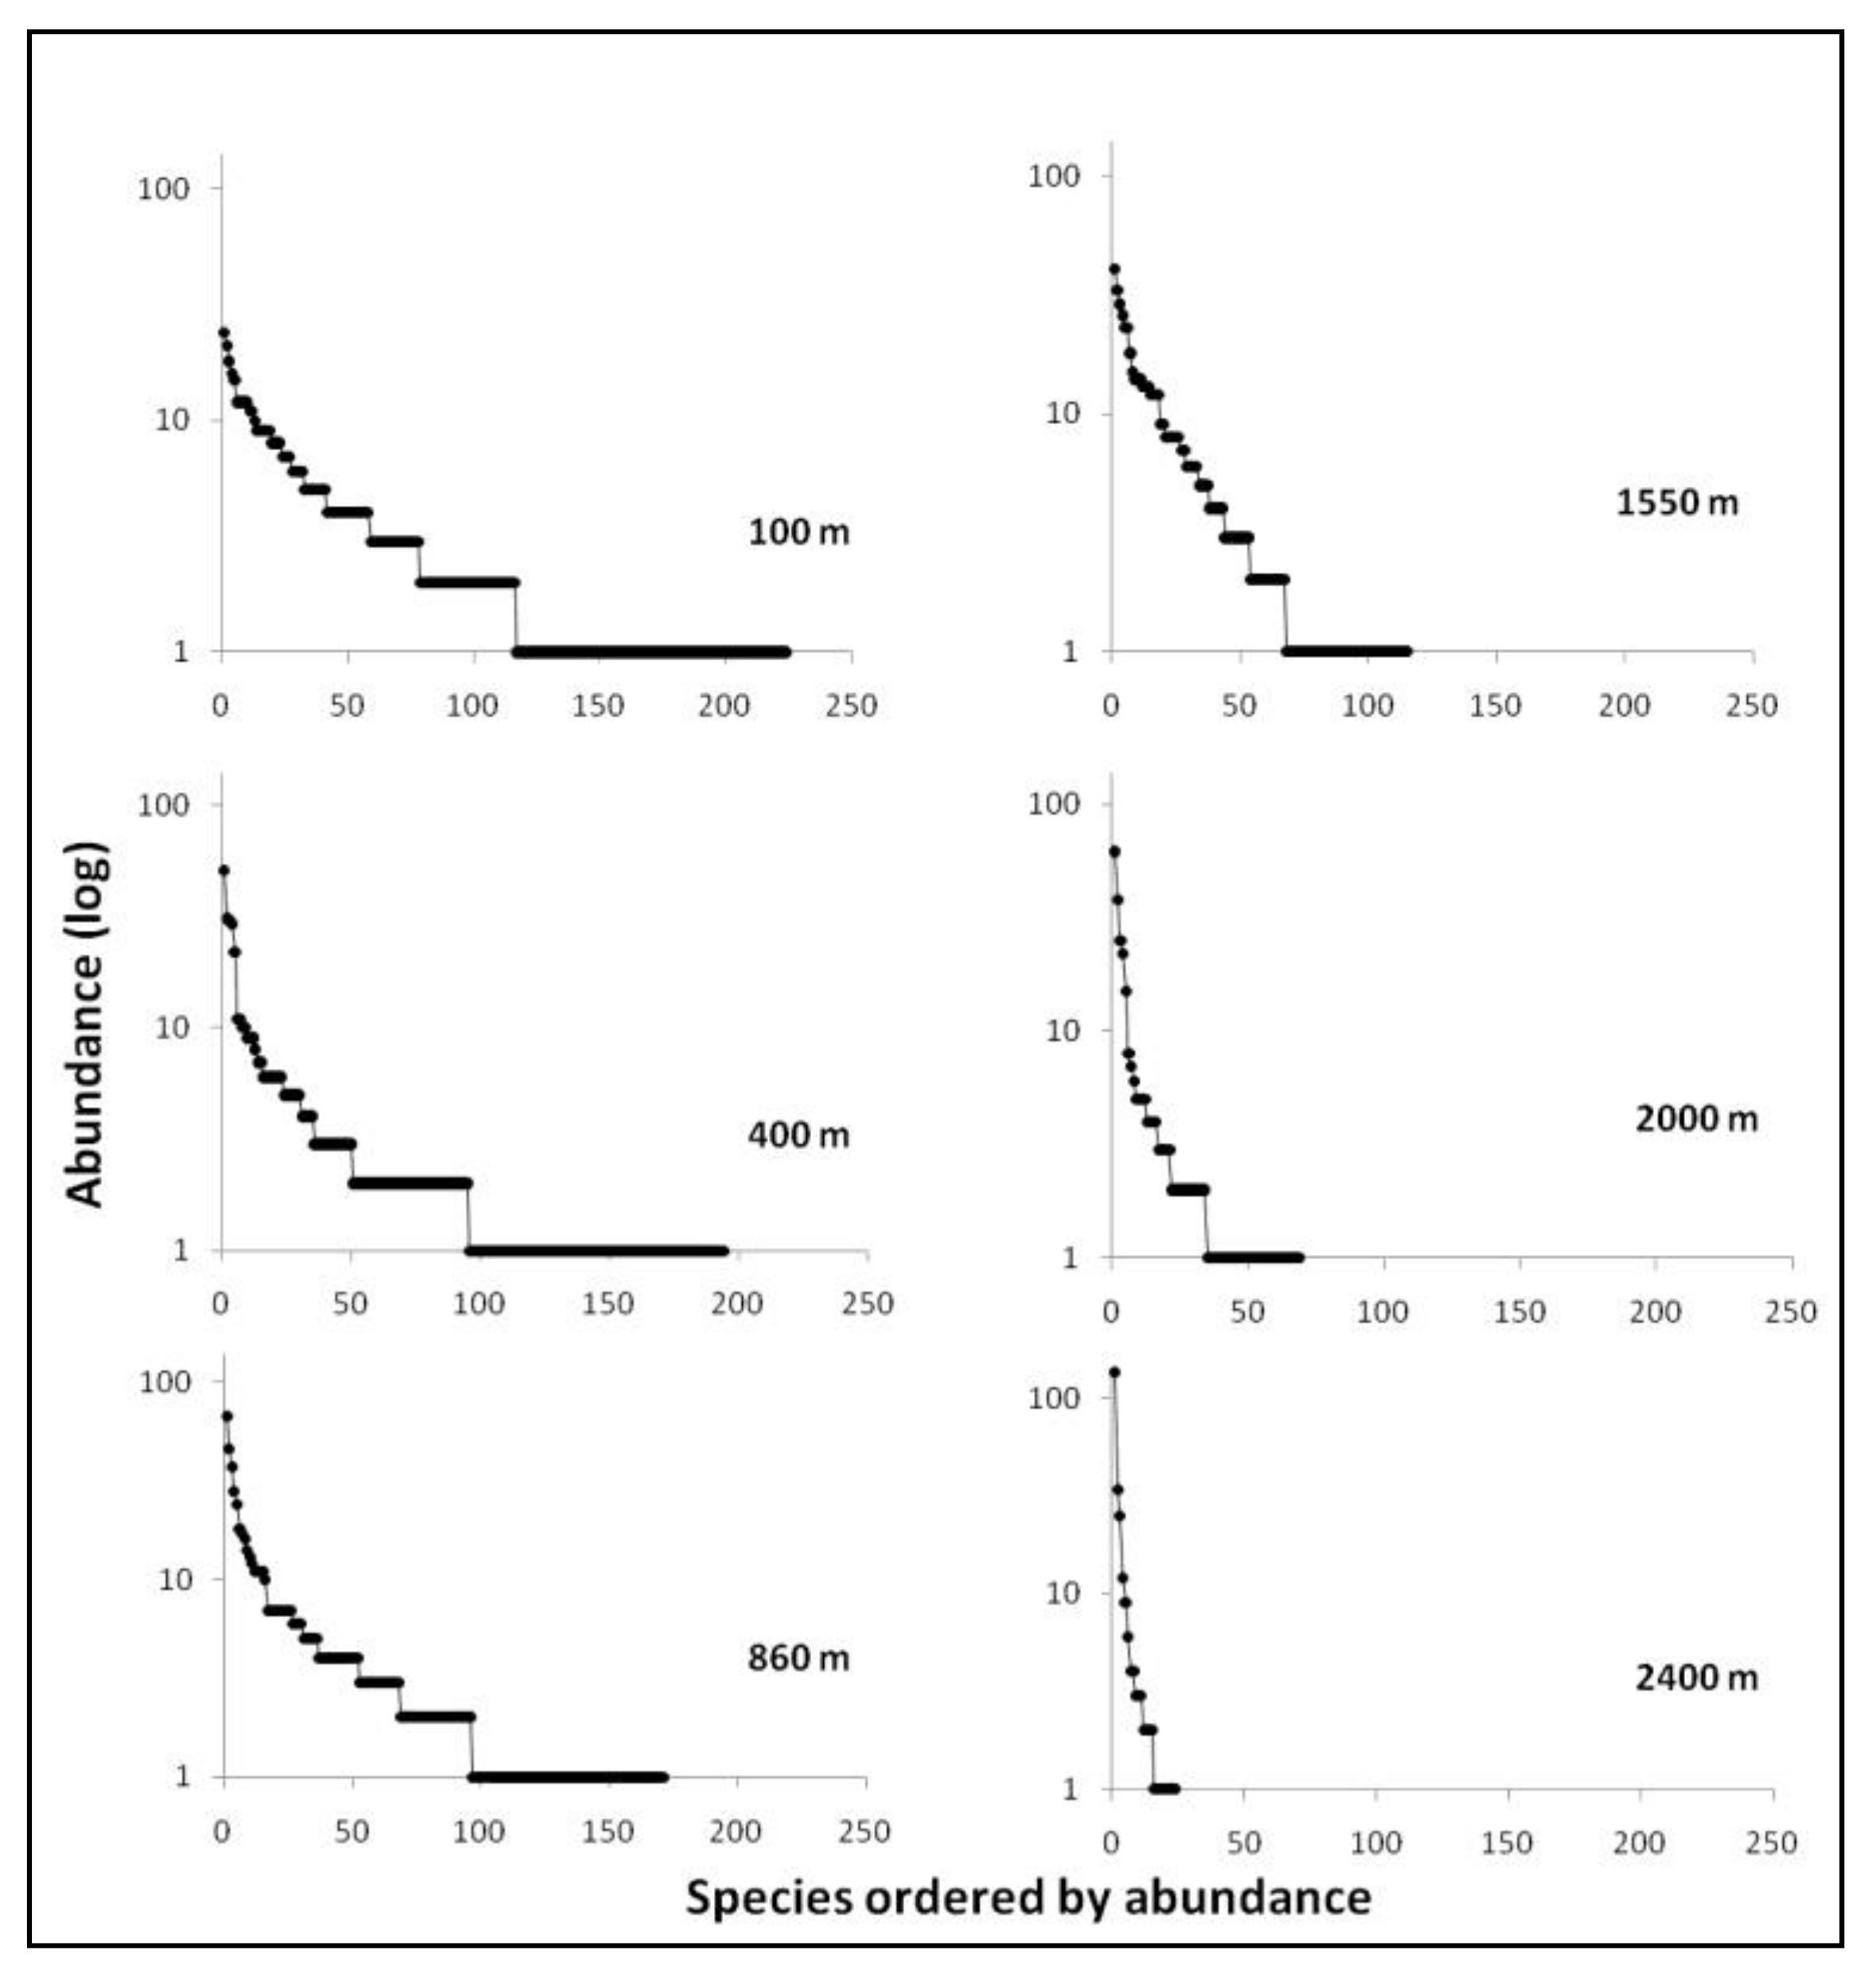
3.1. Diversity and Dominance
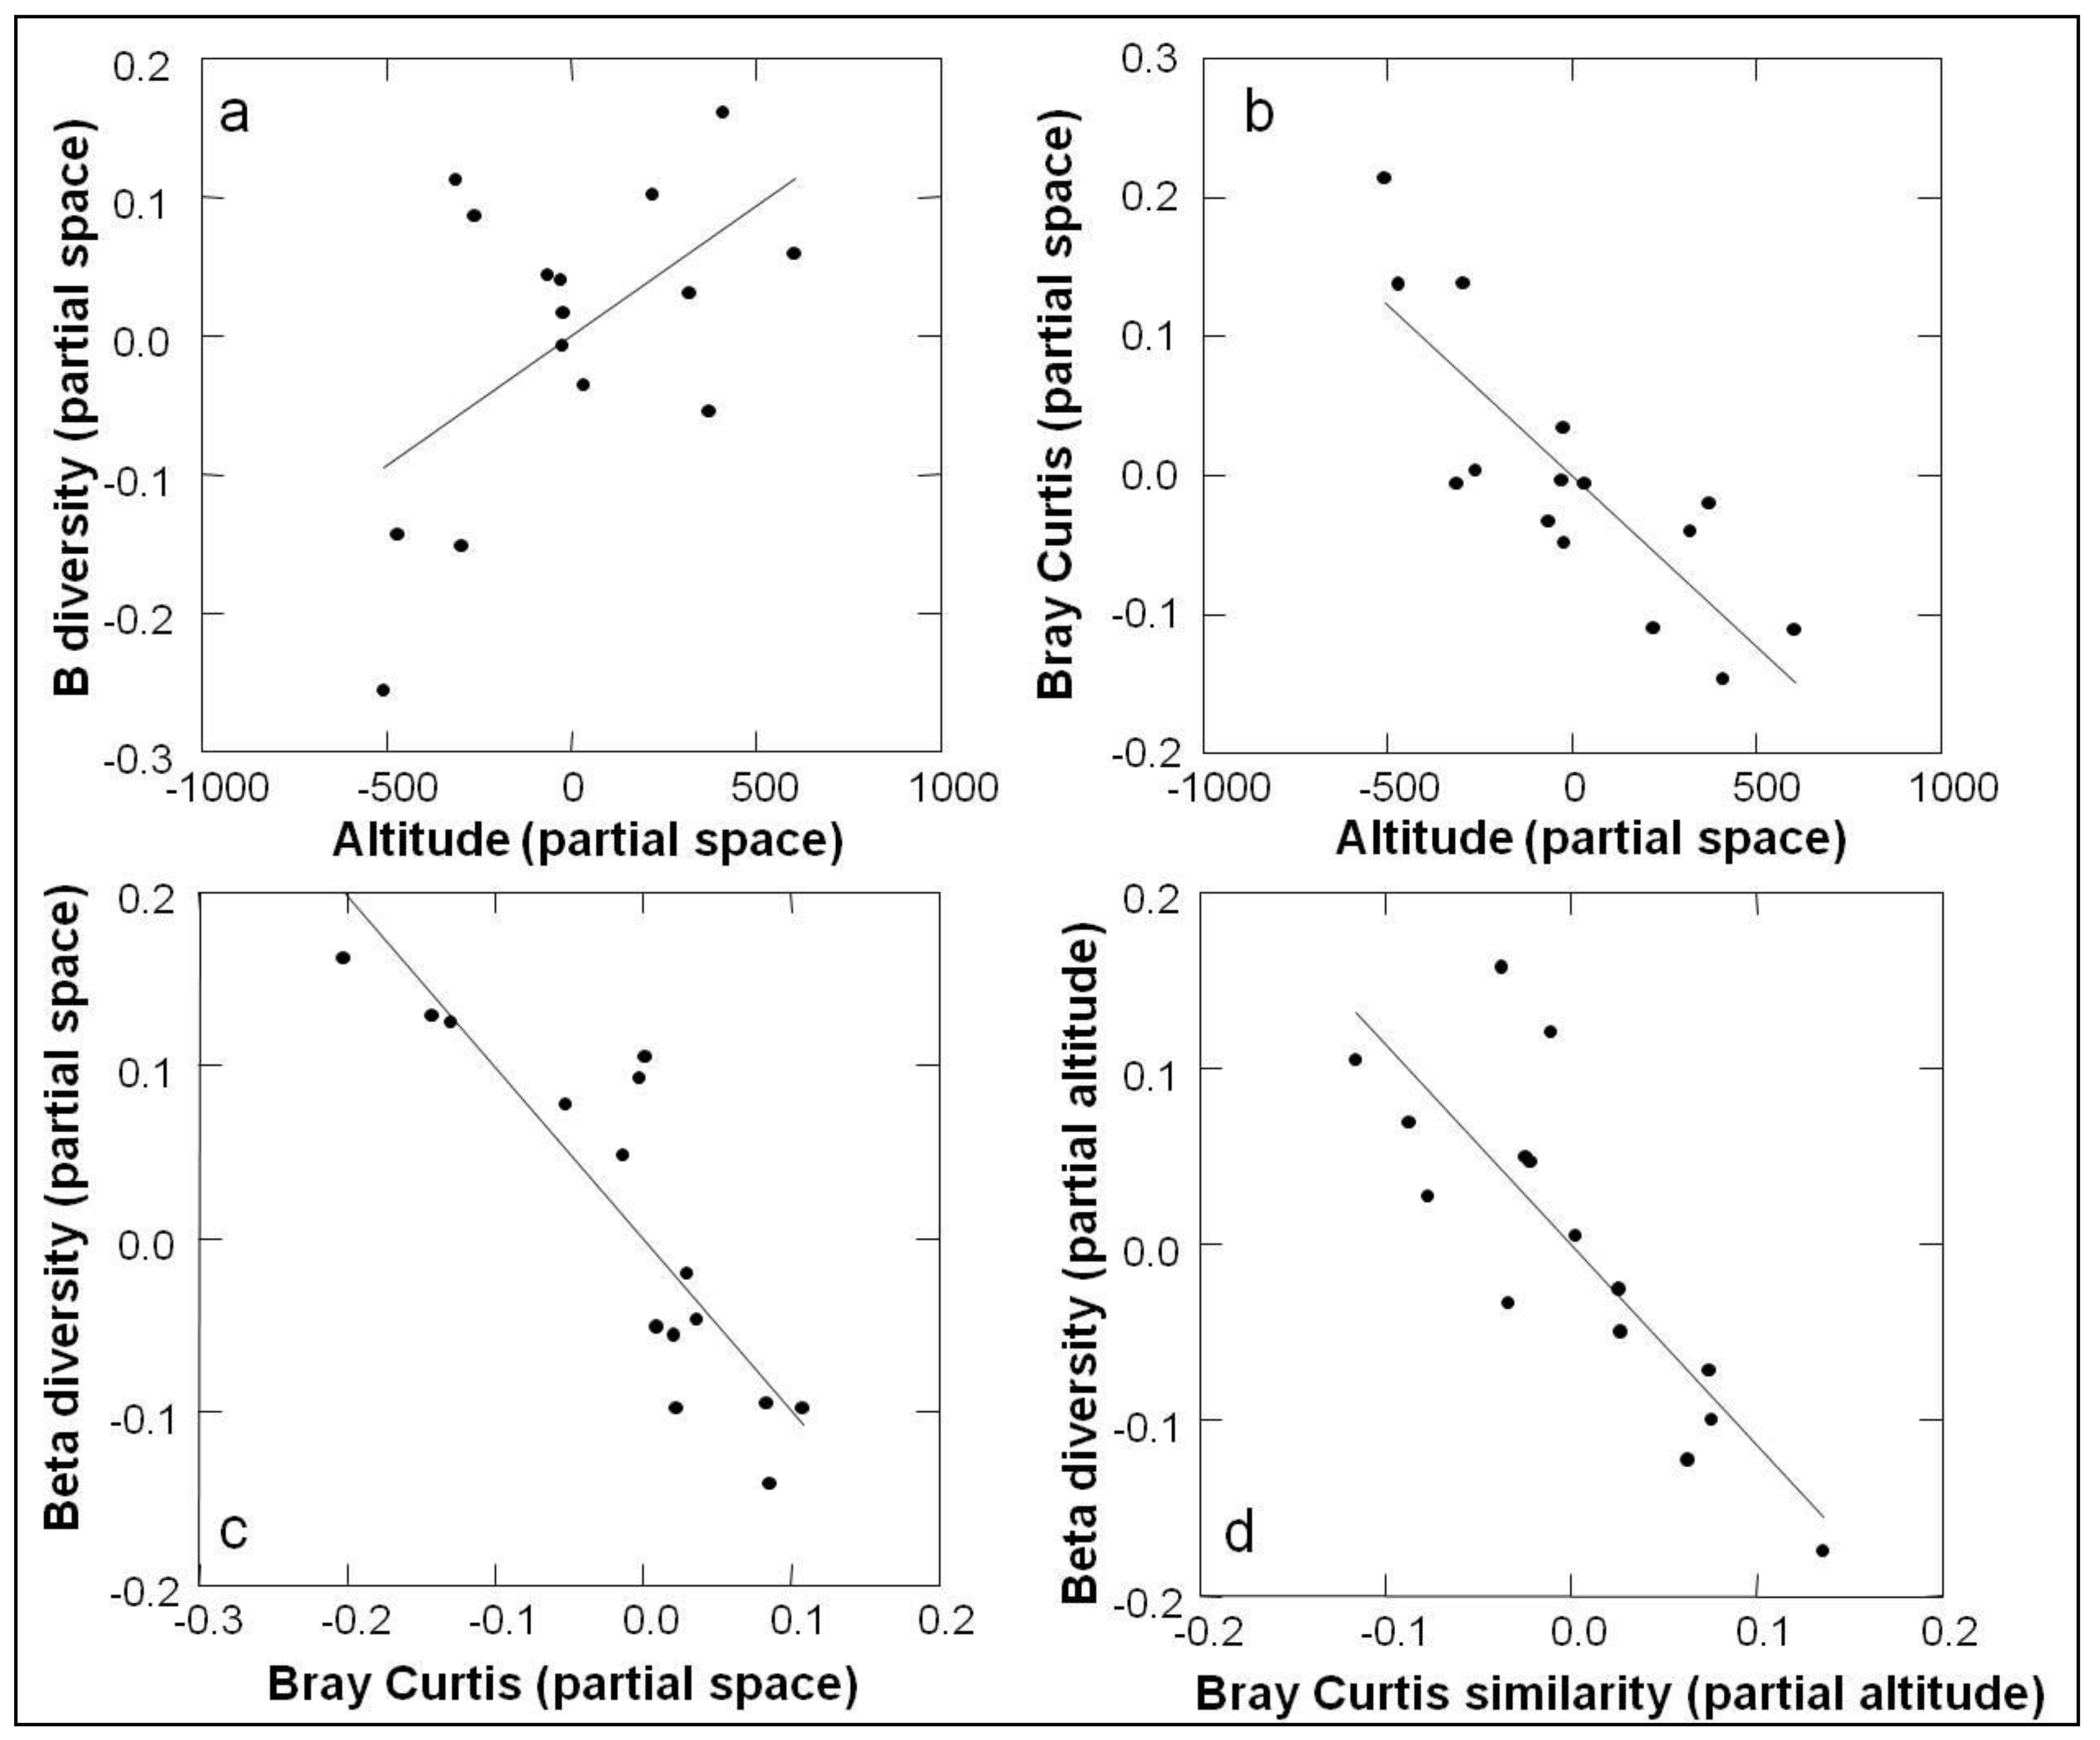
Richness, diversity, and proportion of absolute singletons decreased with increasing elevation (Table 1), while the abundance and proportion of singletons by elevation showed a more variable pattern (Table 1). Dominance increased with elevation, although not monotonically. Notably, dominance sharply increased in the two highest elevations, especially the last one, at 2400 m, where the single most dominant species accounted for more than 50% of the total abundance (Table 1 and Figure 2).
Our results also showa positive association between species from the genus Chrysometa and elevation. The dominant species from the three highest elevations sampled belong to this genus, and two of them, Chrysometa petrasierwaldae Nogueira et al. 2011 (137 ind.) and C. nubigena Nogueira et al. 2011 (96 ind.), were the most abundant of the whole inventory.

3.2. Beta Diversity

There were important compositional changes between elevations along the gradient, which may occur abruptly at certain places. Beta diversity between different elevations varied from 1.45 to 1.90 (Table 2), with an average value of 1.73. These large values indicate an impressive complementarity of communities between different elevations, considering that the maximum beta diversity possible when comparing two sites is 2.
The Mantel partial test showed that the beta diversity and Bray–Curtis similarity indexes were highly related, even when controlled for space or elevation (Table 3 and Figure 3). Both indexes were related to elevation in a significant way, as similarity decreased and beta diversity increased with increasing elevational difference between the elevations sampled, although the relation was stronger with similarity. The relation with differences in spatial distances, on the other hand, was not significant for either index (Table 3).
The NMDS (Stress 5.97) indicates that changes in composition are not gradual along the gradient (Figure 4). Along the first axis, which accounted for 58% of total variation, it is possible to observe two main groups of sites, one formed by the three lowest elevations, and the other by the two highest elevations sampled. The fourth elevation, at 1550, is fairly isolated from both groups and occupies an intermediate position.
The ANOSIM revealed significant differences in the composition of spider communities at the Pico da Neblina (R = 0.8362, p < 0.001). The comparison performed between the three groups of elevations—lowlands, uplands, and highlands—also indicated significant differences between all of them (p < 0.01 for all comparisons). The magnitude of the relation was very high when comparing the highlands with the lower groups (R = 1 with lowlands an R = 0.94 with uplands), but considerably smaller for the lowlands in relation to the uplands (R = 0.55).

3.3. Species Indicator Analysis

Of the 157 species represented by at least five individuals, 100 were assigned as indicators for at least one of the three partitions proposed for the data. Table 4 summarizes the number of indicator species for each category in each partition.
The families Anyphaenidae and Tetragnathidae showed the most consistent association with higher elevation environments, for the three partitions, while for some other families only the partition by elevation revealed some indicator species (Table 5). Lowest and medium elevations were characterized by indicator species representing a larger number of families, amongst which Araneidae and Ctenidae stand out (Table 5).

4. Discussion

Our results revealed very important changes in composition along the elevational gradient. However, the general beta diversity pattern was not entirely adjusted to the elevational division proposed for the study region. While the highlands zone (above 1500 m) did present a unique set of spider species, the lowland (up to 500 m) spider fauna expanded up until the uplands (from 500 to 1500 m), producing thus a different pattern than that observed for the vegetation, where a clear distinction between the lowland and upland communities can be perceived. Our results also showed important differences in the diversity and dominance levels of the communities, as discussed above.

4.1. Diversity and Dominance

The drastic increase in dominance above 1550 m shows that elevation acts not only on the number and the identity of species of a community, but also on the distribution of species abundance, which indicates a different sort of influence of the environmental, mainly temperature gradient, on the biotic community. The fewer and mostly different species from higher elevations also partition the total abundance in a much more uneven way.
An increasing dominance level at higher elevations has already been observed for spiders [28,29] and various other groups [11,55,56]. This pattern could represent an example of the positive relation between evenness of community species abundance and productivity [56], assuming a negative relation between altitude and productivity [4,14]. Evenness can be also positively related with habitat structure [57], which also applies to our study, as forests are structurally more complex than more open types of vegetation, such as those from the highest elevations sampled.
An alternative explanation could be based on richness decrease, whichwould lead to a decrease in interspecific competition, which would allow the remaining species to increase its abundance. This process, known as density-dependence, suggests that species density is dependent on competition [58], and has already been used to explain similar dominance patterns for ants in a tropical elevational gradient [59].

4.2. Beta Diversity

The changes in composition of the spider communities along the gradient have been large, but it was possible to see that those changes were more intense at some specific elevations. This indicates the occurrence of an elevational zonation for the spider community of the Pico da Neblina. Nonetheless, the patterns of compositional changes observed along the gradient do not seem to fit the elevational division proposed for the Guayana region, in lowlands, uplands and highlands, despite the significant differences found between these categories by the ANOSIM.
The main differences between the elevational division tested and the changes in composition observed in our data are related to the uplands categories. The third elevation sampled (860 m) is more similar to the lower sites, from the lowland category, than with the other elevation (1550 m) in the upland category, as displayed in the NMDS. This indicates that the upland category is heterogeneous and represents an inadequate elevational division for the spider fauna. Instead, results show that mainly lowland fauna extend up until the third elevation, at 860 m, and the next elevation at 1550 m represents a compositional rupture, although it is still covered by forests.
The fauna from 1550 m arenot very similar with that from higher elevations either, even with its upper neighbor, at 2000 m. This is not a surprise, given the drastic differences in climatic factors and especially in the structure of the vegetation, going from forested habitats to open physiognomies at the highland sites. The structure of the vegetation is indeed considered as one of the most important environmental factors for spider communities [26,27,60], and may have a large influence on the composition of the communities [61,62,63]. The distinction of the highland spider community may also reflect the distinction of the flora of these elevations, reputed by its endemism [18,19] and peculiar formations. The dominance pattern of the highlands fauna is another character that distinguished themfrom the lower sites, while the fauna ofthe fourth elevation, at 1550, represent anotherintermediate condition.
The coincidence of significant ruptures in composition and main vegetation types has already been reported for other studies performed at elevational gradients [64,65,66,67]. In other cases, however, changes were more gradual [12] or were not directly associated to predominant patterns of the vegetation, as observed for ground-dwelling spiders [29].
We can conclude that the elevational division proposed for the Guayana region does not fit well with our data, because communities from lowlands extend higher than expected. The spiders from the highland sites effectively represent a distinct compositional group, and changes from forested sites to open vegetation coincide with the largest ruptures observed across our gradient.
The distribution of indicator species among families furnishes the identity of the main components of the fauna from each elevation. The lowlands are dominated by species from several families, the main contributors being Ctenidae, Pholcidae, Sparassidae, Uloboridae, and especially Araneidae. All of these families and several others contributed to theindicator species for the three partitions, which indicates that even within families the range of elevational distribution presents a great variation. It is worth mentioning that the proportion of indicator species by partition is very unbalanced for some families, such as Salticidae and Theridiidae, whose species designed as indicators are concentrated in the more refined partition by elevation. It may indicate that species from these families are characterized by short elevational ranges and more specific habitat requirements.
Species designated as indicators of the higher elevations, considering the categories from the three partitions (Upper half, Highlands, 2000 m and 2400 m), belonged to only 10 families. All of those species were web builders or hunters occupying vegetation, which signals the absence of ground dwelling spider, like the Ctenidae, as significant components of these environments. Even families usually associated to the ground or leaf litter, as Hahniidae and Oonopidae [68], were represented by species occurring on the vegetation at 2000 m (pers. comm.). The family Anyphaenidae, with four species and two species of the genus Chrysometa (Tetragnathidae) were the most characteristic elements of that fauna. A similar result was observed in the Udzungawa mountains (Tanzania), where they recorded the spider species distribution along anelevational gradient. The authors also found that higher elevations were dominated by vegetation dwellers and orb-weavers, while ground-dwelling species were more abundant at lower elevations [31].
The dominance of the tetragnathid orb-weaver genus Chrysometa at higher elevations, mentioned above and discussed in Nogueira et al. [69], contrasted with the distribution of species of Araneidae, the most species-rich orb-weaver family. The elevational replacement among these groups have already been noticed at the Colombian Andes ([28] and references), and constitutes evidence that flying insects, the main target of this kind of web [70], are still an available resource at higher elevations. This suggests that Chrysometa species can tolerate climatic conditions that represent a constraint to most Neotropical Araneidae species distribution. Araneus bogotensis (Keyserling, 1864) (Araneidae) constitute a notable exception, as it was selected as an indicator of high elevation sites for the three partitions.

4.3. Spider in Mountains

The knowledge on montane spider faunas has greatly increased in the new millennia, especiallyoverthe last decade. Montane faunas are reputed for theirdiversity and endemism [6,71,72], and indeed, new species of spiders are being described from mountains of several places worldwide, mostly from under sampled places such as Asia [32,33,34] and Africa ([73], new genus from the East Arc Mountains, Tanzania). It is worth noting that most of those new species described are from upper parts of the mountains, rather than from the lower elevations.
We can present a similar result in our study. We described eight new species of the orb-weaver genus Chrysometa (Tetragnathidae) [69], and only one of these species were found in the lower half of the gradients. The remaining seven species were from the upper half, distributed from 1200 to 2400 m, the highest elevation sampled. The recurring finding of new species is evidence of the high endemism levels of mountain fauna, especially at higher elevations [74].
Another evidence of this pattern was provided by Chaladze et al. [75], who developed a Spider Diversity Model for the Caucasus Ecoregion. He showed that, although endemism is related to overall species richness, there are hotspots of endemic species (= higher proportion) in highmountain areas. A checklist of a Macedonia mountain spider fauna [76] also reported that most of the endemic species for this region are constituted of mountain elements. In our case, it is impossible to make similar evaluations of the regional spider fauna, since the amazon spider fauna is still very poorly known, and thus it is difficult to assess the real distribution of most species. However, high endemism levels have been observed for the herpetofauna [77], one of the few animal groups studied in more detail at the Pico da Neblina.
Other recent studies performed more complete and standardize inventories along elevational gradients. These studies show a great variation in their results, as some were performed in tropical mountains [30,31] while other were conducted in temperate regions [29,78,79]. Another source of variation are the sampling methods, since some studies used only pitfall traps, and thus could only assess the soil and litter fauna, while others employed other methods that enabled then to assess a larger portion of the community, as web-builders and vegetation dwellers.
However, some common patterns concerning beta-diversity emerged from these studies. For example, most of the compositional differences along the gradient are due to turnover, rather than nestedness. So, high elevation communities, even when presenting low richness, are not formed from a subset of more tolerant species from lower parts of the gradient, bur are constituted by a different, usually unique, group of species [30].
While high turnover rates usually produce regular patterns of a distance–decay process (i.e., dissimilarity in communities is strongly connected with physical distance), some studies also stress that the distribution of spiders is also tightly connected with microhabitat conditions (mainly type of vegetation) [31,79], which diminishes the intensity of the relation between similarity and distance. This indicates that most species do not seem to face dispersal limitation, and thus beta diversity patterns would be more influenced by local processes, such as resource availability and microclimates, as well as historical factors [30].

4.4. Montane Spider Conservation

The conservation of spider mountain fauna should be considered a priority, based on theirhigh diversity and endemism levels; characteristics confirmed by our results and by the literature. The fauna from high elevations is particularly sensitive, as they usually present a restrict distribution [69,80] and are habitat specialists, two characteristics associate with extinction proneness [81,82,83]. A small range size increases the chance of population reduction and eventual extinction, and the specialization to a particular type of microhabitat tend to make a species be more sensitive to environmental changes [84].
A conservationist focus should also be stimulated due to the fact that the ongoing climate crisis will probably enhance negative effects on these communities. Climate change may be considered one of the worst human-induced environmental changes, due to its irreversibility [85]. The warming climate is expected to have negative consequences to the species adapted to the colder (= higher) parts of the gradients. Data from a multitaxa (birds, butterflies, carabidae and staphylinids beetles and spiders) inventory from the Italian Alps Vitterbi [79] simulated a moderate temperature increase on species distribution, and spiders were the group that hadthe most negative response, with a decrease in richness. The higher sensitivity of spider communities was attributed to the fact that spider species had more restricted distribution along the sampling plots, being more dependent on microclimatic conditions. The general results of this study also predicted intense changes in composition for all the groups with increasing air temperature, with detrimental consequences for high-elevation species.
High-elevation faunas are threatened everywhere, but the problem is worse in mountains located in tropical places, such as our study site. Environmental gradients are stronger in tropical mountains, due to the narrower climatic tolerance of tropical biotas when compared with temperate ones [5,13,14], and thus effects of climate change are expected to be more pronounced in the tropics.
The situation of Guayana region highlands, or Pantepui, is of particular concern [86], due both to its equatorial location and the richness and endemism levels of its well-studied flora [19]. The singular topography of this region, with several isolated tabletop mountains reaching above 2000 m, stimulated speciation and produced communities with a high proportion of species endemic toa single mountain [87]. If the spiders follow this pattern, we can suppose that there are a lot of high elevation specialists yet to be found in the mountains of the Pantepui, which, at least for the genus Chrysometa, is a reasonable expectation [69,80].
However, the flora distribution also shows that the habitat of the high elevation specialists could simply “vanish in the air” [88], if the IPCC predictions for this century are accurate. If spiders also follow this pattern, this implies that several potential endemic new species threaten to disappear before they can even be described, stressing the urgency of this problem.

Author Contributions

A.A.N. led the sampling trip, material identification, data analysis and writing. A.D.B. helped in the identification of the material and provided resources and facilities to help this process. G.P.-N. helped with analysis, writing, submission and reviewing process. E.M.V. conceptualized the study and assisted the first author in all the steps of the study, and provided financial and logistical resources. All authors have read and agreed to the published version of the manuscript.

Funding

A.D.B. acknowledges support by Conselho Nacional de Desenvolvimento Científico e Tecnológico (CNPq, grant PQ 303903/2019-8). E.M.V. was supported by a fellowship from the Conselho Nacional de Desenvolvimento Científico e Tecnológico (CNPq, 308040/2017-1). A.A. Nogueira is supported by a post-doc fellowship from PNPD/CAPES, and the filed expedition was financed by a BECA-IEB/Moore Foundation (B/2007/01/BDP/01) fellowship and by a grant from Wildlife Conservation Society (WCS).

Informed Consent Statement

Not applicable.

Data Availability Statement

The material collected was deposited at the collection of the Instituto Nacional de Pesquisas da Amazônia (INPA), at Manaus (AM), and duplicates are deposited at the Instituto Butantan (IBSP), São Paulo (SP) and at the Museu Paraense Emílio Goeldi (MPEG), Belém (PA). The material sampled in this study can be found in the Arachnological Collections of the following scientific museums: Instituto Nacional de Pesquisas da Amazônia, Instituto Butantan e Museu Paraense Emílio Goeldi.

Acknowledgments

We are grateful to Tomé, Mário, Waldir “Chouriman” Pereira, Nancy Lo-Man-Hung and David Candiani, for their invaluable help in the field. The first author also thanks the PPGEco-INPA, the 5°PEF Maturacá, a frontier squad from the Brazilian army for logistic help, the IBAMA/ICMBio and PARNA Pico da Neblina for the collecting license (Ibama-Sisbio 10560–1), and FUNAI and the Ayrca, a local Yanomami association, for receiving us at the Yanomami Indigenous Land.

Conflicts of Interest

The authors declare no conflict of interest.

References

  1. Whittaker, R.H. Vegetation of the Siskiyou Mountains, Oregon and California. Ecol. Monogr. 1960, 30, 279–338. [Google Scholar] [CrossRef]
  2. McCain, C.M. Elevational gradients in diversity of small mammals. Ecology 2005, 86, 366–372. [Google Scholar] [CrossRef]
  3. McCain, C.M. Area and mammalian elevational diversity. Ecology 2007, 88, 76–86. [Google Scholar] [CrossRef]
  4. McCain, C.M. Could temperature and water availability drive elevational species richness patterns? A global case study for bats. Glob. Ecol. Biogeogr. 2007, 16, 1–13. [Google Scholar] [CrossRef]
  5. Janzen, D.H. Why mountain passes are higher in the tropics? Am. Nat. 1967, 101, 233–249. [Google Scholar] [CrossRef]
  6. Lomolino, M.K. Elevation gradients of species-density: Historical and prospective views. Glob. Ecol. Biogeogr. 2001, 10, 3–13. [Google Scholar] [CrossRef]
  7. Sanders, N.J.; Lessard, J.P.; Fitzpatrick, M.C.; Dunn, R.R. Temperature, but not productivity orgeometry, predicts elevational diversitygradients in ants across spatial grains. Glob. Ecol. Biogeogr. 2007, 16, 640649. [Google Scholar] [CrossRef]
  8. Orme, C.D.L.; Davies, R.G.; Burgess, M.; Eigenbrod, F.; Pickup, N.; Olson, V.A. Global hotspots of species richness are not congruent with endemism or threat. Nature 2005, 436, 1016–1019. [Google Scholar] [CrossRef]
  9. Rahbek, C. The role of spatial scale and the perception of large-scale species-richness patterns. Ecol. Lett. 2005, 8, 224–239. [Google Scholar] [CrossRef]
  10. Lieberman, D.; Lieberman, M.; Peralta, R.; Hartshorn, G.S. Tropical forest structure and composition on a largescale elevational gradient in Costa Rica. J. Ecol. 1996, 84, 137–152. [Google Scholar] [CrossRef]
  11. Vazquez, J.A.; Givnish, T.J. Elevational gradients in tropical forest composition, structure, and diversity in the Sierra de Manantla´n. J. Ecol. 1998, 86, 999–1020. [Google Scholar]
  12. Brehm, G.; Homeier, J.; Fiedler, K. Beta diversity of geometrid moths (Lepidoptera: Geometridae) in an Andean montane rainforest. Div. Distrib. 2003, 9, 351–366. [Google Scholar] [CrossRef]
  13. Ghalambor, C.K.; Huey, R.B.; Martin, P.R.; Tewksbury, J.J.; Wang, G. Are mountain passes higher in the tropics? Janzens hypothesis revisited. Integr. Comp. Biol. 2006, 46, 5–17. [Google Scholar] [CrossRef] [Green Version]
  14. McCain, C.M. Vertebrate range sizes indicate that mountains may be higher in the tropics. Ecol. Lett. 2009, 12, 550–560. [Google Scholar] [CrossRef]
  15. Patterson, B.D.; Stotz, D.F.; Solari, S.; Fitzpatrick, J.W. Contrasting patterns of elevational zonation for birds and mammals in the Andes of southeastern Peru. J. Biogeogr. 1998, 25, 593–607. [Google Scholar] [CrossRef] [Green Version]
  16. Jankowski, J.E.; Ciecka, A.L.; Meyer, N.Y.; Rabenold, K.N. Beta diversity along environmental gradients: Implications of habitat specialization in tropical montane landscapes. J. Anim. Ecol. 2009, 78, 315–327. [Google Scholar] [CrossRef] [PubMed]
  17. Willard, D.E.; Foster, M.S.; Barrowclough, G.F.; Dickerman, R.W.; Cannell, P.F.; Coats, S.L.; Cracraft, J.L.; O’Neill, J.P. The Birds of Cerro de la Neblina. Fieldiana 1991, 65, 27–51. [Google Scholar]
  18. Huber, O. Geographical and physical features. In Flora of the Venezuelan Guayana; Berry, P.E., Holst, B.K., Yatskievych, K., Eds.; Missouri Botanical Garden Press: St. Louis, MO, USA, 1995; Volume 1, pp. 161–191. [Google Scholar]
  19. Berry, P.E.; Riina, R. Insights into the diversity of the Pantepui flora and the biogeographic complexity of the Guayana Shield. Biol. Skr. 2005, 55, 145–167. [Google Scholar]
  20. Rull, V.; Nogué, S. Potential migration routes and barriers for vascular plants of the Neotropical Guyana Highlands during the Quaternary. J. Biogeogr. 2007, 4, 1327–1341. [Google Scholar] [CrossRef]
  21. Scharff, N.; Coddington, J.A.; Griswold, C.E.; Hormiga, G.; Bjorn, P.D.P. When to quit? Estimating spider species richness in a northern European deciduos forest. J. Arachnol. 2003, 31, 246–273. [Google Scholar] [CrossRef]
  22. Cardoso, P.; Arnedo, M.A.; Triantis, K.A.; Borges, P.A.V. Drivers of diversity in Macaronesian spiders and the role of species extinctions. J. Biogeogr. 2010, 37, 1034–1046. [Google Scholar] [CrossRef] [Green Version]
  23. World Spider Catalog. World Spider Catalog. Version 22.5; Natural History Museum Bern: Bern, Switzerland, 2021; Available online: http://wsc.nmbe.ch (accessed on 12 October 2021). [CrossRef]
  24. Coddington, J.A.; Griswold, C.E.; Silva, D.; Larcher, L. Designing and testing sampling protocols to estimate biodiversity in tropical ecosystems. In The Unity of Evolutionary Biology: Proceedings of the Fourth International Congress of Systematic and Evolutionary Biology, College Park, MD, USA, 30 June–7 July 1991; Dioscorides Press: Portland, OR, USA, 1991; pp. 44–60. [Google Scholar]
  25. Janzen, D.H.; Ataroff, M.; Farinas, M.; Reyes, S.; Rincon, N.; Soler, A.; Soriano, P.; Vera, M. Changes in the arthropod community along an elevational transect in the Venezuelan Andes. Biotropica 1976, 8, 193–203. [Google Scholar] [CrossRef] [Green Version]
  26. Robinson, J.V. The effect of architectural variation in habitat on a spider community: An experimental field study. Ecology 1981, 62, 73–80. [Google Scholar] [CrossRef]
  27. Greenstone, M.H. Determinants of web spider species diversity: Vegetation structural diversity vs. prey availability. Oecologia 1984, 62, 299304. [Google Scholar] [CrossRef] [PubMed]
  28. Ferreira-Ojeda, L.; Florez-Daza, E. Arañas orbitelares (Araneae: Orbiculariae) em tres formaciones vegetales de la Sierra Nevada de Santa Marta (Magdalena, Colombia). Rev. Iber. Aracnol. 2007, 16, 3–16. [Google Scholar]
  29. Chatzaki, M.; Lymberakis, P.; Markakis, G.; Mylonas, M. The distribution of ground spiders (Araneae, Gnaphosidae) along the elevational gradient of Crete, Greece: Species richness, activity and elevational range. J. Biogeogr. 2005, 32, 813–831. [Google Scholar] [CrossRef]
  30. Foord, S.H.; Dippenaar-Schoeman, A.S. The effect of elevation and time on mountain spider diversity: A view of two aspects in the Cederberg mountains of South Africa. J. Biogeogr. 2016, 43, 2354–2365. [Google Scholar] [CrossRef]
  31. Malumbres-Olarte, J.; Crespo, L.; Cardoso, P.; Szűts, T.; Fannes, W.; Pape, T.; Scharff, N. The same but different: Equally megadiverse but taxonomically variant spider communities along an elevational gradient. Acta Oecolog. 2018, 88, 19–28. [Google Scholar] [CrossRef]
  32. Miller, J.A.; Griswold, C.E.; Yin, C.M. The symphytognathoid spiders of the Gaoligongshan, Yunnan, China (Araneae, Araneoidea): Systematics and diversity of micro-orbweavers. ZooKeys 2009, 11, 9–195. [Google Scholar] [CrossRef]
  33. Tanasevitch, A.V. A new Palliduphantes Saaristo & Tanasevitch, 1996 from the Elburz Mountains, Iran (Araneae: Linyphiidae). Zool. Mid. East 2017, 63, 172–175. [Google Scholar]
  34. Dimitrov, D. A review of the linyphiid spider genus Proislandiana Tanasevitch, 1985 with description of a new high mountainous species from Turkey and Armenia (Araneae: Linyphiidae). Zootaxa 2020, 4743, 247–256. [Google Scholar] [CrossRef] [PubMed]
  35. RADAM. Folha NA19. Pico da Neblina; Ministério das Minas e Energia: Rio de Janeiro, Brazil, 1978.
  36. Pires, J.M.; Prance, T.G. The vegetation types of the Brazilian Amazon. In Key Environments: Amazonia; Prance, G.T., Lovejoy, T.E., Eds.; Pergamon Press: Oxford, UK, 1985; pp. 109–145. [Google Scholar]
  37. Berry, P.E.; Huber, O.; Holst, B.K. Introduction. Floristic analysis and phytogeography. In Flora of the Venezuelan Guayana; Berry, P.E., Holst, B.K., Yatskievych, K., Eds.; Missouri Botanical Garden Press: St. Louis, MO, USA, 1995; Volume 1, pp. 161–191. [Google Scholar]
  38. Jost, L. Entropy and diversity. Oikos 2006, 113, 363–375. [Google Scholar] [CrossRef]
  39. Jost, L. Partitioning diversity into independent alpha and beta components. Ecology 2007, 88, 2427–2439. [Google Scholar] [CrossRef] [PubMed] [Green Version]
  40. Berger, W.H.; Parker, F.L. Diversity of planktonic foraminifera in deep-sea sediments. Science 1970, 168, 1345–1347. [Google Scholar] [CrossRef] [PubMed]
  41. Kruskal, J.B. Nonmetric multidimensional scaling: A numerical method. Psychometrika 1964, 29, 115–129. [Google Scholar] [CrossRef]
  42. Fasham, M.J.R. A comparison of nometric multidimentsional scaling, principal components and reciprocal averaging for the ordination of simulated coenoclines, and coenoplanes. Ecology 1977, 58, 551–561. [Google Scholar] [CrossRef]
  43. Kenkel, N.C.; Orlóci, L. Applying metric and nonmetric multidimensional scaling to ecological studies: Some new results. Ecology 1986, 67, 919–928. [Google Scholar] [CrossRef]
  44. Brehm, G.; Konrad Fiedler, K. Ordinating tropical moth ensembles from an elevational gradient: A comparison of common methods. J. Trop. Ecol. 2004, 20, 165–172. [Google Scholar] [CrossRef]
  45. Smouse, P.E.; Long, J.C.; Sokal, R.R. Multiple regression and correlation extensions of the Mantel test of matrix correspondence. System. Zool. 1986, 35, 627–632. [Google Scholar] [CrossRef]
  46. Legendre, P. Comparison of permutation methods for the partial correlation and partial Mantel tests. J. Statist. Comput. Simul. 2000, 67, 37–73. [Google Scholar] [CrossRef]
  47. Clarke, K.R. Non-parametric multivariate analyses of changes in community structure. Austr. J. Ecol. 1993, 18, 117–143. [Google Scholar] [CrossRef]
  48. Dufrêne, M.; Legendre, P. Species assemblages and indicator species: The need for a fl exible asymetrical approach. Ecol. Monogr. 1997, 67, 345–366. [Google Scholar]
  49. Colwell, R.K. EstimateS: Statistical Estimation of Species Richness and Shared Species from Samples. Version 8.2. User’s Guide and Application. 2009. Available online: http://purl.oclc.org/estimates (accessed on 1 November 2010).
  50. Hammer, O.; Harper, D.A.T.; Ryan, P.D. PAST: Paleontological Statistics Software Package for Education and Data Analysis. Palaeontol. Electron. 2001, 4, 9. [Google Scholar]
  51. R Core Team. R: A Language and Environment for Statistical Computing. R Foundation for Statistical Computing, Vienna, Austria. 2020. Available online: https://www.R-project.org/ (accessed on 2 October 2011).
  52. Rosenberg, M.S. PASSAGE. Pattern Analysis, Spatial Statistics, and Geographic Exegesis. Version 1.0.; Department of Biology, Arizona State University: Tempe, AZ, USA, 2001. [Google Scholar]
  53. McCune, B.; Mefford, M.J. PC-ORD: Multivariate Analysis of Ecological Data. Version 5·12; MjM Software: Gleneden Beach, OR, USA, 1999. [Google Scholar]
  54. Nogueira, A.A.; Venticinque, E.M.; Brescovit, A.D.; Lo-Man-Hung, N.F.; Candiani, D.F. List of species of spiders (Arachnida, Araneae) from the Pico da Neblina, state of Amazonas, Brazil. Check List 2014, 10, 1044–1060. [Google Scholar] [CrossRef]
  55. Choi, S.W.; Jeong-Seop, N.A. Elevational distribution of moths (Lepidoptera) in Mt. Jirisan National Park, South Korea. European. J. Entom. 2010, 107, 229–245. [Google Scholar]
  56. McGill, B.J.; Etienne, R.S.; Gray, J.S.; Alonso, D.; Anderson, M.J.; Benecha, H.K.; White, E.P. Species abundance distributions: Moving beyond single prediction theories to integration within an ecological framework. Ecol. Lett. 2007, 10, 995–1015. [Google Scholar] [CrossRef] [PubMed]
  57. Hurlbert, A.H. Species–energy relationships and habitat complexity in bird communities. Ecol. Lett. 2004, 7, 714–720. [Google Scholar] [CrossRef]
  58. MacArthur, R.H.; Diamond, J.M.; Karr, J.R. Density compensation in island faunas. Ecology 1972, 53, 330–342. [Google Scholar] [CrossRef]
  59. Longino, J.T.; Colwell, R.K. Density compensation, species composition, and richness of ants on a neotropical elevational gradient. Ecosphere 2011, 2, 1–20. [Google Scholar] [CrossRef]
  60. Halaj, J.; Ross, D.W.; Moldenke, A.R. Habitat structure and prey availability as predictors of the abundance and community. J. Arachnol. 1998, 26, 203–220. [Google Scholar]
  61. Toti, D.S.; Coyle, F.A.; Miller, J.A. A structured inventory of Appalachian grass bald and heath bald spider assemblages and a test of species richness estimator performance. J. Arachnol. 2000, 28, 329–345. [Google Scholar] [CrossRef]
  62. Nogueira, A.A.; Pinto-da-Rocha, R.; Brescovit, A.D. Comunidade de aranhas orbitelas (Arachnida-Araneae) na região da Reserva Florestal do Morro Grande, Cotia, São Paulo, Brasil. Biota Neotrop. 2006, 6, 1–24. [Google Scholar] [CrossRef]
  63. Lo-Man-Hung, N.F.; Gardner, T.A.; Ribeiro-Júnior, M.A.; Barlow, J.; Bonaldo, A.L. The value of primary, secondary, and plantation forests for Neotropical epigeic arachnids. J. Arachnol. 2008, 36, 394–401. [Google Scholar] [CrossRef]
  64. Bosmans, R.; Maelfait, J.P.; De Kimpe, A. Analysis of the spider communities in an elevational gradient in the French and Spanish Pyrenees. Bull. Brit. Arachnol. Soc. 1986, 7, 69–76. [Google Scholar]
  65. Davis, A.L.V.; Scholtz, C.H.; Chown, S.L. Species turnover, community boundaries and biogeographical composition of dung beetle assemblages across an elevational gradient in South Africa. J. Biogeogr. 1999, 26, 1039–1055. [Google Scholar] [CrossRef]
  66. Bach, K.; Kessler, M.; Gradstein, S.R. A simulation approach to determine statistical significance of species turnover peaks in a species-rich tropical cloud forest. Div. Distrib. 2007, 13, 863–870. [Google Scholar] [CrossRef]
  67. Wu, F.; Yang, X.J.; Yang, J.X. Additive diversity partitioning as a guide to regional montane reserve design in Asia: An example from Yunnan Province, China. Div. Distrib. 2010, 16, 1022–1033. [Google Scholar] [CrossRef]
  68. Höfer, H.; Brescovit, A.D. Species and guild structure of a Neotropical spider assemblage (Araneae) from Reserva Ducke, Amazonas, Brazil. Andrias 2001, 15, 99–119. [Google Scholar]
  69. Nogueira, A.A.; Pena-Barbosa, J.P.P.; Venticinque, E.M.; Brescovit, A.D. The spider genus Chrysometa (Araneae, Tetragnathidae) from the Pico da Neblina and Serra do Tapirapecó mountains (Amazonas, Brazil): New species, new records, diversity and distribution along two elevational gradients. Zootaxa 2011, 2772, 33–51. [Google Scholar] [CrossRef]
  70. Turnbull, A.L. Ecology of the true spiders (Araneomorphae). Annual. Rev. Entomol. 1973, 18, 305–348. [Google Scholar] [CrossRef]
  71. Jetz, W.; Rahbek, C.; Colwell, R.C. The coincidence of rarity and richness and the potential signature of history in centres of endemism. Ecol. Lett. 2004, 7, 1180–1191. [Google Scholar] [CrossRef]
  72. Melo, A.S.; Rangel, T.F.L.V.B.; Diniz-Filho, J.A.F. Environmental drivers of beta-diversity patterns in New-World birds and mammals. Ecography 2009, 32, 226–236. [Google Scholar] [CrossRef]
  73. Polotow, D.; Griswold, C. Chinja, a new genus of spider from the Eastern Arc Mountains of Tanzania (Araneae, Zoropsidae). Zootaxa 2018, 4472, 545–562. [Google Scholar] [CrossRef]
  74. Steinbauer, M.J.; Field, R.; Grytnes, J.A.; Trigas, P.; Ah-Peng, C.; Attorre, F.; Beierkuhnlein, C. Topography-driven isolation, speciation and a global increase of endemism with elevation. Glob. Ecol. Biogeogr. 2016, 25, 1097–1107. [Google Scholar] [CrossRef]
  75. Chaladze, G.; Otto, S.; Tramp, S. A spider diversity model for the Caucasus Ecoregion. J. Insect Conserv. 2014, 18, 407–416. [Google Scholar] [CrossRef]
  76. Deltshev, C.; Komnenov, M.; Blagoev, G.; Georgiev, T.; Lazarov, S.; Stojkoska, E.; Naumova, M. Faunistic Diversity of Spiders (Araneae) in Galichitsa Mountain (FYR Macedonia). Biodiv. Data J. 2013, 1, e977. [Google Scholar] [CrossRef] [PubMed]
  77. McDiarmid, R.W.; Donnelly, M.A. Herpetofauna of the Guyana Highlands: Amphibians and Reptiles of the Lost World. In Ecology and Evolution in the TropicsA Herpetological Perspective; Donnelly, M.A., Crother, B.I., Guyer, C., Wake, M.H., White, M.E., Eds.; The Univestity of Chicago Press: Chicago, IL, USA, 2005; 584p. [Google Scholar]
  78. Aisen, S.; Werenkraut, V.; Márquez, M.E.G.; Ramírez, M.J.; Ruggiero, A. Environmental heterogeneity, not distance, structures montane epigaeic spider assemblages in north-western Patagonia (Argentina). J. Insect Conserv. 2017, 21, 951–962. [Google Scholar] [CrossRef]
  79. Viterbi, R.; Cerrato, C.; Bionda, R.; Provenzale, A. Effects of temperature rise on multi-taxa distributions in mountain ecosystems. Diversity 2020, 12, 210. [Google Scholar] [CrossRef]
  80. Levi, H.W. The Neotropical orb-weaver genera Chrysometa and Homalometa (Araneae: Tetragnathidae). Bull. Mus. Comp. Zool. 1986, 151, 91–215. [Google Scholar]
  81. Henle, K.; Davies, K.F.; Kleyer, M.; Margules, C.; Settele, J. Predictors of Species Sensitivity to Fragmentation. Biodiv. Conserv. 2004, 13, 207–251. [Google Scholar] [CrossRef]
  82. Dunn, R.R. Modern insect extinctions, the neglected majority. Conserv. Biol. 2005, 19, 130–136. [Google Scholar] [CrossRef]
  83. Laurance, W.F.; Lovejoy, T.E.; Vasconcelos, H.L.; Bruna, E.M.; Didham, R.K.; Stouffer, P.C.; Gascon, C.; Bierregard, R.O.; Laurance, S.G.; Sampaio, E. Ecosystem decay of amazonian forest fragments: A 22-year investigation. Conserv. Biol. 2002, 16, 605–618. [Google Scholar] [CrossRef] [Green Version]
  84. Dirnböck, T.; Essel, F.; Rabitsch, W. Disproportional risk for habitat loss of high-altitude endemic species under climate change. Glob. Chang. Biol. 2011, 17, 990–996. [Google Scholar] [CrossRef]
  85. Kuntner, M. Climate change and spider biodiversity: Redefining araneological research priorities. Crop Protect. 2014, 61, 109. [Google Scholar] [CrossRef]
  86. Rull, V.; Vegas-Vilarrúbia, T.; Nogué, S.; Huber, O. Conservation of the unique neotropical vascular flora of the Guayana Highlands in the face of global warming. Conserv. Biol. 2009, 23, 1323–1327. [Google Scholar] [CrossRef] [PubMed]
  87. Nogué, S.; Rull, V.; Vegas-Vilarrúbia, T. Elevational gradients in the neotropical table mountains: Patterns of endemism and implications for conservation. Diver. Distrib. 2013, 19, 676–687. [Google Scholar] [CrossRef]
  88. Rull, V.; Vegas-Vilarr´ubia, T. Unexpected biodiversity loss under globalwarming in the Neotropical Guayana Highlands. Glob. Chang. Biol. 2006, 12, 1–9. [Google Scholar] [CrossRef] [Green Version]
Figure 1. Study area. (A) South America; (B) northern South America (rectangle of map A, enlarged). The mountain range at the left of the map represents the northern part of the Andes, and the mountainous region in the center of the map is the Guayana Shield, showing the study area in its southern part, and dotted yellow line represents the equator. (C) Closer view of the study area (rectangle of map B enlarged), the Pico da Neblina. Letters represent the elevations sampled: A—100 m, B—400 m, C—860 m, D—1550 m, E—2000 m, F—2400 m.
Diversity 13 00620 g001
Figure 2. Rank abundance plot of the spider community for each elevation. Species are ordered by decreasing abundance.
Diversity 13 00620 g002
Figure 3. Results of the partial Mantel test. (a) Relation between elevational difference and beta diversity, controlled by spatial distance.(b) Relation between elevation and Bray–Curtis similarity index, controlled by spatial distance.(c) Relation between Bray–Curtis similarity index and beta diversity, controlled by spatial distance.(d) Relation between Bray–Curtis similarity index and beta diversity, controlled by elevational difference.
Diversity 13 00620 g003
Figure 4. Graphic representation of the first two axes of a NMDS performed for all species of spiders at the 18 sites sampled, in 6different elevations. First axis explained 58% of total variation and second axis 20% Stress = 5.97.
Diversity 13 00620 g004
Table 1. Diversity measures of the spider community from the Pico da Neblina (AM, Brazil).Elevations sampled, S (%S)—richness and proportional richness, N(%N)—abundance and proportional abundance, D—exponential Shannon–Wiener or numbers equivalent, BP dom—Berger–Parker dominance index, % singl/S alt—proportion of singletons in relation to the richness of each elevation, % singl/S tot—proportion of singletons in relation to total number of singletons.
Elevation (m.a.s.l.)S(%S)N(%N)DBP dom% singl/S alt% singl/S tot
100224 (42.4)688 (21.9)142.740.0348.2132.49
400194 (36.7)590 (18.8)98.590.0951.0324.87
860171 (32.4)713 (22.7)82.020.0943.8616.75
1550115 (21.8)597 (19)61.680.0741.7414.21
200069 (13.1)295 (9.4)26.310.2150.7210.66
240024 (4.5)257 (8.2)6.100.5337.51.02
Table 2. Matrix of beta diversity expressed in number equivalents (D beta) of the spider community sampled at six elevations at the Pico da Neblina (AM, Brazil). Comparisons between adjacent elevations are shaded in gray.
10040086015502000
4001.50
8601.601.45
15501.901.891.71
20001.801.851.801.65
24001.791.841.761.791.62
Table 3. Results of Mantel and partial Mantel tests performed for the spider community from the Pico da Neblina (AM, Brazil). Comparison—matrix being compared; control—matrix controlled or partial factor; R—Pearson correlation coefficient; P—significance level of the result. BCS—Bray–Curtis Similarity index.
ComparsionControlRP
(Partial)
β diversity × BCSspace−0.8960.0051
β diversity × BCSelevation−0.8240.0018
β diversity × BCS −0.9210.002
β diversity × Elevationspace0.5540.0507
β diversity × Elevation 0.7270.0102
β diversity × Space 0.5760.0532
BCS × Elevationspace−0.8290.0028
BCS × Elevation −0.7970.0014
BCS × Space −0.4940.0964
Table 4. Number of indicator species of spiders, designated by the species indicator analysis, for the three partitions of the gradient, at the Pico da Neblina (AM, Brazil): Lower and Upper half; Guayana region and Elevations. IS—number of species assigned as significant (p < 0.05) indicators; S—total richness of the category;% IS—proportional number of indicator species in relation to richness of categories; aver IV—average indicator value; IV 100—species with indicator value of 100;Total IV—sum of indicator values for each partition.
PartitionCategoryISS% ISAver IVIV 100Total IV
Lower andLH4211038.2683
upper halfUH6629.764.90
Total4815730.668.233272.6
Guayana regionLowlands229622.972.11
Uplands1510314.678.81
Higlands32412.592.91
Total4015725.575.933034.5
Elevations100217229.289.212
40097212.582.34
860128015.080.53
1550195236.590.99
200062030.081.72
240041233.396.63
Total7115745.287.1336183.1
Table 5. Results of species indicator analysis by families. Number of indicator species of spiders for the three partitions of the gradient at the Pico da Neblina (AM, Brazil), by families. Categories: Partition 1, LH—lower half, UH—upper half; Partition 2, L—lowlands, U—uplands, H—highlands. IS—indicator species; S—richness of the families considering only species included in the analysis (at least five individuals).
Partition 1 Partition 2 Partition 3
FamilyCategoryCategoryCategory
IS (S)LHUHIS (S)LUHIS (S)100400860155020002400
Anyphaenidae1 (4) 11 (4) 13 (4) 1 2
Araneidae13 (35)1217 (35)51114 (35)44321
Corinnidae2 (4)2 1 (4) 1 1 (4) 1
Ctenidae4 (6)4 4 (6)22 4 (6) 211
Deinopidae1 (1)1 1 (1) 1
Hahniidae 1 (1) 1
Linyphiidae1 (4) 11 (4) 1 2 (4) 11
Lycosidae1 (1)1 1 (1)1
Mimetidae 3 (6) 2 1
Oonopidae 1 (1) 1
Pholcidae4 (8)4 4 (8)22 3 (8) 12
Pisauridae1 (2)1 1 (2)1 2 (2)2
Salticidae3 (15)3 2 (15)11 5 (15)21 11
Scytodidae 1 (2) 1 1 (2) 1
Senoculidae 1 (1) 1 1 (1) 1
Sparassidae3 (4)3 3 (4)3 2 (4)1 1
Tetragnathidae3 (13)213 (13) 216 (13)2 211
Theridiidae3 (32)215 (32)23 15 (32)6135
Theridiosomatidae3 (5)211 (5)1 3 (5)2 1
Thomisidae1 (2)1 1 (2)1
Uloboridae4 (9)4 3 (9)3 3 (9)2 1
Publisher’s Note: MDPI stays neutral with regard to jurisdictional claims in published maps and institutional affiliations.

