Article

Coral Communities on Marginal High-Latitude Reefs in West Australian Marine Parks

1
Marine Science Program, Biodiversity and Conservation Science, Department of Biodiversity Conservation and Attractions, Kensington 6151, Australia
2
Oceans Institute, University of Western Australia, Crawly 6009, Australia
3
Institute for Marine and Antarctic Studies, University of Tasmania, Hobart 7001, Australia
4
Carijoa (Marine Environmental Consulting), Rivervale 6103, Australia
5
School of Biological Sciences, University of Western Australia, Crawly 6009, Australia
*
Author to whom correspondence should be addressed.
These joint first authors contributed equally to this work.
Diversity 2021, 13(11), 554; https://doi.org/10.3390/d13110554
Submission received: 3 August 2021 / Revised: 25 October 2021 / Accepted: 25 October 2021 / Published: 30 October 2021
(This article belongs to the Special Issue Marginal Reef Systems: Resilience in A Rapidly Changing World)

Abstract

:
Many temperate reefs are experiencing a shift towards a greater abundance of tropical species in response to marine heatwaves and long-term ocean warming worldwide. Baseline data for coral communities growing in high-latitude reefs is required to better understand ecosystem changes over time. In this study, we explore spatial and temporal trends in the distribution of coral communities from 1999 to 2019 at 118 reef sites within the five marine parks located in the south-west of Western Australia (WA) between 30° to 35° S. Our estimates of coral cover were generally low (<5%), except for a few sites in Jurien Bay Marine Park and Rottnest Island Marine Reserve where coral cover was 10% to 30%. Interannual changes in genera assemblages were detected but were not consistent over time, whereas significant temporal increases in coral cover estimates were found at the lowest latitude site in Jurien Bay. Coral assemblages were primarily distinguished by Turbinaria spp. at Marmion Marine Park and Ngari Capes Marine Park, and Pocillopora spp. and Dipsastraea spp. at Rottnest Island and Jurien Bay. Our findings suggest that conditions in south-west WA are favorable to the ongoing survival of existing genera and there were minimal signs of expansion in coral cover at most study sites. Coral cover and composition on these reefs may, however, change with ongoing ocean warming and increased occurrence of marine heatwaves. This study provides a valuable benchmark for assessing future changes in coral assemblages and highlights the need for targeted hard-coral surveys to quantify subtle changes in high-latitude coral community assemblages.

1. Introduction

Marine heatwaves have resulted in major shifts within temperate ecosystems, including the mortality of temperate macroalgae [1,2], seagrass loss [3,4], an influx of tropical species [5], and changes to community structure [6,7]. In addition, the world’s oceans have warmed at a rate of 1.5 °C per century and are expected to continue to increase by 1 to 3 °C by the end of the century with ongoing climate change [8]. Extensive mortality of habitat forming and keystone species combined with ocean warming is resulting in the polewards migration of tropical species and a ‘tropicalization’ of currently temperate ecosystems [9,10,11]. For example, range expansions have been documented for tropical urchin and fish species, particularly in locations where winter temperatures have increased allowing greater overwintering success and survival year-round [7,12,13,14,15]. Similarly, there is growing evidence of various coral species expanding their geographical distributions into high-latitude (above 28° S and below 28° N) reef ecosystems [5,16,17,18,19], particularly to areas that harbour fossil coral reefs from warmer geologic times, such as the Last Interglacial (~130,000 years ago) [20,21]. For instance, reef-building acroporid corals have increasingly been documented in the northern-most reefs of Japan, which were once dominated by seaweeds [18]. Two tropical species of Acropora have been expanding their ranges along the coast of Florida into the northern Gulf of Mexico [16] and range expansions of tropical Acropora spp. have been documented on both the Eastern and Western coasts of Australia [19,22]. Documenting these range shifts is important because they help to understand the processes driving coral reef development and factors that influence coral adaptation and acclimatization.
Ocean warming is expected to increase the suitability of high-latitude environments for coral growth due to the positive effect of temperature on growth and metabolic productivity [23]. This is likely to result in further range shifts and increases in the abundance of tropical coral species at the latitudinal limits of their geographical distributions [18,23]. However, the lower and more seasonally variable light levels at latitudes beyond ~27° are expected to limit the range shifts of many, but not all [24], autotrophic coral species especially at depths below 20 m [25]. Light is critical for coral growth and survival due to production of photosynthetically fixed carbon by the symbiotic dinoflagellate algae that live within the coral tissue [26,27]. The current threshold for coral reef formation, also known as the ‘Darwin Point’, is generally thought to be primarily governed by a combination of temperature, light, and seawater aragonite saturation state [28,29,30]. Most coral reefs are currently restricted to tropical and sub-tropical environments (above 28° S and below 28° N) where temperature, light levels and the aragonite saturation state of seawater are high [30]. There are, however, several coral reefs that occur beyond these limits, including Bermuda in the North Atlantic (32.3° N), Gulf of Mexico (28.2° N), Iki Island in Japan at 33.5° N, Houtman Abrolhos Islands in WA (28.5° S), and Lord Howe Island in eastern Australia (31.5° S) (Table S1). The future suitability of currently marginal, temperate reefs remains in question given that many high-latitude coral reefs have already experienced extensive coral bleaching [31,32,33,34,35] and declines in coral cover [36,37]. High-latitude coral communities are also more likely to suffer from extreme cold-water events, as shown by recent observations of cold-water stress and bleaching on some temperate reefs in Australia during the anomalously cold El Niño winter in 2016 [38,39]. Furthermore, the seawater aragonite saturation state at high-latitude is lower than in the tropics and is expected to decrease with future CO2-driven climate change, potentially making high-latitude regions less suitable for coral growth [40].
In Western Australia, scleractinian coral communities can be found along the entire coastline spanning a latitudinal gradient of ~21 degrees from the Northern Kimberley (~14° S) to the southernmost edge of WA in Albany (~35° S) [41]. The state of WA consists of 24,000 km of coastline and encompasses 19 bioregions across, a range of tropical, sub-tropical, and temperate environments. There are 19 marine parks/reserves in WA, five of which are in the south-west of WA, and include (from north to south), Jurien Bay Marine Park (~30.3° S), Marmion Marine Park (~31.9° S), Rottnest Island Marine Reserve (~32° S), Shoalwater Islands Marine Park (~32.3° S), and Ngari Capes Marine Park (~34.5° S; see Figure 1). The Walpole and Nornalup Inlets Marine Park, situated on the south coast, is an estuarine system and is not considered here, although corals can be found on reefs throughout WA’s south coast [38,42]. Marine parks in the south-west of WA were selected to protect and manage the state’s important and valuable temperate marine ecosystems and biodiversity. Quantifying the current distribution and diversity of coral communities within the marine parks is important for understanding changes to species’ distributions in response to ocean warming and other anthropogenic pressures [43].
The lower-west and south-west regions of WA provide a unique natural laboratory to investigate the current distribution and diversity of coral communities on reefs that occur in a transition zone between sub-tropical and temperate habitats [44]. These regions contain 25 documented coral species and are influenced by the pole-wards flowing Leeuwin Current, which transports warm water and the larvae/recruits of tropical species along the coastline from coral reefs further north [42,45,46]. The Leeuwin Current flow is seasonally strengthened during autumn, which coincides with the annual mass coral spawning event in Western Australia [47,48]. As a result, high-latitude coral communities in WA consist of species with distributions spanning tropical, sub-tropical, and temperate latitudes [41,49]. The southernmost limit for coral reefs in WA is currently the Houtman Abrolhos Islands (28.5° S), although coral communities further south can be extensive with coral cover up to ~50% in some areas (Table S1). There are currently several locations with developed hermatypic coral communities recorded in south-west WA, including Hall Bank [50], Minden and Roe Reefs [51], Rottnest Island [22,52], and Eagle Bay [53]. This signifies potential for the development of more extensive coral communities beyond the limits currently considered suitable for coral reef formation.
Ocean warming in this region is occurring at a rate of 0.013 °C y−1 and record high ocean temperatures caused by a La Niña-driven marine heatwave in the austral summer of 2010/11 [54] resulted in coral bleaching and mortality, fish die-offs, and kelp and seagrass loss [4,35,55]. The 2010/11 heatwave and associated strengthening of the Leeuwin Current also appeared to facilitate range expansions of tropical species, such as fish and coral, to the south-west of WA. At the same time, the loss of kelp (Ecklonia radiata) following the heatwave resulted in competitive release and an associated increase in the establishment of juvenile corals [5,55]. However, the current distribution and diversity of living coral in temperate regions in WA, and the rate at which temperate ecosystems are changing, remains a key knowledge gap [43]. Baseline data to quantify the genus-level composition and per cent cover of coral communities growing at the limits of their geographical distributions in sub-tropical to temperate high-latitude reefs is required to better understand ecosystem changes over time. Here, we explore spatial and temporal trends in the distribution of coral communities within the five marine parks located in the south-west of WA. The aims of this study were to:
(1)
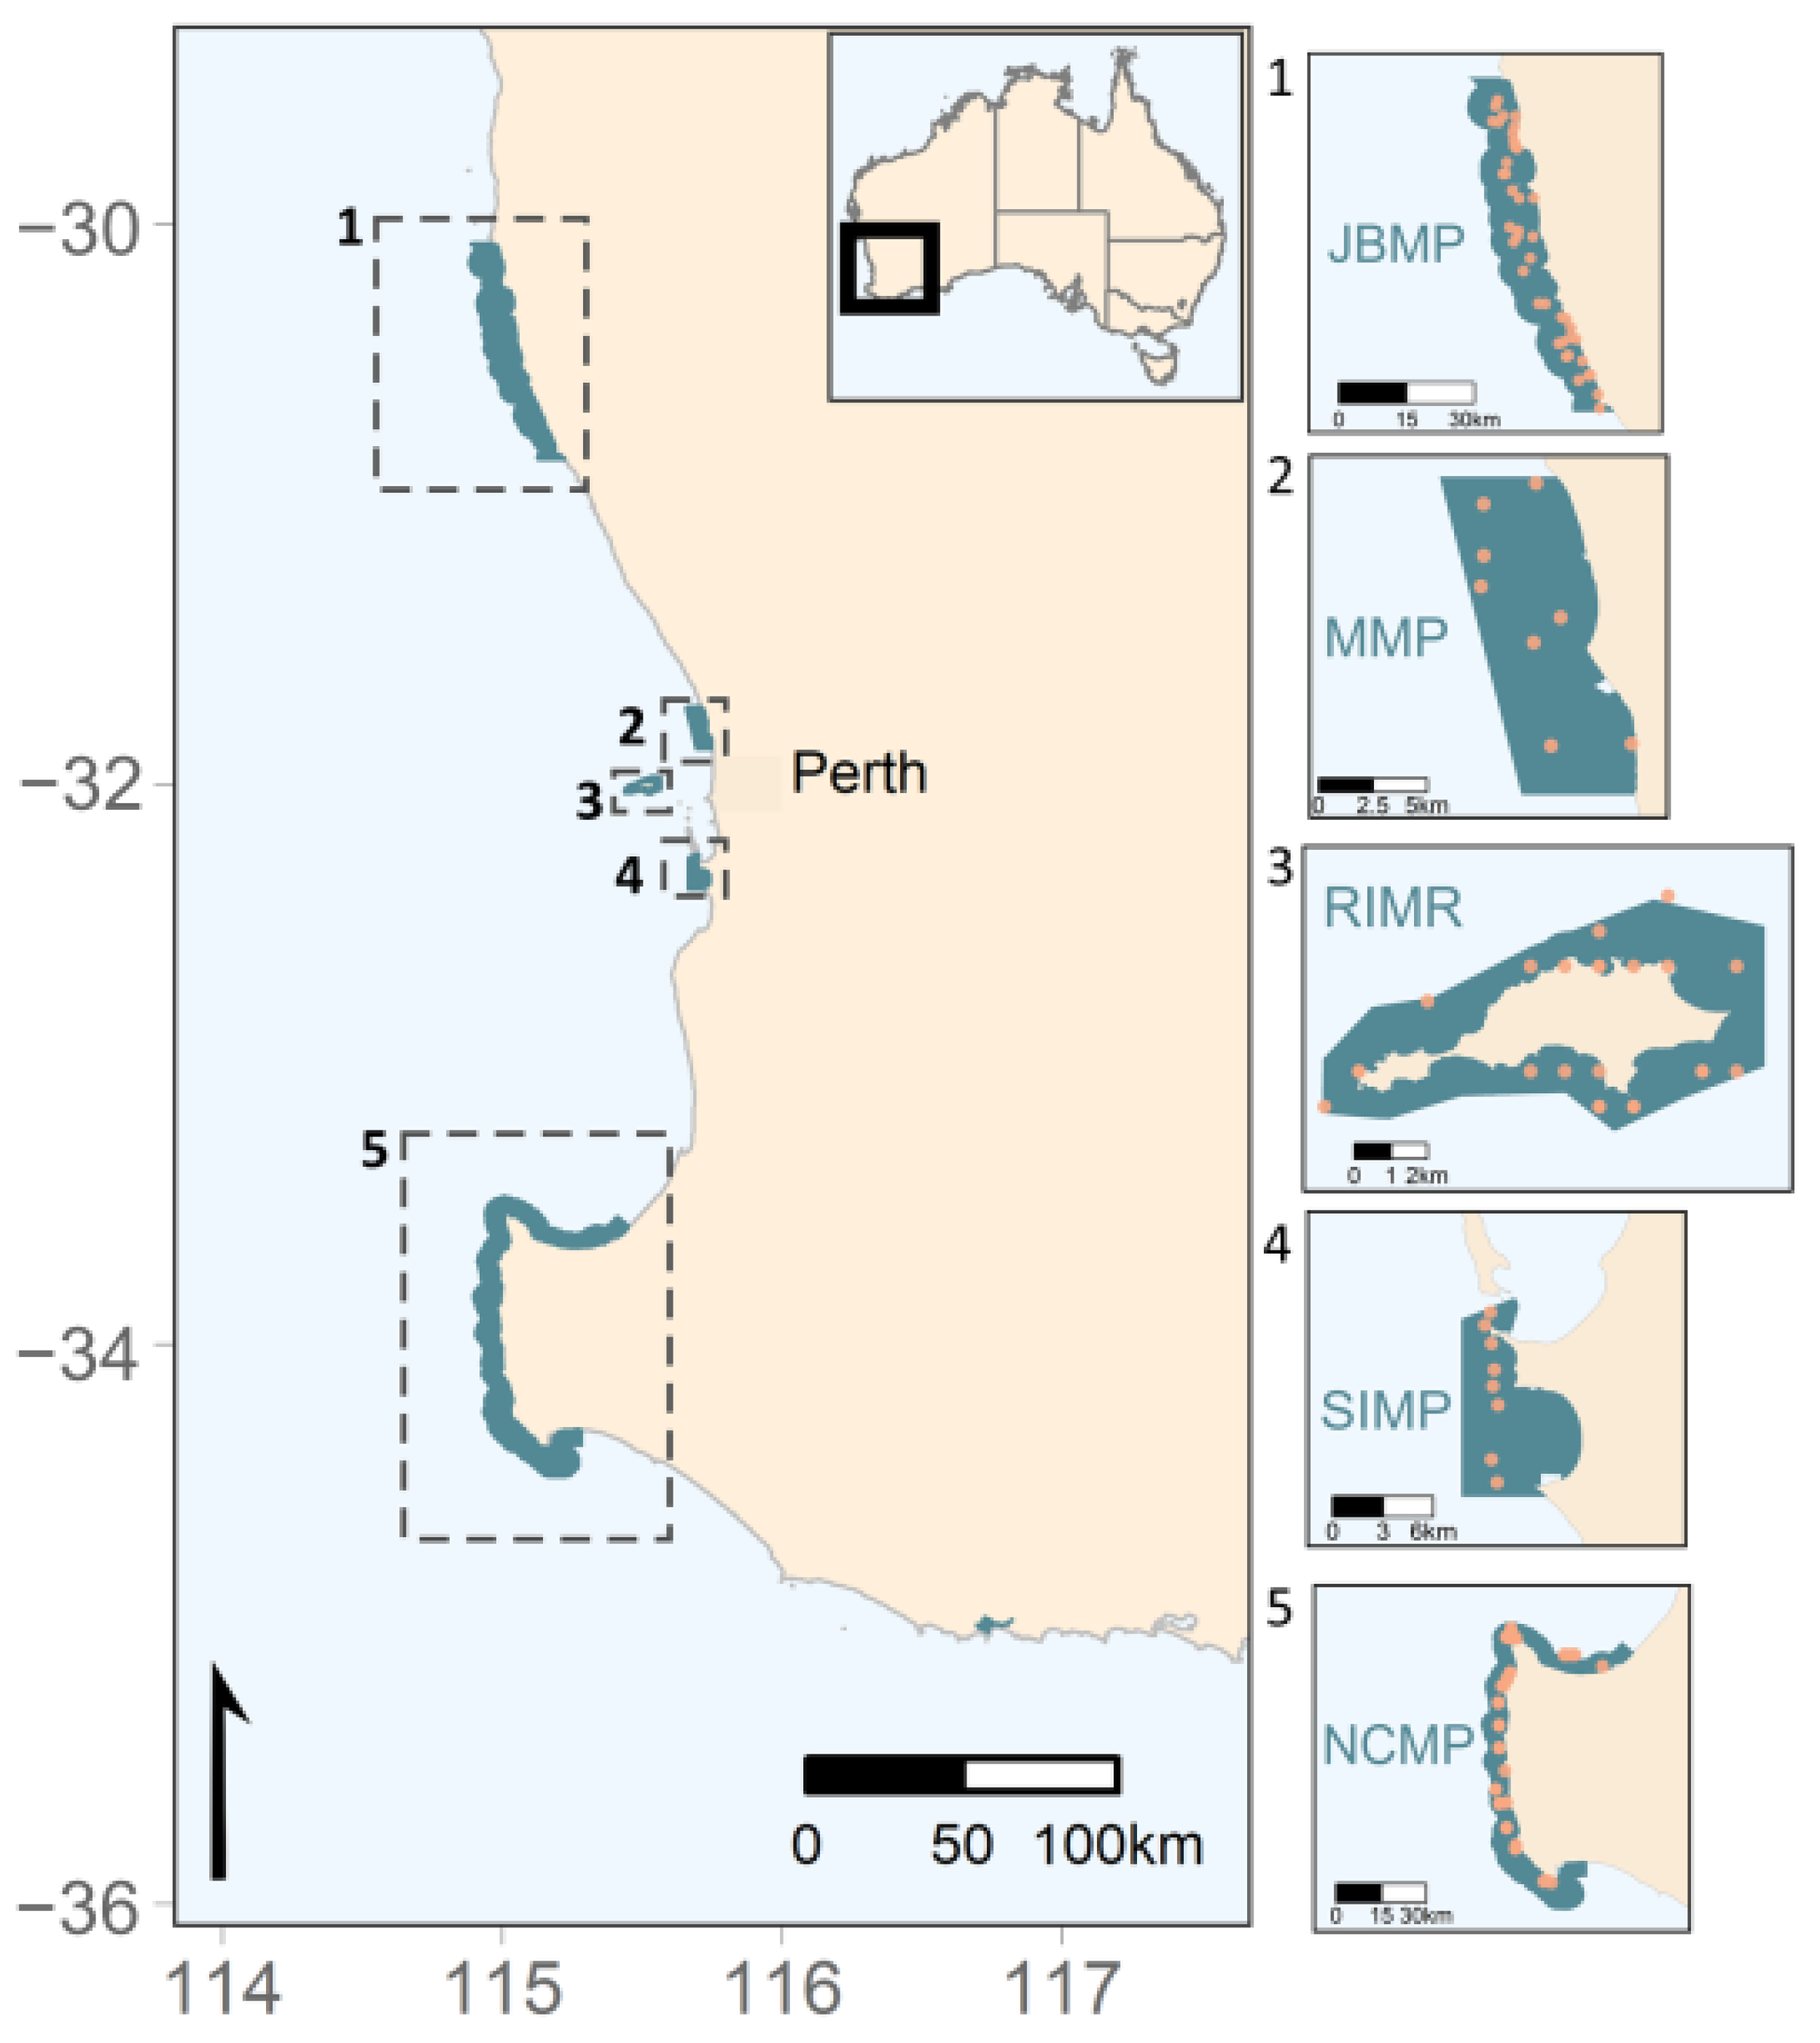
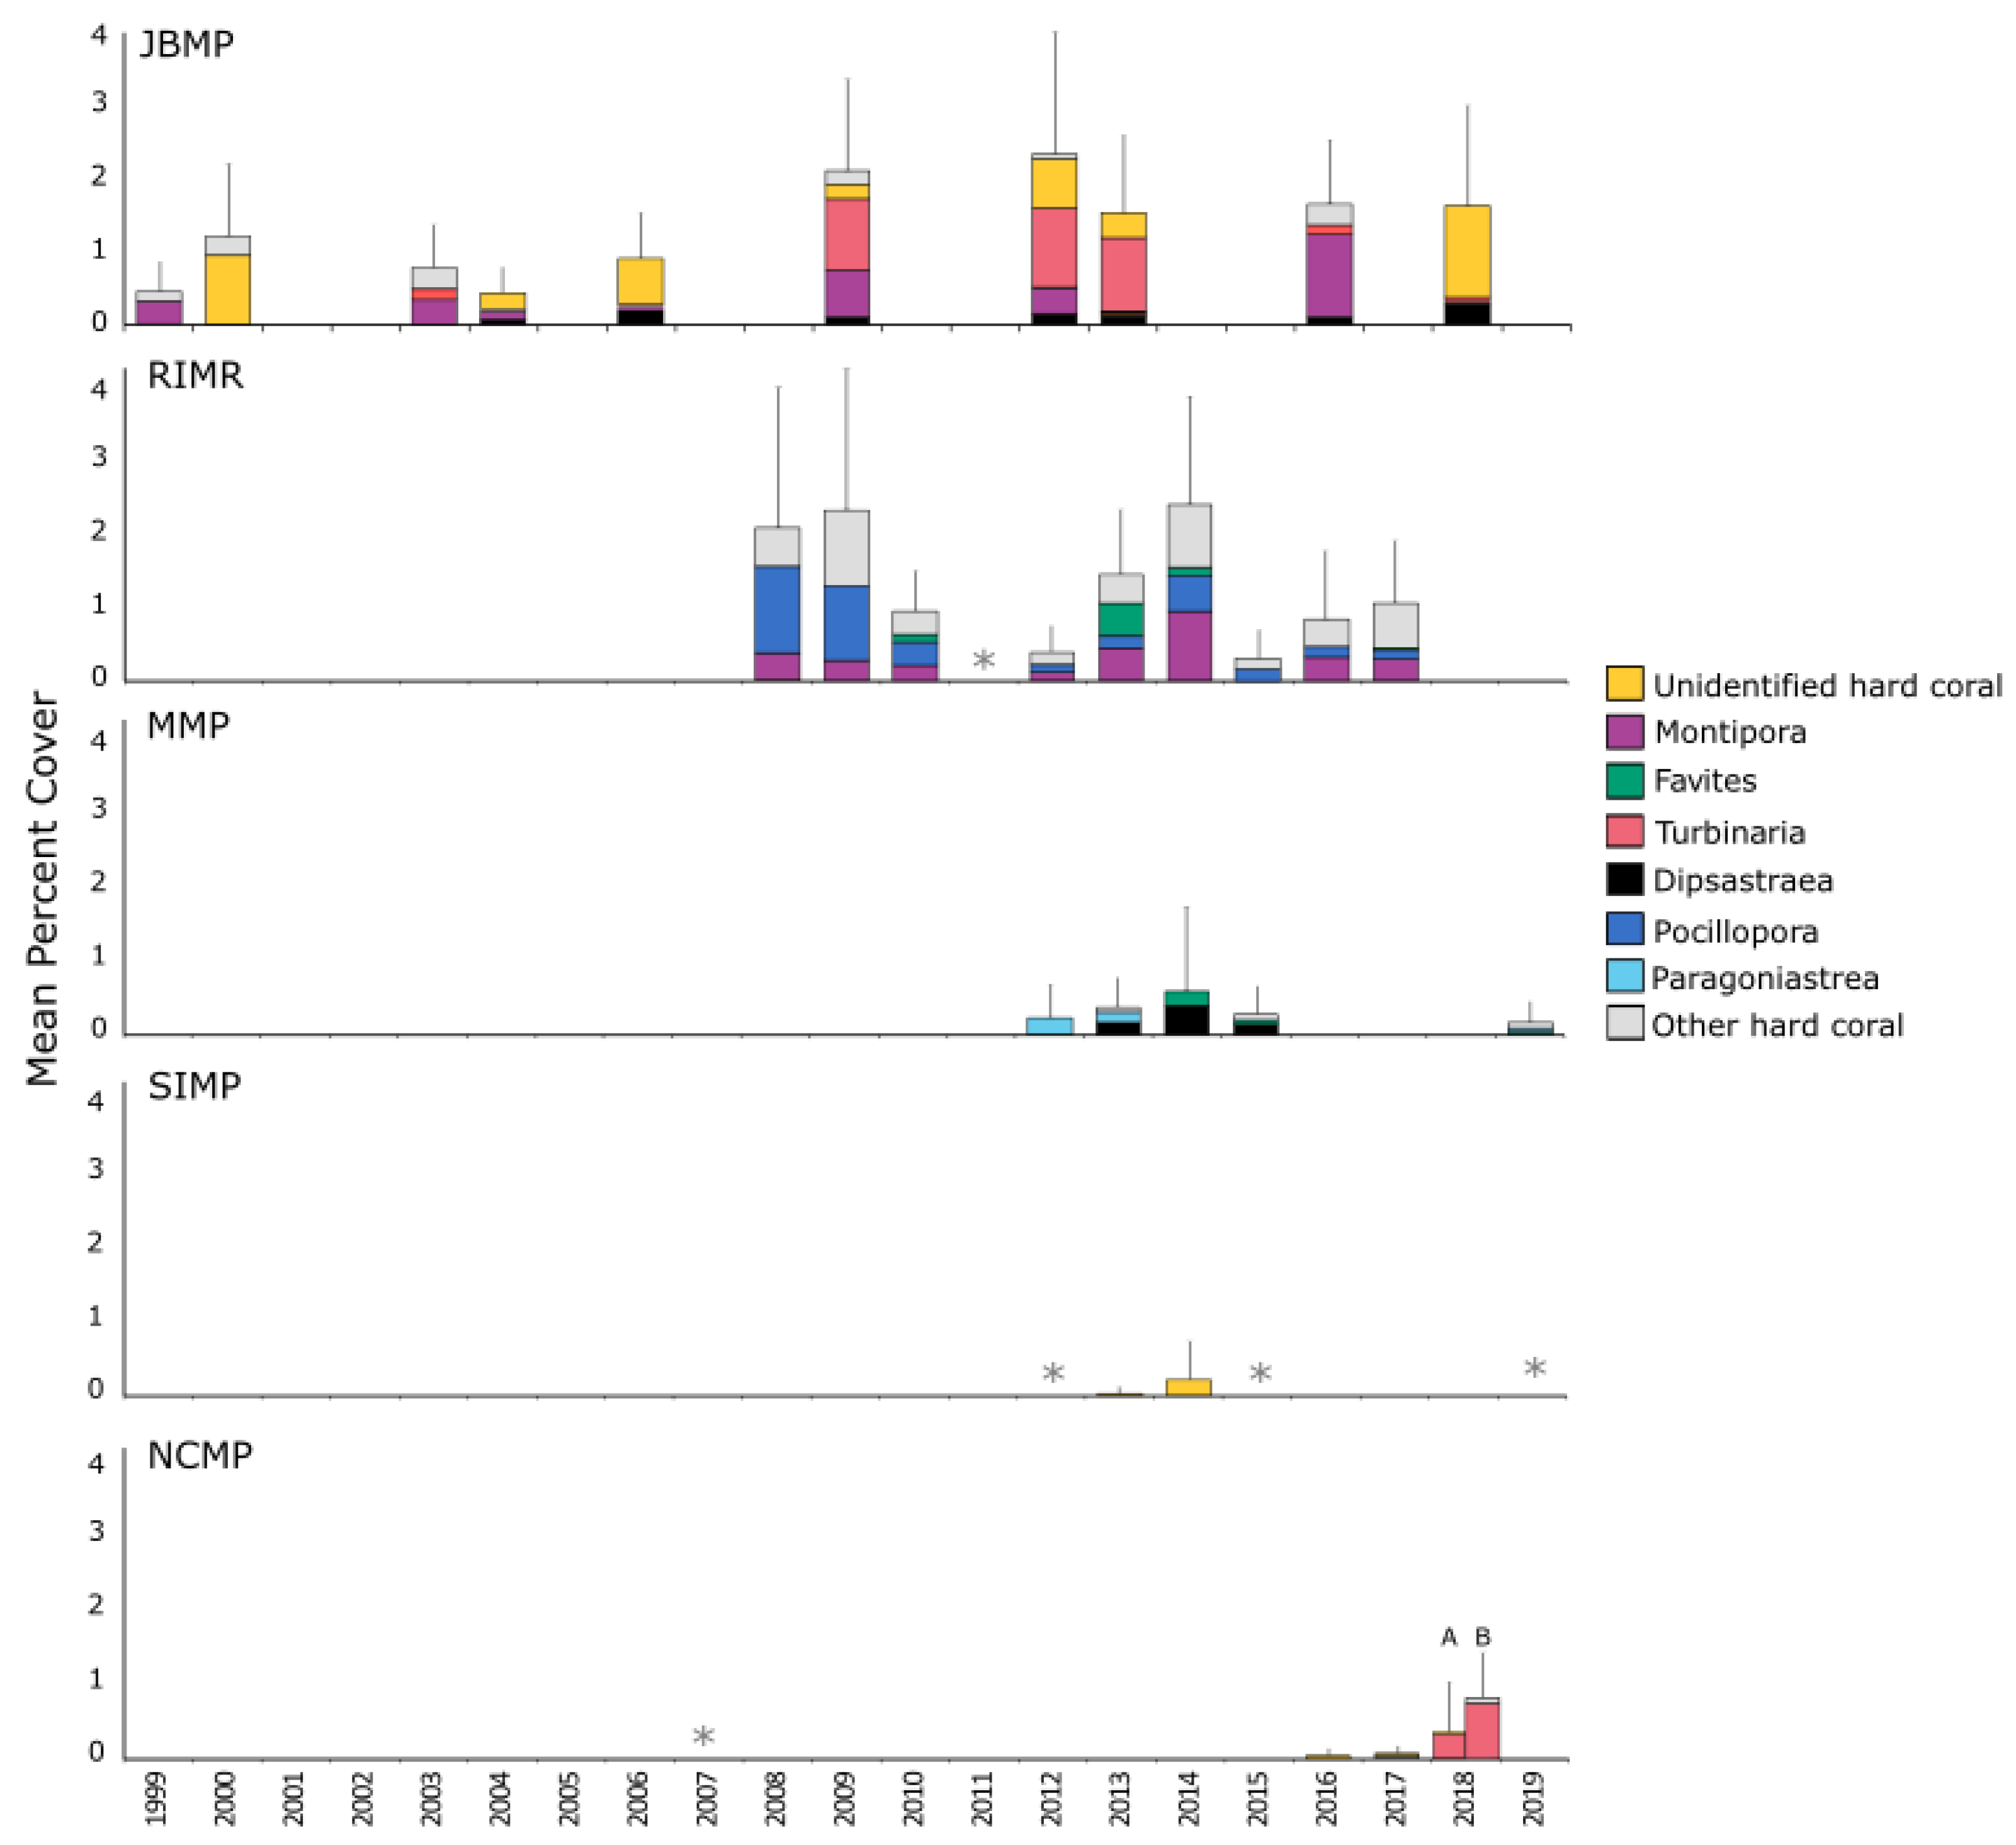
Estimate abundance of hard coral in terms of % cover for five marine parks in the south-west of WA and, where possible, identify temporal trends in total coral coverage between 1999 and 2019;
(2)
Where trends in coral cover estimates are detected, delineate sites that drive these trends within each marine park; and
(3)
Where coral is sufficiently abundant, determine whether the composition of different hard-coral genera vary inter-annually and whether there is a sequential change in coral genera through time, in each marine park.

2. Materials and Methods

2.1. Data Collection and Collation

The West Australian Department of Biodiversity, Conservation, and Attractions (DBCA) oversees the collection of benthic habitat monitoring data throughout the marine parks and reserves created under the Conservation and Land Management Act 1984 and Rottnest Island Authority Act 1987. There are five parks/reserves in the sub-tropical to temperate south-west of the state; Jurien Bay Marine Park (JBMP), Marmion Marine Park (MMP), Rottnest Island Marine Reserve (RIMR), Shoalwater Islands Marine Park (SIMP), and Ngari Capes Marine Park (NCMP) (Figure 1). Within each marine park/reserve, benthic habitat surveying focuses primarily on nearshore limestone and granite reef systems. Coral cover was estimated using point-count classification over quadrats with a finite number of points [56,57,58]. The methods to estimate coral cover and community composition at each location differed in terms of the analysis software used and the number of sites, transects, quadrats, and points per quadrat (Table S2). Different location specific methods were selected separately to ensure continuity with existing long-term datasets that often pre-dated the marine park establishment, facilitating meaningful long-term temporal comparisons. The different methods used at each marine park are summarized in Supplementary Materials Table S2 and the sub-sections below outline the approaches used in each park/reserve to quantify benthic habitat assemblages.

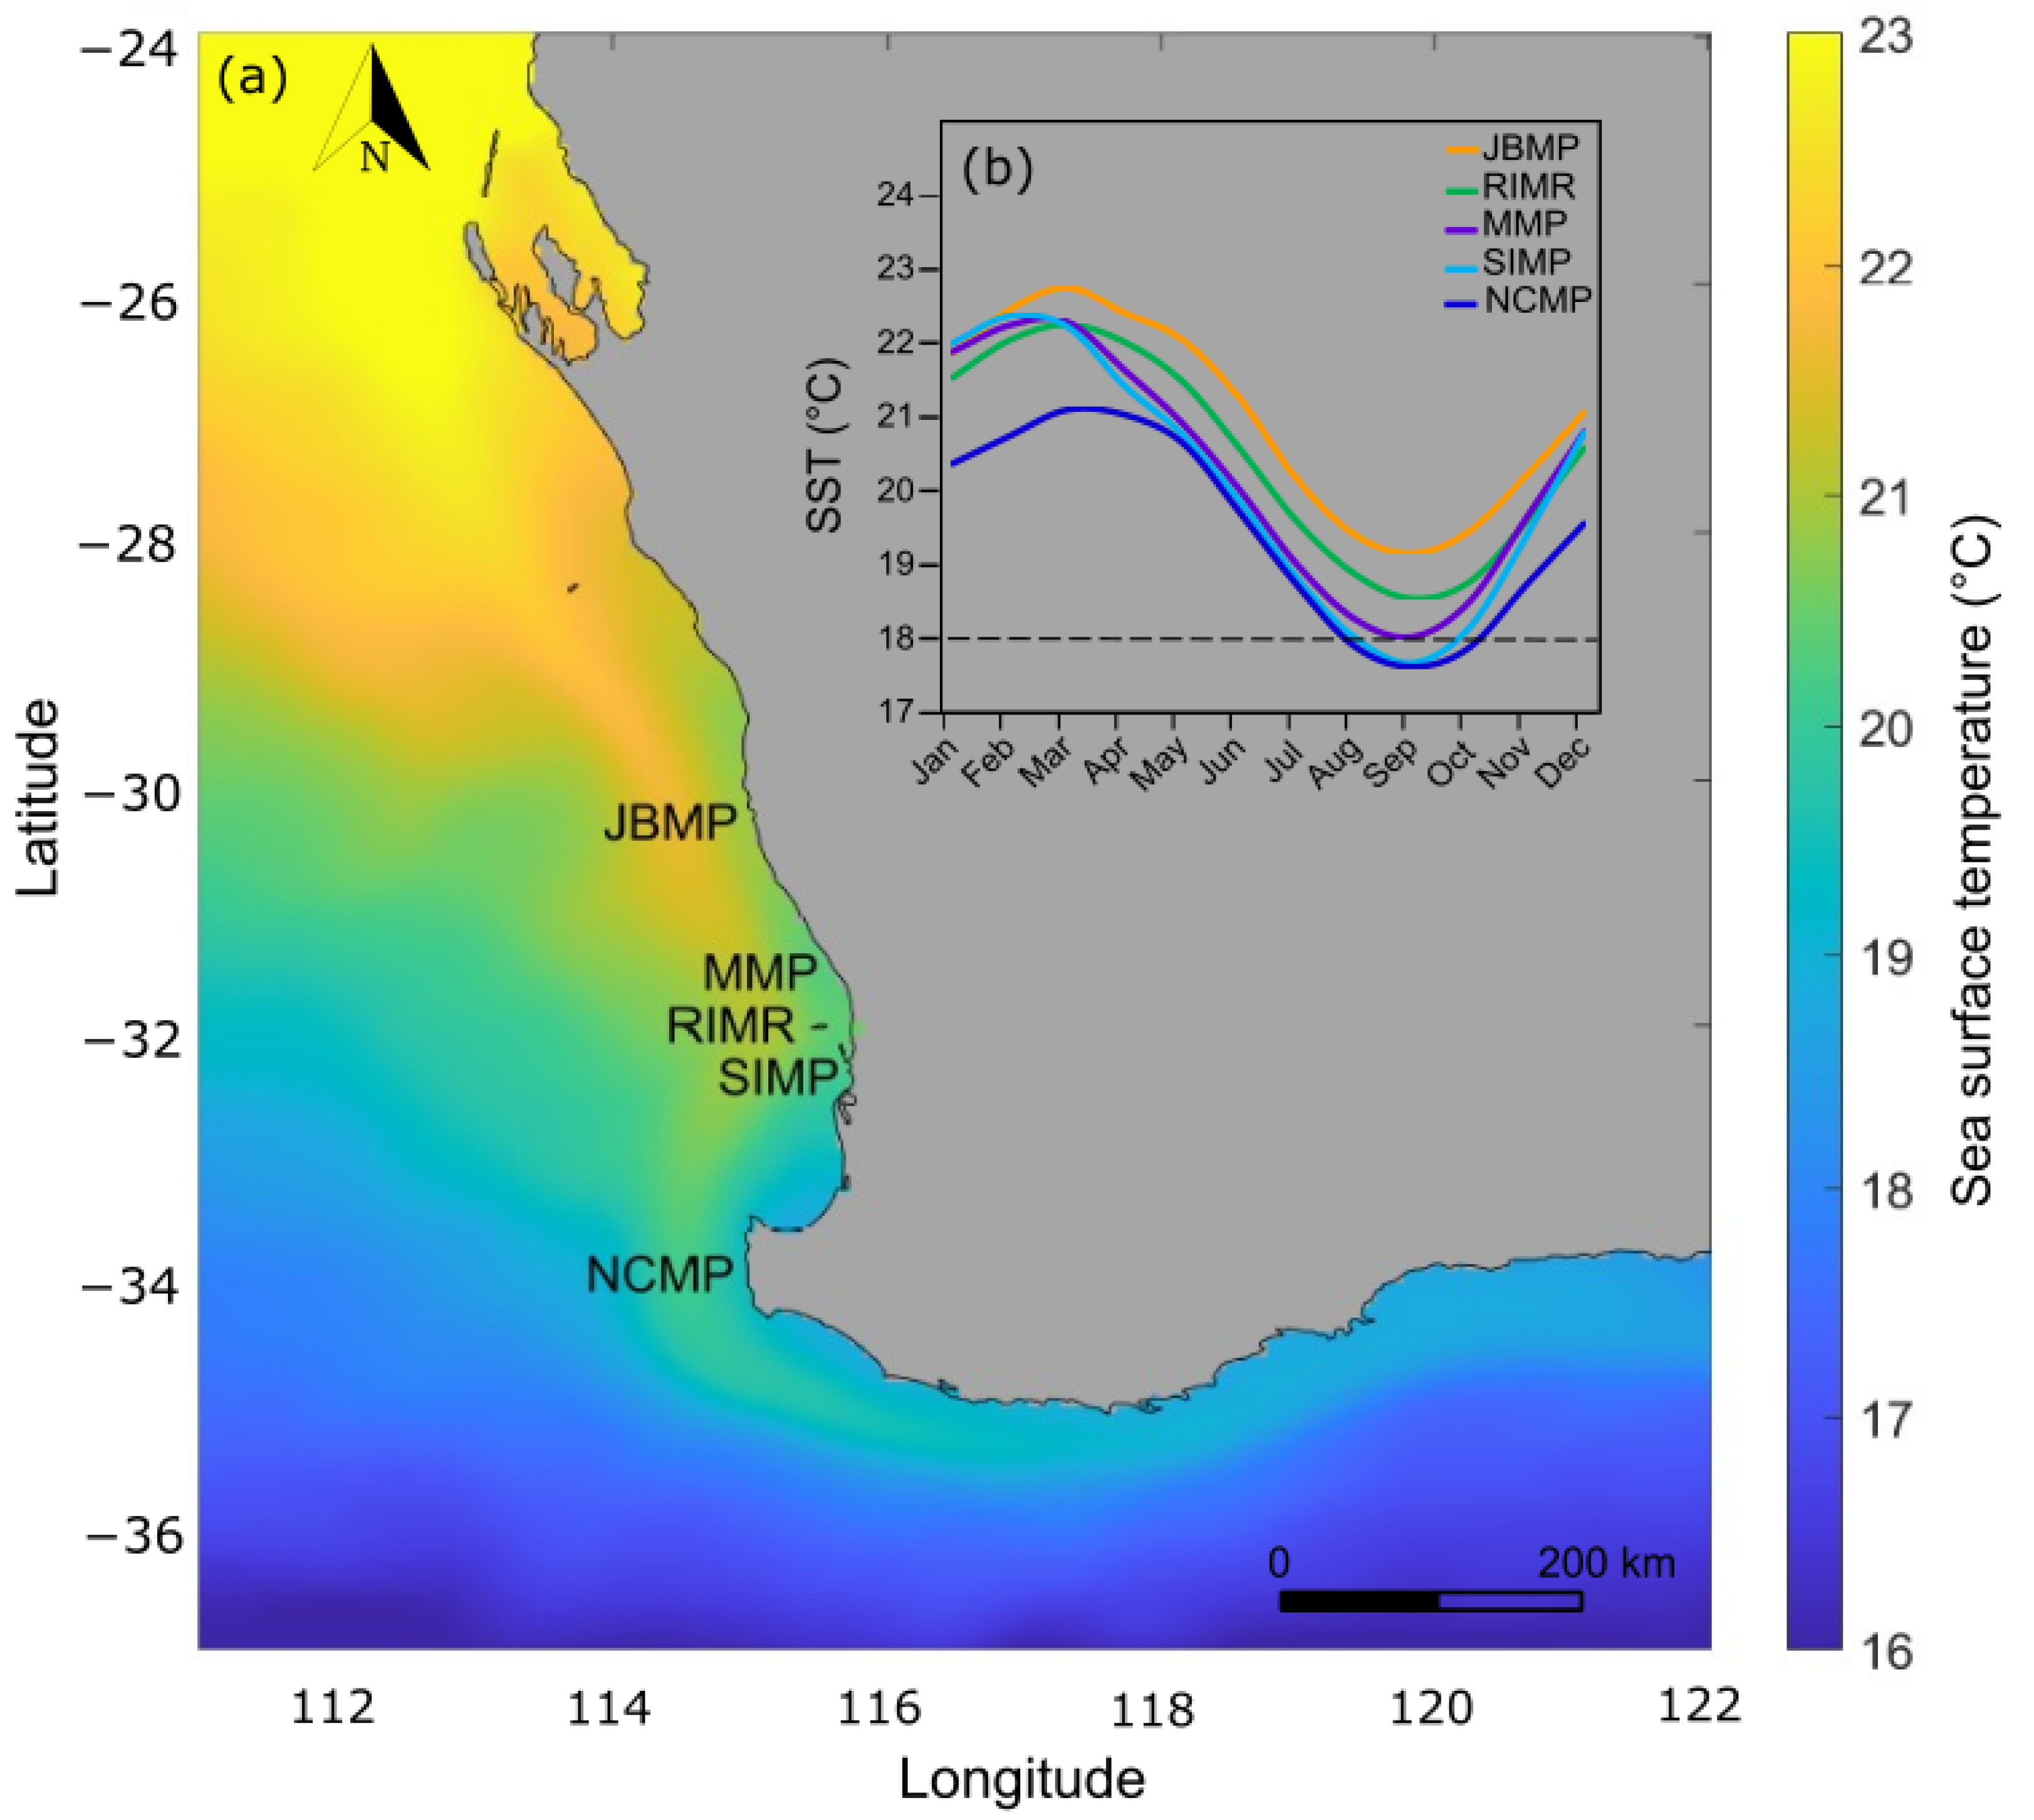
2.2. Temperature Profiles

Sea-surface temperature profiles for each marine park were constructed due to the importance of temperature as a driver of tropicalization and changes to coral communities through both gradual warming and marine heatwave events. Temperature profiles were constructed using the NOAA 5 km Coral Reef Watch (CRW) sea-surface temperature (SST) measured by satellite and the NOAA degree heating weeks (DHW) (NOAA 2021). For each marine park, the mean monthly SST was calculated from January 1986 through to December 2019 to examine the seasonal ranges. To quantify the long-term temperature increase over time for summer (March) from 1986 to 2019, rates of SST increase were calculated using linear regression in Matlab R2020a (Mathworks).
Sea-surface temperature reflects the latitudinal gradient from north to south, generally being 1−2 °C warmer in the lower latitudes around JBMP and cooler at the higher latitudes near NCMP (Table 1; Figure 2). The monthly average SST ranges seasonally from 19.1–22.8 °C at JBMP, 18.5–22.3 °C at RIMR, 18.0–22.3 °C at MMP, 17.7–22.2 °C at SIMP, and 17.6–21.1 °C at NCMP with the monthly maximum typically occurring in March and the minimum in September (Figure 2). The maximum degree heating weeks (DHW) ranged from 22.9 to 28.0 and occurred during the 2011 La Niña marine heatwave and DHW were higher at the lower latitude locations (especially JBMP) and decreased with increasing latitude (Table 1). The annual rate of gradual warming varied between marine parks, with an increase in summertime (March) SST occurring at a rate of 0.0164 yr−1 at the NCMP located at higher latitude and a rate of 0.0193 yr−1 at JBMP located at a lower latitude (Figure 3; Table 1).

2.2.1. JBMP

Monitoring in JBMP occurred at 43 sites covering inshore, midshore and offshore zones. Inshore sites are often shallow (2–5 m) with minimal structural complexity, whereas the midshore sites are shallow (2–4 m) with moderate wave exposure and the offshore sites are characteristically deeper (10–12 m), more structurally complex and exposed to significant wave energy. At each site, sampling occurred along four continuous 50 m transects, each with five quadrats (0.25 m2) placed at 10 m intervals along the transect length. Quadrats consisted of a wire grid where 50 points were denoted by the x- and y-axis wire intersections. The habitat directly beneath each point of the grid (n = 50 points per quadrat, 250 per transect, and 1000 per site) was recorded to the lowest possible taxonomic level (usually genera for hard corals). Quadrats were scored in situ by SCUBA divers experienced in benthic surveys and species identification. Surveys were completed initially by scientists from the University of Tasmania (UTAS) in 1999 and were subsequently re-surveyed at intervals thereafter by UTAS and DBCA (Table S3).

2.2.2. MMP and SIMP

Eight shallow-water (<10 m depth), mid-shelf limestone reef sites were surveyed in five years between 2012 and 2019 in each marine park (Table S3). Data were collected along three replicate 25 m transects at each site, arranged radially from a fixed central point. Benthic photo quadrats (~0.5 × 0.5 m) were collected along each transect at 1 m intervals (n = 25 images per transect). Images were analyzed using EcoPAAS, with the taxonomic classification recorded from six random points per image to the finest resolution possible; usually to genera with respect to hard corals.

2.2.3. RIMR

Monitoring inside the RIMR by Reef Life Survey (RLS) volunteers has been conducted annually in May/June since 2008. Twenty-six sites were established based on (1) reefs located inside sanctuary zones, (2) existing knowledge of complex limestone reef in <15 m, and (3) the presence of Pocillopora spp. coral habitat (one site). A minimum of 2 × 50 m transects were placed haphazardly at different depth contours, to capture the range of habitat types at each location. Each transect was laid out following a consistent depth and covering at least 90% hard reef substrate to exclude large sand patches and seagrass habitat. The number of transects at each site vary between years, dependent on the number of divers present.
Images were collected along each transect at 2.5 m intervals (n = 20 images per transect) by RLS volunteer divers. Due to the level of training and verification required to identify macroalgae, coral, and other sessile invertebrates, the in situ images were scored later by experts [58]. Images were analyzed by identifying the habitat at five co-located fixed points positioned in the same place each survey, using the computer software programs, Coral Point Count software with Excel extensions (CPCe) [59] and more recently Squidle+ (see: https://squidle.org/; accessed on 11 April 2020). Detailed methods can be found in an online methods manual (www.reeflifesurvey.com; accessed on 1 August 2021) and in Edgar et al. (2020) [58].

2.2.4. NCMP

Shallow (~5 m) and mid-depth (~10 m) reefs were surveyed at 10 locations in 2007, 2016, 2017, and 2018 using the same approach as used in JBMP. In addition, deeper granitic and limestone reef outcrops were surveyed in 2017–2018 at 10 sites using a tow-camera system targeting reef that protruded above the seabed from depths of approximately 40m to minimum depths of approximately 20 m. At each of 10 deep reef sites the tow-camera system (SpotX-Squid) was deployed and a georeferenced benthic quadrat-image collected every 5 s at approximately 1 m from the substrate. Each reef outcrop was typically surveyed using 3 to 5 parallel transects equi-spaced across the reef outcrop. Approximately 120 to 200 images were collected per transect and 600 images per site. Surveys were carried out at approximately 1.5 knots with each transect being 400 to 650 m. Images were processed using TransectMeasure (SEAGIS Pty Ltd., Victoria, Australia) with benthic habitat identified to the lowest possible taxonomic level at 20 points randomly positioned on each image.

2.3. Analysis of Total Hard-Coral Coverage

Mean per cent cover of hard-coral genera for each year in each marine park were calculated using transects as replicates with percentages derived from the total number of points per transect. These statistics were presented for each marine park with accompanying 95% confidence intervals for the total hard-coral coverage as stacked bar graphs including the three most abundant hard-coral genera in each park. This is used to quantify coral occurrences and assemblages in each marine park through time.
To estimate the change in total coral coverage through time, within each marine park when the same methodology was used consistently through time for each survey (Table S2), a generalized additive mixed modelling approach was used (GAMMs) [60]. Analysis was restricted to sites where monitoring has been conducted consistently over time (Table S3 sites annotated “#”). Models were not presented here for coral cover in parks where the model-fit was poor due to low incidents of coral occurrence (MMP, SIMP and NCMP). For those where coral occurrences were sufficient (JBMP and RIMR), separate models were run. For each site, we analysed per cent coral cover over time using a Tweedie distribution [61] and transect nested in site was included as a random effect to account for repeated sampling at the same sites. To reduce overfitting and to further ensure that models remained ecologically interpretable, year was included as a smoothing term and was fitted using a cubic regression spline, with the ‘k’ argument limited to 3. All models were compared to the null (intercept-only) model using an information–theoretic approach. Top models were selected based on Akaike’s information criterion (AIC) and AIC weights, where the wAIC varies from 0 (no support) to 1 (full support) [62]. Models were fitted using the gam() function in the R package mgcv [63,64]. The emmeans package [65] was then used to calculate the least squared means for different sites in JBMP and RIMR. Pairwise comparisons were conducted on the means using Bonferroni’s post hoc test and effect sizes were calculated using the pairwise differences of estimates, divided by the standard deviation.

2.4. Analysis of Genera Assemblages

A non-metric multidimensional scaling (nMDS) ordination was used to visualize different coral genera assemblages and their abundance among marine parks. Coral cover estimates were used from the most recent five years in which surveys were conducted (2015–2019). Multiple years of data were required to provide a representative assemblage of genera due to the low coral occurrence and because the proportion of coral identified to genus-level varied between years at some of the locations. The same sites were employed as those used in Section 2.2 and transects were used as replicates, the per cent coral cover estimates were square-root transformed and used to produce a Bray–Curtis similarity matrix from which the nMDS plot was produced. Vector-overlays were included representing correlating variables (r > 0.4) to indicate which coral genera may drive differences in regional assemblages [66]. Due to the different methodologies used to monitor coral cover and genera assemblages in the five marine parks, no further formal spatial data analysis was conducted.
To identify if assemblages of coral genera changed through time within each marine park separately, a series of multivariate analyses were used to test both inter-annual variation and sequential changes in coral genera assemblages. As with total coral assessments, temporal analyses of genera assemblages were restricted to parks with sites where the methodology was consistent through time and where coral were identified to genera in at least three or more corresponding years, to facilitate meaningful identification of trends and thus limiting the analyses to data from RIMR and JBMP only (sites “#” Table S3). A general approach was employed whereby an initial overarching test was used to determine interactions between factors, followed by tests to quantify the effect sizes (year and site). To achieve this, the per cent coral cover estimated in RIMR and JBMP were square-root transformed and used to produce separate Bray–Curtis similarity matrices for each marine park. Then, for each park, a two-factor PERMANOVA, conducted in the PERMANOVA+ add-on package for PRIMER v6 [67,68] was used to identify interactions between potential temporal and site effects with respect to assemblages of coral genera, with ‘year’ included as a fixed factor and ‘site’ as a random factor. A two-way-crossed ANOSIM design [68,69] with year and site as crossed factors was then conducted. Duplicate ANOSIM tests were completed, firstly with ‘year’ as an unordered factor, and then in the ordered form to detect non-specific inter-annual variation in coral genera or a trend in composition change through sequential years [66]. In the latter case a significant year effect could only indicate a sustained sequential change in genera assemblages through time whereas the former could also be indicative of the presence of particular outlying years of unique genera assemblages.

3. Results

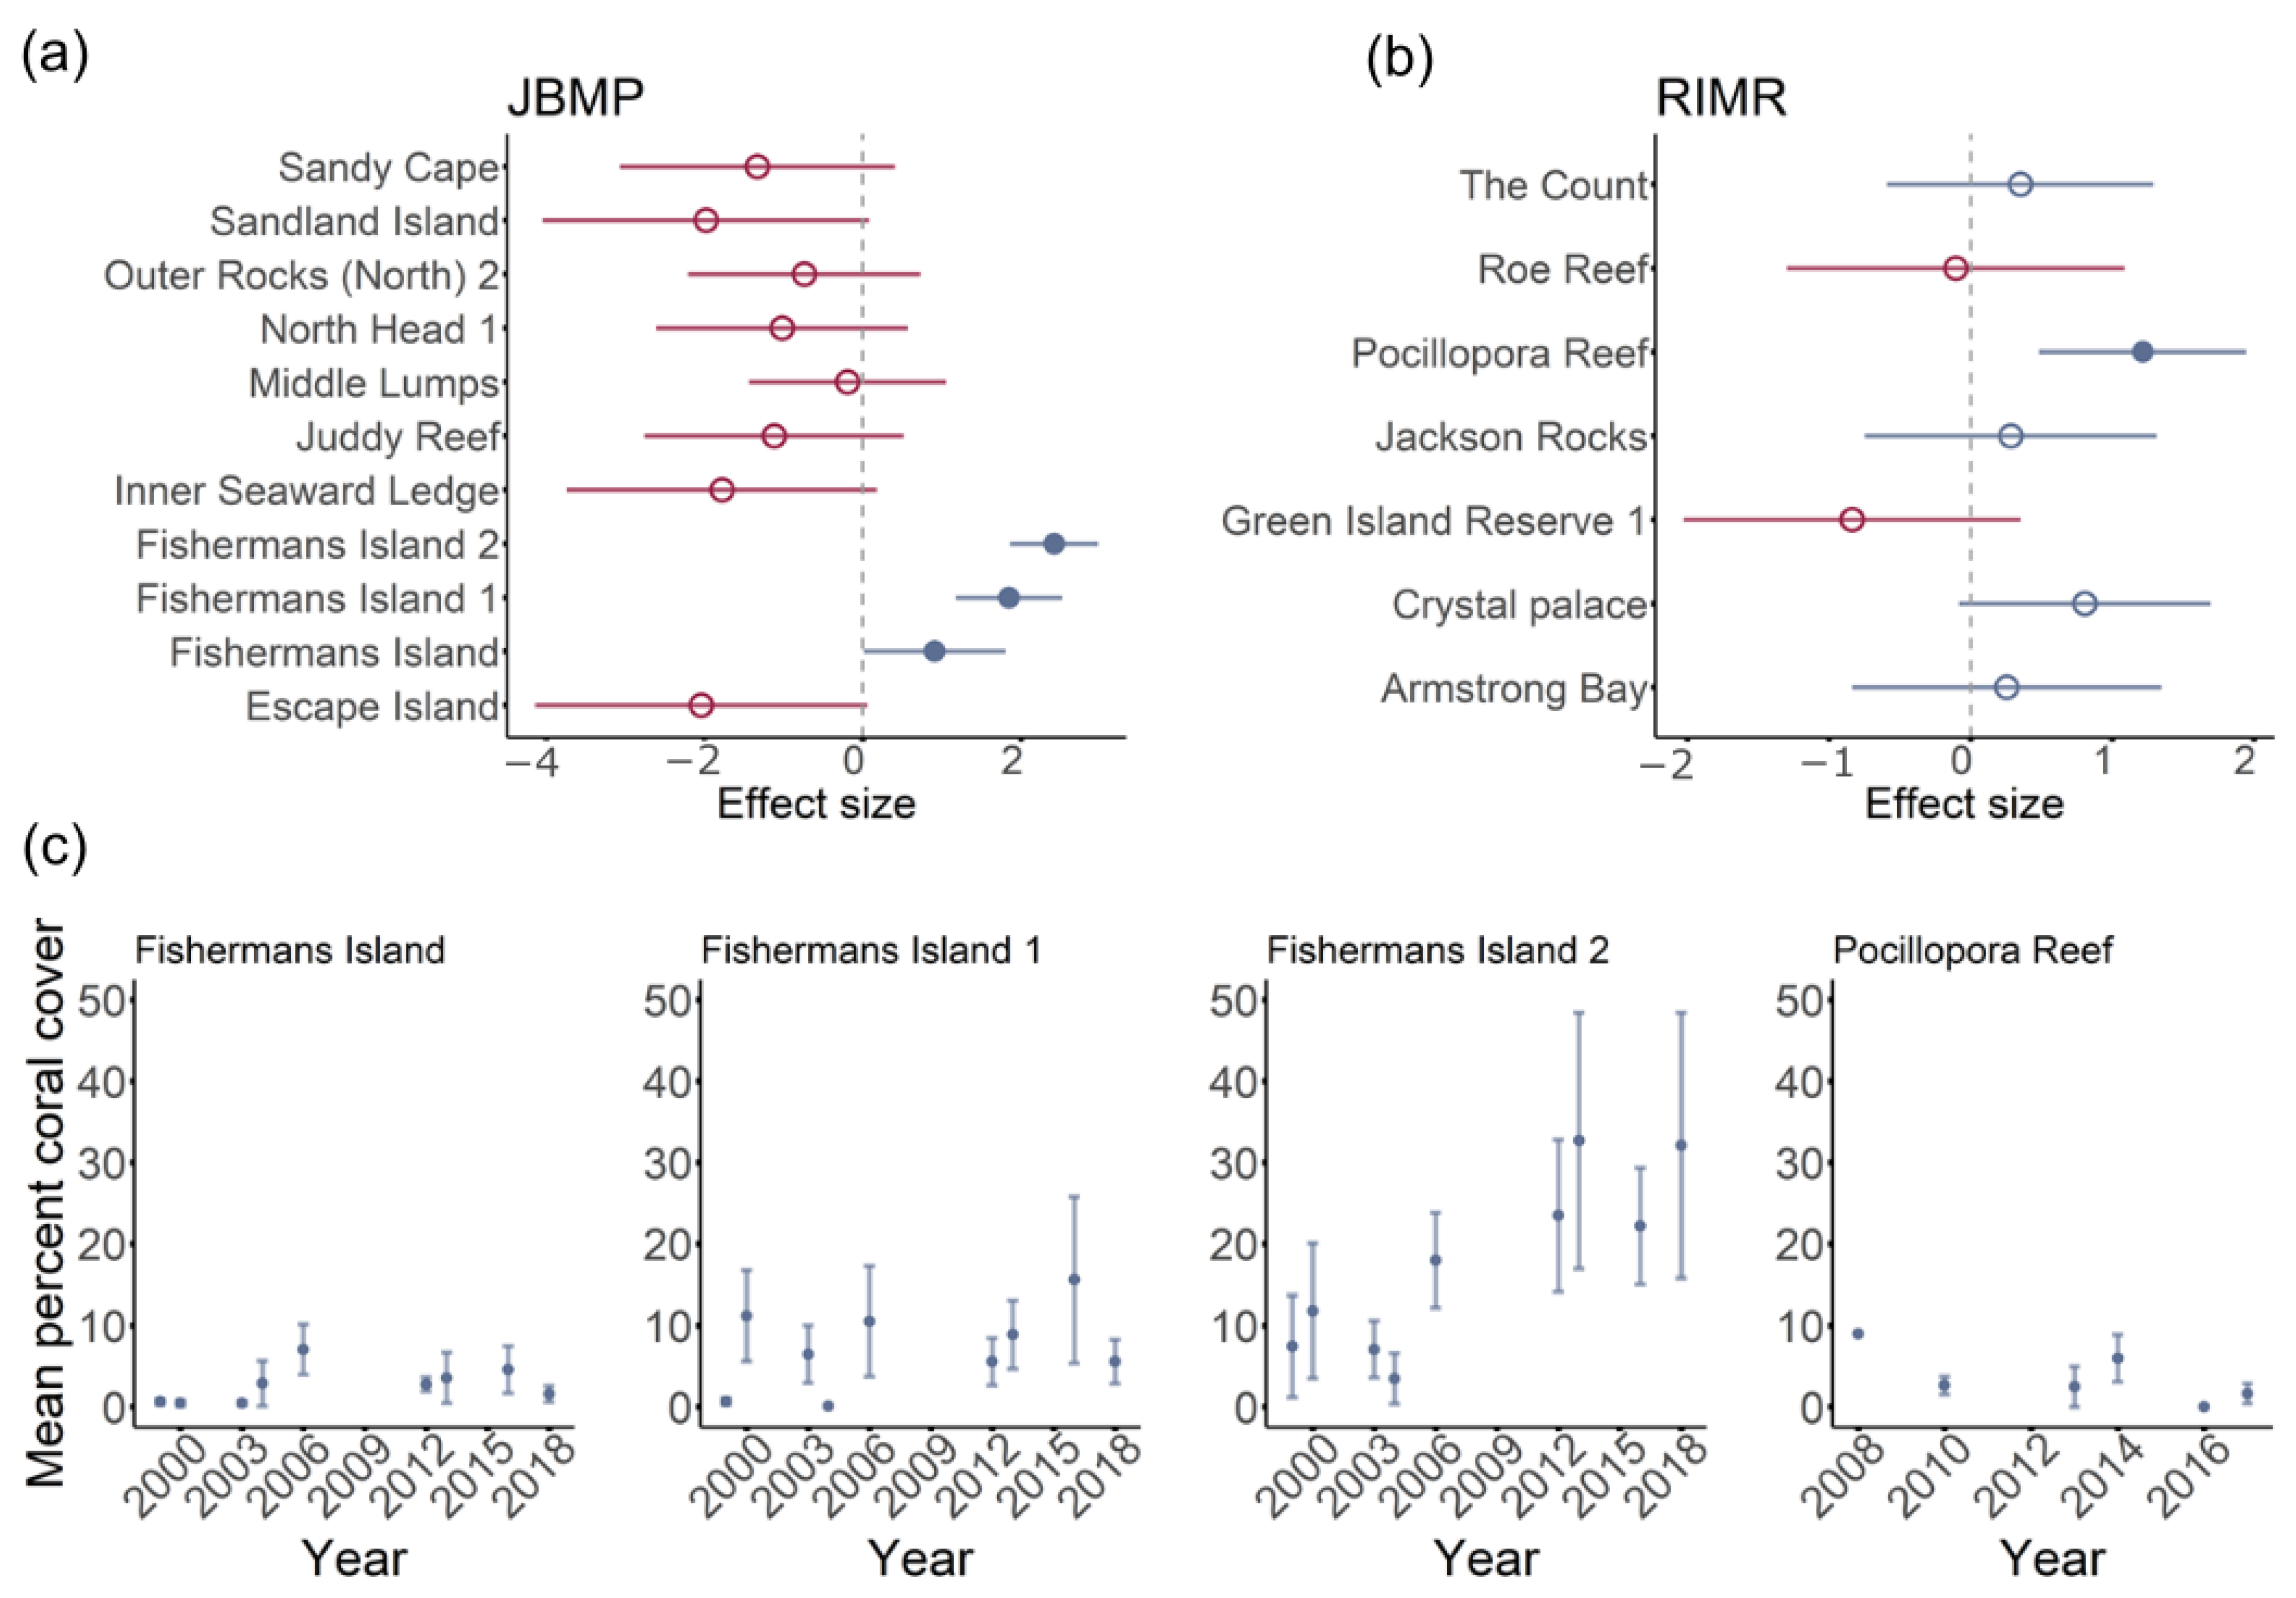
3.1. Total Hard-Coral Coverage

Coverage of hard coral was low and highly variable both within and among marine parks of south-western Australia (Figure 4). Mean per cent cover was highest in JBMP and RIMR, although estimates at most sites at these parks was typically < 5% (Figure 4, Table S4). Dominant genera differed among parks; Turbinaria, Montipora, and Dipsastraea were prominent at JBMP, though the relative contribution of these genera differed over the 20 years of surveys. Pocillopora, Montipora, and Favites were the most common genera at RIMR, whereas Paragoniastraea, Dipsastraea, and Favites were prominent in MMP, and Turbinaria was the most common coral in NCMP (Figure 4). Coral cover was low at SIMP (<1%) and the very few instances of coral were not identified to genera (Figure 4).
Total coral coverage for JBMP varied with respect to survey year, and the model including year and site explained almost half the variance in data (Table 2). Survey year was positively correlated with percentage coral cover and average cover at JBMP increased by ~5% between 1998 and 2018. There was, however, no support for temporal changes in coral cover at RIMR (Table 2). For both JBMP and RIMR, site explained a large proportion of the deviance explained (45.8% and 18.8% respectively, Table 2) and just a few sites were found to drive temporal trends (Figure 5). Coral cover was higher at three sites around Fishermans Island in JBMP and at Pocillopora Reef in RIMR (Figure 5). Mean per cent coral cover was 20 to 30% at Fishermans Island 2 since 2011, while earlier surveys were typically ~20% cover. Temporal trends in cover were not apparent at the other sites in JBMP (Figure 5a), or at Pocillopora Reef in RIMR (Figure 5b). Models for coral cover at MMP, SIMP, and NCMP indicated a very poor fit due to a low incident of coral occurrence (n = 15, n = 2, n = 7, respectively) and are, therefore, not presented here.

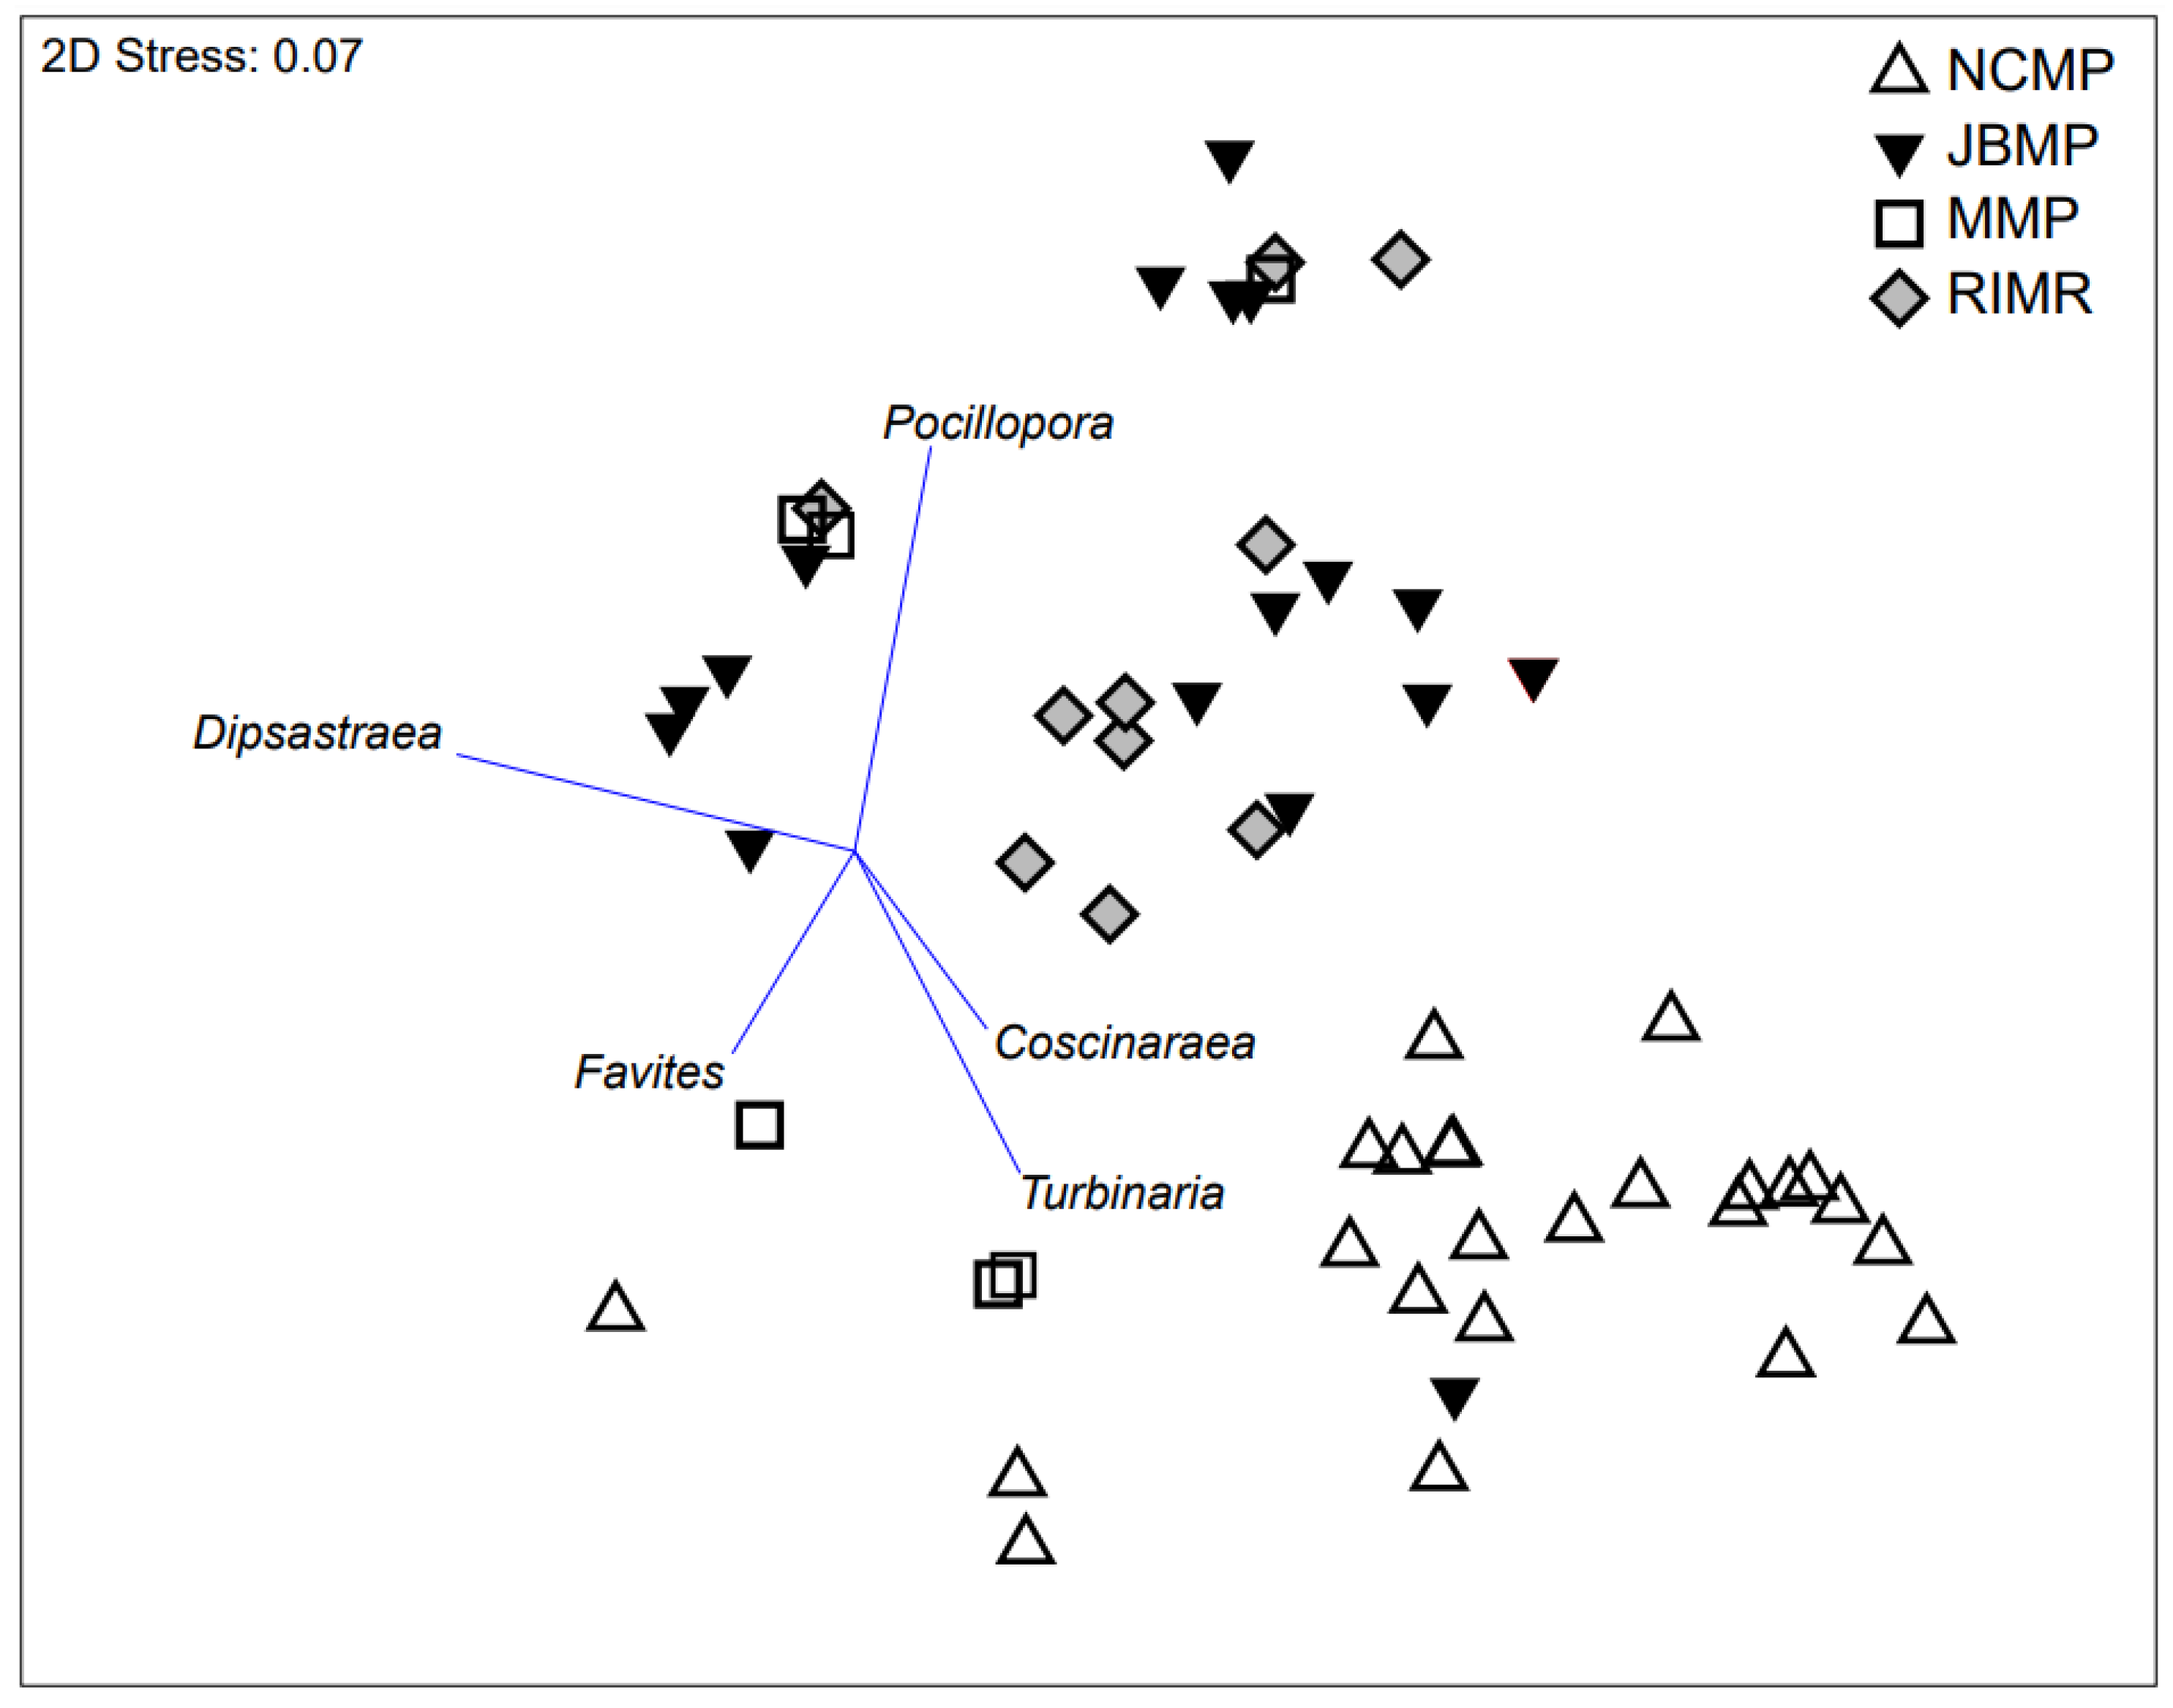
3.2. Analysis of Genera Assemblages

A total of 13 genera of hard coral were recorded across the five parks. All 13 genera were recorded at RIMR, 8 were recorded in NCMP, 7 in JBMP, and 5 in MMP (Table S4). Occurrences of many of the 13 coral genera across the parks were very low resulting in their intermittent presence through time.
Discrete coral assemblages were documented at the four parks where coral was identified to genus level, with JBMP and RIMR being clearly delineated from NCMP (Figure 6). The proximity of RIMR and JBMP in ordination space indicated that similar coral assemblages were present at those two parks. The separation between the coral genera assemblages in ordination space was analogous to the geographical separation between the marine parks with NCMP being located ~200 km south of RIMR and ~450 km south of JBMP (Figure 6). In particular, the coral assemblages differed spatially due to the presence of Pocillopora and Dipsastraea at JBMP and RIMR, and the presence of Turbinaria, Favites, and Coscinaraea in NCMP (Figure 6). The coral assemblages at MMP were not as clearly delineated from the other locations in ordination space due to the presence of a mix of genera including Pocillopora, Favites, and Turbinaria.
Temporal changes in the composition of coral assemblages were not consistent among sites at JBMP as indicated by a significant interaction between year and site (PERMANOVA pseudo-f = 1.4, p = 0.02; Table 3). Subsequent two-way-crossed ANOSIM showed a significant year effect (r = 0.36, p < 0.001, Table 3). Although there were significant differences in genera assemblages between years (unordered ANOSIM p < 0.05), the changes were not consistent through time (ordered ANOSIM p > 0.05, Table 3). In RIMR, a significant interaction was also present with respect to site and year, such that genera assemblages significantly differed between years but not sequentially through time (PERMANOVA, ANOSIM, Table 3). At the Fishermans Island sites in JBMP where there has been an increase in coral cover over time, the coral taxa documented in recent years (i.e., 2016 and 2018) include Montipora, Dipsastraea, Pocillopora, and Plesiastrea. Recent visits to JBMP sites, including Fishermans Island, suggests that that Montipora, Acropora, and Pocillopora are prevalent and thus some of the hard corals not identified to genera at this location may comprise those taxa (Figure 7). Given that a large proportion of the hard coral in the most recent survey year at JBMP are not identified to genus level, the photos for Fishermans Island are included to show the coral communities developing at this location (Figure 7).

4. Discussion

Documenting broad-scale abundance and distribution of hard coral provides a benchmark for assessing the response of coral communities to disturbances and ongoing environmental stressors, such as ocean warming. Here we report temporal changes in coral cover and community composition at five marine parks in the south-west of Western Australia spanning 500 km of coastline and ~4.5 degrees of latitude. Our estimates of coral cover were generally low (<5%) with a small number of sites in RIMR and JBMP reaching as much as 30% coral cover. Communities of coral were distinct between MPAs with the most discrete and southernmost NCMP delineated by the occurrence of Turbinaria, Coscinaraea, and Favites whereas the northern JBMP sites typically differed due to the presence of Pocillopora and Dipsastraea. Coral genera assemblages varied interannually but not consistently through time and only one site (Fishermans Island 2; Figure 5) showed a consistent increase in coral cover throughout the time series.

4.1. Total Coral Cover

At the park level, similar coral cover was recorded in RIMR and JBMP, typically ~2–3% with maximums of 10% and 30%, respectively. At RIMR, coral cover estimates were highest at Pocillopora Reef on the southern side of the island. In JBMP, coral cover estimates were highest at the three sites around Fishermans Island, which is located at the northern extent of the park and approximately 6 km west of the mainland. Other reefs along the sub-tropical/temperate coast of WA, including locations outside of current marine parks, also have unusually high coral cover (see Table S1). For example, coral cover of 52%, consisting of 14 species, has been reported from a nearshore coral community at Hall Bank, WA [50], suggesting that some locations in south-west WA are more suitable than others for corals. Several factors are known to influence site suitability for coral recruitment and growth at high latitude, including, but not limited to, temperature, depth and light availability, aragonite saturation state, seawater pH, food availability, suitable substrate cover, competition with algae, nutrient flux, water flow rates, and wave exposure [30,38,52,70,71,72]. Of these factors, temperature is generally accepted as being the most influential regarding both coral growth rates and distribution of coral reefs and communities, globally [73,74]. This is due to the strong temperature-dependence of skeletal growth and positive influence of temperature on metabolism [74,75,76]. While there are examples of coral reefs in locations where temperatures fall below 18 °C (e.g., Miyake-jima and Shikoku Island in Japan) [77,78], a threshold of 18 °C is generally considered to be the lower limit for coral-reef development [30,79]. Indeed, monthly average seawater temperature at RIMR is maintained above 18 °C during winter and is typically 1° to 2 °C warmer than the inshore waters adjacent to the coast of Perth and further south year-round due to the influence of eddies from the warm Leeuwin Current (Figure 2b) [80]. The very high clarity of the waters (i.e., low light attenuation coefficient) around Rottnest Island and other parts of south-west WA has also meant that light levels reaching the benthos are often suitable for the growth of reef-building corals [38,52]. Similarly, waters offshore of JBMP are influenced by the Leeuwin Current and seawater temperature is warmer than inshore waters further south due to the increase in ocean temperature with decreasing latitude (Figure 2; Table 1). The seasonal temperature regimes at RIMR and JBMP are, therefore, suitable for the more extensive development of coral communities, which may explain the high coral cover at these locations. At the same time, this likely also places these locations at higher risk of tropicalization with coral species predicted to expand their range to mid- and high-latitude regions in response to future climate change [81].

4.2. Temporal Trends in Coral Cover

Only JBMP demonstrated an increase in total coral coverage through time and this effect was driven by just one site (Fishermans Island 2). Increases in coral cover at this site also occurred following the strong 2010/11 La Niña-driven marine heatwave with an associated strengthening of the Leeuwin Current [46,82]. Potential processes responsible for this increase in coral cover following the heatwave include: (1) an influx of coral recruits due to strengthening of the Leeuwin Current, a process that has been reported for other marine taxa along this coast [14,45,83], and (2) an increase in the suitability of the location for coral fecundity, settlement, and growth. The reproductive isolation of high-latitude coral communities (below 29° S) from coral reefs further north does, however, indicate that some coral taxa (e.g., Pocillopora) in existing coral populations may be largely self-sustaining with infrequent or very limited recruitment from larvae transported in the Leeuwin Current [84,85]. Another important process is the increase in the availability of suitable hard substrate for coral settlement and growth due to reduced competition with temperate macroalgae that died due to heat stress and has undergone substantial grazing pressure [2,5,86,87]. Indeed, the loss of kelp (Ecklonia radiata) following the 2010/11 heatwave resulted in competitive release and an associated increase in the establishment of juvenile corals on high-latitude WA reefs [5,55]. Subsequent heavy grazing by herbivorous fish following large kelp loss would also help maintain turf and coral habitat [87]. The removal of macroalgae canopy due to the heatwave may have also increased visibility of small and encrusting corals during surveys. This is, however, less likely as the methods used at JBMP were specifically designed to capture benthic sessile assemblages beneath the canopy [58]. Although long-term data is not yet available for NCMP, it is noteworthy that no corals were detected in the surveys in 2007, despite significant observations being recorded in 2016, 2017, and 2018.

4.3. Coral Genera Assemblages

Current coral assemblages differed among marine parks with the most northern (JBMP) and offshore (RIMR) parks differing from inshore parks located further to the south. These region-specific differences in genera assemblages are supported by existing records of hard-coral distributions in the south-west of WA and observations of increasing abundances of hard corals due to the path of the warm Leeuwin Current as it moves polewards [42,47,88]. Warm affinity species, such as Acropora millepora, have been previously documented at JBMP [5] and more recent visits to the study sites demonstrated that Montipora, Pocillopora, and Acropora are prevalent at one site (Figure 7). Rottnest Island is also known to harbour well-developed coral communities [42,52] and our results support these findings as all 13 genera identified across the five parks were found at RIMR. Indeed, extensive shallow (<5 m) coral communities, consisting of warm-affiliated species, Pocillopora damicornis and Acropora yongei, are well documented at Salmon Bay and Parker Point on the southern side of Rottnest Island [22,52,89,90,91]. These coral communities are in the initial stages of colonization that may lead to extensive reef framework development analogous to the nearby fossil acroporid reefs at Fairbridge Bluff that formed during the Last Interglacial [20,52,92]. Tropical Acropora coral at Rottnest Island are thought to be living at, or very close to, the latitudinal limits of their distributions and are only found to occur at RIMR and JBMP where seawater temperatures are known to be higher compared to MMP, SIMP, and NCMP (Figure 2; Table 1) [22,42,52].
The NCMP sites where corals were routinely detected were clearly distinct from the more similar JBMP and RIMR communities, perhaps because the NCMP sites where hard corals were most commonly detected were also much deeper (20 to 40 m) and thus subject to different environmental conditions. The surveys from the subset of deep reef sites at NCMP suggest that coral cover at these sites is generally low and patchy, which is not unexpected for deep temperate reef communities. Most notably, the lower and more seasonally variable light levels on deep, high-latitude reefs may limit those coral communities to just a few coral genera that are able to tolerate and/or adapt to these conditions. Relatively extensive monospecific thickets of Turbinaria are common around the south coast of WA, including Dunsborough, Albany, Bremer Bay, and Esperance [38,42,53]. Turbinaria appears to be well adapted to temperate conditions, including lower light and temperatures, and likely survives in sub-optimal environments by maximizing light capture with its morphology and relying more heavily on heterotrophic feeding [38,93]. This may explain the occurrence of Turbinaria in temperate, high-latitude reefs in WA where temperature and light levels are lower compared to the tropics [38].
Overall, only a few genera (Table S4) are regularly recorded throughout the south-west of WA. These taxa have broad environmental tolerances or have adapted and/or acclimatized to cooler conditions on sub-tropical and temperate reefs. For example, Plesiastrea, Turbinaria, Paragoniastraea, and Dipsastraea have species with large geographical ranges, inferring broad tolerance levels, while some species from the genera Australophyllia (formerly Symphyllia) and Coscinaraea are endemic to temperate southern Australia [94]. Corals are known to be highly adapted to their localized thermal regimes and show different levels of thermal tolerance and bleaching resistance. The increasing occurrence of marine heatwaves may have immediate and long-lasting effects on the composition of high-latitude coral assemblages. Abnormally high sea temperatures in 2011 have already caused coral bleaching at Jurien Bay, Perth, and Rottnest Island reefs [35,95]. In a changing climate, it may be that locally adapted taxa that are susceptible to increasing temperature and heat waves are the most vulnerable, while those with broad environmental tolerances may benefit by expansion of environmental conditions that favor their growth and survival.
In both JBMP and RIMR there were marked interannual changes in coral assemblages, but these were not sustained or sequential changes across the time-series. This is further support for a relatively short-term persistence of environmental conditions that favor certain coral taxa. Changes to environmental conditions are thus accompanied by further shifts in coral assemblages. As a result, genera turnover and beta diversity may be high, such that some years have unique coral assemblages without a consistent temporal trend in genera-assemblage change. However, the different methods used at each location may influence the detection of trends through time and differences in community composition among parks. For instance, there may be limitations in the capacity to capture subtle changes in the community composition of corals that have low cover and are spatially patchy using benthic survey techniques that are developed for characterizing dominant taxa present in sub-tropical/temperate environments. Previous studies generally find that different benthic survey methods typically produce similar estimates of coral cover, though they may differ with respect to specific genera, especially if the genera are rare, cryptic, or cover is low [96,97]. This was apparent during recent visits to the study sites in JBMP, which demonstrated that Acropora is present at sites where it has not previously been detected and/or identified to genus-level in quadrats (Figure 7). This provides further support for the need to conduct a more targeted sampling program to adequately quantify and identify hard corals in marginal habitats where communities are patchy and disparate. Such approaches will provide data that is better suited to characterizing changes in the composition of coral communities, which are predicted to expand in the high-latitude MPAs with ongoing ocean warming and future marine heatwaves [5,17].

5. Summary and Conclusions

High-latitude coral communities are an emerging ecological asset in Australian marine parks [53] and globally [98,99]. Consequently, there is a growing need to quantify the condition of high-latitude coral assemblages. Here we demonstrate that monitoring techniques frequently used to assess the condition of benthic assemblages in sub-tropical and temperate high-latitude marine parks are successful in detecting and estimating coral cover. However, the sparse and patchy nature of coral communities in these parks indicates that increased targeted sampling at specific locations is required to improve understanding of coral assemblage composition and how this may change over time. Moreover, an appreciation of processes that underlie any temporal change in corals requires information on recruitment, growth, and size of colonies, ideally at the species level. Many of the sites in this study generally occur within a narrow depth range except for the deep reefs at NCMP. However, site depth is clearly an important factor that can influence coral cover and species distributions due to the depth-dependent attenuation of light and the availability of suitable substrate for coral recruitment, especially at high-latitude. Coral growth and size distribution information, combined with detailed and site-specific environmental data (e.g., depth, light, and temperature), could facilitate improved understanding of mechanisms by which high-latitude coral communities expand and change over time in relation to trends in climatic conditions and environmental perturbations.
This study provides a quantitative assessment of the current distribution of high-latitude coral assemblages in WA and long-term changes spanning ~20 years in some locations. The data demonstrate that coral cover within the five surveyed marine parks is typically low and patchy, with greatest coverage occurring at a few individual sites within two of the parks. Coral assemblages vary interannually, yet sustained temporal shifts were not identified at the park level. There is some evidence of increased coral cover within the most northern marine park in this study, although this is attributable to expansion at a single site. The expansion of corals at many other sites may be a much slower process, that is influenced by connectivity, reproductive isolation (e.g., clonal reproduction), and environmental conditions at the site level. Prevailing polar flowing currents undoubtedly provide warm water and some coral larvae, facilitating high coral cover and growth in some areas. However, intermittent strengthening of these same currents is also associated with marine heatwaves, which have caused coral bleaching and mortality on high-latitude reefs [33,35,54]. Information presented here represents an important benchmark for future assessments of climate change impacts and the tropicalization on sub-tropical and temperate reef communities of south-west Australia.

Supplementary Materials

The following are available online at https://www.mdpi.com/article/10.3390/d13110554/s1, Table S1: Coral cover % and diversity on high-latitude reefs at locations above 26° N and below 26° S, Table S2: Benthic survey methodology for each marine park, Table S3: Summary of sampling effort by Marine park, site, and year with mean % cover of hard coral, Table S4: Mean % cover and 95% confidence intervals of hard-coral genera in five marine parks in south-western Australia.

Author Contributions

B.F., C.L.R. and S.K.W. conceptualized and supervised the project, B.F., N.B., P.B.D., M.D.T., C.L.R. and E.K.L. collected and curated data, E.K.L., B.F. and C.L.R. analysed data, C.L.R., B.F. and E.K.L. wrote the original manuscript draft, all authors reviewed and edited the manuscript. All authors have read and agreed to the published version of the manuscript.

Funding

An ARC grant (LP150100761) contributed to surveys in JBMP and NCMP. The Rottnest Island field survey funding was provided by grants from Coastwest and the State Natural Resource Management Program (NRM WA), with long-term support from the Rottnest Island Authority and DBCA marine park monitoring and research funding.

Institutional Review Board Statement

The activities for this study were conducted under permission from the Government of Western Australia Department of Biodiversity, Conservation, and Attractions. This study was non-extractive and did not require animal ethics approval.

Informed Consent Statement

Not applicable.

Data Availability Statement

The data presented in this study are available on request from the corresponding author.

Acknowledgments

This paper is dedicated to the memory of Kevin Crane who was instrumental in coordinating and collecting early data for the Jurien Bay Marine Park. We would like to thank the Reef Life Survey divers and volunteers, Kevin Smith, Wendy Hutchinson, and Chris Cunnold for skippering. Thanks to DBCA marine science program staff (Tom Holmes, Kevin Bancroft, Mike Rule, and George Shedrawi) and marine park regional staff (Dave Lierich, Matt Dasey, Vaughan Chapple, Miecha Bradshaw, Steven Busby, Emma Rowe, and Lisa West) for support and assistance in conducting this fieldwork. We are grateful to UTAS staff, Arianna Polachech, Graham Edgar, Antonia Cooper, Elizabeth Oh, Scott Ling, and Just Berkhout for data management and access. We also wish to acknowledge the traditional owners of the lands and waters on which this research was conducted.

Conflicts of Interest

The authors declare no conflict of interest. The funders had no role in the design of the study; in the collection, analyses, or interpretation of data; in the writing of the manuscript; or in the decision to publish the results.

References

  1. Wernberg, T.; Russell, B.D.; Thomsen, M.S.; Gurgel, C.F.D.; Bradshaw, C.J.A.; Poloczanska, E.S.; Connell, S.D. Seaweed communities in retreat from ocean warming. Curr. Biol. 2011, 21, 1828–1832. [Google Scholar] [CrossRef] [PubMed]
  2. Wernberg, T.; Bennett, S.; Babcock, R.C.; De Bettignies, T.; Cure, K.; Depczynski, M.; Dufois, F.; Fromont, J.; Fulton, C.J.; Hovey, R.K.; et al. Climate-driven regime shift of a temperate marine ecosystem. Science 2016, 353, 169–172. [Google Scholar] [CrossRef] [Green Version]
  3. Orth, R.J.; Carruthers, T.J.B.; Dennison, W.C.; Duarte, C.M.; Fourqurean, J.W.; Heck, K.L.; Hughes, A.R.; Kendrick, G.A.; Kenworthy, W.J.; Olyarnik, S.; et al. A global crisis for seagrass ecosystems. Bioscience 2006, 56, 987–996. [Google Scholar] [CrossRef] [Green Version]
  4. Strydom, S.; Murray, K.; Wilson, S.; Huntley, B.; Rule, M.; Heithaus, M.; Bessey, C.; Kendrick, G.A.; Burkholder, D.; Fraser, M.W.; et al. Too hot to handle: Unprecedented seagrass death driven by marine heatwave in a World Heritage Area. Glob. Chang. Biol. 2020, 26, 3525–3538. [Google Scholar] [CrossRef] [PubMed]
  5. Tuckett, C.A.; de Bettignies, T.; Fromont, J.; Wernberg, T. Expansion of corals on temperate reefs: Direct and indirect effects of marine heatwaves. Coral Reefs 2017, 36, 947–956. [Google Scholar] [CrossRef] [Green Version]
  6. Day, P.B.; Stuart-Smith, R.D.; Edgar, G.J.; Bates, A.E. Species’ thermal ranges predict changes in reef fish community structure during 8 years of extreme temperature variation. Divers. Distrib. 2018, 24, 1036–1046. [Google Scholar] [CrossRef] [Green Version]
  7. Mulders, Y.; Wernberg, T. Fifteen years in a global warming hotspot: Changes in subtidal mobile invertebrate communities. Mar. Ecol. Prog. Ser. 2020, 656, 227–238. [Google Scholar] [CrossRef]
  8. IPCC. IPCC, 2019: IPCC Special Report on the Ocean and Cryosphere in a Changing Climate; Pörtner, H.-O., Roberts, D.C., Masson-Delmotte, V., Zhai, P., Tignor, M., Poloczanska, E., Mintenbeck, K., Alegría, A., Nicolai, M., Okem, A., et al., Eds.; Intergovernmental Panel on Climate Change: Geneva, Switzerland, 2019.
  9. Cheung, W.W.L.; Meeuwig, J.J.; Feng, M.; Harvey, E.S.; Lam, V.W.Y.; Langlois, T.; Slawinski, D.; Sun, C.; Pauly, D. Climate-change induced tropicalisation of marine communities in Western Australia. Mar. Freshw. Res. 2012, 63, 415. [Google Scholar] [CrossRef] [Green Version]
  10. Vergés, A.; Steinberg, P.D.; Hay, M.E.; Poore, A.G.B.; Campbell, A.H.; Ballesteros, E.; Heck, K.L.; Booth, D.J.; Coleman, M.A.; Feary, D.A.; et al. The tropicalization of temperate marine ecosystems: Climate-mediated changes in herbivory and community phase shifts. Proc. R. Soc. B Biol. Sci. 2014, 281, 20140846. [Google Scholar] [CrossRef]
  11. Vergés, A.; McCosker, E.; Mayer-Pinto, M.; Coleman, M.A.; Wernberg, T.; Ainsworth, T.; Steinberg, P.D. Tropicalisation of temperate reefs: Implications for ecosystem functions and management actions. Funct. Ecol. 2019, 33, 1000–1013. [Google Scholar] [CrossRef] [Green Version]
  12. Figueira, W.F.; Booth, D.J. Increasing ocean temperatures allow tropical fishes to survive overwinter in temperate waters. Glob. Chang. Biol. 2010, 16, 506–516. [Google Scholar] [CrossRef]
  13. Cure, K.; Hobbs, J.A.; Harvey, E.S. High recruitment associated with increased sea temperatures towards the southern range edge of a Western Australian endemic reef fish Choerodon rubescens (family Labridae). Env. Biol. Fishes 2014, 98, 1059–1067. [Google Scholar] [CrossRef]
  14. Lenanton, R.C.J.; Dowling, C.E.; Smith, K.A.; Fairclough, D.V.; Jackson, G. Potential influence of a marine heatwave on range extensions of tropical fishes in the eastern Indian Ocean—Invaluable contributions from amateur observers. Reg. Stud. Mar. Sci. 2017, 13, 19–31. [Google Scholar] [CrossRef]
  15. Fowler, A.M.; Parkinson, K.; Booth, D.J. New poleward observations of 30 tropical reef fishes in temperate southeastern Australia. Mar. Biodivers. 2018, 48, 2249–2254. [Google Scholar] [CrossRef]
  16. Precht, W.; Aronson, R.B. Climate flickers and range shifts of reef corals. Front. Ecol. Environ. 2004, 2, 307–314. [Google Scholar] [CrossRef]
  17. Thomson, D. Range extension of the hard coral Goniopora norfolkensis (veron & pichon 1982) to the south-east Indian Ocean. J. R. Soc. West. Aust. 2010, 93, 115–117. [Google Scholar]
  18. Yamano, H.; Sugihara, K.; Nomura, K. Rapid poleward range expansion of tropical reef corals in response to rising sea surface temperatures. Geophys. Res. Lett. 2011, 38, 1–6. [Google Scholar] [CrossRef]
  19. Baird, A.H.; Sommer, B.; Madin, J.S. Pole-ward range expansion of Acropora spp. along the east coast of Australia. Coral Reefs 2012, 31, 1063. [Google Scholar] [CrossRef]
  20. Szabo, B. Uranium-series age of coral reef growth on Rottnest Island, Western Australia. Mar. Geol. 1979, 29, M11–M15. [Google Scholar] [CrossRef]
  21. Greenstein, B.; Pandolfi, J.M. Escaping the heat: Range shifts of reef coral taxa in coastal Western Australia. Glob. Chang. Biol. 2008, 14, 513–528. [Google Scholar] [CrossRef]
  22. Marsh, L.M. The occurrence and growth of Acropora in extra-tropical waters off Perth, Western Australia. In Proceedings of the Seventh International Coral Reef Symposium; University of Guam: Mangilao, GU, USA, 1992; Volume 2, pp. 1233–1238. [Google Scholar]
  23. Couce, E.; Ridgwell, A.; Hendy, E.J. Future habitat suitability for coral reef ecosystems under global warming and ocean acidification. Glob. Chang. Biol. 2013, 19, 3592–3606. [Google Scholar] [CrossRef] [Green Version]
  24. Madin, J.; Allen, A.; Baird, A.; Pandolfi, J.; Sommer, B. Scope for latitudinal extension of reef corals is species specific. Front. Biogeogr. 2016, 8, e29328. [Google Scholar] [CrossRef] [Green Version]
  25. Muir, P.R.; Wallace, C.C.; Done, T.; Aguirre, J.D. Limited scope for latitudinal extension of reef corals. Science 2015, 348, 1135–1138. [Google Scholar] [CrossRef] [PubMed]
  26. Pearse, V.; Muscatine, L. Role of symbiotic algae (zooxanthellae) in coral calcification. Biol. Bull. 1971, 141, 350–363. [Google Scholar] [CrossRef]
  27. Gattuso, J.-P.; Allemand, D.; Frankignoulle, M. Photosynthesis and calcification at cellular, organismal and community levels in coral reefs: A review on Interactions and control by carbonate chemistry. Am. Zool. 1999, 39, 160–183. [Google Scholar] [CrossRef] [Green Version]
  28. Grigg, R. Darwin Point: A threshold for atoll formation. Coral Reefs 1982, 1, 29–34. [Google Scholar] [CrossRef]
  29. Johannes, R.E.; Wiebe, W.J.; Crossland, C.J.; Rimmerl, D.W.; Smith, S.V. Latitudinal limits of coral reef growth. Mar. Ecol. Prog. Ser. 1983, 11, 105–111. [Google Scholar] [CrossRef]
  30. Kleypas, J.A.; McManus, J.; Menez, L. Environmental limits to coral reef development: Where do we draw the line? Am. Zool. 1999, 39, 146–159. [Google Scholar] [CrossRef]
  31. Cook, C.; Logan, A.; Ward, J.; Luckhurst, B.; Berg, C., Jr. Elevated temperatures and bleaching on a high latitude coral reef: The 1988 Bermuda event. Coral Reefs 1990, 9, 45–49. [Google Scholar] [CrossRef]
  32. Celliers, L.; Schleyer, M.H. Coral bleaching on high-latitude marginal reefs at Sodwana Bay, South Africa. Mar. Pollut. Bull. 2002, 44, 1380–1387. [Google Scholar] [CrossRef]
  33. Harrison, P.L.; Dalton, S.J.; Carroll, A.G. Extensive coral bleaching on the world’s southernmost coral reef at Lord Howe Island, Australia. Coral Reefs 2011, 30, 775. [Google Scholar] [CrossRef] [Green Version]
  34. Abdo, D.; Bellchambers, L.M.; Evans, S.N. Turning up the heat: Increasing temperature and coral bleaching at the high latitude coral reefs of the Houtman Abrolhos Islands. PLoS ONE 2012, 7, e43878. [Google Scholar] [CrossRef] [Green Version]
  35. Moore, J.A.Y.; Bellchambers, L.M.; Depczynski, M.R.; Evans, R.D.; Evans, S.N.; Field, S.N.; Friedman, K.J.; Gilmour, J.P.; Holmes, T.H.; Middlebrook, R.; et al. Unprecedented mass bleaching and loss of coral across 12° of latitude in Western Australia in 2010–11. PLoS ONE 2012, 7, e51807. [Google Scholar] [CrossRef] [Green Version]
  36. DeBose, J.L.; Nuttall, M.F.; Hickerson, E.L.; Schmahl, G.P. A high-latitude coral community with an uncertain future: Stetson Bank, northwestern Gulf of Mexico. Coral Reefs 2012, 32, 255–267. [Google Scholar] [CrossRef]
  37. Bridge, T.C.L.; Ferrari, R.; Bryson, M.; Hovey, R.; Figueira, W.F.; Williams, S.B.; Pizarro, O.; Harborne, A.R.; Byrne, M. Variable responses of benthic communities to anomalously warm sea temperatures on a high-latitude coral reef. PLoS ONE 2014, 9, 1–20. [Google Scholar] [CrossRef]
  38. Ross, C.L.; Schoepf, V.; DeCarlo, T.M.; McCulloch, M.T. Mechanisms and seasonal drivers of calcification in the temperate coral Turbinaria reniformis at its latitudinal limits. Proc. R. Soc. B 2018, 285, 20180215. [Google Scholar] [CrossRef] [PubMed]
  39. Tuckett, C.A.; Wernberg, T. High latitude corals tolerate severe cold spell. Front. Mar. Sci. 2018, 5, 1–6. [Google Scholar] [CrossRef] [Green Version]
  40. van Hooidonk, R.; Maynard, J.A.; Manzello, D.; Planes, S. Opposite latitudinal gradients in projected ocean acidification and bleaching impacts on coral reefs. Glob. Chang. Biol. 2014, 20, 103–112. [Google Scholar] [CrossRef] [PubMed]
  41. Veron, J.E.N. Corals of the World; Stafford-Smith, M., Ed.; Australian Institute of Marine Science: Townsville, Australia, 2000; Volume 3. [Google Scholar]
  42. Veron, J.; Marsh, L. Hermatypic corals of Western Australia. Records and annotated species list. Rec. West. Aust. Mus. 1988, 29, 1–136. [Google Scholar]
  43. Kendrick, A.; Wilson, S.; Friedman, K.; Waples, K.; Whiting, S.; Holmes, T.; Rule, M.; Halford, A.; Quartermaine, T.; Bobojcov, A.; et al. Strategic marine ecological research priorities for CALM act marine parks and reserves 2016–2021. Conserv. Sci. West. Aust. 2016, 10, 1–15. [Google Scholar]
  44. Smale, D.A.; Kendrick, G.; Waddington, K.I.; Van Niel, K.P.; Meeuwig, J.J.; Harvey, E. Benthic assemblage composition on subtidal reefs along a latitudinal gradient in Western Australia. Estuar. Coast. Shelf Sci. 2010, 86, 83–92. [Google Scholar] [CrossRef]
  45. Hutchins, J.; Pearce, A. Influence of the leeuwin current on recruitment of tropical reef fishes at Rottnest Island, Western Australia. Bull. Mar. Sci. 1994, 54, 245–255. [Google Scholar]
  46. Pearce, A.; Hutchins, B.; Hoschke, A.; Fearns, P. Record high damselfish recruitment at Rottnest Island, Western Australia, and the potential for climate-induced range extension. Reg. Stud. Mar. Sci. 2016, 8, 77–88. [Google Scholar] [CrossRef] [Green Version]
  47. Hatcher, B.G. Coral reefs in the Leeuwin Current—An ecological perspective. J. R. Soc. West. Aust. 1991, 74, 115–127. [Google Scholar]
  48. Gilmour, J.; Speed, C.W.; Babcock, R. Coral reproduction in Western Australia. PeerJ 2016, 4, e2010. [Google Scholar] [CrossRef] [Green Version]
  49. Wilson, S.K.; Kendrick, A.; Wilson, B. The North-Western Margin of Australia in World Seas: An Environmental Evaluation; Chapter 14; Academic Press: Cambridge, MA, USA, 2019. [Google Scholar]
  50. Thomson, D.P.; Frisch, A. Extraordinarily high coral cover on a nearshore, high-latitude reef in south-west Australia. Coral Reefs 2010, 29, 923–927. [Google Scholar] [CrossRef]
  51. Richards, Z.; Kirkendale, L.; Moore, G.; Hosie, A.; Huisman, J.; Bryce, M.; Marsh, L.; Bryce, C.; Hara, A.; Wilson, N.; et al. Marine biodiversity in temperate Western Australia: Multi-taxon surveys of Minden and Roe Reefs. Diversity 2016, 8, 7. [Google Scholar] [CrossRef] [Green Version]
  52. Ross, C.L.; Falter, J.L.; Schoepf, V.; McCulloch, M.T. Perennial growth of hermatypic corals at Rottnest Island, Western Australia (32° S). PeerJ 2015, 3, e781. [Google Scholar] [CrossRef]
  53. DEC. Ngari Capes Marine Park; Management Plan 74 2013–2023; Department of Environment and Conservation: Perth, Australia, 2013.
  54. Pearce, A.; Lenanton, R.; Jackson, G.; Moore, J.; Feng, M.; Gaughan, D. The “Marine Heat Wave” off Western Australia during the Summer of 2010/11 Fisheries Research Report No. 222; Western Australian Fisheries and Marine Research Laboratories: Hillarys, Australia, 2011. [Google Scholar]
  55. Smale, D.A.; Wernberg, T. Extreme climatic event drives range contraction of a habitat-forming species. Proc. R. Soc. B 2013, 280, 20122829. [Google Scholar] [CrossRef] [PubMed]
  56. Graham, N.A.J.; Wilson, S.K.; Jennings, S.; Polunin, N.V.C.; Bijoux, J.P.; Robinson, J. Dynamic fragility of oceanic coral reef ecosystems. Proc. Natl. Acad. Sci. USA 2006, 103, 8425–8429. [Google Scholar] [CrossRef] [Green Version]
  57. Jupiter, S.; Roff, G.; Marion, G.; Henderson, M.; Schrameyer, V.; McCulloch, M.; Hoegh-Guldberg, O. Linkages between coral assemblages and coral proxies of terrestrial exposure along a cross-shelf gradient on the southern Great Barrier Reef. Coral Reefs 2008, 27, 887–903. [Google Scholar] [CrossRef]
  58. Edgar, G.J.; Cooper, A.; Baker, S.C.; Barker, W.; Barrett, N.S.; Becerro, M.A.; Bates, A.E.; Brock, D.; Ceccarelli, D.M.; Clausius, E.; et al. Reef Life Survey: Establishing the ecological basis for conservation of shallow marine life. Biol. Conserv. 2020, 252, 108855. [Google Scholar] [CrossRef]
  59. Kohler, K.E.; Gill, S. Coral Point Count with Excel extensions (CPCe): A Visual Basic program for the determination of coral and substrate coverage using random point count methodology. Comput. Geosci. 2006, 32, 1259–1269. [Google Scholar] [CrossRef]
  60. Lin, X.; Zhang, D. Inference in generalized additive mixed models by using smoothing splines. J. R. Stat. Soc. Ser. B Stat. Methodol. 1999, 61, 381–400. [Google Scholar] [CrossRef] [Green Version]
  61. Tweedie, M.C.K. An index which distinguishes between some important exponential families. Statistics: Applications and New Directions. In Proceedings of the Indian Statistical Institute Golden Jubilee International Conference; Ghosh, J.K., Roy, J., Eds.; Indian Statistical Institute: Calcutta, Indian, 1984; pp. 579–604. [Google Scholar]
  62. Burnham, K.; Anderson, D.R. Model Selection and Multimodel Inference: A Practical Information-Theoretical Approach, 2nd ed.; Springer: New York, NY, USA, 2002. [Google Scholar]
  63. Wood, S. Fast stable restricted maximum likelihood and marginal likelihood estimation of semiparametric generalized linear models. J. R. Stat. Soc. B 2011, 73, 3–36. [Google Scholar] [CrossRef] [Green Version]
  64. Wood, S. Generalized Additive Models: An Introduction with R, 2nd ed.; Chapman and Hall/CRC: Boca Raton, FL, USA, 2017. [Google Scholar]
  65. Lenth, R. Emmeans: Estimated Marginal Means, Aka Least-Squares Means. 2021. Available online: https://CRAN.R-project.org/package=emmeans (accessed on 15 December 2020).
  66. Clarke, K.; Gorley, R.; Somerfield, P.; Warwick, R. Change in Marine Communities: An Apporach to Statistical Analysis and Interpretation, 3rd ed.; PRIMER-E Ltd.: Auckland, New Zealand, 2014. [Google Scholar]
  67. Anderson, M.; Gorley, R.; Clarke, K. PERMANOVA+ for PRIMER: Guide to Software and Statistical Methods. [PRIMER-E]; PRIMER-E Ltd.: Ivybridge, UK, 2008. [Google Scholar]
  68. Clarke, K.; Gorley, R. Getting Started with PRIMER v7 [PRIMER-E]; PRIMER-E Ltd.: Ivybridge, UK, 2015. [Google Scholar]
  69. Clarke, K.; Green, R. Statistical design and analysis for a’biological effects’ study. Mar. Ecol. Prog. Ser. 1988, 46, 213–226. [Google Scholar] [CrossRef]
  70. Miller, M.W. Growth of a temperate coral: Effects of temperature, light, depth, and heterotrophy. Mar. Ecol. Prog. Ser. 1995, 122, 217–225. [Google Scholar] [CrossRef] [Green Version]
  71. Goffredo, S.; Caroselli, E.; Mattioli, G.; Pignotti, E.; Dubinsky, Z.; Zaccanti, F. Inferred level of calcification decreases along an increasing temperature gradient in a Mediterranean endemic coral. Limnol. Oceanogr. 2009, 54, 930–937. [Google Scholar] [CrossRef] [Green Version]
  72. Mizerek, T.L.; Baird, A.H.; Beaumont, L.J.; Madin, J.S. Environmental tolerance governs the presence of reef corals at latitudes beyond reef growth. Glob. Ecol. Biogeogr. 2016, 25, 979–987. [Google Scholar] [CrossRef]
  73. Veron, J.E.N. Corals in Space and Time: The Biogeography and Evolution of the Scleractinia; Cornell University Press: Ithaca, NY, USA, 1995; pp. 1–321. [Google Scholar]
  74. Lough, J.M.; Barnes, D.J. Environmental controls on growth of the massive coral Porites. J. Exp. Mar. Biol. Ecol. 2000, 245, 225–243. [Google Scholar] [CrossRef]
  75. Coles, S.L.; Jokiel, P.L. Effects of temperature on photosynthesis and respiration in hermatypic corals. Mar. Biol. 1977, 43, 209–216. [Google Scholar] [CrossRef]
  76. Burton, E.A.; Walter, L.M. Relative precipitation rates of aragonite and Mg calcite from seawater: Temperature or carbonate ion control? Geology 1987, 15, 111. [Google Scholar] [CrossRef]
  77. Tribble, G.; Randall, R. A description of the high-latitude shallow water coral communities of Miyake-jima, Japan. Coral Reefs 1986, 4, 151–159. [Google Scholar] [CrossRef]
  78. Denis, V.; Mezaki, T.; Tanaka, K.; Kuo, C.; De Palmas, S.; Keshavmurthy, S.; Chen, C. Coverage, diversity, and functionality of a high-latitude coral community (Tatsukushi, Shikoku Island, Japan). PLoS ONE 2013, 8, e54330. [Google Scholar] [CrossRef]
  79. Harriott, V.; Banks, S. Latitudinal variation in coral communities in eastern Australia: A qualitative biophysical model of factors regulating coral reefs. Coral Reefs 2002, 21, 83–94. [Google Scholar] [CrossRef]
  80. Cresswell, G.; Golding, T.J. Observations of a south-flowing current in the southeastern Indian Ocean. Deep. Res. 1980, 27A, 449–466. [Google Scholar] [CrossRef]
  81. Adam, A.A.S.; Garcia, R.A.; Galaiduk, R.; Tomlinson, S.; Radford, B.; Thomas, L.; Richards, Z.T. Diminishing potential for tropical reefs to function as coral diversity strongholds under climate change conditions. Divers. Distrib. 2021, 27, 2245–2261. [Google Scholar] [CrossRef]
  82. Benthuysen, J.; Feng, M.; Zhong, L. Spatial patterns of warming off Western Australia during the 2011 Ningaloo Niño: Quantifying impacts of remote and local forcing. Cont. Shelf Res. 2014, 91, 232–246. [Google Scholar] [CrossRef]
  83. Caputi, N.; Fletcher, W.J.; Pearce, A.; Chubb, C.F. Effect of the Leeuwin Current on the recruitment of fish and invertebrates along the Western Australian coast. Mar. Freshw. Res. 1996, 47, 147–155. [Google Scholar] [CrossRef]
  84. Markey, K.L.; Abdo, D.A.; Evans, S.N.; Bosserelle, C. Keeping it local: Dispersal limitations of coral larvae to the high latitude coral reefs of the Houtman Abrolhos Islands. PLoS ONE 2016, 11, 1–12. [Google Scholar] [CrossRef] [Green Version]
  85. Thomas, L.; Kennington, W.J.; Evans, R.D.; Kendrick, G.A.; Stat, M. Restricted gene flow and local adaptation highlight the vulnerability of high-latitude reefs to rapid environmental change. Glob. Chang. Biol. 2017, 23, 2197–2205. [Google Scholar] [CrossRef]
  86. Miller, M.W.; Hay, M.E. Coral-seaweed-grazer-nutrient interactions on temperate reefs. Ecol. Monogr. 1996, 66, 323–344. [Google Scholar] [CrossRef]
  87. Bennett, S.; Wernberg, T.; Harvey, E.S.; Santana-garcon, J.; Saunders, B.J. Tropical herbivores provide resilience to a climate-mediated phase shift on temperate reefs. Ecol. Lett. 2015, 18, 714–723. [Google Scholar] [CrossRef]
  88. Wyrwoll, K.; Greenstein, B.; Kendrick, G.; Chen, G. The palaeoceanography of the Leeuwin Current: Implications for a future world. J. R. Soc. West. Aust. 2009, 92, 37–51. [Google Scholar]
  89. Black, R.; Prince, J. Fauna associated with the coral Pocillopora damicornis at the Southern limit of its distribution in Western Australia. J. Biogeogr. 1983, 10, 135–152. [Google Scholar] [CrossRef]
  90. Ward, S. The effect of damage on the growth, reproduction and storage of lipids in the scleractinian coral Pocillopora damicornis (Linnaeus). J. Exp. Mar. Bio. Ecol. 1995, 187, 193–206. [Google Scholar] [CrossRef]
  91. Le Nohaïc, M.; Ross, C.L.; Cornwall, C.E.; Comeau, S.; Lowe, R.; McCulloch, M.T.; Schoepf, V. Marine heatwave causes unprecedented regional mass bleaching of thermally resistant corals in northwestern Australia. Sci. Rep. 2017, 7, 14999. [Google Scholar] [CrossRef] [PubMed] [Green Version]
  92. Stirling, C.; Esat, T.; McCulloch, M.T.; Lambeck, K. High-precision U-series dating of corals from Western Australia and implications for the timing and duration of the Last Interglacial. Earth Planet. Sci. Lett. 1995, 135, 115–130. [Google Scholar] [CrossRef]
  93. Morgan, K.; Perry, C.; Smithers, S.; Johnson, J.; Daniell, J. Evidence of extensive reef development and high coral cover in nearshore environments: Implications for understanding coral adaptation in turbid settings. Sci. Rep. 2016, 6, 1–10. [Google Scholar]
  94. Veron, J. Corals of Australia and the Indo-Pacific; Angus and Robertson Publishers: North Ryde, Australia, 1986. [Google Scholar]
  95. Thomson, D.P.; Bearham, D.; Graham, F.; Eagle, J. High latitude, deeper water coral bleaching at Rottnest Island, Western Australia. Coral Reefs 2011, 30, 775. [Google Scholar] [CrossRef] [Green Version]
  96. Pante, E.; Dustan, P. Getting to the Point: Accuracy of Point Count in Monitoring Ecosystem Change. J. Mar. Biol. 2012, 2012, 1–7. [Google Scholar] [CrossRef] [Green Version]
  97. Jokiel, P.L.; Rodgers, K.S.; Brown, E.K.; Kenyon, J.C.; Aeby, G.; Smith, W.R.; Farrell, F. Comparison of methods used to estimate coral cover in the Hawaiian Islands. PeerJ 2015, 3, e954. [Google Scholar] [CrossRef] [Green Version]
  98. Brock, R.; English, E.; Kenchington, E.; Tasker, M. The alphabet soup that protects cold-water corals in the North Atlantic. Mar. Ecol. Prog. Ser. 2009, 397, 355–360. [Google Scholar] [CrossRef]
  99. Huvenne, V.A.I.; Bett, B.J.; Masson, D.G.; Le Bas, T.P.; Wheeler, A. Effectiveness of a deep-sea cold-water coral Marine Protected Area, following eight years of fisheries closure. Biol. Conserv. 2016, 200, 60–69. [Google Scholar] [CrossRef] [Green Version]
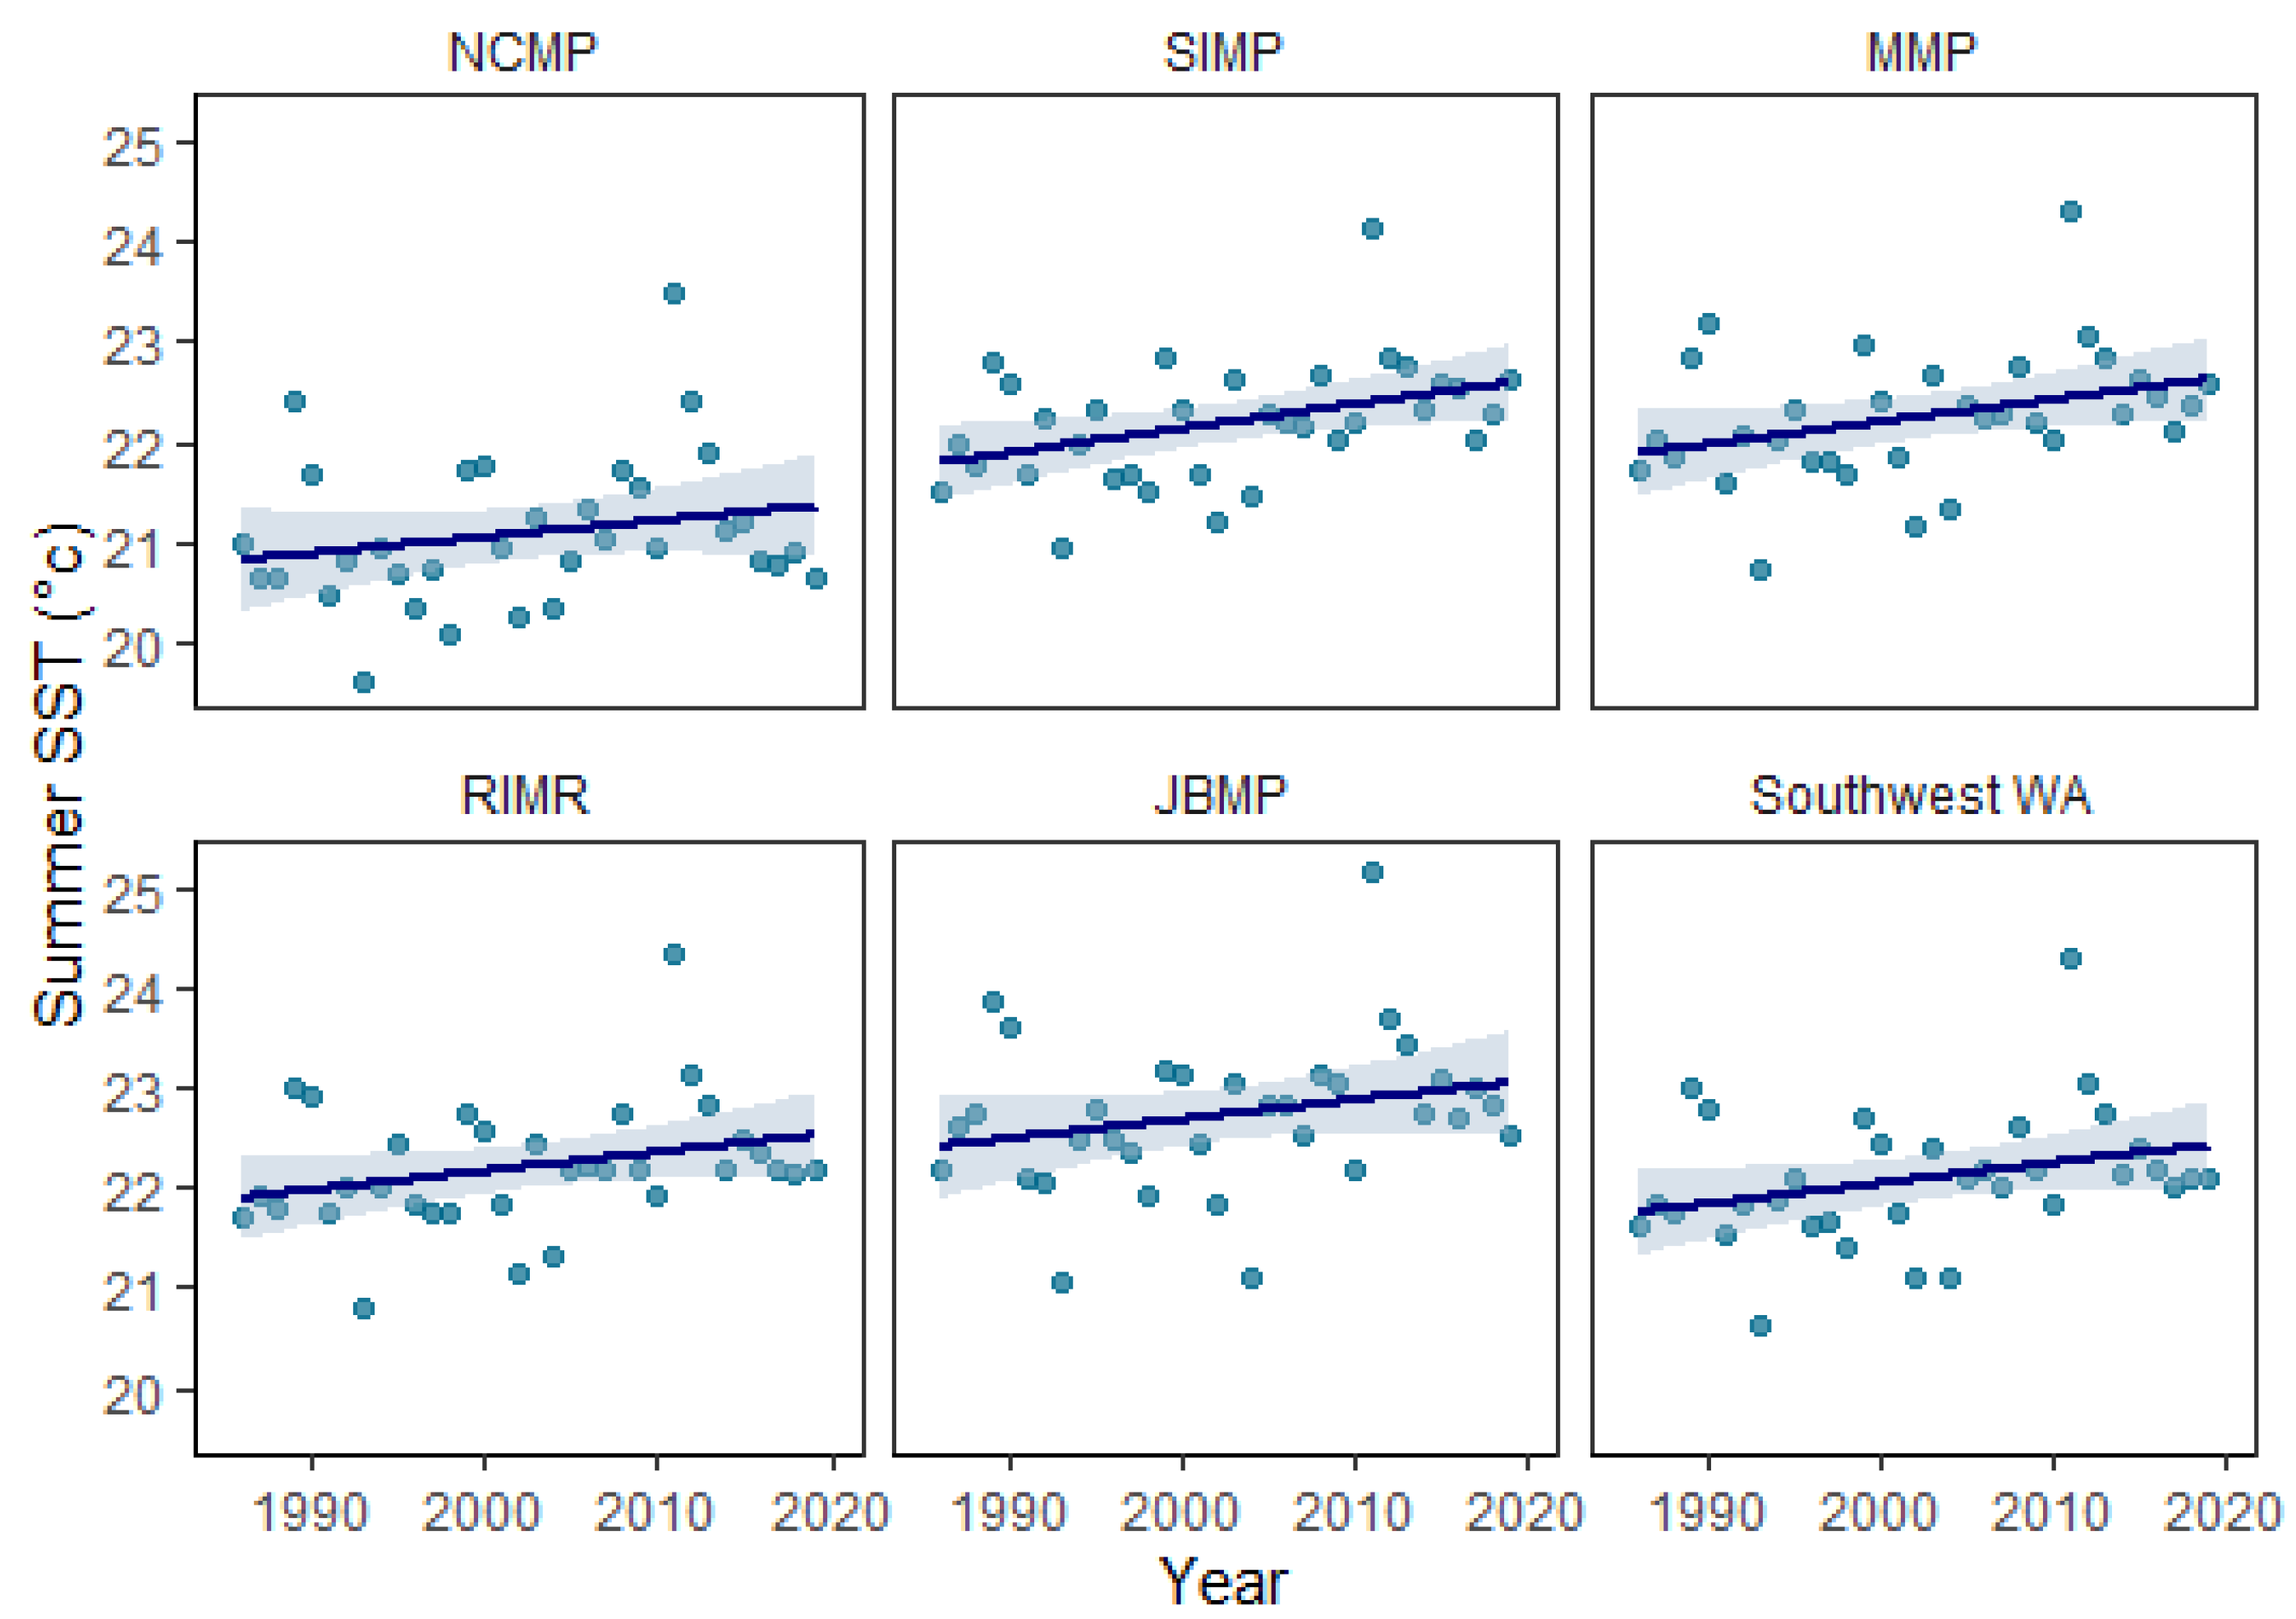
Figure 1. Coral survey sites (orange dots) at sub-tropical and temperate marine parks in Australia’s south-west region. (1) Jurien Bay Marine Park (JBMP), (2) Marmion Marine Park (MMP), (3) Rottnest Island Marine Reserve (RIMR), (4) Shoalwater Islands Marine Park (SIMP), and (5) Ngari Capes Marine Park (NCMP).
Diversity 13 00554 g001
Figure 2. (a) Map of the survey locations and (b) seasonal timeseries of monthly average sea-surface temperature (SST) profiles for Jurien Bay Marine Park (JBMP), Marmion Marine Park (MMP), Rottnest Island Marine Reserve (RIMR), Shoalwater Islands Marine Park (SIMP), and Ngari Capes Marine Park (NCMP), which span a latitudinal gradient in sea-surface temperature (SST) along the West Australian coast. The spatial interpolation is the annual average SST for 2019 and the seasonal SST timeseries are the monthly means for 1986–2019. Data source: NOAA Coral ReefWatch 5 km SST (NOAA, 2021).
Diversity 13 00554 g002
Figure 3. Long-term increase in summer sea-surface temperature (SST) for Ngari Capes Marine Park (NCMP), Shoalwater Islands Marine Park (SIMP), Marmion Marine Park (MMP), Rottnest Island Marine Reserve (RIMR), Jurien Bay Marine Park (JBMP), and all five south-west WA marine parks based on mean summer (March) SST from 1986–2019 (black trend line, dashed red indicates 95% confidence interval; see Table 1 for trend line values). Data source: NOAA Coral ReefWatch 5 km SST (NOAA, 2021).
Diversity 13 00554 g003
Figure 4. Mean % coverage of hard-coral genera for five marine parks/reserves in south-western Australia. Sites sampled were JBMP n = 44, RIMR n = 25, MIMP n = 8, SIMP n = 8, NCMP n = 20 (‘A’ diver quadrat data at depth < 15 m and ‘B’ tow-camera data at depth > 10 m). Error bars represent 95% CI about the mean total coverage. Data were derived using three survey techniques; SCUBA photo quadrat, in situ SCUBA quadrat and tow-camera quadrat, collected from transect replicates. For each marine park, the top three most abundant hard-coral genera are displayed, and the least common hard-coral genera are grouped as ‘other’. Asterisks (*) denote occasions where surveys were conducted but no coral was detected.
Diversity 13 00554 g004
Figure 5. Effect sizes for the per cent coral cover through time in Jurien Bay Marine Park (a) and Rottnest Island Marine Reserve (b). Red dots represent negative effects sizes and blue dots positive effects sizes. Closed dots represent results where the 95% confidence interval of the effect size does not overlap zero. For these sites, temporal trends in mean per cent coral cover are presented (c).
Diversity 13 00554 g005
Figure 6. Non-metric multi-dimensional scaling ordination plot based on Bray–Curtis similarity matrices derived from absolute abundance (% cover) of hard-coral genera (2015–2019) from transect-replicates at sites in four marine protected areas; Jurien Bay Marine Park (JMBP), Rottnest Island Marine Reserve (RIMR), Marmion Marine Park (MMP), and Ngari Capes Marine Park (NCMP). Shoalwater Islands Marine Park was not included because coral cover was low (<1%) and not identified to genera. Correlations to key genera are displayed as overlayed vectors (r = 0.4).
Diversity 13 00554 g006
Figure 7. Colonies of (a) Acropora, (b,c) Montipora, and (d) Pocillopora at Fishermans Island 2, Jurien Bay Marine Park, Western Australia (photos: C. Ross, taken in May 2021).
Diversity 13 00554 g007
Table 1. The coordinates (latitude and longitude), mean annual sea surface temperature (SST) between 1986 and 2019, the long-term increase in SST based on monthly mean summer (March) temperature, and the maximum degree heating weeks (DHW).
Marine ParkLatitude (° S)Longitude (° E)Mean Annual SST (°C)SST Increase
(°C yr−1)
Max. DHW
JBMP30.125114.92521.00.0193
(r2 = 0.10, p = 0.15)
28.0
RIMR32.025115.47520.50.0206
(r2 = 0.10, p = 0.07)
24.9
MMP31.825115.67520.30.0224
(r2 = 0.12, p = 0.05)
23.3
SIMP32.325115.67520.10.0244
(r2 = 0.17, p = 0.02)
22.3
NCMP33.825114.92519.50.0164
(r2 = 0.05, p = 0.22)
22.9
South-west WA MPAs--20.30.020
(r2 = 0.09, p = 0.08)
28.0
Table 2. Model selection table for generalized additive mixed effects models predicting coral occurrence and coral per cent cover year in Jurien Bay Marine Park (JBMP) and Rottnest Island Marine Reserve (RIMR). The difference between the lowest reported Akaike Information Criterion corrected for small sample size (AICc), AICc weights (wAICc), variance explained (R2), and estimated degrees of freedom (EDF) are reported for model comparison. The most parsimonious model is shown in bold and was defined as the model that contains the fewest variables and the lowest EDF within two units of the lowest AICc.
JBMPEDFΔAICcwAICDeviance Explained
Coral per cent cover ~ year + site14.700.9949.7%
Coral per cent cover ~ 1 + site13.713.90.0145.8%
RIMPEDFΔAICcwAICDeviance Explained
Coral per cent cover ~ year + site9.300.4119.7%
Coral per cent cover ~ 1 + site8.20.70.5918.8%
Table 3. Statistical results for PERMANOVA and ANOSIM routines based on Bray–Curtis similarity matrices derived from per-cent-cover genera-assemblage data collected in two marine parks, at sites where hard corals were observed in at least three different years. Data were derived from quadrats collected along transects, which were used as replicates. Hard-coral observations not identified to genera were excluded. * denotes random effects.
JBMPRIMR
dfMSPseudo-fp-ValuedfMSPseudo-fp-Value
PERMANOVAYear98792.02.8<0.0183609.51.00.5
Site *84994.22.2<0.0164885.81.90.01
Year × Site *273184.51.40.02193654.91.40.05
Residual502302 162608
Total94 49
ANOSIM R-Statp-ValueR-Statp-Value
Year (unordered)0.360.00010.250.035
Year (ordered)0.08>0.050.093>0.05
Site0.220.0020.410.001
Publisher’s Note: MDPI stays neutral with regard to jurisdictional claims in published maps and institutional affiliations.

