
The Third Global Coral Bleaching Event on the Marginal Coral Reefs of the Southwestern Indian Ocean and Factors That Contribute to Their Resistance and Resilience


Abstract
:1. Introduction
2. Materials and Methods
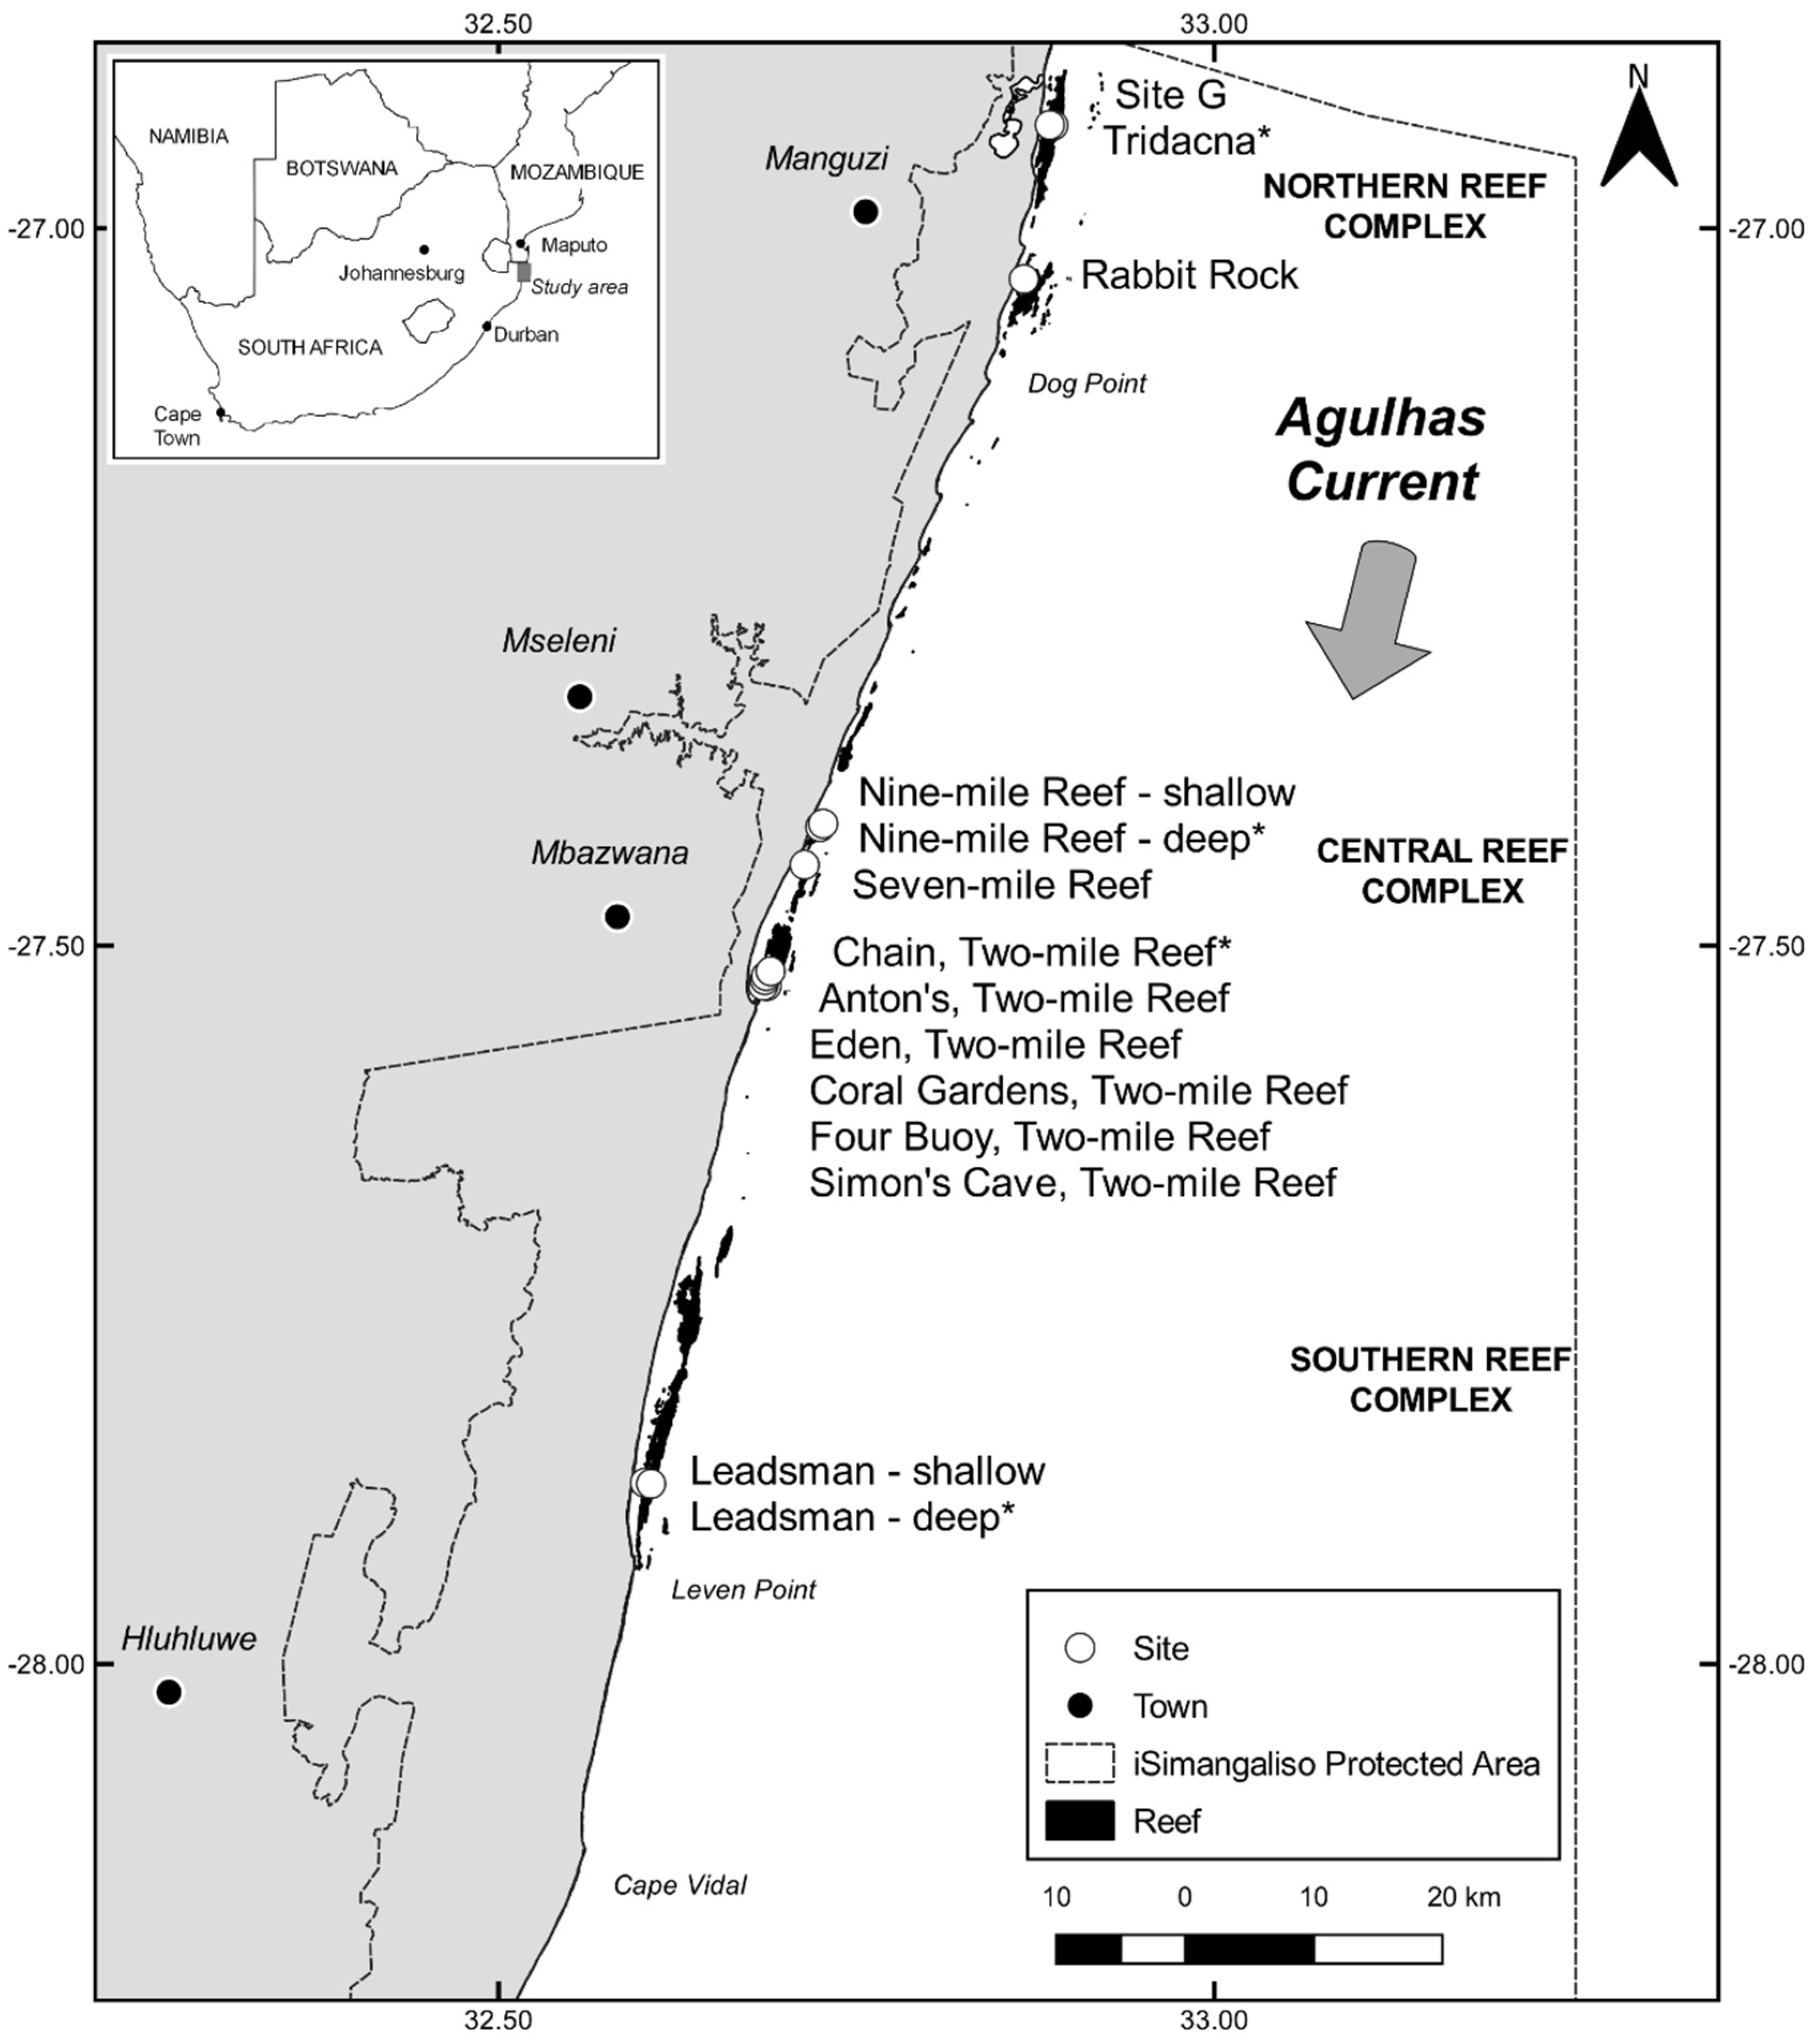
2.1. Temperature Data
2.2. Coral Bleaching Data
2.3. Data Analysis
3. Results
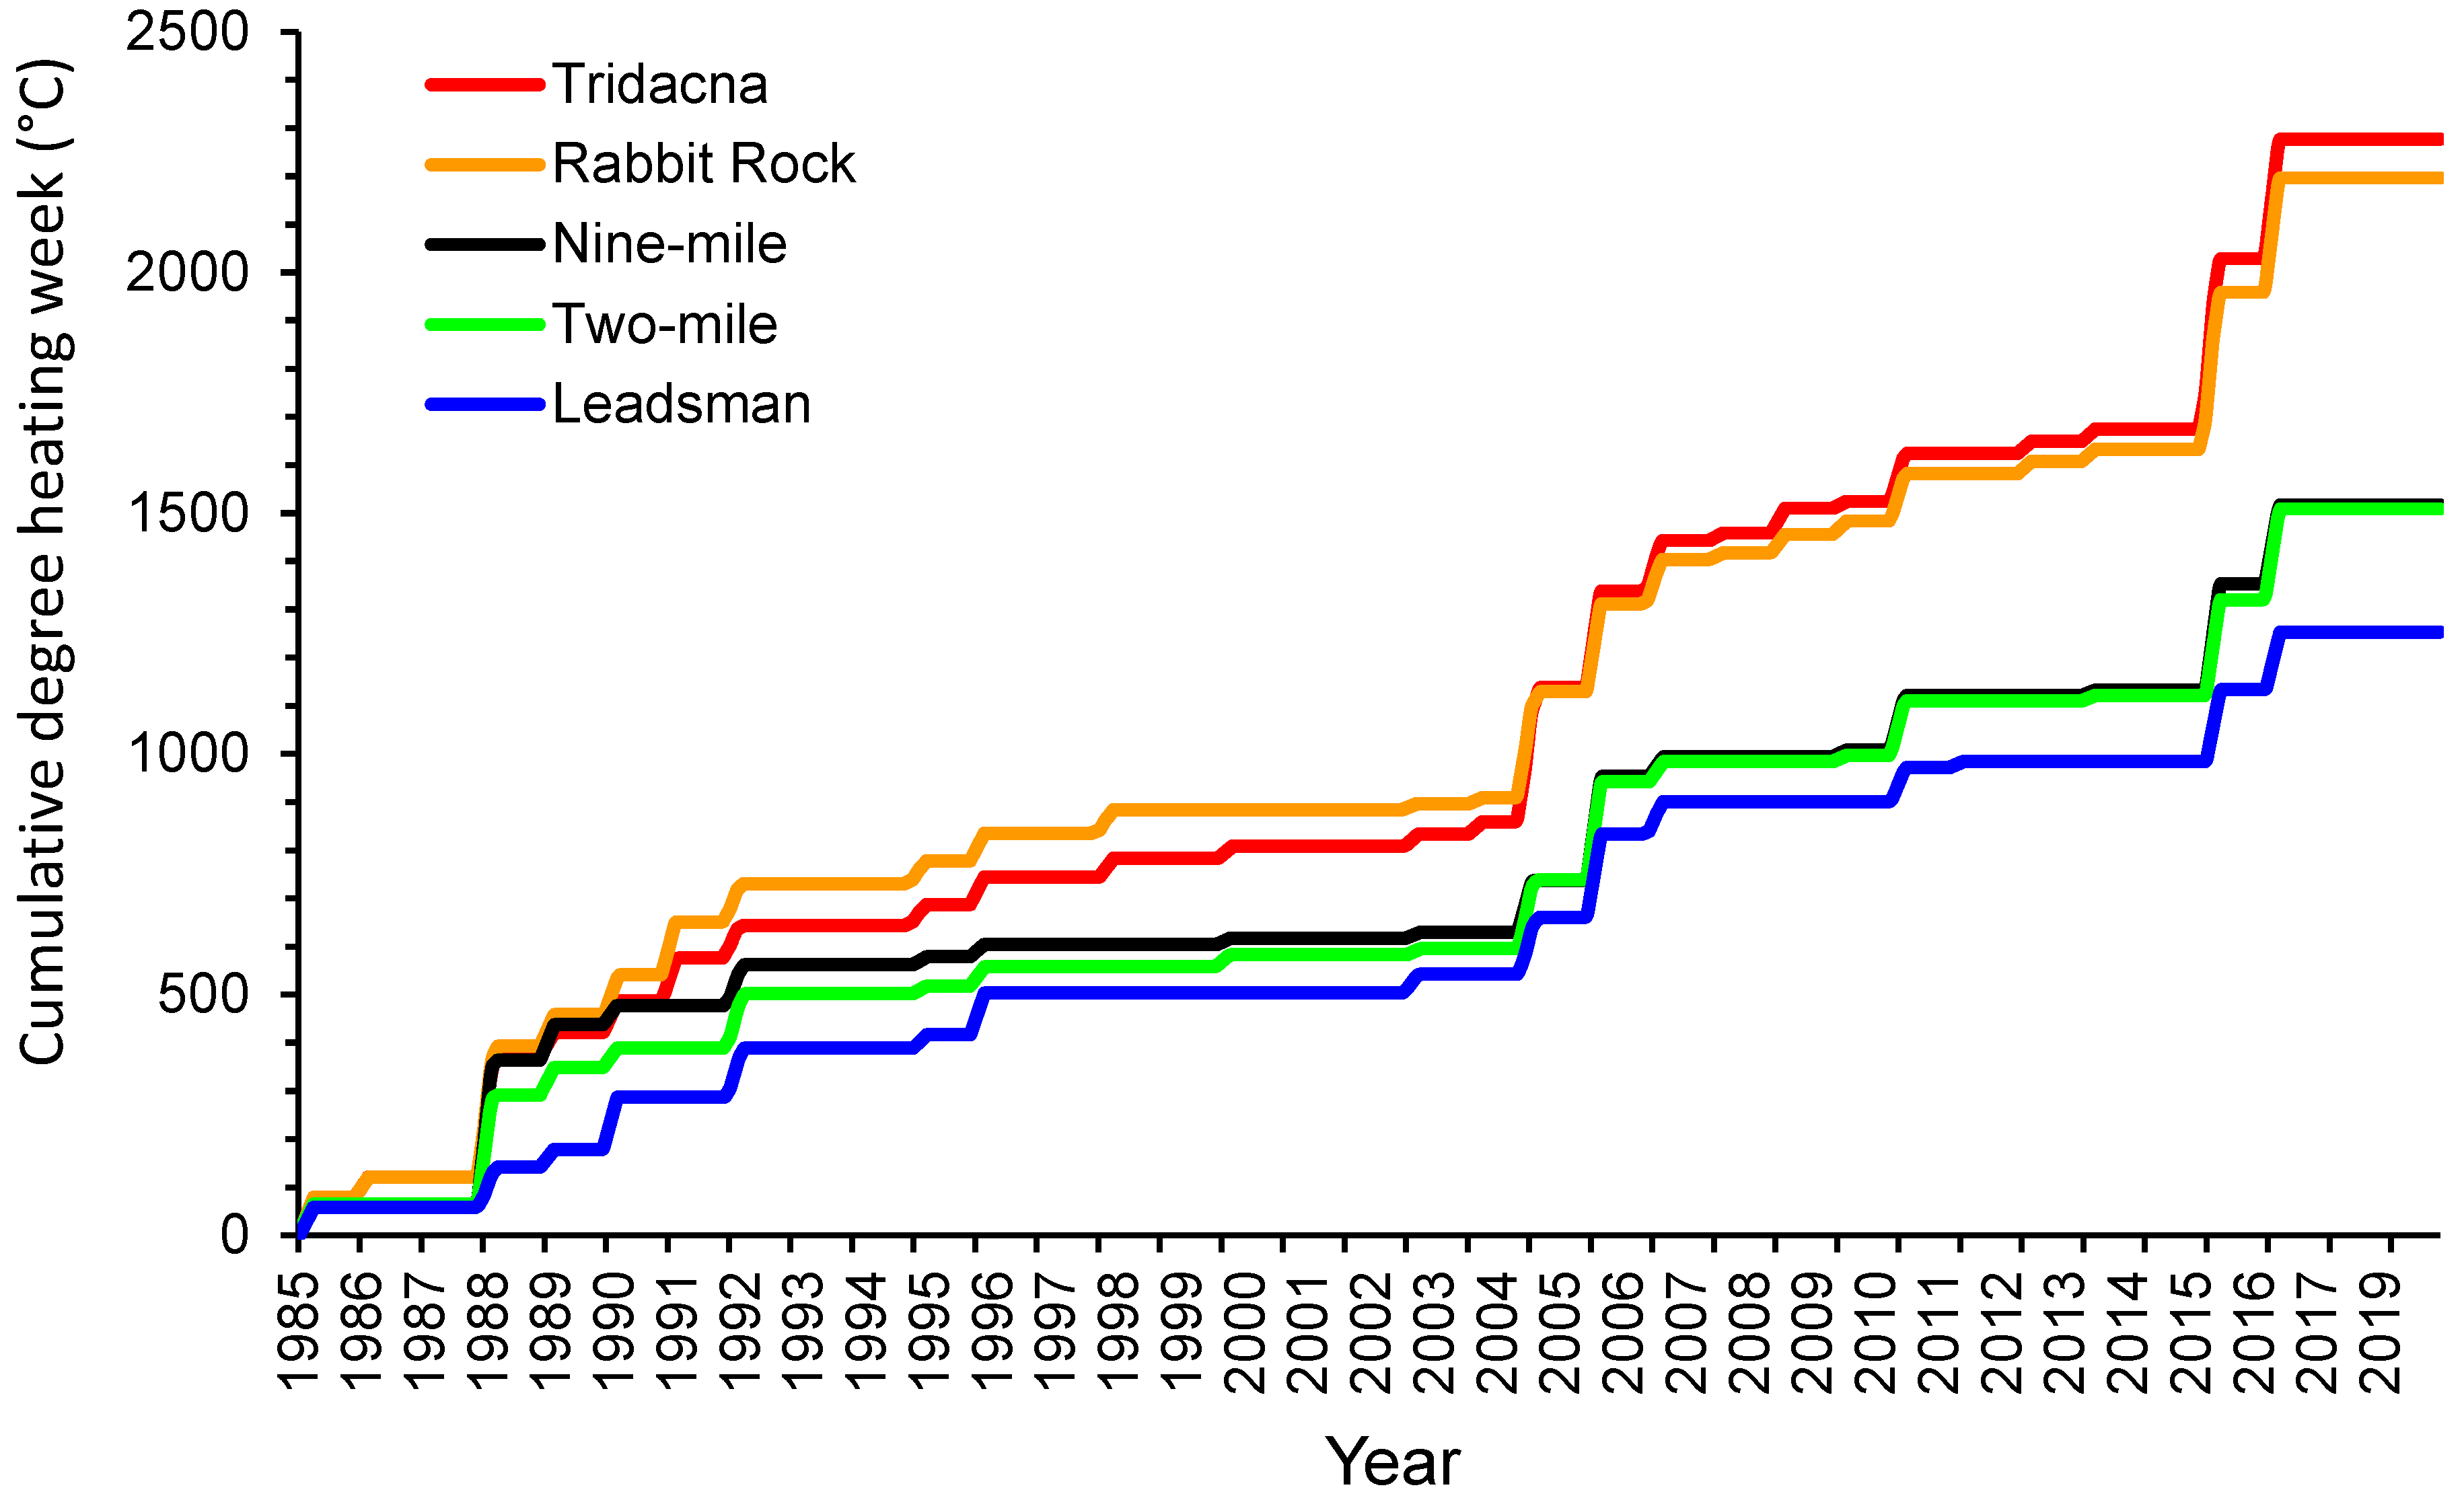
3.1. Temperature
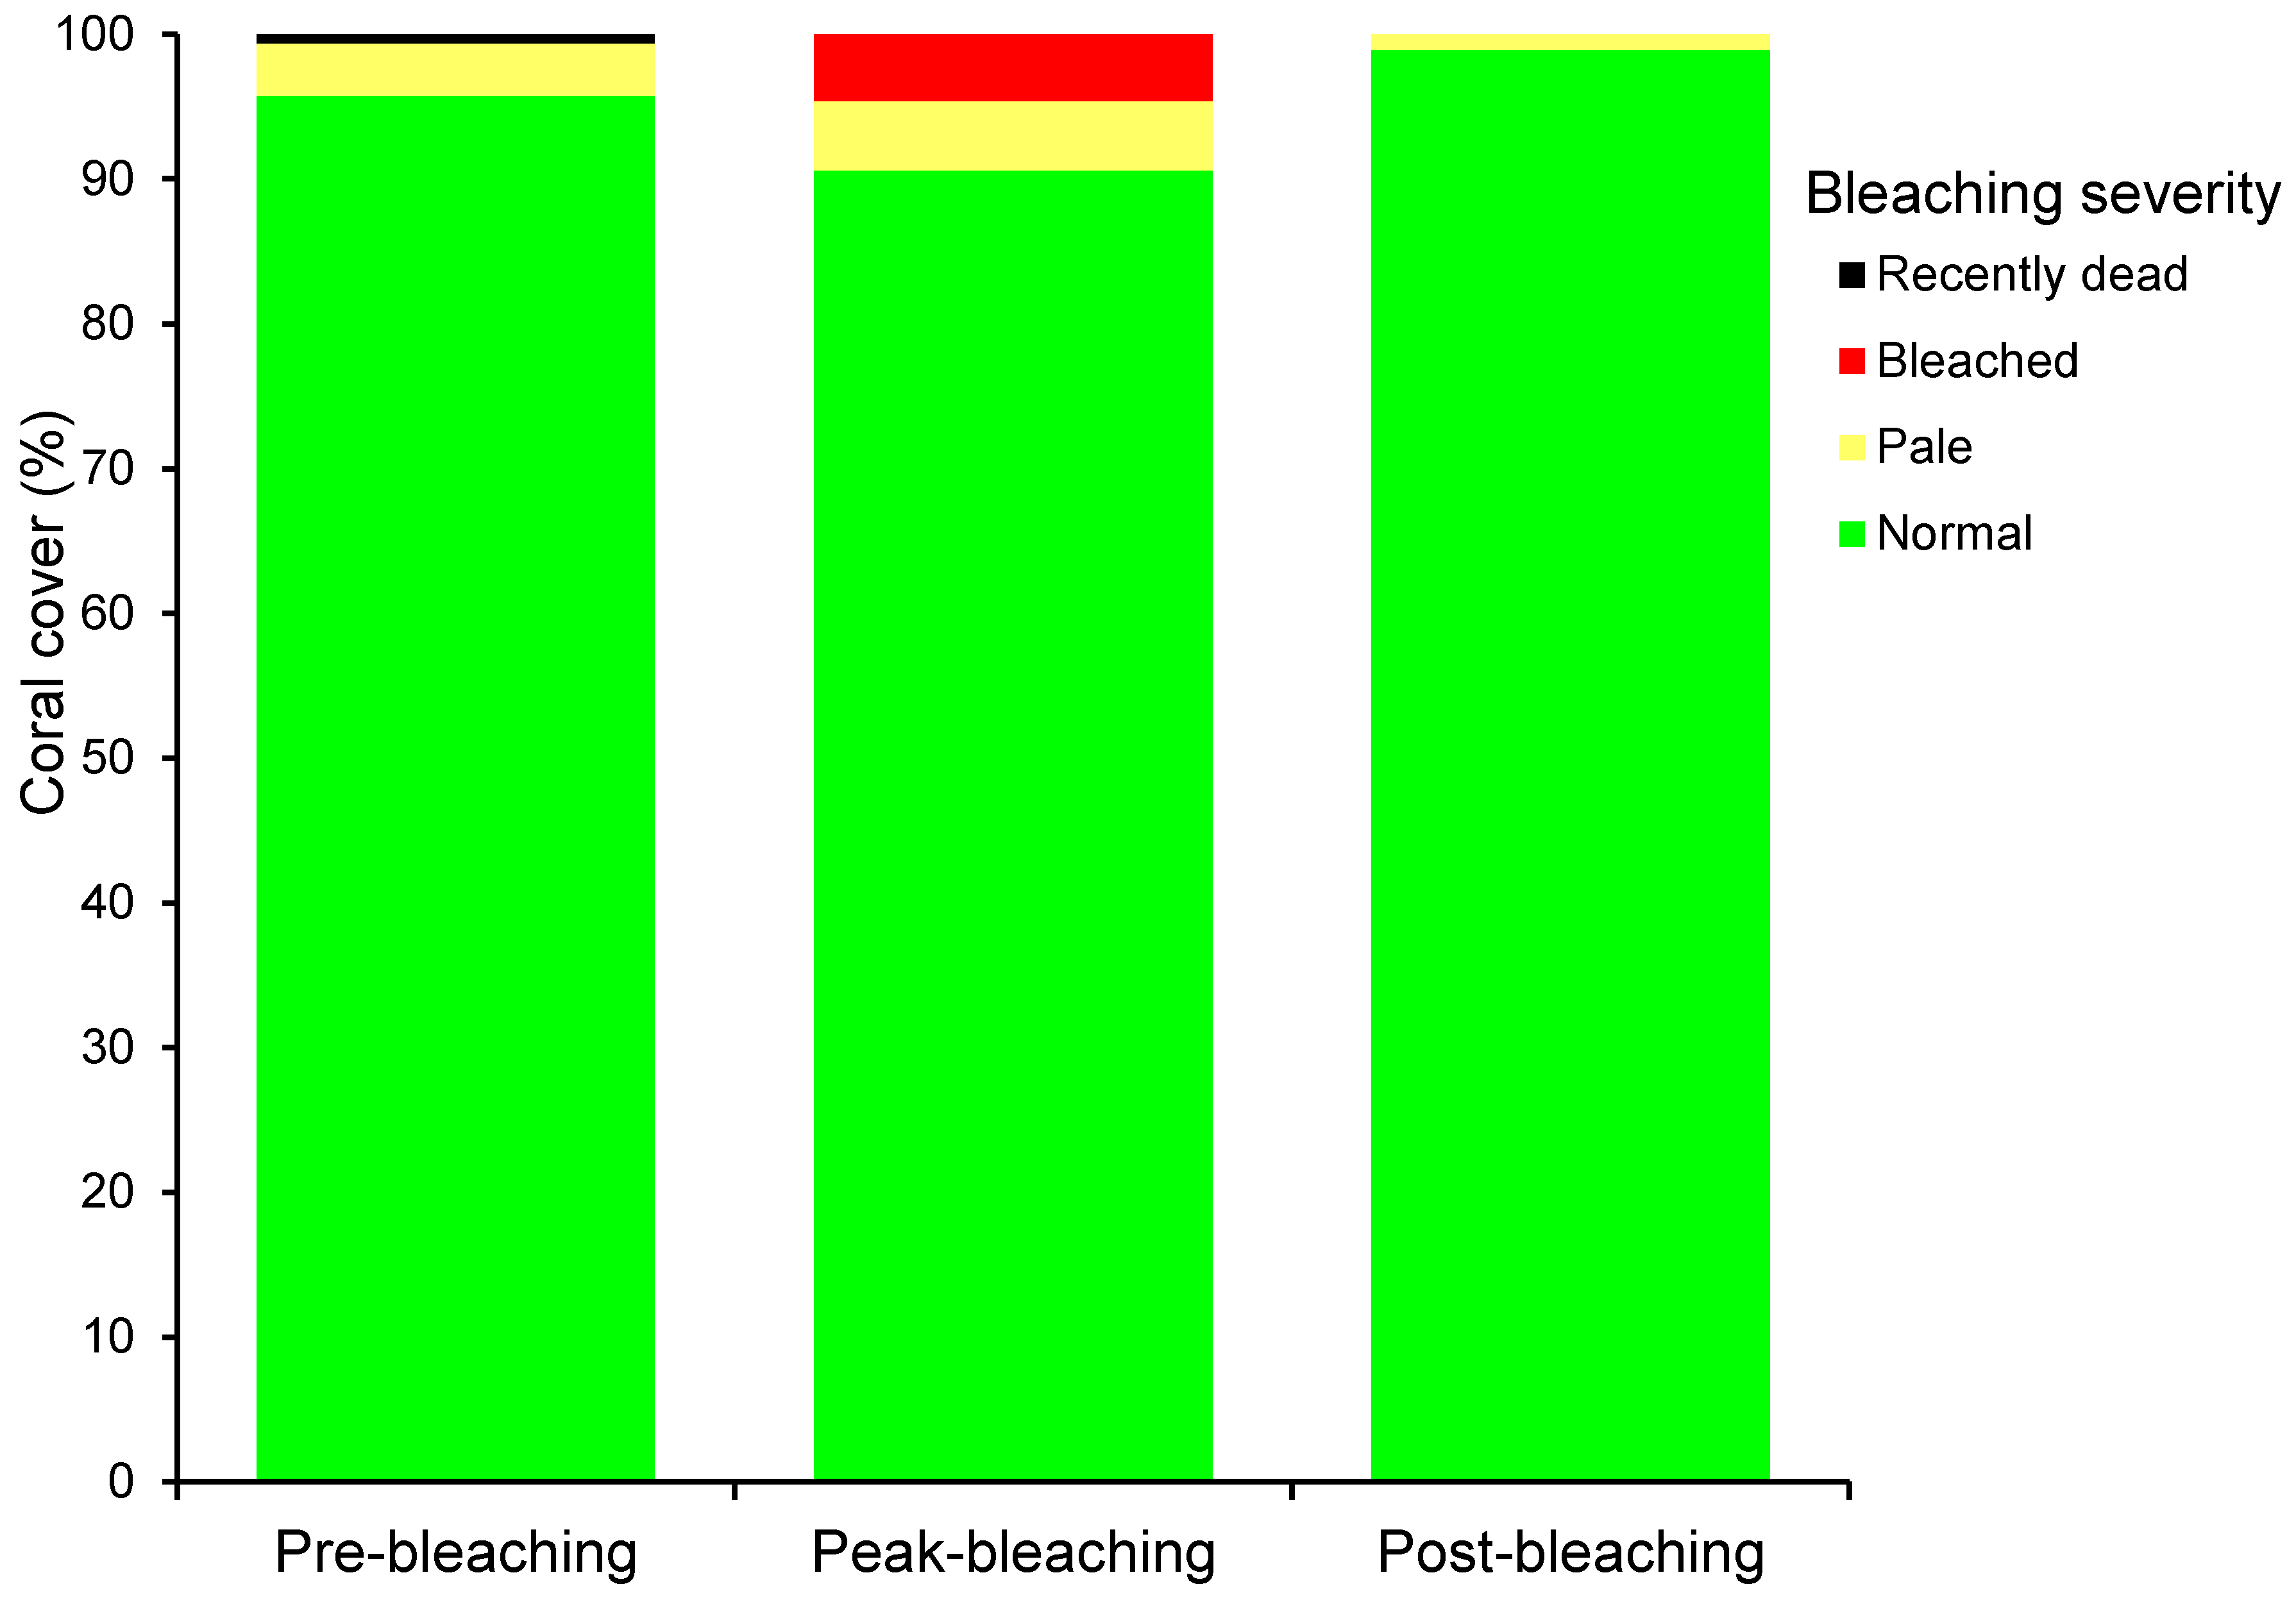
3.2. Coral Bleaching
4. Discussion
4.1. Temperature
4.2. Coral Bleaching
5. Conclusions
Supplementary Materials
Author Contributions
Funding
Institutional Review Board Statement
Data Availability Statement
Acknowledgments
Conflicts of Interest
References
- Spalding, M.; Burke, L.; Wood, S.A.; Ashpole, J.; Hutchison, J.; Ermgassen, P. Mapping the global value and distribution of coral reef tourism. Mar. Policy 2017, 82, 104–113. [Google Scholar] [CrossRef]
- Woodhead, A.J.; Hicks, C.C.; Norström, A.V.; Williams, G.J.; Graham, N.A.J. Coral reef ecosystem services in the Anthropocene. Funct. Ecol. 2019, 33, 1023–1034. [Google Scholar] [CrossRef] [Green Version]
- Hughes, T.P.; Barnes, M.L.; Bellwood, D.R.; Cinner, J.E.; Cumming, G.S.; Jackson, J.B.C.; Kleypas, J.; van de Leemput, I.A.; Lough, J.M.; Morrison, T.H.; et al. Coral reefs in the Anthropocene. Nature 2017, 546, 82–90. [Google Scholar] [CrossRef] [PubMed]
- Hoegh-Guldberg, O. Climate change, coral bleaching and the future of the world’s coral reefs. Mar. Freshw. Res. 1999, 50, 839–866. [Google Scholar] [CrossRef] [Green Version]
- Baird, A.H.; Bhagooli, R.; Ralph, P.J.; Takahashi, S. Coral bleaching: The role of the host. Trends Ecol. Evol. 2009, 24, 16–20. [Google Scholar] [CrossRef] [PubMed]
- Hughes, T.P.; Kerry, J.T.; Álvarez-Noriega, M.; Álvarez-Romero, J.G.; Anderson, K.D.; Baird, A.H.; Babcock, R.C.; Beger, M.; Bellwood, D.R.; Berkelmans, R.; et al. Global warming and recurrent mass bleaching of corals. Nature 2017, 543, 373–377. [Google Scholar] [CrossRef]
- Gudka, M.; Obura, D.; Mbugua, J.; Ahamada, S.; Kloiber, U.; Holter, T. Participatory reporting of the 2016 bleaching event in the Western Indian Ocean. Coral Reefs 2020, 39, 1–11. [Google Scholar] [CrossRef]
- Riegl, B.; Schleyer, M.H.; Cook, P.J.; Branch, G.M. Structure of Africa’s Southernmost Coral Communities. Bull. Mar. Sci. 1995, 56, 676–691. [Google Scholar]
- Schleyer, M.H. South African coral communities. In Coral Reefs Indian Ocean their Ecology and Conservation; Oxford University Press: New York, NY, USA, 2000; pp. 83–105. [Google Scholar]
- Porter, S.N.; Branch, G.M.; Sink, K.J. Changes in shallow-reef community composition along environmental gradients on the East African coast. Mar. Biol. 2017, 164, 101. [Google Scholar] [CrossRef]
- Schleyer, M.H.; Floros, C.; Laing, S.C.S.; Macdonald, A.H.H.; Montoya-Maya, P.H.; Morris, T.; Porter, S.N.; Seré, M.G. What can South African reefs tell us about the future of high-latitude coral systems? Mar. Pollut. Bull. 2018, 136, 491–507. [Google Scholar] [CrossRef]
- Schleyer, M.H.; Porter, S.N. Drivers of soft and stony coral community distribution on the high-latitude coral reefs of South Africa. Adv. Mar. Biol. 2018, 80, 1–55. [Google Scholar] [CrossRef]
- Celliers, L.; Schleyer, M.H. Coral community structure and risk assessment of high-latitude reefs at Sodwana Bay, South Africa. Biodivers. Conserv. 2008, 17, 3097–3117. [Google Scholar] [CrossRef]
- Porter, S.N.; Schleyer, M.H. Environmental variation and how its spatial structure influences the cross-shelf distribution of high-latitude coral communities in South Africa. Diversity 2019, 11, 57. [Google Scholar] [CrossRef] [Green Version]
- Porter, S.N.; Schleyer, M.H. Long-term dynamics of a high-latitude coral reef community at Sodwana Bay, South Africa. Coral Reefs 2017, 36, 369–382. [Google Scholar] [CrossRef]
- Goreau, T.; McClanahan, T.; Hayes, R.; Strong, A.L. Conservation of coral reefs after the 1998 global bleaching event. Conserv. Biol. 2000, 14, 5–15. [Google Scholar] [CrossRef]
- Wilkinson, C. Status of Coral Reefs of The World: 2000; Australian Institute of Marine Science: Townsville, QLD, Australia, 2000; ISBN 0642322090. [Google Scholar]
- Schleyer, M.H.; Celliers, L. The status of South African coral reefs. In Coral Reef Degradation in the Indian Ocean; Souter, D., Obura, D., Linden, O., Eds.; CORDIO: Stockholm, Sweden, 2000; pp. 49–50. [Google Scholar]
- Wilkinson, C.; Lindén, O.; Cesar, H.; Hodgson, G.; Rubens, J.; Strong, A.E. Ecological and socioeconomic impacts of 1998 coral mortality in the Indian Ocean: An ENSO impact and a warning of future change? Ambio 1999, 28, 188–196. [Google Scholar]
- Riegl, B.; Piller, W.E. Upwelling areas as possible refugia for reefs in times of rising SST? Further evidence from the Carribean and Indian Oceans. In Proceedings of the 9th International Coral Reef Symposium, Bali, Indonesia, 23–27 October 2000; Volume 1, pp. 315–320. [Google Scholar]
- Celliers, L.; Schleyer, M.H. Coral bleaching on high-latitude marginal reefs at Sodwana Bay, South Africa. Mar. Pollut. Bull. 2002, 44, 1380–1387. [Google Scholar] [CrossRef]
- Floros, C.D.; Samways, M.J.; Armstrong, B. Taxonomic patterns of bleaching within a South African coral assemblage. Biodivers. Conserv. 2004, 13, 1175–1194. [Google Scholar] [CrossRef]
- McClanahan, T.R.; Ateweberhan, M.; Graham, N.A.J.; Wilson, S.K.; Sebastián, C.R.; Guillaume, M.M.M.; Bruggemann, J.H. Western Indian Ocean coral communities: Bleaching responses and susceptibility to extinction. Mar. Ecol. Prog. Ser. 2007, 337, 1–13. [Google Scholar] [CrossRef] [Green Version]
- Sebastián, C.R.; Sink, K.J.; McClanahan, T.R.; Cowan, D.A. Bleaching response of corals and their Symbiodinium communities in southern Africa. Mar. Biol. 2009, 156, 2049–2062. [Google Scholar] [CrossRef]
- Glynn, P.W. Coral reef bleaching: Facts, hypotheses and implications. Glob. Chang. Biol. 1996, 2, 495–509. [Google Scholar] [CrossRef]
- Riegl, B.; Piller, W.E. Possible refugia for reefs in times of environmental stress. Int. J. Earth Sci. 2003, 92, 520–531. [Google Scholar] [CrossRef]
- McClanahan, T.R.; Muthiga, N.A. Oceanic patterns of thermal stress and coral community degradation on the island of Mauritius. Coral Reefs 2021, 40, 53–74. [Google Scholar] [CrossRef]
- Holling, C.S. Resilience and stability of ecological systems. Annu. Rev. Ecol. Syst. 1973, 4, 1–23. [Google Scholar] [CrossRef] [Green Version]
- West, J.M.; Salm, R.V. Resistance and resilience to coral bleaching: Implications for coral reef conservation and management. Conserv. Biol. 2003, 17, 956–967. [Google Scholar] [CrossRef] [Green Version]
- Fox, M.D.; Cohen, A.L.; Rotjan, R.D.; Mangubhai, S.; Sandin, S.A.; Smith, J.E.; Thorrold, S.R.; Dissly, L.; Mollica, N.R.; Obura, D. Increasing coral reef resilience through successive marine heatwaves. Geophys. Res. Lett. 2021, 48, e2021GL094128. [Google Scholar] [CrossRef]
- Walker, B.; Holling, C.S.; Carpenter, S.R.; Kinzig, A. Resilience, adaptability and transformability in social–ecological systems. Ecol. Soc. 2004, 9. [Google Scholar] [CrossRef]
- Sutherland, J.P. Perturbations, resistance, and alternative views of the existence of multiple stable points in nature. Am. Nat. 1990, 136, 270–275. [Google Scholar] [CrossRef]
- Grimsditch, G.D.; Salm, R.V. Coral Reef Resilience and Resistance to Bleaching; IUCN: Gland, Switzerland, 2006; ISBN 2831709504. [Google Scholar]
- Cerutti, J.M.B.; Burt, A.J.; Haupt, P.; Bunbury, N.; Mumby, P.J.; Schaepman-Strub, G. Impacts of the 2014–2017 global bleaching event on a protected remote atoll in the Western Indian Ocean. Coral Reefs 2020, 39, 15–26. [Google Scholar] [CrossRef]
- NOAA Coral Reef Watch Version 3.1 Daily Global 5 km Satellite Coral Bleaching Degree Heating Week Product. Available online: Ftp://ftp.star.nesdis.noaa.gov/pub/sod/mecb/crw/data/5km/v3.1/nc/v1.0/daily/dhw/ (accessed on 1 February 2021).
- Taylor, K.E.; Stouffer, R.J.; Meehl, G.A. An overview of CMIP5 and the experiment design. Bull. Am. Meteorol. Soc. 2012, 93, 485–498. [Google Scholar] [CrossRef] [Green Version]
- Van Vuuren, D.P.; Edmonds, J.; Kainuma, M.; Riahi, K.; Thomson, A.; Hibbard, K.; Hurtt, G.C.; Kram, T.; Krey, V.; Lamarque, J.F.; et al. The representative concentration pathways: An overview. Clim. Chang. 2011, 109, 5. [Google Scholar] [CrossRef]
- Williams, D.N.; Lawrence, B.N.; Lautenschlager, M.; Middleton, D.; Balaji, V. The earth system grid federation: Delivering globally accessible peta-scale data for CMIP5. APAN Proc. 2011, 32, 121. [Google Scholar] [CrossRef]
- McClanahan, T.R. The relationship between bleaching and mortality of common corals. Mar. Biol. 2004, 144, 1239–1245. [Google Scholar] [CrossRef]
- Hyndman, R.; Athanasopoulos, G.; Bergmeir, C.; Caceres, G.; Chhay, L.; O’Hara-Wild, M.; Petropoulos, F.; Razbash, S.; Wang, E.; Yasmeen, F. Forecast: Forecasting Functions for Time Series and Linear Models. Available online: http://sunsite.icm.edu.pl/packages/cran/web/packages/forecast/forecast.pdf (accessed on 18 September 2021).
- R Core Team R: A Language and Environment for Statistical Computing. 2020. Available online: http://www.r-project.org/index.html (accessed on 18 September 2021).
- Farnum, N.R.; Stanton, L.W. Quantitative Forecasting Methods; Pws Publishing Company: Boston, MA, USA, 1989; ISBN 0534916864. [Google Scholar]
- Anderson, M.J. A new method for non–parametric multivariate analysis of variance. Austral Ecol. 2001, 26, 32–46. [Google Scholar] [CrossRef]
- Anderson, M.J. Distance-based tests for homogeneity of multivariate dispersions. Biometrics 2006, 62, 245–253. [Google Scholar] [CrossRef]
- Anderson, M.J.; Clarke, K.R.; Gorley, R.N. PERMANOVA+ for PRIMER: Guide to Software and Statistical Methods; PRIMER-E: Plymouth, UK, 2008; Available online: http://www.primer-e.com (accessed on 18 September 2021).
- Berkelmans, R.; Weeks, S.J.; Steinberga, C.R. Upwelling linked to warm summers and bleaching on the Great Barrier Reef. Limnol. Oceanogr. 2010, 55, 2634–2644. [Google Scholar] [CrossRef] [Green Version]
- Rohner, C.A.; Weeks, S.J.; Richardson, A.J.; Pierce, S.J.; Magno-Canto, M.M.; Feldman, G.C.; Cliff, G.; Roberts, M.J. Oceanographic influences on a global whale shark hotspot in southern Mozambique. PeerJ Prepr. 2014, 2, e661v1. [Google Scholar] [CrossRef]
- Glynn, P.W. Coral reef bleaching in the 1980s and possible connections with global warming. Trends Ecol. Evol. 1991, 6, 175–179. [Google Scholar] [CrossRef]
- Wolter, K.; Timlin, M.S. El Niño/Southern Oscillation behaviour since 1871 as diagnosed in an extended multivariate ENSO index (MEI. ext). Int. J. Climatol. 2011, 31, 1074–1087. [Google Scholar] [CrossRef]
- McClanahan, T.R.; Ateweberhan, M.; Ruiz Sebastián, C.; Graham, N.A.J.; Wilson, S.K.; Bruggemann, J.H.; Guillaume, M.M.M. Predictability of coral bleaching from synoptic satellite and in situ temperature observations. Coral Reefs 2007, 26, 695–701. [Google Scholar] [CrossRef]
- Zhang, L.; Du, Y.; Cai, W. Low-frequency variability and the unusual Indian Ocean Dipole events in 2015 and 2016. Geophys. Res. Lett. 2018, 45, 1040–1048. [Google Scholar] [CrossRef] [Green Version]
- Kim, H.-M.; Webster, P.J.; Curry, J.A. Evaluation of short-term climate change prediction in multi-model CMIP5 decadal hindcasts. Geophys. Res. Lett. 2012, 39. [Google Scholar] [CrossRef]
- Jacob, D.; Petersen, J.; Eggert, B.; Alias, A.; Christensen, O.B.; Bouwer, L.M.; Braun, A.; Colette, A.; Déqué, M.; Georgievski, G.; et al. EURO-CORDEX: New high-resolution climate change projections for European impact research. Reg. Environ. Chang. 2014, 14, 563–578. [Google Scholar] [CrossRef]
- Lynch, C.; Seth, A.; Thibeault, J. Recent and projected annual cycles of temperature and precipitation in the Northeast United States from CMIP5. J. Clim. 2016, 29, 347–365. [Google Scholar] [CrossRef]
- Calafat, F.M.; Jordà, G.; Marcos, M.; Gomis, D. Comparison of Mediterranean sea level variability as given by three baroclinic models. J. Geophys. Res. Ocean. 2012, 117. [Google Scholar] [CrossRef] [Green Version]
- Perkins, S.E.; Moise, A.; Whetton, P.; Katzfey, J. Regional changes of climate extremes over Australia—A comparison of regional dynamical downscaling and global climate model simulations. Int. J. Climatol. 2014, 34, 3456–3478. [Google Scholar] [CrossRef]
- Agulles, M.; Jordà, G.; Hoteit, I.; Agustí, S.; Duarte, C.M. Assessment of Red Sea temperatures in CMIP5 models for present and future climate. PLoS ONE 2021, 16, e0255505. [Google Scholar] [CrossRef]
- Jordà, G.; Marbà, N.; Duarte, C.M. Mediterranean seagrass vulnerable to regional climate warming. Nat. Clim. Chang. 2012, 2, 821–824. [Google Scholar] [CrossRef] [Green Version]
- Porter, S.N.; Humphries, M.S.; Buah-Kwofie, A.; Schleyer, M.H. Accumulation of organochlorine pesticides in reef organisms from marginal coral reefs in South Africa and links with coastal groundwater. Mar. Pollut. Bull. 2018, 137, 295–305. [Google Scholar] [CrossRef]
- Kayanne, H. Validation of degree heating weeks as a coral bleaching index in the northwestern Pacific. Coral Reefs 2017, 36, 63–70. [Google Scholar] [CrossRef]
- Gudka, M.; Obura, D.; Mwaura, J.; Porter, S.; Yahya, S.; Mabwa, R. Impact of the 3rd Global Coral Bleaching Event on the Western Indian Ocean in 2016; Global Coral Reef Monitoring Network (GCRMN)/Indian Ocean Commission: Port Louis, Mauritius, 2018; p. 67. [Google Scholar] [CrossRef]
- Sully, S.; Burkepile, D.E.; Donovan, M.K.; Hodgson, G.; Van Woesik, R. A global analysis of coral bleaching over the past two decades. Nat. Commun. 2019, 10, 1264. [Google Scholar] [CrossRef] [PubMed] [Green Version]
- Moore, J.A.Y.; Bellchambers, L.M.; Depczynski, M.R.; Evans, R.D.; Evans, S.N.; Field, S.N.; Friedman, K.J.; Gilmour, J.P.; Holmes, T.H.; Middlebrook, R.; et al. Unprecedented mass bleaching and loss of coral across 12° of latitude in Western Australia in 2010–11. PLoS ONE 2012, 7, e51807. [Google Scholar] [CrossRef] [Green Version]
- Kim, S.W.; Sampayo, E.M.; Sommer, B.; Sims, C.A.; Gómez-Cabrera, M.D.C.; Dalton, S.J.; Beger, M.; Malcolm, H.A.; Ferrari, R.; Fraser, N. Refugia under threat: Mass bleaching of coral assemblages in high-latitude eastern Australia. Glob. Chang. Biol. 2019, 25, 3918–3931. [Google Scholar] [CrossRef]
- Wooldridge, S.A.; Done, T.J. Improved water quality can ameliorate effects of climate change on corals. Ecol. Appl. 2009, 19, 1492–1499. [Google Scholar] [CrossRef]
- Wooldridge, S.A. Water quality and coral bleaching thresholds: Formalising the linkage for the inshore reefs of the Great Barrier Reef, Australia. Mar. Pollut. Bull. 2009, 58, 745–751. [Google Scholar] [CrossRef]
- Jin, Y.K.; Kininmonth, S.; Lundgren, P.B.; van Oppen, M.J.H.; Willis, B.L. Predicting the spatial distribution of allele frequencies for a gene associated with tolerance to eutrophication and high temperature in the reef-building coral, Acropora millepora, on the Great Barrier Reef. Coral Reefs 2020, 39, 147–158. [Google Scholar] [CrossRef]
- McClanahan, T.R.; Darling, E.S.; Maina, J.M.; Muthiga, N.A.; Leblond, J.; Arthur, R.; Jupiter, S.D.; Wilson, S.K.; Mangubhai, S.; Ussi, A.M. Highly variable taxa-specific coral bleaching responses to thermal stresses. Mar. Ecol. Prog. Ser. 2020, 648, 135–151. [Google Scholar] [CrossRef]
- Montoya-Maya, P.H.; Schleyer, M.H.; Macdonald, A.H.H. Limited ecologically relevant genetic connectivity in the south-east African coral populations calls for reef-level management. Mar. Biol. 2016, 163, 171. [Google Scholar] [CrossRef]


| Model | Trend | Spearman Correlation Coefficient | P(Spearman) | P(perANOVA) | ||||||||
|---|---|---|---|---|---|---|---|---|---|---|---|---|
| Monthly | YearlyAve | YearlyMax | Monthly | YearlyAve | YearlyMax | Monthly | YearlyAve | YearlyMax | Monthly | YearlyAve | YearlyMax | |
| In situ | −0.002 | −0.0053 | −0.0374 | ̶ | ̶ | ̶ | ̶ | ̶ | ̶ | ̶ | ̶ | ̶ |
| RCP2.6 | −0.0006 | 0.0132 | 0.0177 | 0.063 | −0.283 | 0.070 | 0.4386 | 0.3273 | 0.8129 | 0.0001 | 0.0001 | 0.0001 |
| RCP4.5 | −0.0015 | 0.0022 | 0.0041 | 0.034 | 0.631 | −0.234 | 0.6720 | 0.1410 | 0.4210 | 0.0001 | 0.0001 | 0.0001 |
| RCP6.0 | −0.0014 | 0.004 | 0.0081 | 0.286 | 0.669 | −0.172 | 0.0003 | 0.0088 | 0.5565 | 0.0001 | 0.0001 | 0.0001 |
| RCP8.5 | −0.0006 | 0.0129 | 0.0150 | 0.113 | 0.0171 | −0.272 | 0.1611 | 0.9537 | 0.3477 | 0.0001 | 0.0001 | 0.0001 |
| Source of Variation | df | MS | Pseudo-F | P(Monte-Carlo) |
|---|---|---|---|---|
| Latitude | 1 | 87.864 | 16.122 | 0.0015 |
| Depth | 1 | 6.2642 | 1.2233 | 0.2842 |
| Degree heating week (DHW) | 1 | 86.742 | 175.19 | 0.0062 |
| Year | 2 | 0.32103 | 0.056779 | 0.9443 |
| Latitude × Depth | 1 | 4.2134 | 0.7452 | 0.3974 |
| Latitude × DHW | 1 | 23.499 | 4.1561 | 0.0652 |
| Latitude × Year | 2 | 3.0228 | 0.53462 | 0.5929 |
| Depth × DHW | 1 | 2.2216 | 0.39293 | 0.5413 |
| Depth × Year | 2 | 0.3426 | 0.060594 | 0.9434 |
| DHW × Year | 1 | 3.1902 | 0.56424 | 0.468 |
| Latitude × Depth × DHW | 1 | 2.4955 | 0.44136 | 0.5076 |
| Latitude × Depth × Year | 2 | 3.0243 | 0.53489 | 0.5955 |
| Latitude × DHW × Year | 1 | 7.3053 | 1.292 | 0.2754 |
| Depth × DHW × Year | 1 | 1.2777 | 0.22597 | 0.6399 |
| Latitude × Depth × DHW × Year | 1 | 0.068484 | 0.012112 | 0.9164 |
| Residual | 13 | 5.654 | ||
| Total | 32 |
Publisher’s Note: MDPI stays neutral with regard to jurisdictional claims in published maps and institutional affiliations. |
© 2021 by the authors. Licensee MDPI, Basel, Switzerland. This article is an open access article distributed under the terms and conditions of the Creative Commons Attribution (CC BY) license (https://creativecommons.org/licenses/by/4.0/).
Share and Cite
Porter, S.N.; Sink, K.J.; Schleyer, M.H. The Third Global Coral Bleaching Event on the Marginal Coral Reefs of the Southwestern Indian Ocean and Factors That Contribute to Their Resistance and Resilience. Diversity 2021, 13, 464. https://doi.org/10.3390/d13100464
Porter SN, Sink KJ, Schleyer MH. The Third Global Coral Bleaching Event on the Marginal Coral Reefs of the Southwestern Indian Ocean and Factors That Contribute to Their Resistance and Resilience. Diversity. 2021; 13(10):464. https://doi.org/10.3390/d13100464
Chicago/Turabian StylePorter, Sean N., Kerry J. Sink, and Michael H. Schleyer. 2021. "The Third Global Coral Bleaching Event on the Marginal Coral Reefs of the Southwestern Indian Ocean and Factors That Contribute to Their Resistance and Resilience" Diversity 13, no. 10: 464. https://doi.org/10.3390/d13100464