Article

Identifying Mechanisms for Successful Ecological Restoration with Salvaged Topsoil in Coastal Sage Scrub Communities

1
Center for Environmental Biology, University of California, Irvine, Irvine, CA 92697-1450, USA
2
Department of Microbiology and Plant Pathology, University of California, Riverside, Riverside, CA 92521, USA
3
Center for Conservation Biology, University of California, Riverside, Riverside, CA 92521, USA
4
Department of Ecology and Evolutionary Biology, University of California, Irvine, Irvine, CA 92697, USA
5
Department of Botany and Plant Sciences, University of California, Riverside, Riverside, CA 92521, USA
6
U.S. Geological Survey, Southwest Biological Science Center, Moab, UT 84532, USA
7
UCI-Nature, University of California, Irvine, Irvine, CA 92697, USA
*
Author to whom correspondence should be addressed.
These authors contribute equally.
Diversity 2020, 12(4), 150; https://doi.org/10.3390/d12040150
Submission received: 16 February 2020 / Revised: 26 March 2020 / Accepted: 12 April 2020 / Published: 14 April 2020
(This article belongs to the Special Issue Microbial Interactions with Invasive Plant Species)

Abstract

:
Although aboveground metrics remain the standard, restoring functional ecosystems should promote both aboveground and belowground biotic communities. Restoration using salvaged soil—removal and translocation of topsoil from areas planned for development, with subsequent deposition at degraded sites—is an alternative to traditional methods. Salvaged soil contains both seed and spore banks, which may holistically augment restoration. Salvaged soil methods may reduce non-native germination by burying non-native seeds, increase native diversity by adding native seeds, or transfer soil microbiomes, including arbuscular mycorrhizal fungi (AMF), to recipient sites. We transferred soil to three degraded recipient sites and monitored soil microbes, using flow cytometry and molecular analyses, and characterized the plant community composition. Our findings suggest that salvaged soil at depths ≥5 cm reduced non-native grass cover and increased native plant density and species richness. Bacterial abundance at recipient sites were statistically equivalent to donor sites in abundance. Overall, topsoil additions affected AMF alpha diversity and community composition and increased rhizophilic AMF richness. Because salvaged soil restoration combines multiple soil components, including native plant and microbial propagules, it may promote both aboveground and belowground qualities of the donor site, when applying this method for restoring invaded and degraded ecosystems.

Graphical Abstract

1. Introduction

Ecological restoration aims to repair damage caused to degraded ecosystems, which typically are threatened by reduced biological diversity [1]. Restoration goals, therefore, include promoting diverse suites of native organisms, as well as these species’ interactions with biotic communities and the abiotic environment. The Society for Ecological Restoration defines a recovered ecosystem as one in which “sufficient biotic and abiotic resources (are present) to continue its development without further assistance” [2]. The restoration of a functioning ecosystem, thereby, should contribute to restoring both aboveground and belowground community structure. However, both methodology and metrics of restoration success rarely reflect such a holistic approach [3]. One challenge is to move beyond aboveground metrics, to investigate aboveground and belowground interactions as an important factor in restoration projects.
Traditional restoration methods often involve seeding or planting of native plant species, as well as physical or chemical removal of non-native species. Ideally, seeds collected from a nearby reference ecosystem, which emulates both the structure and the functions intended for the restored site, may be used for either dispersing directly at a restoration site or for growing plants in the nursery for subsequent out-planting and revegetation in the field. Seeds or propagules from the reference ecosystems likely include an appropriate mix of species [3,4]; however, due to the limited availability of such locally sourced seed, coupled with high labor intensity or infrastructure costs associated with preparing, bulking, or optimally storing these seeds for restoration, practitioners frequently purchase seeds or plants from native seed farms or nurseries [5,6]. This may lead to the selection of common or easily available native plant species for their restoration plant palette, which may result in low native diversity in restored ecosystems [6]. Likewise, the control of non-natives is an expensive and labor-intensive process. Although resources to support high levels of maintenance are not always available, higher costs attributed to maintenance were generally found to be related to greater restoration success [7].
Restoration methods may also explicitly address linkages among aboveground and belowground biotic communities. Because plants and soil biota are inextricably linked, soil microbes may contribute to structuring native plant communities within restored ecosystems [8,9,10,11]. Native plant growth responds to different sources of microbial inocula, such as plant-supporting root-associated mycorrhizal fungi [12]. These mycorrhizal fungi provide benefits to plants by translocating nutrients to their plant host, which often results in increased photosynthetic rates and plant productivity [9,10,13,14,15], as well as protecting associated plants from root pathogen infection. Restoration efforts aimed at restoring the community of microorganisms, including fungi, bacteria, and archaea, associated with plants and soil (i.e., the soil microbiome) may not only augment revegetation efforts, but also promote restoration success. Since many plants establish mutually beneficial relationships with soil microbes that provide access to limiting macronutrients and trace elements, restoration techniques that include native soil inoculum may increase native plant establishment via heightening biogeochemical cycling [16]. Although metrics for successful restoration experiments frequently focus on floral diversity or vegetation structure rather than belowground processes [17,18], soil microbial interactions play important roles in maintaining complex holistic ecosystems [19].
Mycorrhizal fungi, one member of a healthy soil community, can perform a variety of beneficial functions for associated plants. Arbuscular mycorrhizal fungi (AMF) colonize plant roots and exchange resources with their plant host. The Glomeromycota, a monophyletic lineage of AMF, can be further parsed into three functional groups, based on their traits related to biomass allocation [20]. Edaphophilic families include fungi with high extraradical hyphae allocation which allow increased nutrient uptake. Rhizophilic families include fungi that penetrate plant-root cells and invaginate plant cell membranes; these fungi allocate greater biomass to intraradical colonization and subsequently provide plants with protection from root pathogens. Ancestral fungi, the third functional group, tend to exhibit lower allocation to both roots and extraradical hyphae [20] and are putatively associated with mediating plant response to drought [21,22,23,24], while promoting plant performance [25]. Understanding which AMF occur in invaded soils and within restoration projects can clarify the nature of aboveground and belowground interactions.
Salvaging topsoil from a nearby intact reference ecosystem that is scheduled to be destroyed or transformed offers an interesting alternative to traditional restoration techniques. This method requires identifying an area that is planned for development and harbors a complex viable biotic community (i.e., donor site). Topsoil, along with biotic propagules, is then removed from this donor site and subsequently deposited at one or more degraded recipient sites. Transporting salvaged topsoil has the advantage of adding seed, potentially reintroducing a diverse native seed bank (which is crucial to the success of a restoration project [26]) to a degraded area, authentically replicating the collective plant community of a cohesive native habitat. The addition of a layer of salvaged topsoil to a degraded site may also bury the existing non-native seeds, reducing competition for natives that germinate from the salvaged seed bank, as well as potentially reducing maintenance needs. This method may also transfer the beneficial effects of the soil microbial community, including mutualistic AMF and soil bacteria, facilitating the development of a native plant and viable microbial community. Land managers have adapted this method from the mining industry, where it has proven to be more effective in mitigating ecological damage than restoration conducted on sites where healthy topsoil is not added [27,28,29]. Although the use of this technique is widespread in the mining industry, its application for non-mining restoration work (although successful [7,30,31]) is understudied. It is still unclear exactly what factors may contribute to the success of salvaged soil restoration.
This study aimed to identify the contributing mechanism(s) to successful restoration with salvaged soil. Specifically, we manipulated the depth at which salvaged topsoil was deposited at multiple degraded sites, to evaluate how salvaged topsoil helps restore systems. We asked the following questions: (1) Does salvaged topsoil reduce competition with non-natives via burial of seeds of non-native, invasive plants? (2) Does salvaged topsoil increase native diversity with the addition of a native seed bank from the donor site? and (3) Does salvaged topsoil result in successful transfer of a cohesive soil microbiome from the donor site? All three of these mechanisms have been cited as possible reasons for the success of restoration with salvaged topsoil, and practitioners recommend different amounts of topsoil to be deposited based on their understanding of the site-specific context, as the relative importance of these factors [32,33,34,35]. If burial of seeds of non-native, invasive species is important, then more soil would need to be deposited; although, if deposition of native seeds is more important, then it might require less soil, depending on the density of native seeds at the donor site. Finally, if propagules from the donor microbiome drive the success of salvaged topsoil, then perhaps only a light dusting of soil is required for the successful transfer of the donor soil microbiome. It is also possible that success may vary depending on conditions at the recipient sites or that some combination of non-native seed burial, native seeds deposition, and microbiome transfer may contribute to the success of restoration with salvaged topsoil.

2. Materials and Methods

2.1. Study System

This study was conducted within the Nature Reserves of Orange County, in Southern California. The donor site consisted of a diverse coastal sage scrub community that was slated for removal for the development of housing. Coastal sage scrub is a diverse plant community dominated by drought-deciduous shrubs found in Coastal and Baja California [36]. Home to at least 60 plants and 30 animal taxa that are considered rare, this community has seen continuous decline due to urbanization, frequent fires, drought, and atmospheric nitrogen deposition, and is a common target of restoration projects in Southern California [37,38]. Degraded sites once occupied by these coastal sage scrub plants (such as the three recipient sites utilized in this study) are typically dominated by non-native invasive annual species, such as grasses from Bromus or Avena genera, as well as mustards such as Brassica nigra and Hirschfeldia incana.
Characterized by a Mediterranean climate, these sites experience hot, dry summers and mild winters. Rainfall tends to be variable; below average (16.51 cm) precipitation was received from December through May in 2015–2016, during the first year of the study, while 2016–2017 was a much wetter year, with 34.32 cm received during the same months. The 30-year average rainfall for these months was 29.74 cm (recorded between 1977 and 2017, at the Tustin-Irvine Ranch Weather Station 33.719984, −117.723111 [39]).

2.2. Site Selection

The Orchard Hills donor site was mapped in August of 2015, prior to soil salvage operations, such that areas with high native shrub diversity were visually selected as potentially high-quality donor sections, while areas with high non-native cover were mapped as sections to be avoided. Three and a half hectares out of approximately 16 hectares were deemed high quality based on these criteria, and they were therefore selected as appropriate to serve as donor material. Soil was salvaged in December of 2015. After existing vegetation was removed, bulldozers were used to scrape soil from approximately the top 15 cm of the site. Scraping depth was visually approximated, and therefore likely spans a range of 10–20 cm of depth. Soil was first piled up at the base of the donor site and subsequently moved into dump trucks, to allow for its transfer to the recipient sites.
Three recipient sites were selected based on their high level of degradation, as well as accessibility. Recipient sites are in relative proximity to the donor site, with a maximum distance of 6.21 km (Figure 1, Table S1). Sites were prepared for deposition of salvaged soil by hand-weeding existing non-native vegetation, as well as herbicide treatment, using low-dose glyphosate targeted at large non-native clusters.

2.3. Experimental design

At each of the three recipient sites, three blocks of five experimental plots (3 m × 3 m) were established (Figure S1). One block represented all deposition-depth treatment combinations, which were randomly assigned to each plot: (a) control (no salvaged soil); (b) light dusting of <0.5 cm thick salvaged soil; (c) 5 cm salvaged soil deposition; (d) 10 cm salvaged deposition; and (e) 15 cm salvaged deposition. A dusting of cover was intended to provide an inoculation of native microorganisms rather than act as a seed-dispersal method (Figure 2).
Soil deposition occurred at recipient sites in December 2015, in proportion to their total area (Table S1). Soil was initially deposited by dump trucks at the recipient site, in numerous piles, which were evenly distributed throughout the site. These piles were then spread at a uniform 10 cm thickness across the entire recipient site, during which the control and dusted experimental plots were kept clear by using tarps. The even spread of soil was visually monitored. Tarps were subsequently removed to allow for dusting treatment plots to be prepared. The 5 and 15 cm plots were achieved through the transfer of the top 5 cm of soil from the 5 cm plot to the 15 cm plot, and depths were confirmed via measurement by ruler.
Excluding the experimental plots, the recipient sites were weeded regularly via a combination of hand weeding and herbicide. Experimental plots received no explicit maintenance treatment, so as to allow for data collection on non-native species.

2.4. Donor Site Seed-Bank Characterization

To allow for analysis of the depth of the donor seed bank, stratified soil samples were collected from six locations corresponding with soil salvage. Samples were taken at the following depths: (a) 0–5 cm, (b) 5–10 cm, (c) 10–15 cm, and (d) 15–20 cm, using a 6.3 cm in diameter bulb-planting tool. Soil samples were separated into organic and inorganic layers through a water floatation method, in which floating organic material is continuously poured off into a vacuum filtration system, until no more is present in the sample [40]. Organic layers were subsequently separated by size, using 2000-, 500-, and 250-micron soil sieves. Sieved layers were analyzed under a dissecting microscope, where seeds were isolated from remnant organic material and counted.

2.5. Plant Communities Data Collection

The percent cover of all plants in each study plot was estimated by using a point intercept method in February of 2016. The center of the plot was marked with a flag, and a 1 × 1 m quad pre-marked with 12 intersect points was laid in one quarter of the experimental plot (with the corner of the quad anchored at the pin flag). A pin flag dowel was dropped at each intersect within the frame, and each species touching the dowel was recorded. This procedure was repeated for each of the four quarters of the experimental plot, for a total of 48 total points (Figure S2). Percent cover was estimated per species by dividing the number of hits by the total number of intersect points. This sampling method focused on recording data in the center 4 m2 of each plot, in order to reduce edge effects.
Due to the germination of natives following the initial data collection effort, as well as to determine the effect of treatment over time, additional plant community data were collected in March 2016, and then again in March 2017. Count data were taken in 1 × 1 m quadrats placed in the center of each study plot, avoiding areas with disturbances. For each native species, all individual plants were counted and recorded. The abundance of non-native species was so high that it was not possible to count individual plants. Thus, for non-native species, percent cover was estimated within each quadrat.

2.6. Soil Microbes

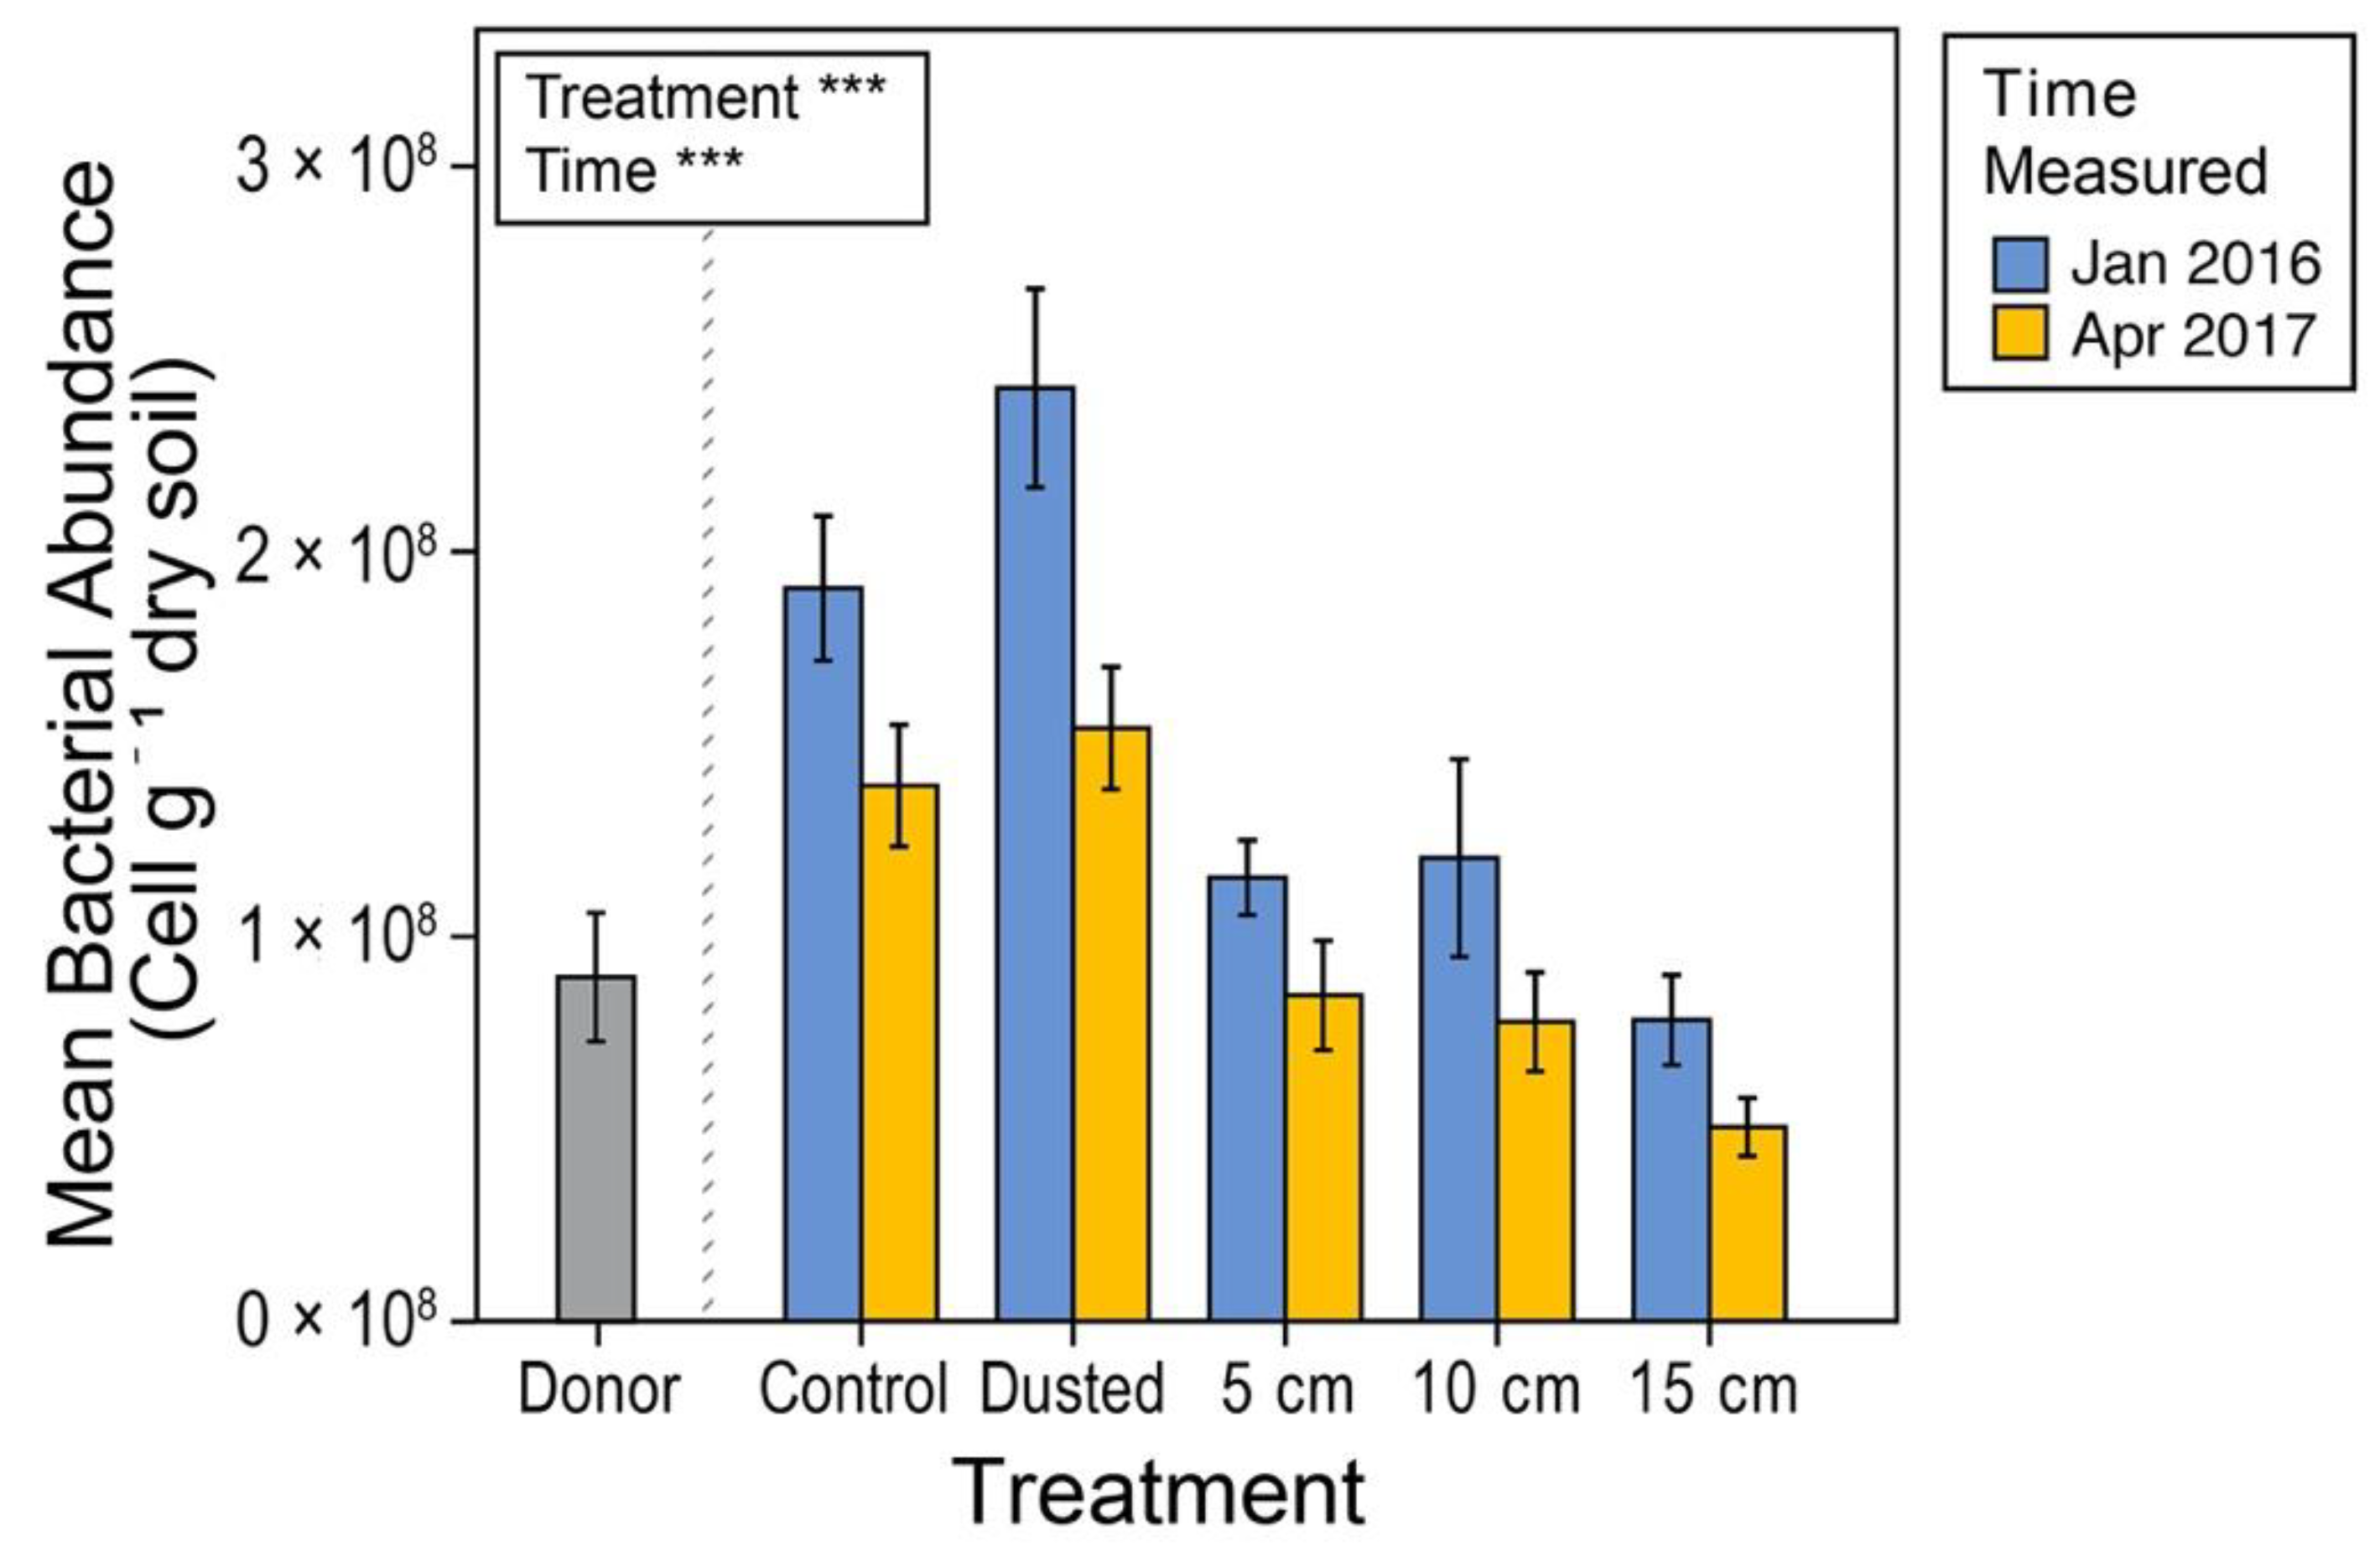
2.6.1. Bacterial Abundance

Soil samples used to determine bacterial abundance were collected (using a 2.5 cm diameter, 10 cm deep soil core) at six different areas of the donor site in January 2016, corresponding to locations from which soil was salvaged. Soil samples were also collected in triplicate from each treatment plot in January 2016, following initial soil deposition, and again in April 2017, near the end of the growing season, for the second year of the study. Samples were homogenized, intermittently stored at 4 °C and subsequently analyzed via an optimized method described by Khalili et al. (2019) in which soil samples are combined with a detergent, shaken, and layered onto a Nycodenz solution. Flow cytometry was performed on the resulting cell fraction [41].

2.6.2. Arbuscular Mycorrhizal Fungi

To characterize the structure and functional attributes of the AMF community, initial soils were collected during December 2015, in triplicate, from each of six locations, using a 2.5 cm diameter soil core sampler, at a depth of 10 cm, within the selected high-quality hectarage at the donor site, as well as from three locations at each of the three recipient sites. These samples were collected prior to soil scraping at the Orchard Hills donor site but after existing vegetation was removed from both donor and recipient sites. Soils were transported in sterile plastic bags, within a cooler containing dry ice, to the University of California Irvine; these soil samples were subsequently frozen at −20 °C, within 3 h of collection. Prior to AMF analyses, the triplicate samples were composited and homogenized per sampling location, and separated into three aliquots. For measuring mass, one aliquot was dried; for fungal hyphal analyses, we stored another aliquot at 18 °C. Our final aliquot was used for DNA extraction and AMF community analyses; this aliquot was stored at −20 °C. We collected additional soil samples in January 2016, at six different areas of the donor site, and in January 2016 and March 2017, from experimental plots at each of the three recipient sites, to characterize bacterial and fungal abundance and examine how AMF communities changed, following the salvage soil deposition through time, and as a result of the experimental manipulations. These soils were collected in triplicate, as per the initial soil collection, and transported, stored, and processed, as above, for subsequent analyses.
As a metric for soil fungal abundance, or fungal biomass, we extracted fungal hyphae from soil. We measured fungal hyphal length, as per procedures modified from both Sylvia (1992) and Brundrett et al. (1994) [42,43]. We extracted fungal hyphae from each initial soil sample collected in December 2015, and then from post-treatment soils collected in April 2017, close to the end of the growing season, to quantify AMF hyphal length as an index of AMF abundance. Specifically, we extracted hyphae from 4 g of soil (fresh weight). Soils were placed in a beaker containing 1.5 M sodium hexametaphosphate solution. The solution was stirred vigorously on a stir plate for 5 min, as a vortex emerged; soil slurries were transferred to another beaker, which remained stirring for an additional 2 min. Next, we passed the solution through a 0.2 µm nylon filter, vacuumed through fritted glass, which retained fungal hyphae on the filter as it allowed the solution to pass through. Hyphae were stained by immersing the filter in 0.01% (w/v) acid fuchsin dye; we air-dried each filter for at least 15 min, at room temperature, on a glass microscope slide, after which cover slips were affixed, using polyvinyl alcohol/lactic acid/glycerol medium [44]. Slides were dried at 60 °C for a minimum of 24 h. Then we examined each slide at 40 × magnification, using a phase contrast compound microscope (Nikon, Melville, NY, USA). Arbuscular mycorrhizal hyphal lengths were quantified by examining each filter at 100 random locations, for the presence or absence of AMF hyphae. Arbuscular mycorrhizal hyphae were distinguished from other fungal hyphae based on morphology. Generally, AMF hyphae feature angular branching, lack of septa, and irregular walls [45].

2.7. Fungal Library Construction and Sequencing

Samples were kept frozen in a −20 °C freezer, at the University of California Irvine, and then transported on dry ice, to the University of California Riverside, for DNA extraction. From each sample, we weighed and subsequently homogenized 0.25 g of soil on a PowerLyzer 24, following the PowerSoil PowerLyzer DNA Extraction Kit protocol (Mo Bio Laboratories, Carlsbad, CA, USA). We quantified DNA extracts with a NanoDrop 2000/2000c UV-Vis spectrophotometer (Thermo Fisher Scientific, Wilmington, DE, USA). Then, we purified our extracts with magnetic beads, using 1:1 sample to beads, with a PEG-bead protocol, as per Rohland and Reich (2012) [46]. Next, we quantified DNA concentrations in our extracts via nanodrop and standardized the concentrations of our DNA templates to 10 ng/μL.
We amplified our samples in duplicate by polymerase chain reaction (PCR), for the 18S region, using the Glomeromycotina-specific AML2 and the universal eukaryote WANDA primer set [47,48]. We constructed our libraries by using a dual-indexing approach, as per Berry et al. (2011) [49]. Our first-step PCR reactions (i.e., PCR1) used primers containing universal tails, which were synthesized 5’ to the locus specific sequences [50]. Our PCR reactions contained our template DNA with 1 × Phusion HF Buffer (Thermo Fisher Scientific, Waltham, MA, USA), 200 µM dNTPs (Phenix Research, Candler, NC, USA), 0.1 U/µL Phusion HotStart II DNA polymerase (Thermo Fisher Scientific, Waltham, MA, USA), 3.0 mM MgCl2, and 200 nM of each forward and reverse locus specific primers per reaction.
Our thermal cycler began with a heated lid, and then our program was initiated for 2 min at 95 °C, followed by 35 cycles of 30 s at 95 °C, 30 seconds at 55 °C, and 4 min at 60 °C; then, it entered a cooling phase, which was held at 10 °C. We visualized our PCR1 products on a 1% agarose gel, and then subsequently purified the PCR1 products with a magnetic PEG-bead cleanup; purified PCR1 products were eluted in 20 µL Tris-HCl (pH 8.0). To dilute our locus-specific amplicons, we combined 9 µL of Tris-HCl (pH 8.0) with 1.0 µL of our magnetic-bead-purified sample, to generate diluted purified PCR1 product. We used this dilute-purified product as template in our second, indexing PCR reaction (i.e., PCR2), using indexing primers with sequences matching our universal tails at the 3’ end; these matched the Illumina MiSeq flow-cell sequences at the 5’ end. Our thermal cycler conditions for tailing (PCR2) reactions were similar to the first-round PCR1 reaction, except that our master mix contained 100 nM of each indexing primer, and only 15 total cycles were performed in the thermal cycler for PCR2. Although PCR1 reactions were set up by adding DNA template from each sample into duplicate wells, for PCR2, our reactions were conducted as single reactions, with only one locus-specific amplicon (PCR1 product) per sample. We used agarose gel electrophoresis to check our indexed PCR2 products, and then we purified the products with the magnetic PEG-bead based cleanup. We quantified our purified indexed amplicons in duplicate, using the Quant-iT PicoGreen dsDNA assay kit (Life Technologies, Grand Island, New York, NY, USA), and pooled in equimolar concentrations, to include every sample into our final pooled library. We concentrated our resulting pooled library with the magnetic-PEG-bead-based protocol and conducted qPCR with P5/P7 adapted standards (New England Biolabs Inc., Ipswich, NY, USA) for quantifying the Illumina adapted fraction of our library. We estimated average fragment sizes by using a Bioanalyzer 2100 (Agilent Technologies, Santa Clara, CA, USA) prior to sequencing, at the UC Riverside Genomics Core. This sequencing was performed on a MiSeq Desktop Sequencing instrument (Illumina Inc, San Diego, CA, USA) in 2 × 300 paired end mode.

2.8. Bioinformatics

The fungal sequences were demultiplexed by the MiSeq, using Illumina protocols. We used the forward read for the SSU locus and checked quality with FastQC [51]. We filtered demultiplexed files, using multiple_split_libraries_fastq.py command in QIIME 1.9.1 [52], with Phred scores of 20 (q = 19) as a quality control parameter; we did not allow any low-quality base calls (r = 0), and we only retained reads possessing 95% of initial sequence length following quality truncation (p = 0.95). We used VSEARCH [53] in uchime_denovo mode to screen for chimeras. We used Swarm [54] with a resolution of d4 for picking operational taxonomic units (i.e., OTUs). This d4 resolution for local clustering threshold collapses sequences with fewer than or equal to 4 differences into a single representative OTU, as long as it passed our stringent quality filtering threshold of q20. We used BLAST to assign taxonomy, with an e-value of 0.001 [55], via the MaarjAM database [56]. We truncated the reference databases, prior to analysis, to only include the region of interest, as well as to limit any spurious results. For all analyses, with the exception of alpha diversity, we used the metagenomeSeq package of Bioconductor [57] in R (R Core Team 2017), to normalize our OTUs, using cumulative sum scaling (CSS-normalization), prior to further analyses; CSS normalization attempts to avoid biases associated with marker gene surveys which could result from uneven sequencing depth. Read counts were rescaled against a quantile, which was determined by assessing the count deviations for each sample, as compared to the distribution of counts across all of our other samples [57]. For alpha diversity analyses, instead of using CSS normalization, we used a rarefied OTU table, with sequences rarefied to 7600 reads per sample.
To examine responses of the AMF community (18S) within a fungal functional group framework, we assigned families of Glomeromycotina to AMF functional groups: rhizophilic, edaphophilic, and ancestral, using AMF resource allocation patterns defined in previous studies [20,58]. We did not include sequences assigned to the taxon Geosiphon pyriformis, as reads reportedly identified as G. pyriformis are not considered as rhizophilic, ancestral, or edaphophilic AMF. This functional group framework is based on studies demonstrating that AMF are host-specific, and exhibit diverse resource allocation patterns [59,60,61]. Arbuscular mycorrhizal fungal families with high allocation to extraradical hyphae, including Gigasporaceae and Diversisporaceae, are members of the guild “edaphophilic”; those with high allocation to root colonization (i.e., Glomeraceae, Claroideoglomeraceae, and Paraglomeraceae) are characterized as belonging to the “rhizophilic” guild; families which allocate lower AM fungal hyphae to either root colonization or soil foraging than the aforementioned guilds are known as “ancestral” AMF families, including Ambisporaceae, Archaeosporaceae, and Acaulosporaceae [20]. Previous studies show that fungal taxa from the rhizophilic AMF functional group are important for protecting their host plant from pathogen colonization, while edaphophilic AM fungi putatively improve plant nutrient uptake [62].

2.9. Statistical Analyses

All statistical analyses for plant community data, seed bank characterization, and bacterial abundance were performed, using IBM SPSS Statistics Software v.22 (International Business Machines Corporation, Armonk, NY, USA) and SAS 9.4 (SAS Institute, Cary, NC, USA). The Kruskal–Wallis H test was used to test whether the abundance of seeds in the seed bank varied depending on the depth at which the soil was collected from the donor site (1–5 cm, 5–10 cm, 10–15 cm, 15–20 cm). ANOVA was used to determine the effects of salvaged soil treatment (control, dusting, 5, 10, or 15 cm salvaged soil deposition) on the percent cover of non-native forbs in February. The site was used as a random factor. Tukey’s post hoc tests were used to detect pairwise differences. Separate repeated measures mixed-model ANOVAs were used to determine whether percent cover, abundance, and species richness of native and non-native plant species in March varied significantly depending on treatment group, recipient site (Hick’s Haul, Portola, or West Loma), or the interaction between treatment, site, and year. Block was included as a random factor in the models; Tukey–Kramer tests were conducted, along with the mixed-model ANOVAs. To determine whether bacterial abundance was affected by treatment, sampling time, or an interaction between treatment and sampling time, ANOVA was used; the site was included as a random factor. Tukey’s post hoc tests for pairwise differences were applied, as appropriate.
We used the Bray–Curtis index to compute distance matrices and visualized AMF community turnover and beta-diversity, using non-metric multidimensional scaling (NMDS). Bray–Curtis distances were generated from CSS-normalized data before we filtered our sequence-based dataset for functional group assignment. We used the ggplot2 package [63] and the “stat ellipse” function, with 95% confidence intervals, to visualize these NMDS plots in R (R version 3.2.1; R Core Team 2017). We assessed the fit of the data via calculating stress values associated with the NMDS, and we assigned stress values of less than 0.2, as acceptable. Using our rarefied OTU table, we calculated alpha diversity by using the core_diversity_analyses.py function in QIIME 1.9.1 [52] and calculated effective species number, to test for differences in AMF (18S) alpha diversity between sites, by sampling time, site, and topsoil treatment. We used the Shannon Diversity Index and performed linear models, in order to compare diversity across sites and treatment groups (α = 0.05). Furthermore, we examined AMF community composition across time, site, and topsoil thicknesses, by performing multivariate permutational ANOVA analyses (PERMANOVA), using the “adonis” function within the “vegan” package in R (999 permutations) [64], and evaluated differences in the OTU richness of AM fungal functional groups for the 18S locus, using linear models. We performed all statistical analyses in R version 3.4.4 (R version 3.4.4; R Core Team 2018).

3. Results

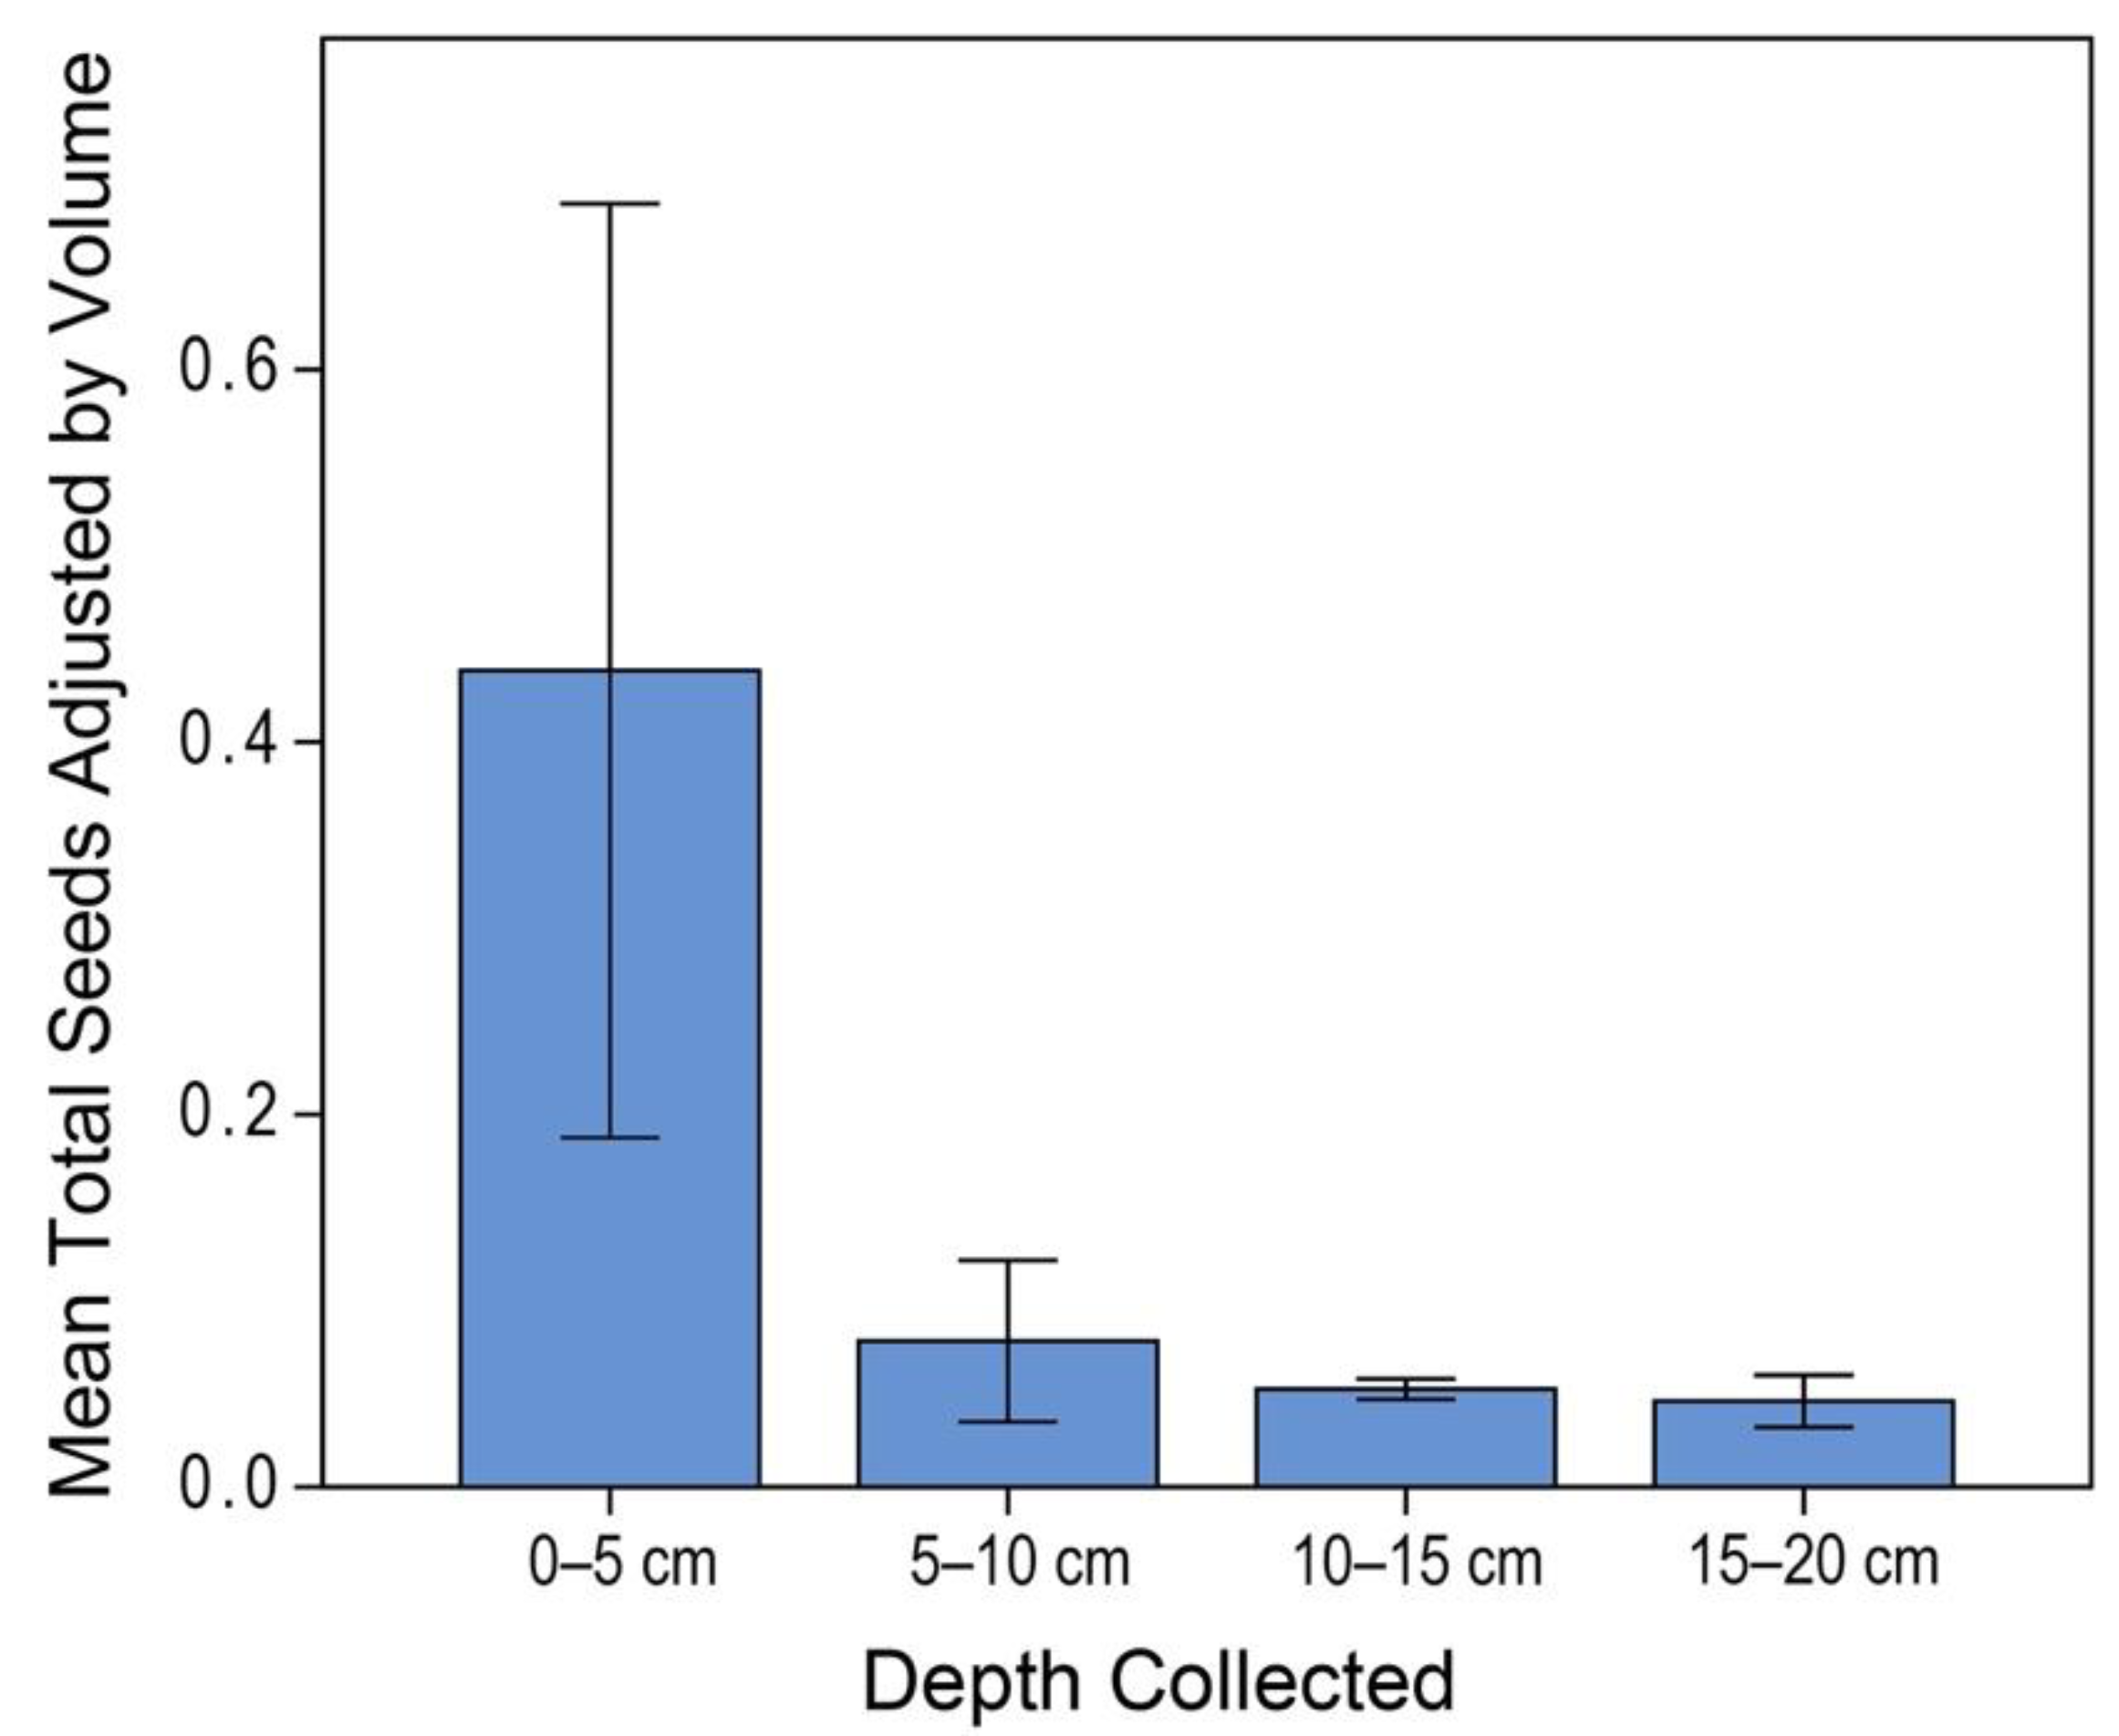
3.1. Donor Site Seed Bank

A total of 434 total seeds were found in all soil samples collected at the donor site. Seeds were significantly more abundant (p = 0.025) per mL of soil in the topmost layer (0–5 cm) than in all lower layers (5–10 cm, 10–15 cm, and 15–20 cm). The top 5 cm of soil was found to contain 67% of total seeds, with the top 15 cm of soil contributing 94% of total seeds found. Since the top 15 cm of soil was initially collected from the donor site, we can assume that the majority of seeds from the donor site were transferred to the recipient site (Figure 3).

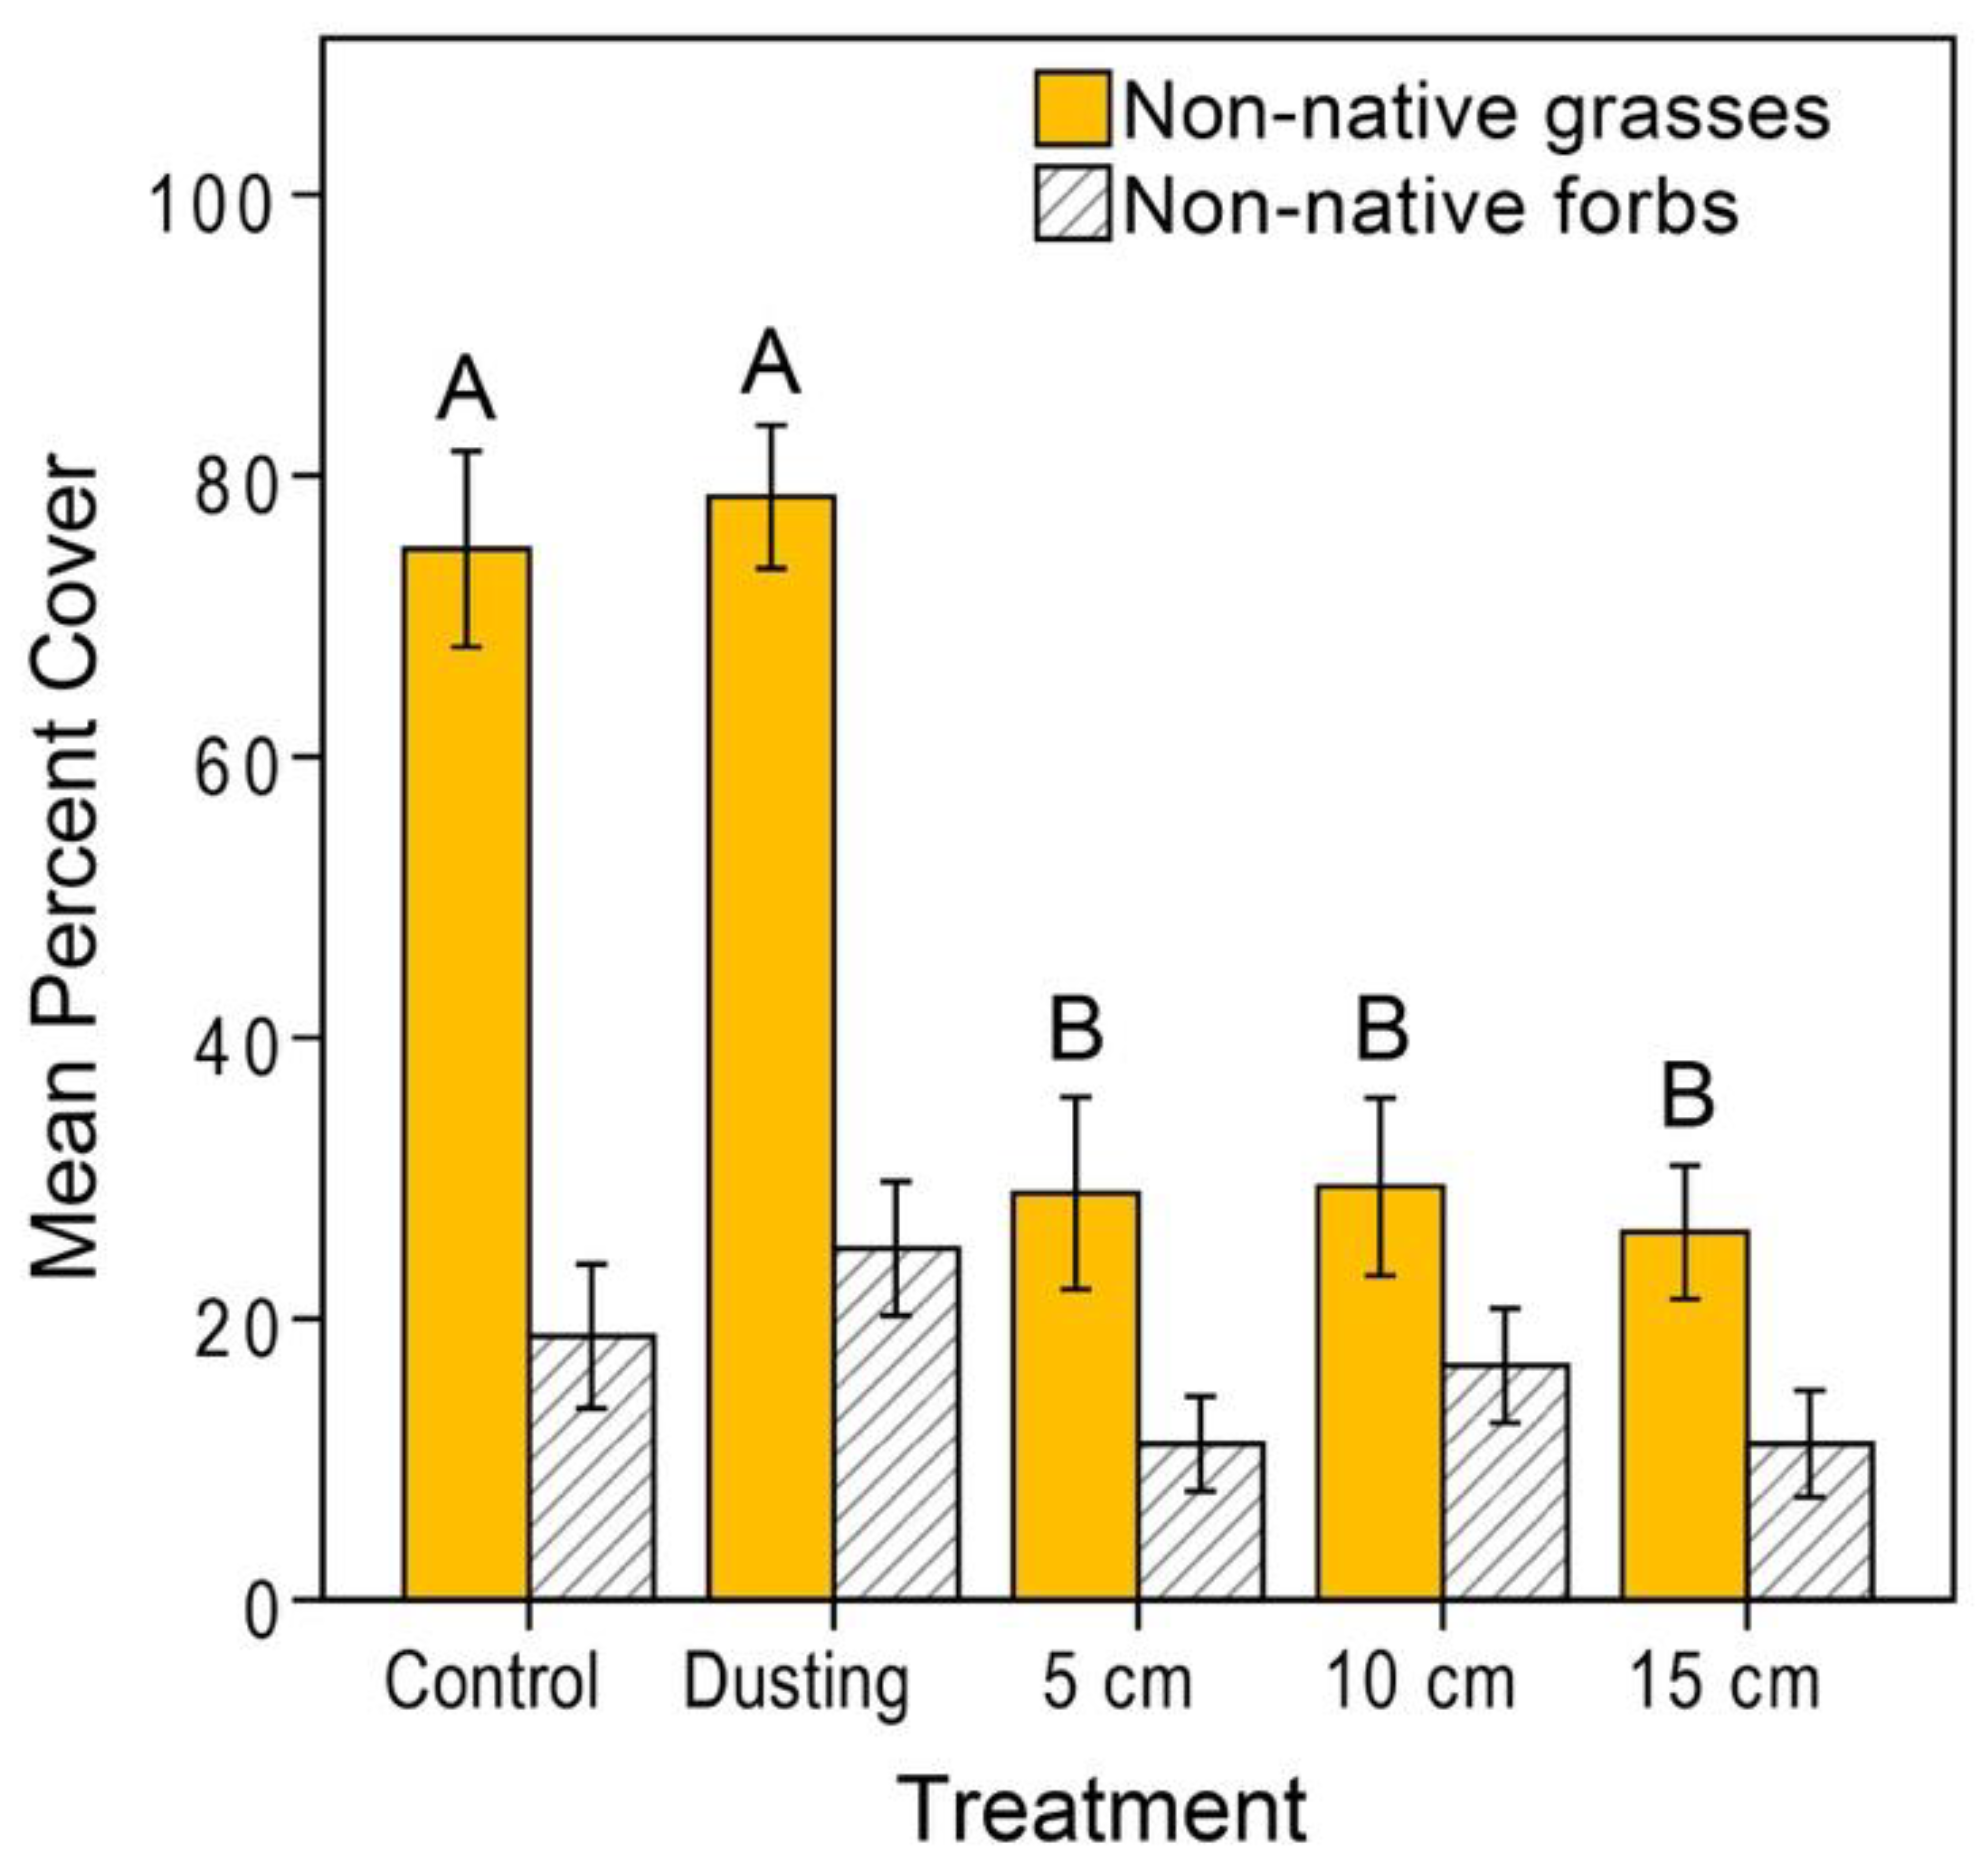
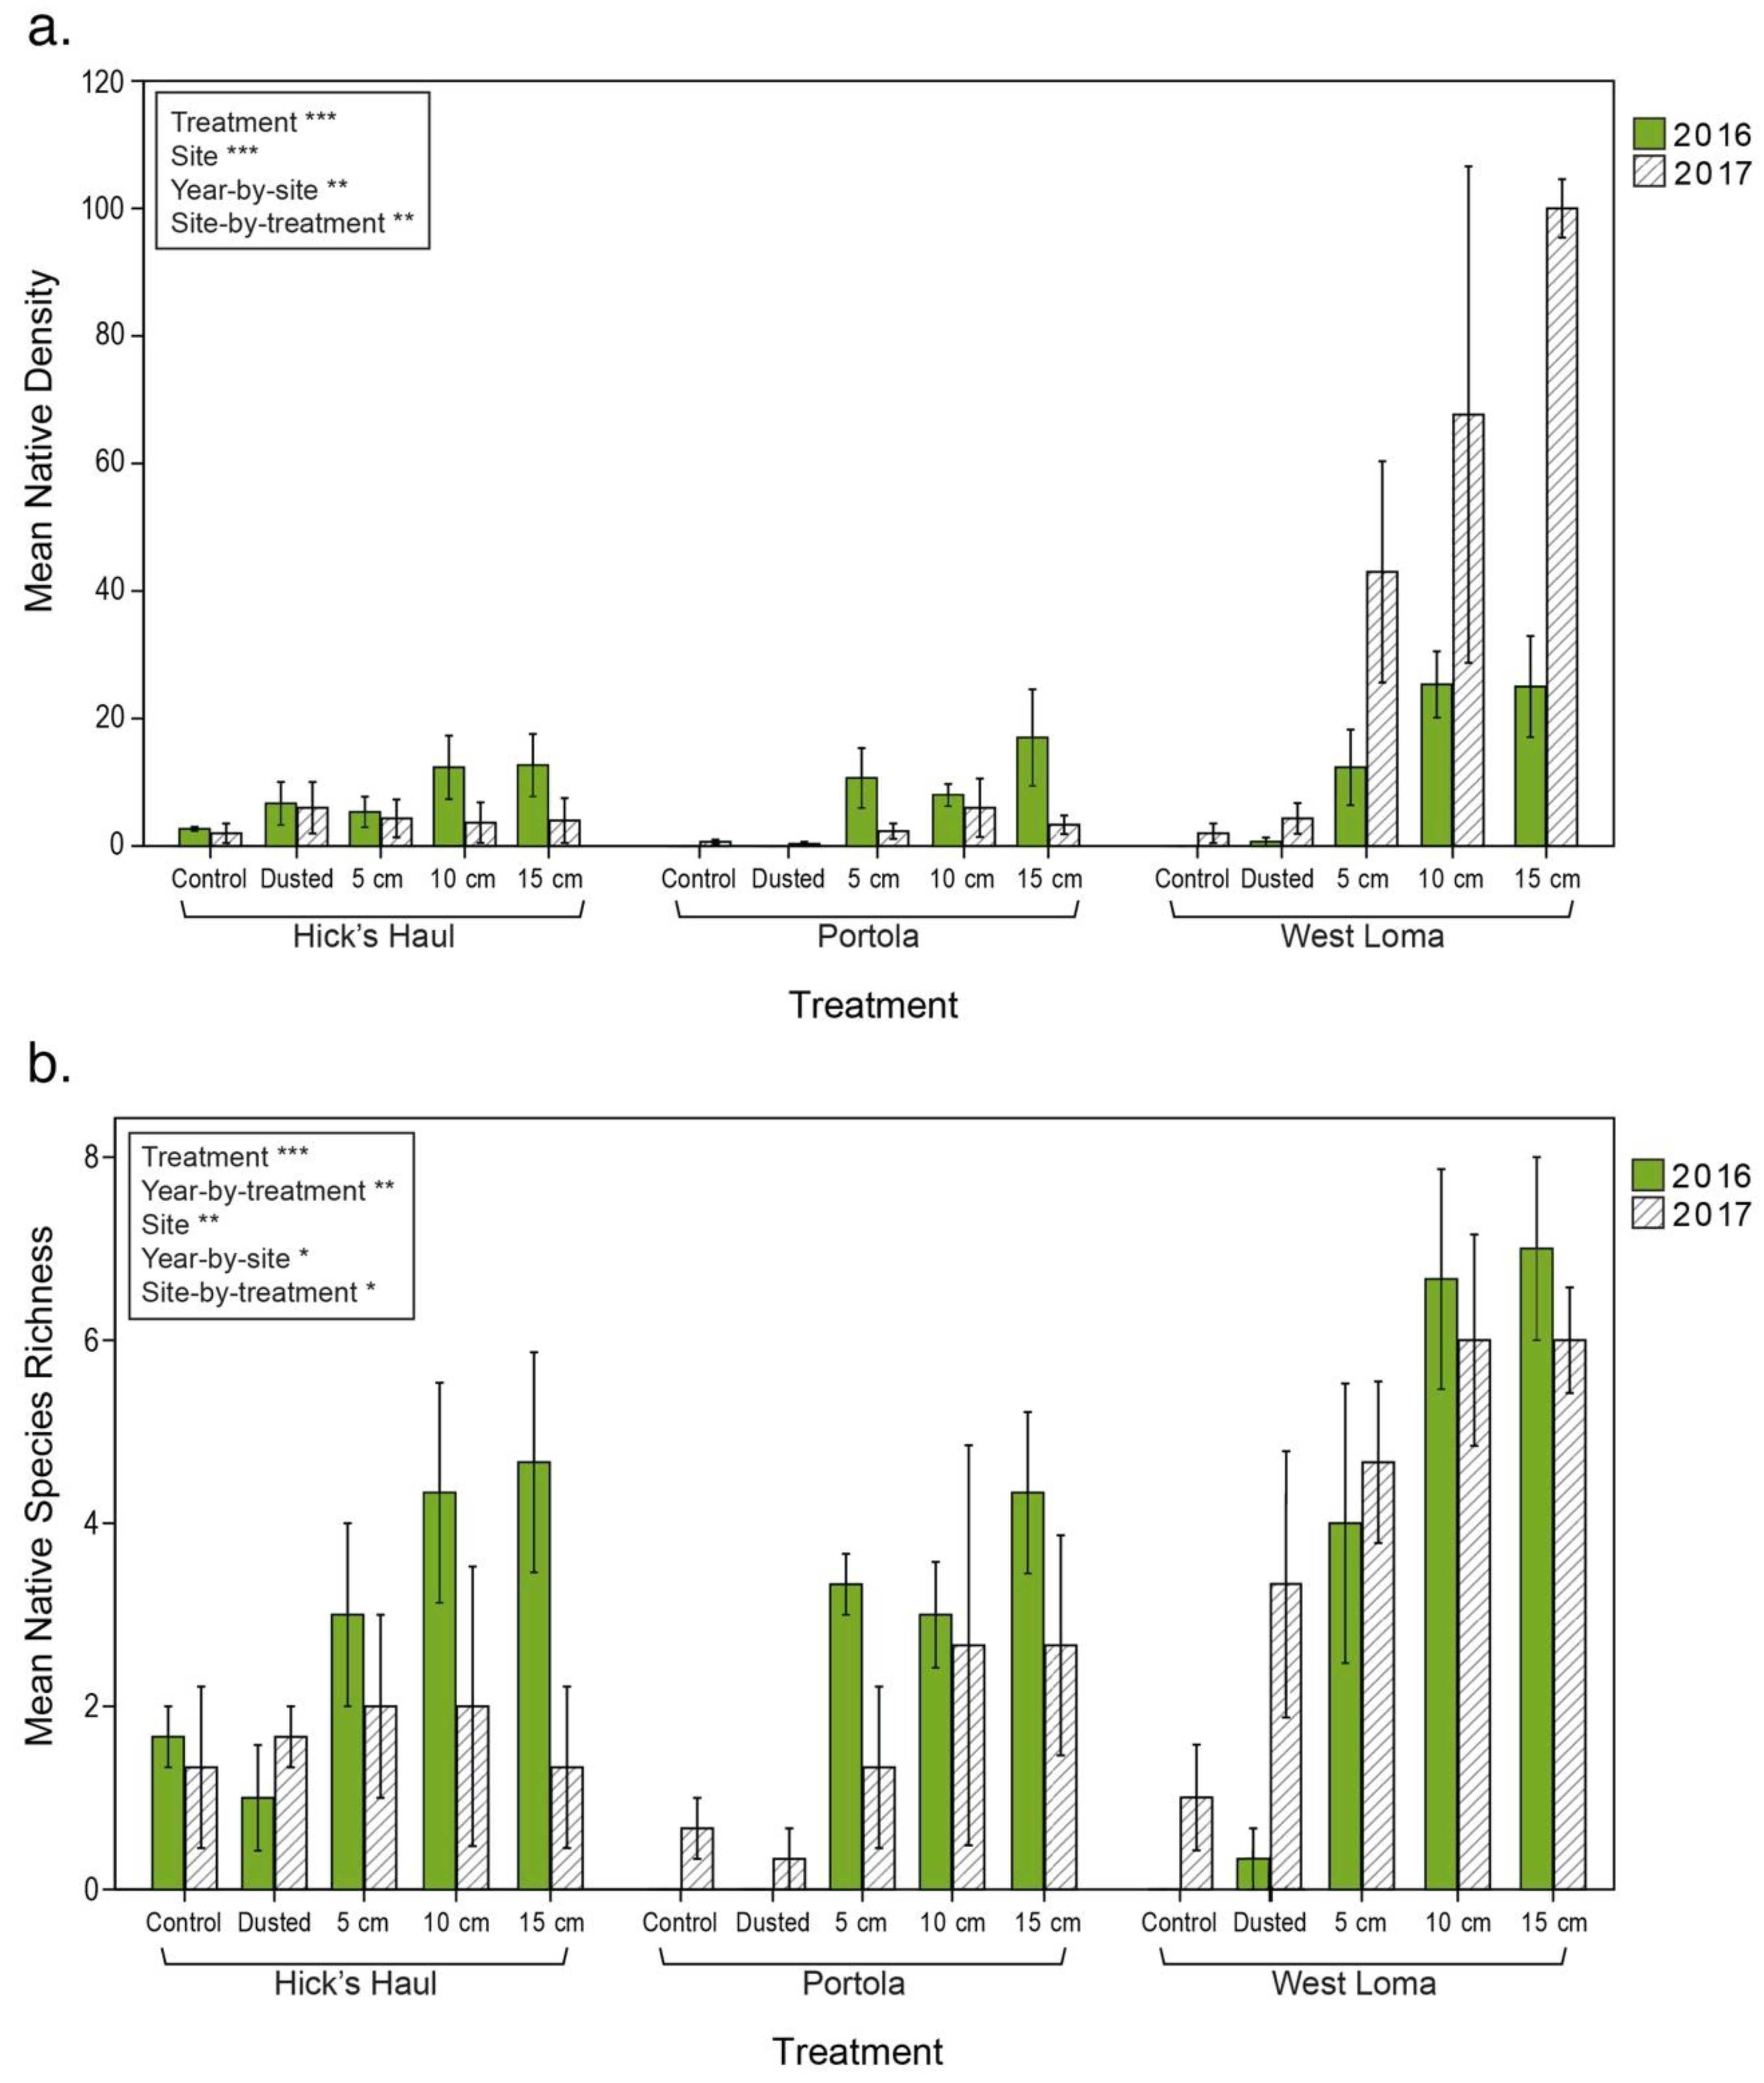
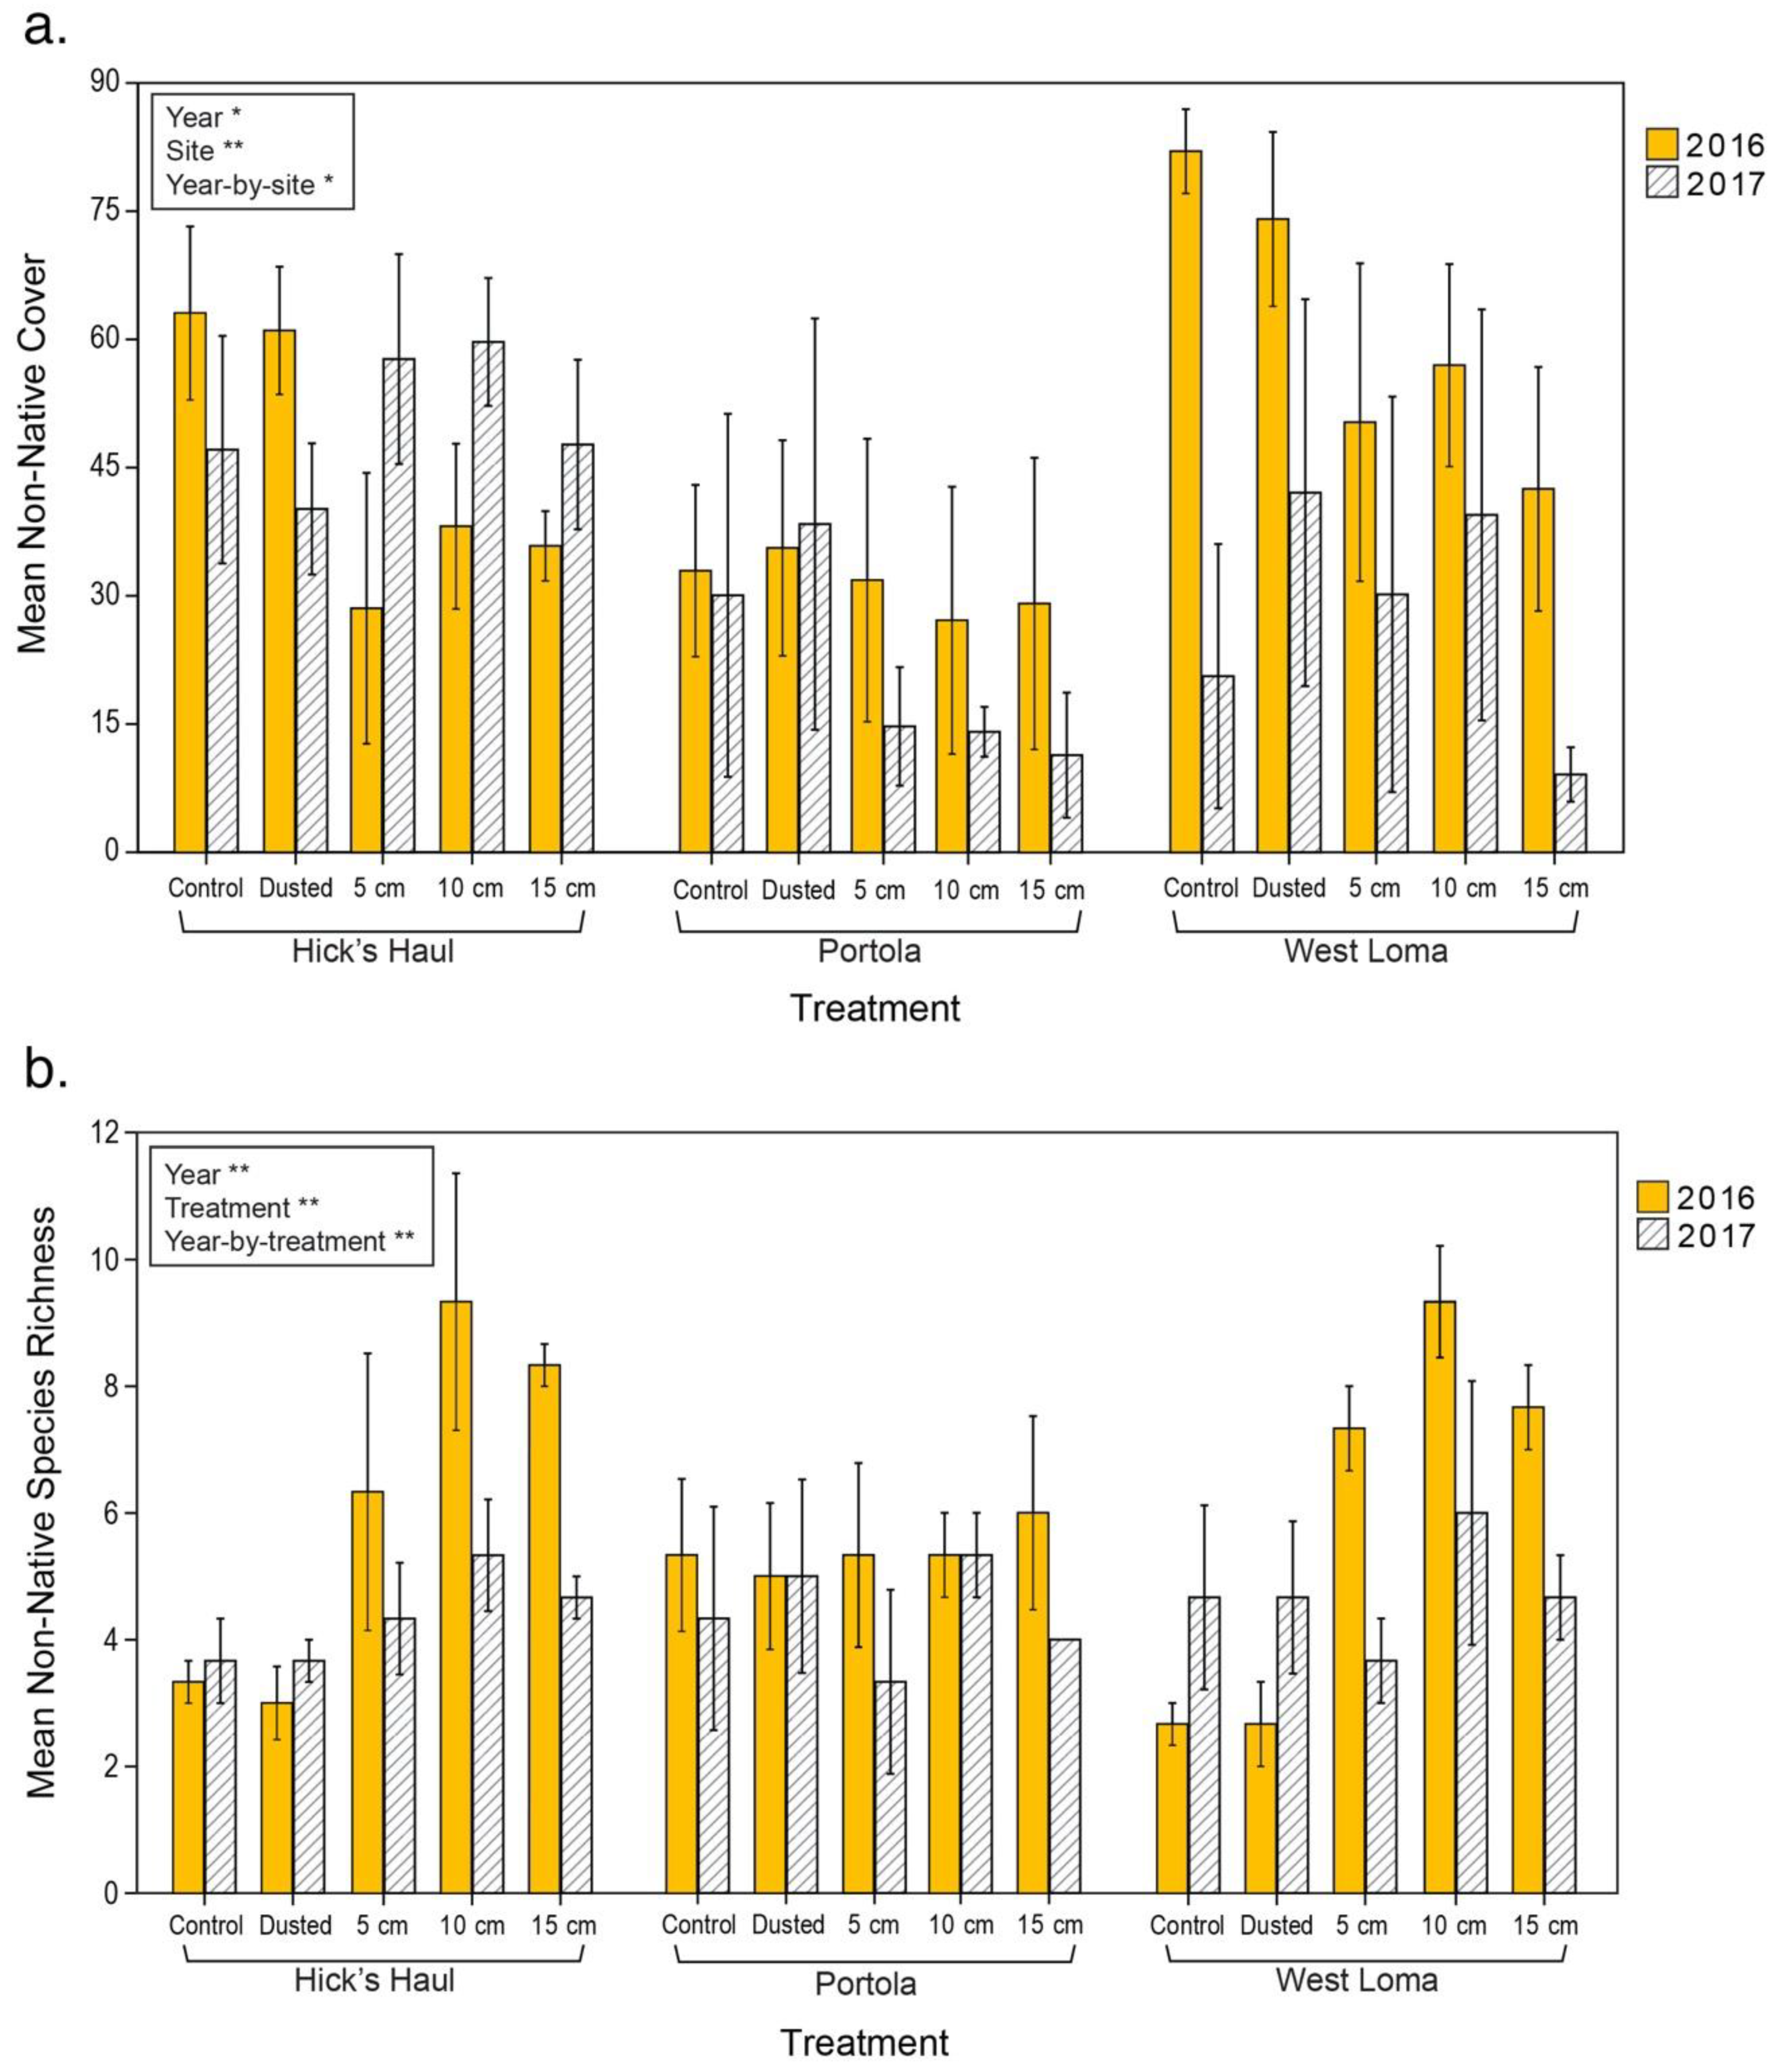
3.2. Vegetation Cover and Species Richness at the Recipient Sites

Point-intercept data collected in February 2016 were dominated by non-native grasses and forbs, as non-native species typically germinate earlier than natives in coastal sage scrub communities [65]. Native forbs comprised, on average, only 6.19% of the total vegetation cover per plot, and they were not affected by salvaged soil treatment (F4,30 = 1.637, p = 0.181). The percent cover of non-native grasses was significantly greater in control and dusted plots than in treatment plots in which 5, 10, and 15 cm of salvaged topsoil was added (F4,30 = 24.598, p < 0.001), indicating that the addition of at least 5 cm of salvaged soil significantly reduced the germination of early season non-native grasses. There were no detectable effects of soil treatments on percent cover of non-native forbs (F4,30 = 2.589, p = 0.118; Figure 4).
March data from 2016 and 2017 yielded various native germinants. The density of native plants was significantly affected by soil salvage treatments, with higher native density observed in plots treated with at least 5 cm of salvaged soil (F4,59 = 21.42, p < 0.001). Effects of site, as well as interactions among both year-by-site, and site-by-treatment were also observed, driven by higher success at West Loma, as compared to other recipient sites. Tukey–Kramer post hoc tests revealed that, overall, mean native density was highest in treatments with 5, 10, or 15 cm of salvaged soil than in control plots or in plots that received a dusting of soil (Figure 5a; Table S2). Although post hoc tests reveal 15 cm of salvaged soil to yield higher native density than plots treated with only 5 cm of soil (with 10 cm of soil resulting in intermediate density), results obtained with 5, 10, and 15 cm of salvaged soil are not statistically unique.
Mean native species richness was also significantly affected by treatment, increasing with the amount of salvaged soil added (F4,59 = 20.55, p < 0.0001). Effects of year-by-treatment, site, year-by-site, and year-by-treatment were also found. Similar to mean native density, significant site effects were caused by the greater number of native plant species at West Loma, when compared to other sites. Native species richness decreased at all sites, from the first to the second year of the study, (as did non-native species richness; see Figure 6b) According to post hoc tests, highest native species richness values were recorded in treatment plots with 5, 10, and 15 cm of salvaged soil, when compared to those that received no soil or a dusting of soil (Figure 5b; Table S3).
Plant community data collected in March 2016 and 2017 revealed that non-native cover tended to be lower in plots with more salvaged topsoil, but this result was not significant (F4,59 = 2.19, p = 0.0808). There were, however, significant differences in non-native cover, depending on year, site, and the year-by-site interaction, potentially due to varying rainfall between the two years of the study. Average non-native cover values were lower in all treatments receiving at least 5 cm of salvaged soil than in control plots in 2016. This trend did not continue into the following year of the study (Figure 6a; Table S4).
Non-native species richness was significantly higher in plots treated with 10 cm of salvaged soil than in other treatments (F4,59 = 4.78, p = 0.0021). Tukey–Kramer post hoc tests only differentiate the 10 cm salvage soil treatment as significantly different from the control and dusted treatments, with the 10 cm salvaged soil treated plots containing a higher number of unique non-native species. Plots treated with 5 or 15 cm of salvaged soil had an intermediate non-native species richness (Figure 6b; Table S5).

3.3. Soil Microbial Content

Although there was no effect on fungal biomass as AM hyphal length (M/g dry wt soil; p > 0.05), mean bacterial abundance of treatment plots varied significantly based on treatment (F5,76 = 19.37, p < 0.0001), as well as sampling occurrence. Plots that received 5, 10, or 15 cm of salvaged soil were statistically indistinguishable from the donor site in terms of bacterial abundance when the site was first sampled in January of 2016, with the donor site, as well as plots that received at least 5 cm of salvaged soil, having the lowest bacterial abundance. The same results were observed in April 2017, although bacterial abundance was lower in all plots. During the first sampling occurrence in 2016, the plot treated with a dusting of salvaged soil, meant to serve as an inoculum, had significantly higher bacterial abundance than the donor site or any other treatment plot (Figure 7).

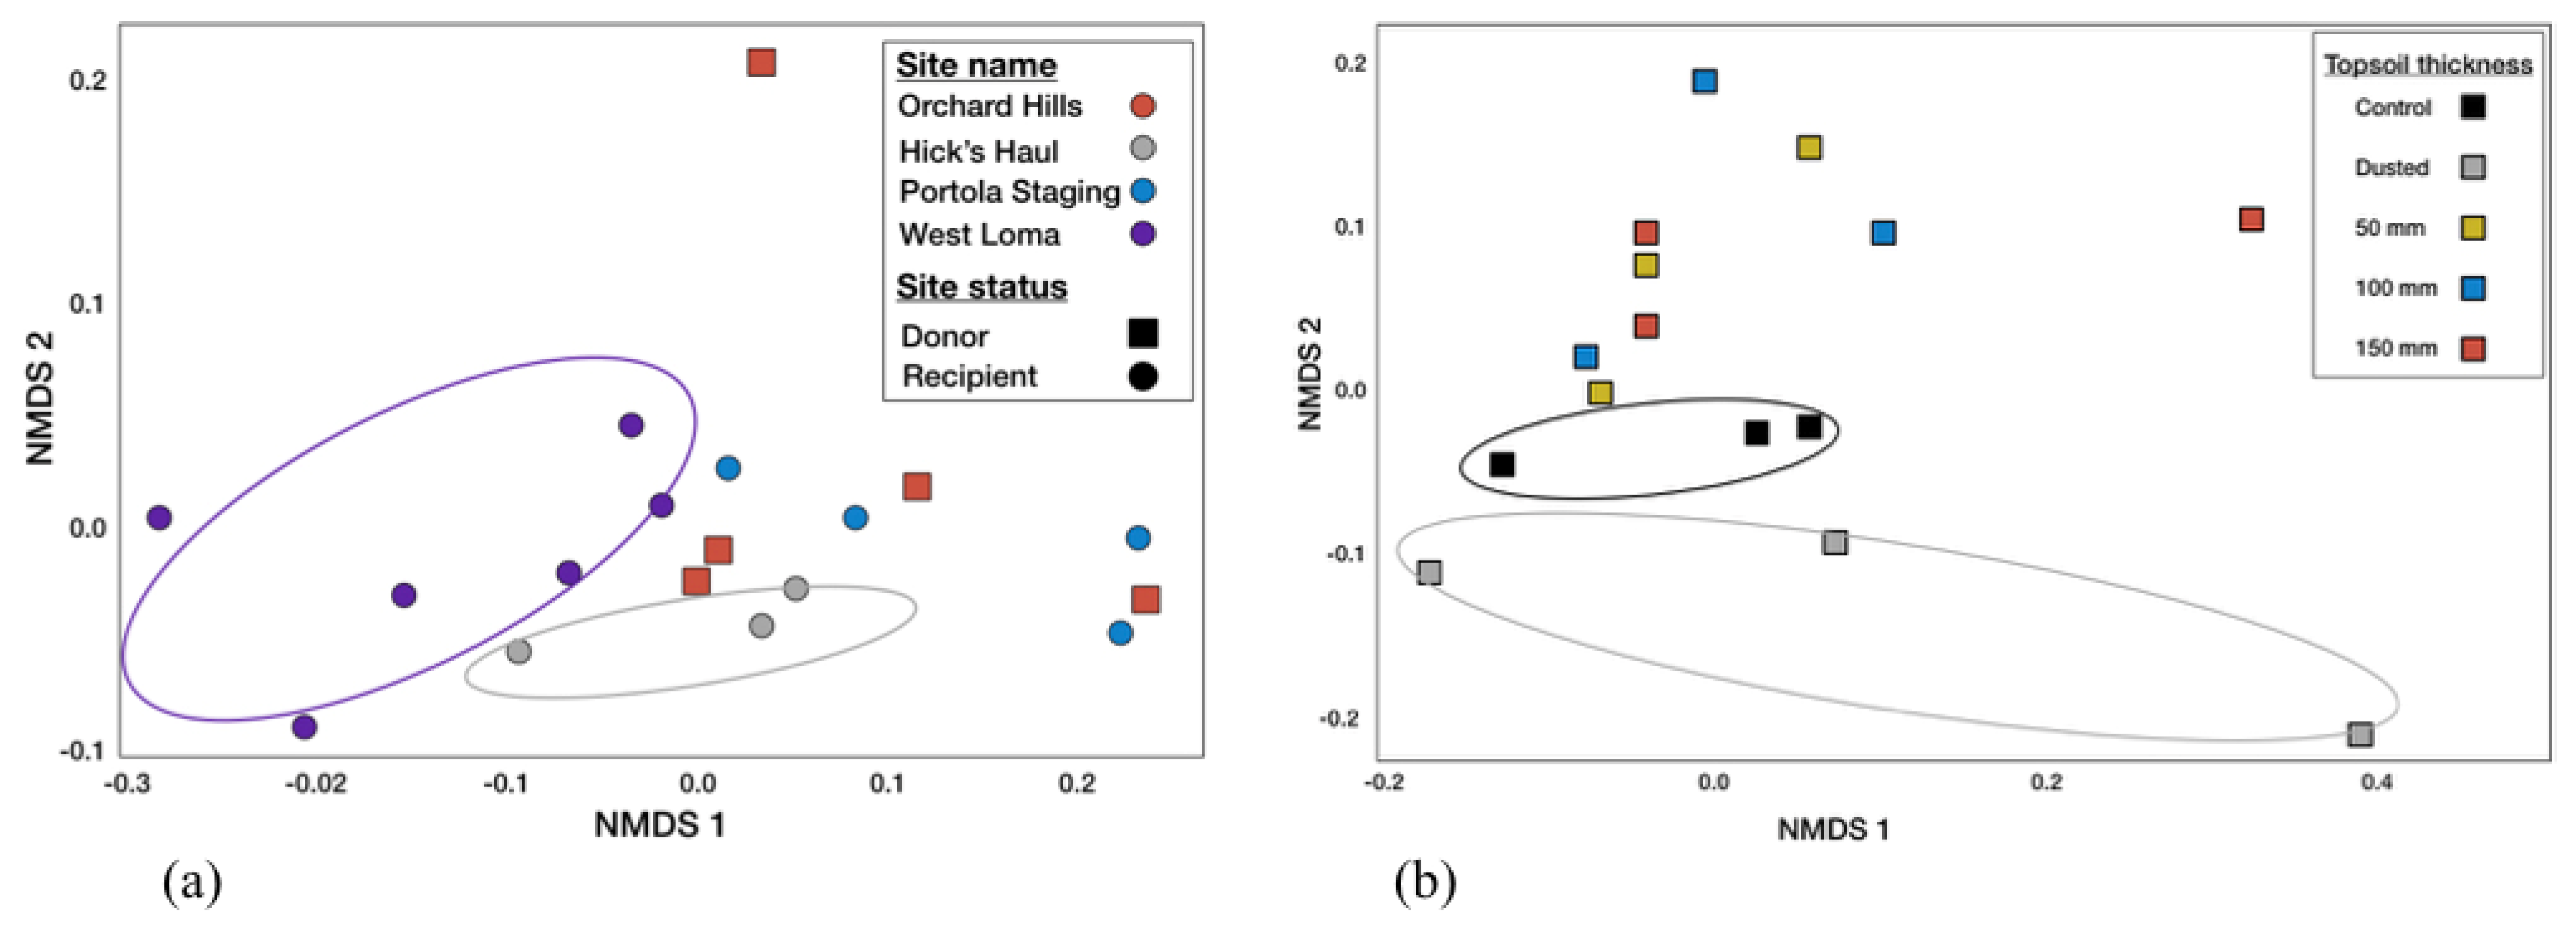
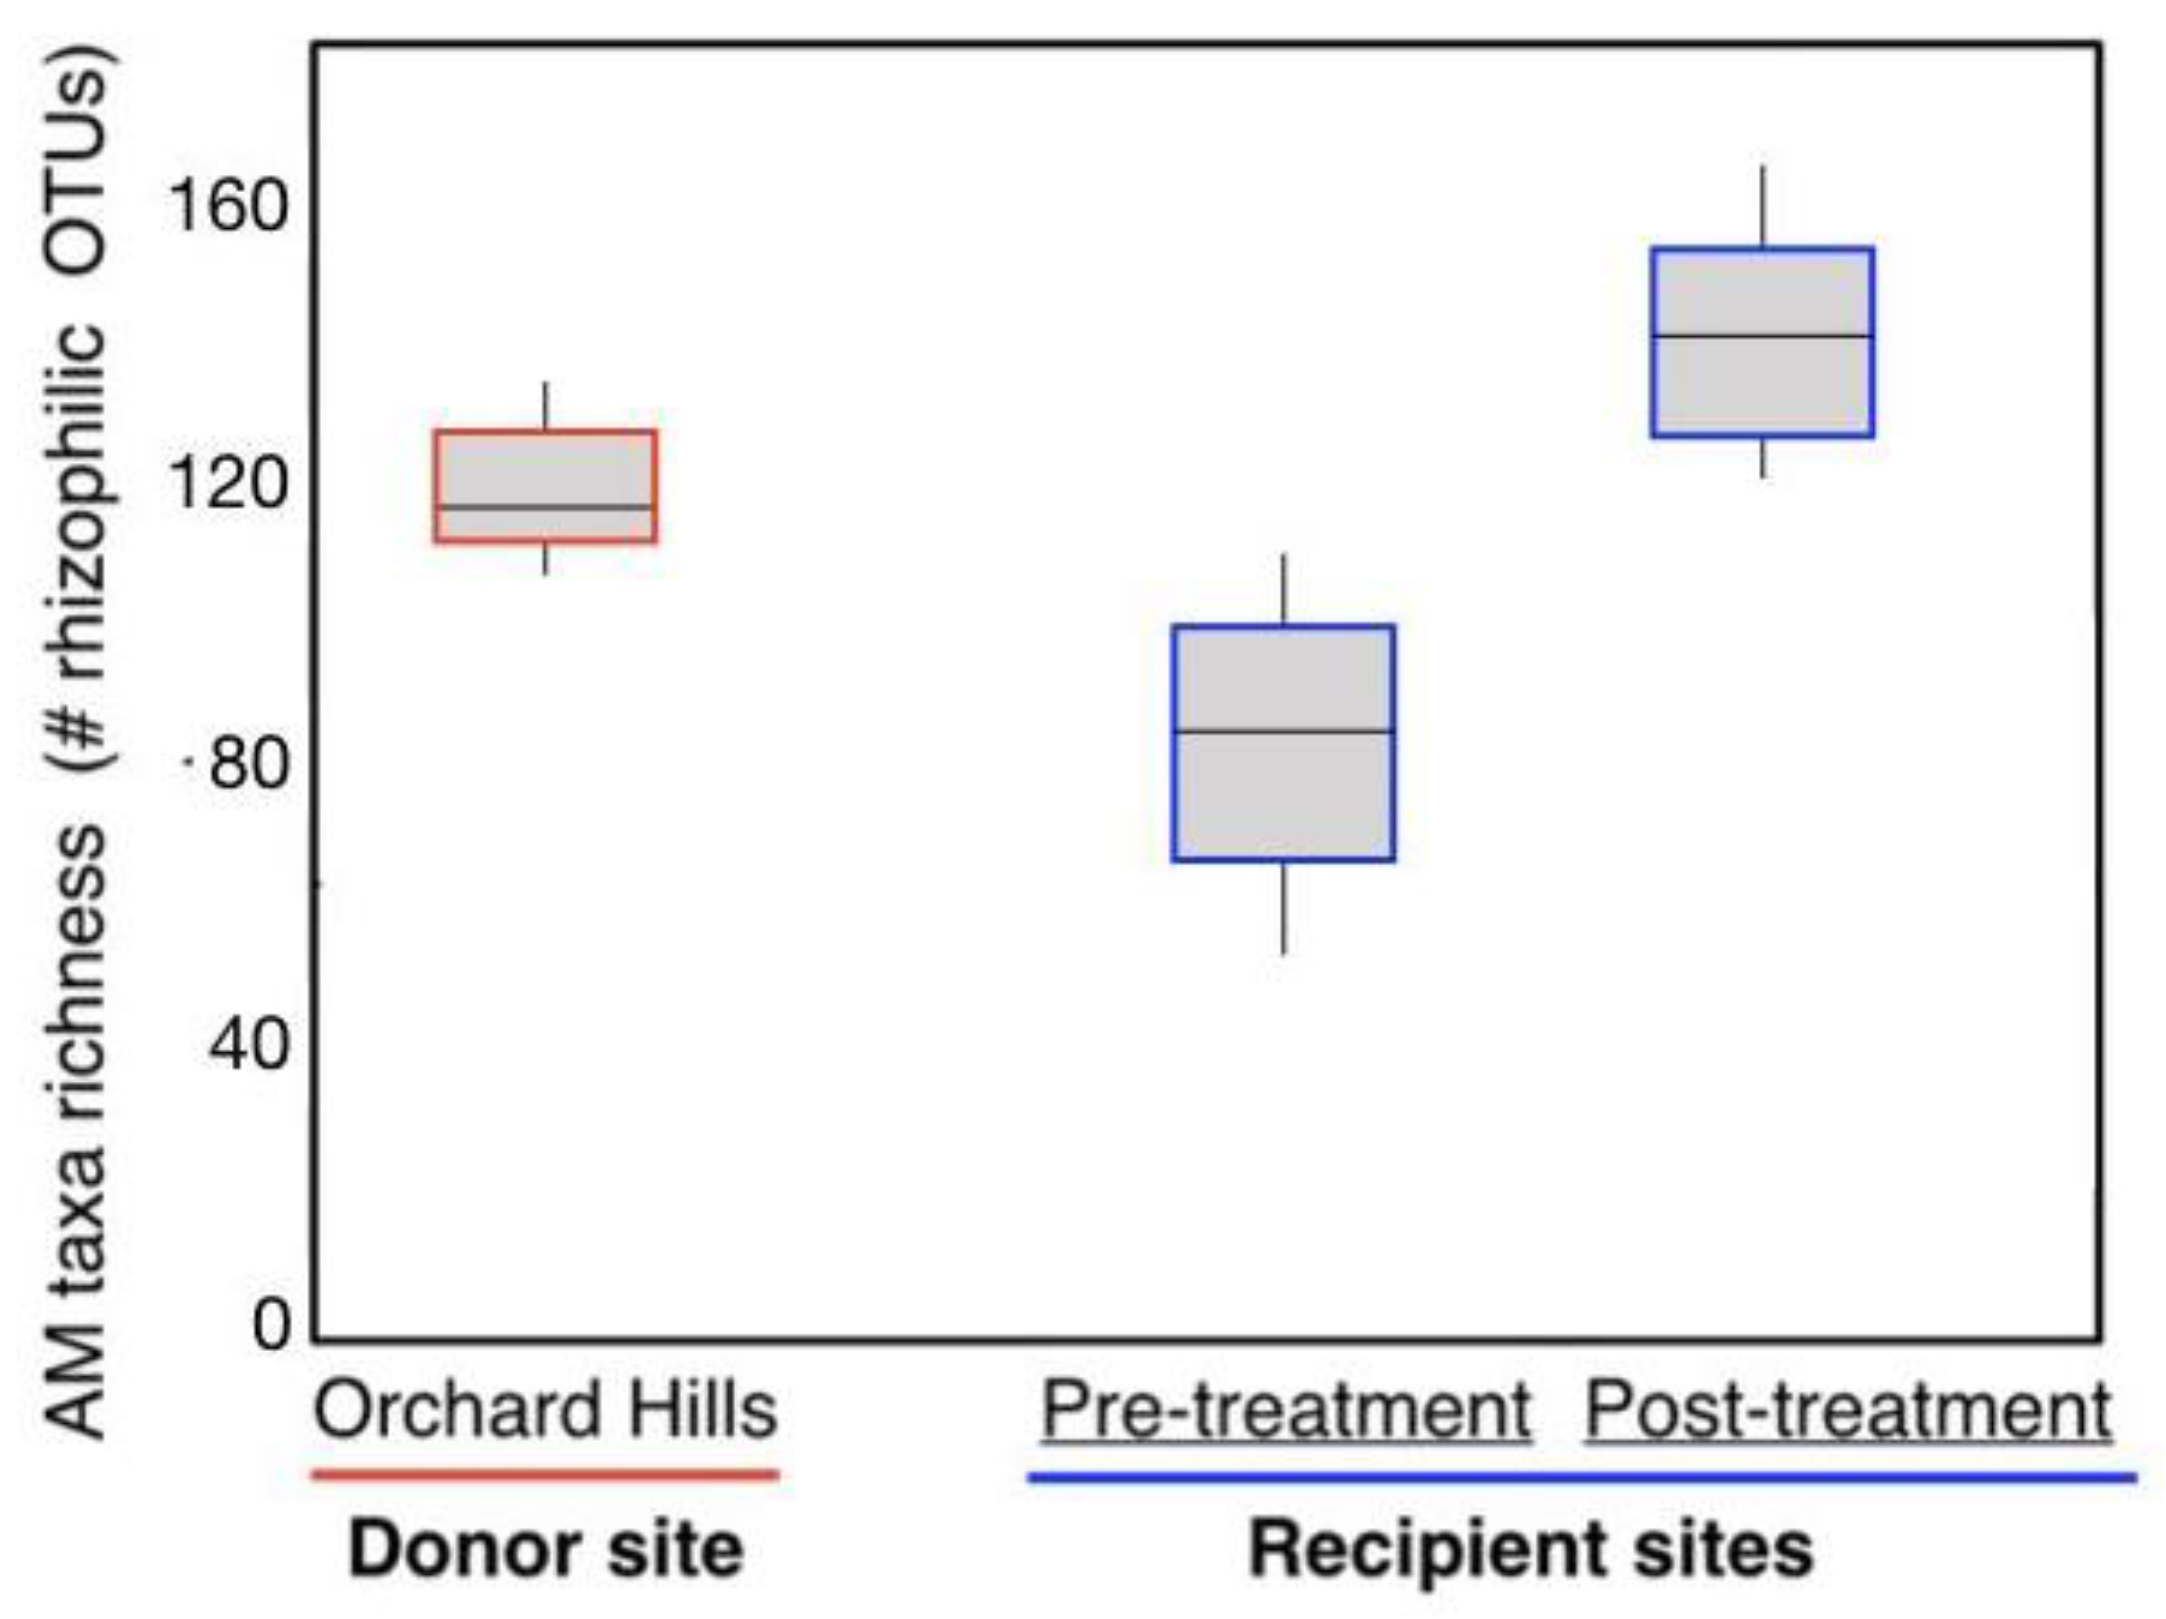
3.4. Arbuscular Mycorrhizal Fungal Communities

Although the arbuscular mycorrhizal fungal community composition was altered by topsoil treatment (PERMANOVA, p = 0.002), these effects differed by site (p = 0.03) and treatment (p < 0.001; Figure 8). In 2017, we detected a shift in AMF communities at Portola in plots with at least 5 cm of salvaged soil, as compared to both control and dusted treatments. However, AMF communities at both Hick’s Haul and West Loma were equivalent across treatments.
Overall, we detected lower AMF alpha-diversity prior to topsoil delivery (2015) than was detected during our 2017 sampling event (p < 0.03). However, topsoil thickness had variable effects on alpha diversity (p = 0.50). For instance, at Hick’s Haul, AMF alpha-diversity was greatest in plots containing the thickest layer of topsoil (15 cm; p = 0.04); dusted treatments at Hick’s Haul also contained greater alpha-diversity than was detected in control plots (p = 0.05). In contrast, at West Loma, we detected lower AMF alpha-diversity in plots containing 5 cm of topsoil (p = 0.02) than was found in control plots within the same site.
During this initial pre-treatment sampling event in 2015, recipient plots had statistically equivalent rhizophilic AMF richness to the donor site. However, in 2017, after topsoil treatments, we detected an additive effect of salvaged topsoil additions on taxa from the rhizophilic AMF functional group, such that taxa richness of rhizophilic AMF was significantly higher in recipient plots treated with topsoil than these same recipient sites prior to topsoil delivery (p = 0.001; Figure 9). It is worth noting that no effects of topsoil treatments were detected for either edaphophilic or ancestral AMF functional groups.

4. Discussion

We found evidence supporting our proposed mechanisms by which salvaged topsoil can result in successful ecological restoration: (1) reduction of competition with non-natives via burial of invasive seeds, (2) the addition of native plants through establishment of a native seed bank, and (3) successful transfer of a cohesive soil microbiome. While other studies have focused on how salvaged topsoil can be a useful technique for mining reclamation, or investigated whether the salvaged soil may be stored prior to use [29,66,67,68], this is the first study that we are aware of in which the depth of deposition is compared in terms of its influence on both native and non-native plants, as well as the belowground microbial community. Ecologists are increasingly finding evidence that aboveground and belowground interactions are important for structuring community composition [8,69,70]. Here, we demonstrate that such interactions are also important for understanding ecological restoration.

4.1. Response of the Plant Community

4.1.1. Reduction of Competition with Non-Natives via Burial of Invasive Seeds

The initial decrease in non-native grasses with deposition of salvaged soil, compared to treatments containing only a dusting or no salvaged soil, supports the premise that salvaged soil is important in blocking the germination of the existing non-native, invasive seed bank. There was a similar pattern for non-native forbs (although no significant effects were observed by treatment). This could be attributed not to the failure of the topsoil to block germination of the existing degraded seed bank of the recipient site, but rather to the presence of non-native forb seeds in the salvaged soil itself. Although seeds found in soil collected from the donor site were not able to be identified by species, the plant communities’ data indicate the presence of non-native seeds in the salvaged soil, as evidenced by the higher non-native species richness present in plots containing 5, 10, and 15 cm of salvaged soil in March (especially during the first year of the study). Non-native percent cover data collected in March during the same time were not significantly affected by treatment, but the presence of a significantly higher amount of unique non-native species in plots treated with 10 cm of salvaged soil indicates that non-native seed originated from soil from the donor site. A closer look at vegetation data from March 2016 allows us to see that 44% of the total non-native species found in the experimental plots are present only in at least one of the three salvage treatments (5, 10, and 15 cm) and not in the control or dusted plots (including species like Melilotus indicus, Lysimachia arvensis, and Erodium cicutarium); this indicates that these non-native species were transferred to the recipient site, within the salvaged soil (Table S5b).
In contrast, three non-native species were only found in the control and/or dusted treatment plots (Hordeum murinum, Malva parviflora, and Sisymbrium irio) and other specific non-native species’ cover was greatly reduced by the addition of at least 5 cm of salvaged soil (e.g., Brassica nigra), which indicates that restoration with salvaged soil does indeed successfully reduce germination of the existing seed bank by burying seeds at the degraded site. Although more than half of the non-native species were present in only one of the two soil sources (in either the recipient site soil (the control and dusted plots) or the donor site soil (5, 10, and 15 cm of salvaged soil addition), some non-native species were found in all treatment plots. (Table S5b) Rather than indicating unsuccessful reduction of germination of seeds existing at the recipient site, these species were most likely originally present in the seed bank of both the recipient site and the donor site and are therefore present in all plots.
We found that a salvaged soil application of at least 5 cm is successfully able to hinder germination of seed existing at the recipient site, but may also result in our restored sites emulating the characteristics of the donor site’s reference ecosystem, including its seed composition. As was the case in our study, this may result in the unintentional transplantation of non-native species to the recipient sites.

4.1.2. Addition of Native Plants via Establishment of a Native Seed Bank

Coastal sage scrub communities are known to form soil seed banks [71]. An intact seed bank was found at the donor site, with 94% of total seeds present in the top 15 cm of salvaged soil, indicating that a majority of seeds were salvaged along with the soil and thereby deposited at recipient sites. Our results, that native density and native species richness were greater for plots treated with salvaged soil than those that received only a dusting or no salvaged soil, provide support for the idea that salvaged topsoil works by transferring native seeds to the recipient sites. In March 2016, during the first year of the study, a total of only three native species were present in control and/or dusted plots, while 21 native species were present in plots receiving either 5, 10, or 15 cm of salvaged soil (Table S5a). The increase in native density and native species richness were stronger during the first year (2016) of the study than during the second year (2017), and effects varied by site—with West Loma experiencing the most success, according to these metrics. The success of West Loma compared to the other two recipient sites may be due to varying abiotic factors (slope, sun explore, etc.) at this site that benefit plant growth. Nevertheless, potential site differences or site-specific characteristics must be taken into consideration when using this method, and further study identifying criteria associated with sites most receptive to this method of restoration would be a particularly valuable avenue for future research.
The overall weakening of the effect of the initial salvage treatment over time, in terms of native species success, could be due to a variety of factors. First, the decrease of native species richness from 2016 to 2017 could be due to unique species present in the salvaged seed bank, which may have germinated but not reproduced successfully, due to the lack of rainfall during the first year of the study. Alternatively, a lack of maintenance inside experimental plots during the first year may have allowed for the non-natives to compete with and hinder native species [65].
In terms of rebuilding the aboveground plant community, restoration with salvaged soil proved successful in our trial, as the degraded recipient seed bank was covered up by donor site soil, whose attributes were subsequently expressed in the aboveground vegetation. This method, however, remains only as successful as the quality of the donor site. The aboveground vegetation is not necessarily reflected in the seed bank, with non-native seed having the potential to dominate the belowground landscape [71]. In a different restoration experiment involving the deposition of salvaged soil, high percentages of non-native cover were unexpectedly recorded [31]. This method is therefore best suited to salvaging from areas with very high native cover, as well as an intact seed bank. Careful aboveground mapping of vegetation, but also sampling of the seed bank, would likely aid in adequately selecting areas of high enough quality to serve as donor sites. Donor sites with some initial native aboveground or belowground presence of non-natives may still potentially serve as adequate donor sites if this restoration technique is coupled with regular non-native removal.

4.2. Transference of the Soil Microbiome

We found that benefits of salvaged soil can influence soil biota. Mycorrhizal fungal communities can shift, and soil bacteria can become less abundant above a particular threshold of salvaged soil thickness employed by practitioners. Although salvaged soil influenced bacterial abundance, total and mycorrhizal fungal abundance either remained unchanged or was highly variable across salvaged soil treatments at recipient sites, likely increasing fungal:bacterial abundance in plots treated with at least 5 cm of salvaged soil. Although there are inherent challenges to comparing across microbial biomass metrics and methodologies, fungal:bacterial dominance putatively has implications for biotic communities’ response to environmental change and has also been correlated with ecosystem functions such as carbon sequestration and litter decomposition [72]. However, measuring fungal decomposition or AMF nutrient cycling in salvaged soils was outside the scope of this study.
Deploying AMF inoculum in restoration studies often includes adding root fragments, AMF spores, or material containing hyphal fragments to growth media in the greenhouse or seedlings planted in pots within the nursery, prior to out-planting in the field [73] or directly to the field in restoration experiments [16,32]. Salvaged topsoil from donor sites contains AMF spores, along with plant root and AMF hyphal fragments, and may therefore directly manipulate AM community structure via translocating these propagules to recipient sites. Our study evaluated whether transferring components of the soil microbiome would alter the diversity, composition, and functional capacity of biotic communities at recipient sites. The addition of AMF propagules may improve the encounter rate of germinating seedlings and mycorrhizal spores or hyphae, which potentially increases the degree to which these fungi penetrate [74], and exchange resources with, their host plant’s roots; this may subsequently promote their host plant’s growth [75].
Previous studies show that arbuscular mycorrhizal inoculation improves seedling survival and plant growth within arid lands [76]. Our study, in a semi-arid ecosystem, transferred AMF propagules, along with the intact seed bank, from a donor site to three recipient sites, and we not only detected increased native plant density and richness, but also found greater AMF alpha-diversity at a majority of plots, following topsoil delivery. Previous studies have shown that AMF diversity declines in invaded systems [77] and that edaphic factors could also play a role in hindering the diversity or determining the structure of AMF communities [78]. Although some plants are generalists (i.e., can associate with a variety of AMF taxa), other plant species require more specific associations of only one, or few, AMF taxa [79]. Restoration projects characterized by diverse assemblages of native and endemic AMF, as may be found when salvaging topsoil from local intact reference ecosystems, may ultimately be more effective at promoting the performance of rare native taxa, and therefore at restoring both the structure and the functioning of intact ecosystems. Our study showed an increase in AMF diversity after topsoil delivery, which corresponded to increased propagule pressure of plant seeds and AMF propagules, as well as changes in vegetation communities in our experimental plots. Since AMF are obligate plant symbionts, changes in vegetative cover and plant community structure could feed back to promote the proliferation of a variety AMF taxa via changes in host plant dynamics.
A site’s microbiome may change with severe or monodominant invasions [80], as was characteristic of our recipient sites prior to salvaged topsoil deployment, via mechanisms such as increasing pathogen levels, plant–soil feedbacks, or by altering root-associated microbial symbioses [81]. However, ecological restoration techniques can improve the likelihood of successful restoration outcomes by supporting native plant establishment and helping to establish the AMF community in certain ecosystems [82,83,84]. In our study, we found that salvaged topsoil delivery elicited shifts in AMF communities in plots receiving at least 5 cm of salvaged soil. However, at one recipient site (West Loma), 5 cm of salvaged soil corresponded with low AMF diversity. Although light dusting treatments ostensibly added biotic propagules, AMF alpha-diversity was only higher at one site (Hick’s Haul) in these dusted plots, than in untreated controls. Given that bacterial abundance was highest in these same dusted treatments, it is likely that fungal–bacterial interactions, such as microbial antagonism, coupled with limited substrate availability, as was likely characteristic of this light dusting treatment, may have resulted in conditions that promoted bacterial growth over plant root mutualists, such as AMF. However, there were more rhizophilic AMF taxa detected overall in recipient sites receiving topsoil than in recipient locations prior to salvaged topsoil delivery. These diverse assemblages of rhizophilic AMF may have contributed to the initial success of native plants in our treatment plots, as rhizophilic AMF are known to colonize plant roots and assist in establishment via protecting their plant host from damage caused by root pathogens [82].
Although plant invasions and land-use practices, such as tillage and herbicide applications, have consequences for soil microbial biomass and activity, some studies have found that soil microbial communities are largely resilient to ecological restoration techniques. In our study, bacterial abundance was significantly indistinguishable at the donor site versus treatment plots during the two study years. Control and dusting had significantly higher abundance in 2016 and in 2017. In 2016, dusting had significantly higher abundance than all other treatment plots, suggesting that the inoculation via dusting may have worked, and these treatment plots may contain microbes from the donor site, as well as the recipient site, contributing to this high abundance.
Although soil profiles are rarely homogenous, soil thickness or depth in the soil profile has been an important gradient structuring root distribution and bacterial community composition and functioning [85]. A recent study by Brewer et al. (2019) illustrated that bacterial attributes associated with microbial survival in oligotrophic conditions may promote their survival and capacity to thrive in subsurface soil horizons. Furthermore, microbial communities at depth were more dissimilar to surface microbial communities, along with greater distance from the surface within a soil profile [86]. Our study examined how microbial (AMF) communities and bacterial abundance shifts with topsoil thickness in recipient sites receiving topsoil from a reference coastal sage scrub ecosystem. Treatments with the smallest amount of inoculum (light dusting) yielded the greatest effects on increasing bacterial abundance after one year. Furthermore, treatments with the greatest topsoil depth (≤15 cm) corresponded to the lowest values of bacterial biomass. This suggests that inoculum size may play a role in affecting microbial activity, as well as potentially influencing fungal:bacterial abundance, along with associated ecosystem functioning. Previous studies examining bacteria and soil depth have shown that microbial functions, including microbial biomass normalized potential extracellular enzyme activity [87], and the proportion of Gram+ bacteria [82] in the microbial community increased with depth. Although our study extended the soil profile to include heightened topsoil thickness, rather than extending deeper into soil horizons, our findings suggest that adding topsoil could have consequences for functions driven by microbial processes, with associated implications on both aboveground and belowground ecosystems.

4.3. Methodological Implications

Salvaged soil restoration resulted in successful ecological restoration, through a combination of three mechanisms: the burial of existing non-native seeds, thereby hindering their germination; the addition of a native seed bank as contained within the donor soil, resulting in higher native diversity; and the transfer of soil bacteria, as well as AMF diversity and rhizophilic AMF taxa richness.
Methodologically, there seems to be a critical threshold of 5 cm, above which the application of thicker layers of salvaged soil, whether 10 or 15 cm, provides minimal additional benefits. Both native density and native species richness were significantly different from dusted and control treatments at this critical 5 cm threshold of added salvaged soil; the same trend was observed in the ability of salvaged soil to reduce the cover of non-native grasses. Although a dusting of salvaged soil was sufficient for affecting bacterial abundance, AMF diversity was more variable and may require the addition of more topsoil. The most diverse AMF community was found within plots containing greater volumes of salvaged topsoil (15 cm treatments); however, these effects were only evident at one recipient site. Our study demonstrated variability in AMF communities and diversity that was likely context-dependent and driven by site-specific characteristics. However, across all sites, we detected shifts in AMF communities at ≥5 cm of added salvaged soil.
Given the increasing invisible costs associated with transporting and deploying greater masses of soil from donor sites, determining a threshold is critical for maximizing our restoration efforts for restoring the greatest area of degraded land with the least volume of outside inputs. Therefore, this study provides valuable information about how ≥5 cm thick layers of salvaged soil were generally sufficient for obtaining beneficial effects of this technique. Through the combined effect of the three contributing mechanisms, the successful application of this singular method allows for the collective and holistic restoration of diverse aboveground and belowground ecosystems.

Supplementary Materials

The following are available online at https://www.mdpi.com/1424-2818/12/4/150/s1. Table S1: Soil deposition volume. Figure S1: Experimental block layout at recipient sites. Figure S2: Representation of point-intercept data collection method. Table S2: ANOVA results for plant community data. Table S3: Tukey–Kramer post hoc results for plant community data. Table S4: Tukey post hoc results for bacterial abundance. Table S5: Average species values by treatment observed in March 2016.

Author Contributions

Conceptualization, S.K., M.L., and M.M.; methodology, S.K., K.T.S., M.M., B.K., and C.W.; formal analysis, S.K., K.T.S., M.M., M.P., B.K., and C.W.; investigation, K.T.S., P.T., M.M., B.K., and C.W.; data curation, K.T.S., P.T., B.K., C.W., M.M., and M.P.; writing—original draft preparation, K.T.S., M.M., S.K., M.P., P.T., and J.L.; writing—review and editing, K.T.S., M.M., S.K., P.T., J.L., B.K., C.W., M.P., E.A., and M.L.; visualization, K.T.S., M.M., and P.T.; supervision, S.K., M.L., and M.M.; project administration, S.K. and M.L. All authors have read and agreed to the published version of the manuscript.

Funding

This research was not supported by funding agencies.

Acknowledgments

We would like to thank all UC Irvine Center for Environmental Biology interns, as well as former technical staff, for assistance with data collection. Thank you also to Ursula Basinger-Walholm and Larry Venable from the University of Arizona for taking the time to share and demonstrate their method of sorting seeds from soil samples. We also extend thanks to the Natural Communities Coalition for providing the resources necessary to transport the soil, as well as the Irvine Ranch Conservancy to their dedication in maintaining these sites. We respectfully recognize that this research was conducted on the shared ancestral territory of the Acjachemen and Tongva Peoples.

Conflicts of Interest

The authors declare no conflict of interest; there were no funders.

References

  1. Jackson, L.L.; Lopoukhine, N.; Hillyard, D. Ecological Restoration: A Definition and Comments. Restor. Ecol. 1995, 3, 71–75. [Google Scholar] [CrossRef]
  2. Society for Ecological Restoration International Science & Policy Working Group. The SER International Primer on Ecological Restoration; Society for Ecological Restoration: Washington, DC, USA, 2004. [Google Scholar]
  3. Lesica, P.; Allendorf, F.W. Ecological Genetics and the Restoration of Plant Communities: Mix or Match? Restor. Ecol. 1999, 7, 42–50. [Google Scholar] [CrossRef]
  4. McKay, J.K.; Christian, C.E.; Harrison, S.; Rice, K.J. “How Local Is Local?”—A Review of Practical and Conceptual Issues in the Genetics of Restoration. Restor. Ecol. 2005, 13, 432–440. [Google Scholar] [CrossRef]
  5. Gustafson, D.J.; Halfacre, A.C.; Anderson, R.C. Practical Seed Source Selection for Restoration Projects in an Urban Setting: Tallgrass Prairie, Serpentine Barrens, and Coastal Habitat Examples. Urban Habitats 2008, 5, 18. [Google Scholar]
  6. Jordan, W.R. The Tallgrass Restoration Handbook: For Prairies, Savannas, and Woodlands; Island Press: Washington, DC, USA, 1997; ISBN 978-1-59726-258-3. [Google Scholar]
  7. Kimball, S.; Lulow, M.; Sorenson, Q.; Balazs, K.; Fang, Y.-C.; Davis, S.J.; O’Connell, M.; Huxman, T.E. Cost-effective ecological restoration. Restor. Ecol. 2015, 23, 800–810. [Google Scholar] [CrossRef]
  8. Wardle, D.A.; Bardgett, R.D.; Klironomos, J.N.; Setälä, H.; van der Putten, W.H.; Wall, D.H. Ecological Linkages Between Aboveground and Belowground Biota. Science 2004, 304, 1629–1633. [Google Scholar] [CrossRef]
  9. Lekberg, Y.; Koide, R.T. Is plant performance limited by abundance of arbuscular mycorrhizal fungi? A meta-analysis of studies published between 1988 and 2003. New Phytol. 2005, 168, 189–204. [Google Scholar] [CrossRef]
  10. Hoeksema, J.D.; Chaudhary, V.B.; Gehring, C.A.; Johnson, N.C.; Karst, J.; Koide, R.T.; Pringle, A.; Zabinski, C.; Bever, J.D.; Moore, J.C.; et al. A meta-analysis of context-dependency in plant response to inoculation with mycorrhizal fungi. Ecol. Lett. 2010, 13, 394–407. [Google Scholar] [CrossRef]
  11. van der Putten, W.H.; Bardgett, R.D.; Bever, J.D.; Bezemer, T.M.; Casper, B.B.; Fukami, T.; Kardol, P.; Klironomos, J.N.; Kulmatiski, A.; Schweitzer, J.A.; et al. Plant–soil feedbacks: The past, the present and future challenges. J. Ecol. 2013, 101, 265–276. [Google Scholar] [CrossRef]
  12. Phillips, M.L.; Aronson, E.L.; Maltz, M.R.; Allen, E.B. Native and invasive inoculation sources modify fungal community assembly and biomass production of a chaparral shrub. Appl. Soil Ecol. 2020, 147, 103370. [Google Scholar] [CrossRef]
  13. Mosse, B. Growth and Chemical Composition of Mycorrhizal and Non-mycorrhizal Apples. Nature 1957, 179, 922–924. [Google Scholar] [CrossRef]
  14. Allen, M.F.; Smith, W.K.; Moore, T.S.J.; Christensen, M. Comparative Water Relations and Photosynthesis of Mycorrhizal and Non-Mycorrhizal Bouteloua Gracilis H.b.k. Lag Ex Steud. New Phytol. 1981, 88, 683–693. [Google Scholar] [CrossRef] [Green Version]
  15. McGonigle, T.P.; Fitter, A.H. Growth and phosphorus inflows of Trifolium repens L. with a range of indigenous vesicular-arbuscular mycorrhizal infection levels under field conditions. New Phytol. 1988, 108, 59–65. [Google Scholar] [CrossRef]
  16. Maltz, M.R.; Treseder, K.K. Sources of inocula influence mycorrhizal colonization of plants in restoration projects: A meta-analysis. Restor. Ecol. 2015, 23, 625–634. [Google Scholar] [CrossRef]
  17. Ruiz-Jaen, M.C.; Mitchell Aide, T. Restoration Success: How Is It Being Measured? Restor. Ecol. 2018, 13, 569–577. [Google Scholar] [CrossRef]
  18. Wortley, L.; Hero, J.-M.; Howes, M. Evaluating Ecological Restoration Success: A Review of the Literature. Restor. Ecol. 2018, 21, 537–543. [Google Scholar] [CrossRef]
  19. Allen, E.B. The Reconstruction of Disturbed Arid Lands: An Ecological Approach; Routledge: London, UK, 2019; ISBN 978-1-00-030510-4. [Google Scholar]
  20. Weber, S.E.; Diez, J.M.; Andrews, L.V.; Goulden, M.L.; Aronson, E.L.; Allen, M.F. Responses of arbuscular mycorrhizal fungi to multiple coinciding global change drivers. Fungal Ecol. 2019, 40, 62–71. [Google Scholar] [CrossRef]
  21. Allen, E.B.; Allen, M.F.; Helm, D.J.; Trappe, J.M.; Molina, R.; Rincon, E. Patterns and regulation of mycorrhizal plant and fungal diversity. Plant Soil 1995, 170, 47–62. [Google Scholar] [CrossRef]
  22. Stutz, J.C.; Copeman, R.; Martin, C.A.; Morton, J.B. Patterns of species composition and distribution of arbuscular mycorrhizal fungi in arid regions of southwestern North America and Namibia, Africa. Can. J. Bot. 2000, 78, 237–245. [Google Scholar]
  23. Chaudhary, V.B.; O’Dell, T.E.; Rillig, M.C.; Johnson, N.C. Multiscale patterns of arbuscular mycorrhizal fungal abundance and diversity in semiarid shrublands. Fungal Ecol. 2014, 12, 32–43. [Google Scholar] [CrossRef]
  24. Stutz, J.C.; Morton, J.B. Successive pot cultures reveal high species richness of arbuscular endomycorrhizal fungi in arid ecosystems. Can. J. Bot. 1996, 74, 1883–1889. [Google Scholar] [CrossRef]
  25. Maherali, H.; Klironomos, J.N. Influence of Phylogeny on Fungal Community Assembly and Ecosystem Functioning. Science 2007, 316, 1746–1748. [Google Scholar] [CrossRef] [PubMed] [Green Version]
  26. Cione, N.K.; Padgett, P.E.; Allen, E.B. Restoration of a Native Shrubland Impacted by Exotic Grasses, Frequent Fire, and Nitrogen Deposition in Southern California. Restor. Ecol. 2002, 10, 376–384. [Google Scholar] [CrossRef]
  27. Tormo, J.; Bochet, E.; García-Fayos, P. Roadfill Revegetation in Semiarid Mediterranean Environments. Part II: Topsoiling, Species Selection, and Hydroseeding. Restor. Ecol. 2007, 15, 97–102. [Google Scholar] [CrossRef]
  28. Alday, J.G.; Marrs, R.H.; Martínez-Ruiz, C. Vegetation succession on reclaimed coal wastes in Spain: The influence of soil and environmental factors. Appl. Veg. Sci. 2011, 14, 84–94. [Google Scholar] [CrossRef]
  29. DePuit, E.J. Potential topsoiling strategies for enhancement of vegetation diversity on mined lands. Miner. Environ. 1984, 6, 115–120. [Google Scholar] [CrossRef]
  30. Abella, S.R.; Chiquoine, L.P.; Newton, A.C.; Vanier, C.H. Restoring a desert ecosystem using soil salvage, revegetation, and irrigation. J. Arid Environ. 2015, 115, 44–52. [Google Scholar] [CrossRef]
  31. Dixon, P.J. Assessment of Topsoil Salvage and Seed Augmentation in the Restoration of Coastal Sage Scrub on Santa Catalina Island, California. West. North Am. Nat. 2018, 78, 711–721. [Google Scholar] [CrossRef]
  32. Greipsson, S.; El-Mayas, H. Arbuscular Mycorrhizae of Leymus arenarius on Coastal Sands and Reclamation Sites in Iceland and Response to Inoculation. Restor. Ecol. 2000, 8, 144–150. [Google Scholar] [CrossRef]
  33. Sheoran, V.; Sheoran, A.S.; Poonia, P. Soil Reclamation of Abandoned Mine Land by Revegetation: A Review. Int. J. Soil Sediment Water 2010, 3, 21. [Google Scholar]
  34. Hankin, S.L.; Karst, J.; Landhäusser, S.M. Influence of tree species and salvaged soils on the recovery of ectomycorrhizal fungi in upland boreal forest restoration after surface mining. Botany 2015, 93, 267–277. [Google Scholar] [CrossRef]
  35. Ferris, F.K.; Kleinman, L.H.; Steward, D.G.; Stowe, R.R.; Vicklund, L.E.; Berry, J.D.; Cowan, R.; Dunne, C.G.; Dunne, R.; Fritz, D.M.; et al. Handbook of Western Reclamation Techniques; Office of Technology Transfer: Denver, CO, USA, 1996. [Google Scholar]
  36. Rundel, P.W. Terrestrial Vegetation of California, 3rd ed.; University of California Press: Berkeley, CA, USA, 2007. [Google Scholar]
  37. Bowler, P.A. Ecological Restoration of Coastal Sage Scrub and Its Potential Role in Habitat Conservation Plans. Environ. Manag. 2000, 26, S85–S96. [Google Scholar] [CrossRef] [PubMed]
  38. Kimball, S.; Goulden, M.L.; Suding, K.N.; Parker, S. Altered water and nitrogen input shifts succession in a southern California coastal sage community. Ecol. Appl. 2014, 24, 1390–1404. [Google Scholar] [CrossRef] [PubMed]
  39. Orange County, California—Historic Data. Available online: http://www.ocwatersheds.com/monitoring/hydrology/historic_data (accessed on 24 November 2019).
  40. Pake, C.E.; Venable, D.L. Seed Banks in Desert Annuals: Implications for Persistence and Coexistence in Variable Environments. Ecology 1996, 77, 1427–1435. [Google Scholar] [CrossRef]
  41. Khalili, B.; Weihe, C.; Kimball, S.; Schmidt, K.T.; Martiny, J.B.H. Optimization of a Method To Quantify Soil Bacterial Abundance by Flow Cytometry. mSphere 2019, 4, e00435-19. [Google Scholar] [CrossRef] [Green Version]
  42. Sylvia, D.M. Techniques for the Study of Mycorrhiza; Academic Press: Cambridge, MA, USA, 1992; ISBN 978-0-08-086053-4. [Google Scholar]
  43. Brundrett, M.C.; Abbott, L.K. Mycorrhizal fungus propagules in the jarrah forest. New Phytol. 1994, 127, 539–546. [Google Scholar] [CrossRef]
  44. Koske, R.E.; Tessier, B. A convenient, permanent slide mounting medium. 34(2):59. Mycol. Soc. Am. Newsl. 1983, 34, 59. [Google Scholar]
  45. Bonfante-Fasolo, P. Anatomy and Morphology of VA Mycorrhizae; CRC Press: Boca Raton, FL, USA, 1984; ISBN 978-1-351-09441-2. [Google Scholar]
  46. Rohland, N.; Reich, D. Cost-effective, high-throughput DNA sequencing libraries for multiplexed target capture. Genome Res. 2012, 22, 939–946. [Google Scholar] [CrossRef] [Green Version]
  47. Lee, J.; Lee, S.; Young, J.P.W. Improved PCR primers for the detection and identification of arbuscular mycorrhizal fungi. FEMS Microbiol. Ecol. 2008, 65, 339–349. [Google Scholar] [CrossRef] [Green Version]
  48. Dumbrell, A.J.; Ashton, P.D.; Aziz, N.; Feng, G.; Nelson, M.; Dytham, C.; Fitter, A.H.; Helgason, T. Distinct seasonal assemblages of arbuscular mycorrhizal fungi revealed by massively parallel pyrosequencing. New Phytol. 2011, 190, 794–804. [Google Scholar] [CrossRef]
  49. Berry, D.; Mahfoudh, K.B.; Wagner, M.; Loy, A. Barcoded Primers Used in Multiplex Amplicon Pyrosequencing Bias Amplification. Appl. Environ. Microbiol. 2012, 78, 612. [Google Scholar] [CrossRef] [Green Version]
  50. Alvarado, P.; de Teixeira, M.M.; Andrews, L.; Fernandez, A.; Santander, G.; Doyle, A.; Perez, M.; Yegres, F.; Barker, B.M. Detection of Coccidioides posadasii from xerophytic environments in Venezuela reveals risk of naturally acquired coccidioidomycosis infections. Emerg. Microbes Infect. 2018, 7, 1–13. [Google Scholar] [CrossRef] [Green Version]
  51. Andrews, S. FastQC, A Quality Control Tool for High Throughput Sequence Data; Babraham Institute: Cambridge, UK, 2010. [Google Scholar]
  52. Caporaso, J.G.; Kuczynski, J.; Stombaugh, J.; Bittinger, K.; Bushman, F.D.; Costello, E.K.; Fierer, N.; Peña, A.G.; Goodrich, J.K.; Gordon, J.I.; et al. QIIME allows analysis of high-throughput community sequencing data. Nat. Methods 2010, 7, 335–336. [Google Scholar] [CrossRef] [Green Version]
  53. Rognes, T.; Flouri, T.; Nichols, B.; Quince, C.; Mahé, F. VSEARCH: A versatile open source tool for metagenomics. PeerJ 2016, 4, e2584. [Google Scholar] [CrossRef] [PubMed]
  54. Mahé, F.; Rognes, T.; Quince, C.; de Vargas, C.; Dunthorn, M. Swarm: Robust and fast clustering method for amplicon-based studies. PeerJ 2014, 2, e593. [Google Scholar]
  55. Altschul, S.F.; Gish, W.; Miller, W.; Myers, E.W.; Lipman, D.J. Basic local alignment search tool. J. Mol. Biol. 1990, 215, 403–410. [Google Scholar] [CrossRef]
  56. Öpik, M.; Vanatoa, A.; Vanatoa, E.; Moora, M.; Davison, J.; Kalwij, J.M.; Reier, Ü.; Zobel, M. The online database MaarjAM reveals global and ecosystemic distribution patterns in arbuscular mycorrhizal fungi (Glomeromycota). New Phytol. 2010, 188, 223–241. [Google Scholar] [CrossRef] [PubMed]
  57. Paulson, J.N.; Stine, O.C.; Bravo, H.C.; Pop, M. Differential abundance analysis for microbial marker-gene surveys. Nat. Methods 2013, 10, 1200–1202. [Google Scholar] [CrossRef] [Green Version]
  58. Phillips, M.L.; Weber, S.E.; Andrews, L.V.; Aronson, E.L.; Allen, M.F.; Allen, E.B. Fungal community assembly in soils and roots under plant invasion and nitrogen deposition. Fungal Ecol. 2019, 40, 107–117. [Google Scholar] [CrossRef]
  59. Hausmann, N.T.; Hawkes, C.V. Plant neighborhood control of arbuscular mycorrhizal community composition. New Phytol. 2009, 183, 1188–1200. [Google Scholar] [CrossRef]
  60. Sikes, B.A.; Cottenie, K.; Klironomos, J.N. Plant and fungal identity determines pathogen protection of plant roots by arbuscular mycorrhizas. J. Ecol. 2009, 97, 1274–1280. [Google Scholar] [CrossRef] [Green Version]
  61. Allen, M.F.; Swenson, W.; Querejeta, J.I.; Egerton-Warburton, L.M.; Treseder, K.K. Ecology of Mycorrhizae: A Conceptual Framework for Complex Interactions Among Plants and Fungi. Annu. Rev. Phytopathol. 2003, 41, 271–303. [Google Scholar] [CrossRef] [PubMed] [Green Version]
  62. Sikes, B.A.; Powell, J.R.; Rillig, M.C. Deciphering the relative contributions of multiple functions within plant–microbe symbioses. Ecology 2010, 91, 1591–1597. [Google Scholar] [CrossRef] [PubMed] [Green Version]
  63. Wickham, H. ggplot2: Elegant Graphics for Data Analysis; Springer-Verlag: New York, NY, USA, 2009. [Google Scholar]
  64. Package ‘vegan’; Community Ecology Package, Version 2. 2019. Available online: http://CRAN.R-project.org/package=vegan (accessed on 1 September 2019).
  65. Balshor, B.J.; Garrambone, M.S.; Austin, P.; Balazs, K.R.; Weihe, C.; Martiny, J.B.H.; Huxman, T.E.; McCollum, J.R.; Kimball, S. The effect of soil inoculants on seed germination of native and invasive species. Botany 2017, 95, 469–480. [Google Scholar] [CrossRef] [Green Version]
  66. Golos, P.J.; Dixon, K.W.; Erickson, T.E. Plant recruitment from the soil seed bank depends on topsoil stockpile age, height, and storage history in an arid environment. Restor. Ecol. 2016, 24, S53–S61. [Google Scholar] [CrossRef]
  67. Burke, A. The effect of topsoil treatment on the recovery of rocky plain and outcrop plant communities in Namibia. J. Arid Environ. 2008, 72, 1531–1536. [Google Scholar] [CrossRef]
  68. Visser, S.; Griffiths, C.L.; Parkinson, D. Topsoil storage effects on primary production and rates of vesicular-arbuscular mycorrhizal development inAgropyron trachycaulum. Plant Soil 1984, 82, 51–60. [Google Scholar] [CrossRef]
  69. Van Der Heijden, M.G.A.; Bardgett, R.D.; Straalen, N.M.V. The unseen majority: Soil microbes as drivers of plant diversity and productivity in terrestrial ecosystems. Ecol. Lett. 2008, 11, 296–310. [Google Scholar] [CrossRef]
  70. Lankau, E.W.; Lankau, R.A. Plant species capacity to drive soil fungal communities contributes to differential impacts of plant–soil legacies. Ecology 2014, 95, 3221–3228. [Google Scholar] [CrossRef]
  71. Cox, R.D.; Allen, E.B. Composition of soil seed banks in southern California coastal sage scrub and adjacent exotic grassland. Plant Ecol. 2007, 198, 37. [Google Scholar] [CrossRef]
  72. Strickland, M.S.; Rousk, J. Considering fungal:bacterial dominance in soils – Methods, controls, and ecosystem implications. Soil Biol. Biochem. 2010, 42, 1385–1395. [Google Scholar] [CrossRef]
  73. Sylvia, D.M. Nursery Inoculation of Sea Oats with Vesicular-Arbuscular Mycorrhizal Fungi and Outplanting Performance on Florida Beaches. J. Coast. Res. 1989, 5, 9. [Google Scholar]
  74. Allen, M.F.; Moore, T.S., Jr.; Christensen, M. Phytohormone changes in Bouteloua gracilis infected by vesicular–arbuscular mycorrhizae: I. Cytokinin increases in the host plant. Can. J. Bot. 1980, 58, 371–374. [Google Scholar] [CrossRef]
  75. Treseder, K.K. The extent of mycorrhizal colonization of roots and its influence on plant growth and phosphorus content. Plant Soil 2013, 371, 1–13. [Google Scholar] [CrossRef] [Green Version]
  76. Piñeiro, J.; Maestre, F.T.; Bartolomé, L.; Valdecantos, A. Ecotechnology as a tool for restoring degraded drylands: A meta-analysis of field experiments. Ecol. Eng. 2013, 61, 133–144. [Google Scholar] [CrossRef]
  77. Mummey, D.L.; Rillig, M.C. The invasive plant species Centaurea maculosa alters arbuscular mycorrhizal fungal communities in the field. Plant Soil 2006, 288, 81–90. [Google Scholar] [CrossRef]
  78. Zhao, H.; Li, X.; Zhang, Z.; Zhao, Y.; Yang, J.; Zhu, Y. Species diversity and drivers of arbuscular mycorrhizal fungal communities in a semi-arid mountain in China. PeerJ 2017, 5, e4155. [Google Scholar] [CrossRef] [Green Version]
  79. Pringle, A.; Bever, J.D.; Gardes, M.; Parrent, J.L.; Rillig, M.C.; Klironomos, J.N. Mycorrhizal Symbioses and Plant Invasions. Annu. Rev. Ecol. Evol. Syst. 2009, 40, 699–715. [Google Scholar] [CrossRef] [Green Version]
  80. Lekberg, Y.; Gibbons, S.M.; Rosendahl, S.; Ramsey, P.W. Severe plant invasions can increase mycorrhizal fungal abundance and diversity. ISME J. 2013, 7, 1424–1433. [Google Scholar] [CrossRef] [Green Version]
  81. Inderjit; van der Putten, W.H. Impacts of soil microbial communities on exotic plant invasions. Trends Ecol. Evol. 2010, 25, 512–519. [Google Scholar] [CrossRef]
  82. Potthoff, M.; Steenwerth, K.L.; Jackson, L.E.; Drenovsky, R.E.; Scow, K.M.; Joergensen, R.G. Soil microbial community composition as affected by restoration practices in California grassland. Soil Biol. Biochem. 2006, 38, 1851–1860. [Google Scholar] [CrossRef] [Green Version]
  83. Maltz, M.R.; Bell, C.E.; Mitrovich, M.J.; Iyer, A.R.; Treseder, K.K. Invasive Plant Management Techniques Alter Arbuscular Mycorrhizal Fungi. Ecol. Restor. 2016, 34, 209–215. [Google Scholar] [CrossRef]
  84. Liddicoat, C.; Weinstein, P.; Bissett, A.; Genie, N.J.C.; Mills, J.G.; Waycott, M.; Breed, M.F. Can bacterial indicators of a grassy woodland restoration inform ecosystem assessment and microbiota-mediated human health? Environ. Int. 2019, 129, 105–117. [Google Scholar] [CrossRef] [PubMed]
  85. Potthoff, M.; Jackson, L.E.; Steenwerth, K.L.; Ramirez, I.; Stromberg, M.R.; Rolston, D.E. Soil Biological and Chemical Properties in Restored Perennial Grassland in California. Restor. Ecol. 2005, 13, 61–73. [Google Scholar] [CrossRef]
  86. Brewer, T.E.; Aronson, E.L.; Arogyaswamy, K.; Billings, S.A.; Botthoff, J.K.; Campbell, A.N.; Dove, N.C.; Fairbanks, D.; Gallery, R.E.; Hart, S.C.; et al. Ecological and Genomic Attributes of Novel Bacterial Taxa That Thrive in Subsurface Soil Horizons. mBio 2019, 10, e01318-19. [Google Scholar] [CrossRef] [Green Version]
  87. Dove, N.C.; Arogyaswamy, K.; Billings, S.; Bothoff, J.; Carey, C.; Cisco, C.; DeForest, J.; Fairbanks, D.; Fierer, N.; Gallery, R.; et al. Continental-scale patterns of extracellular enzyme activity in the subsoil: An overlooked reservoir of microbial activity. Ecol. Lett. 2020. in review. [Google Scholar] [CrossRef]
Figure 1. Map of study sites, including the donor site, Orchard Hills, from which soil was collected, and the three recipient sites, West Loma, Hick’s Haul, and Portola, where salvaged soil was deposited.
Diversity 12 00150 g001
Figure 2. Experimental blocks represented all salvaged-soil deposition-depth treatments, here depicted from a side view. Soil salvaged from the intact donor site was deposited on top of existing soil at the degraded recipient site. Control plots received no salvaged soil, while dusted plots received only a dusting of soil. Plots of 5, 10, and 15 cm received a salvaged soil layer of the stated depth.
Diversity 12 00150 g002
Figure 3. Average total seeds (in seeds/mL of soil) collected at the salvaged donor site, at various depths. A significant number of seeds was found in the top 5 cm of soil. Bars represent +/− 1SE of the mean. (Kruskal–Wallis—Chi-square = 9.374, df = 3, p = 0.025.)
Diversity 12 00150 g003
Figure 4. Average percent cover of non-native grasses and non-native forbs observed in salvaged plots in February 2016. Bars represent +/− 1SE of the mean. Letters above bars indicate results from a Tukey post hoc test, in which unique letters indicate significant differences amongst treatment groups. Letters were not used to signify differences in non-native forb data, because no significant effects were found between any treatment groups. (ANOVA—non-native grasses: F4,30 = 24.598, p > 0.001; non-native forbs: F4,30 = 2.589, p = 0.118).
Diversity 12 00150 g004
Figure 5. Mean native density (a) and mean native species richness (b) by treatment at the donor sites. Bars represent +/− 1SE of the mean (repeated measured ANOVA *** p < 0.0001, ** p < 0.01, * p < 0.05).
Diversity 12 00150 g005
Figure 6. Mean non-native cover (a) and mean non-native species richness (b) by treatment at the donor sites. Bars represent +/− 1SE of the mean (repeated measures ANOVA *** p < 0.0001, ** p < 0.01, * p < 0.05).
Diversity 12 00150 g006
Figure 7. Bacterial abundance by treatment. “Donor” refers to bacterial abundance levels found at the donor site, while all other treatment conditions refer to the recipient sites. Bars represent +/− 1SE of the mean. Bacterial abundance was measured in January 2016 and in April 2017, and was significantly higher in control and dusted treatments in both 2016 and 2017, with dusted plots containing higher abundance than even the control plots on 2016. (ANOVA, F5,76 = 19.37, p < 0.0001).
Diversity 12 00150 g007
Figure 8. Mycorrhizal community structure across the donor sites (squares) and three recipient sites (circles) in 2015 (a) and at one recipient site (Portola) in 2017 (b). In 2015, arbuscular mycorrhizal fungi (AMF) community composition at the donor site (panel (a), red squares) was more similar to the community composition at Portola Staging area (panel (a), blue circles) than the resident AMF communities at both Hick’s Haul (panel (a), gray circles) and West Loma (panel (a), purple circles). In 2017, we detected a shift in AMF communities at Portola, in the plots with at least 5 cm of salvaged soil, as compared to both control (panel (b), black squares) and dusted (panel (b), gray squares).
Diversity 12 00150 g008
Figure 9. Richness of rhizophilic AMF taxa. “Donor site” refers to OTU (operational taxonomic unit, equivalent to molecular species concept) richness found at the donor site, while “Recipient sites” refers to all other sampling locations at the recipient sites. Rhizophilic AMF richness was measured in the donor site and the recipient site, “pre-treatment”, in December 2015 and recipient sites, “post-treatment” were measured in April 2017. Rhizophilic AMF richness was significantly higher in recipient sites, post-treatment, in 2017, than in the recipient sites, pre-treatment, in 2015 (p < 0.001).
Diversity 12 00150 g009

