Article

Plant Invasion Has Limited Impact on Soil Microbial α-Diversity: A Meta-Analysis

by
Gordon F. Custer
1,2,* and
Linda T. A. van Diepen
1,2
1
Program in Ecology, University of Wyoming, Laramie, WY 82071, USA
2
Department of Ecosystem Science and Management, University of Wyoming, Laramie, WY 82071, USA
*
Author to whom correspondence should be addressed.
Diversity 2020, 12(3), 112; https://doi.org/10.3390/d12030112
Submission received: 1 February 2020 / Revised: 12 March 2020 / Accepted: 18 March 2020 / Published: 20 March 2020
(This article belongs to the Special Issue Microbial Interactions with Invasive Plant Species)

Abstract

:
Plant invasion has proven to be a significant driver of ecosystem change, and with the increased probability of invasion due to globalization, agricultural practices and other anthropogenic causes, it is crucial to understand its impact across multiple trophic levels. With strong linkages between above and belowground processes, the response of soil microorganisms to plant invasion is the next logical step in developing our conceptual understanding of this complex system. In our study, we utilized a meta-analytical approach to better understand the impacts of plant invasion on soil microbial diversity. We synthesized 70 independent studies with 23 unique invaders across multiple ecosystem types to search for generalizable trends in soil microbial α-diversity following invasion. When possible, soil nutrient metrics were also collected in an attempt to understand the contribution of nutrient status shifts on microbial α-diversity. Our results show plant invasion to have highly heterogenous and limited impacts on microbial α-diversity. When taken together, our study indicates soil microbial α-diversity to remain constant following invasion, contrary to the aboveground counterparts. As our results suggest a decoupling in patterns of below and aboveground diversity, future work is needed to examine the drivers of microbial diversity patterns following invasion.

1. Introduction

Plant invasion has been shown to cause shifts in ecosystem structure and function, above and belowground diversity, as well as shifts in soil and plant nutrient status [1,2,3,4]. However, the exact drivers and interactions of these shifts in ecosystem characteristics remain less understood. As biological invasions, mainly a consequence of human activity, are expected to increase in the coming years due to globalization [5,6,7], agriculture and other human activities [8], understanding how plant invasion impacts ecosystems characteristics is crucial. While the aboveground impacts, including decreased plant diversity, are often the most apparent, belowground response to invasion is of great significance [9], due to the importance of microorganisms in ecosystem level processes, including the decomposition of organic materials, and mineralization and transformation of nutrients. In addition to these critical processes, soil microbiota are also posited to be critical players in the establishment and spread of invasive plants [9] via mechanisms including the enemy release, the accumulation of local pathogens, and the enhanced mutualist hypotheses [10,11,12]; thus, demonstrating the importance and pivotal role these unseen microorganisms play in the process of plant invasion as well as ecosystem response.
Previous studies and meta-analyses have examined the impacts of plant invasion on aboveground biodiversity, soil carbon (C) and nitrogen (N), and animal performance, as well as plant and soil nutrient status [1,13,14,15] across invader and ecosystem type. Results show significant shifts in nutrient pools and fluxes, aboveground biodiversity, and other ecosystem characteristics [1,13,14,15], demonstrating the impact invasion can have on ecosystem function. With regard to belowground biotic response to plant invasion, results are mixed, with no generalizable trend [4,16]. Currently, theory and understanding of microbial biogeography and diversity imply a strong linkage between both nutrient status and aboveground diversity with the belowground counterpart. As meta-analyses suggest long-term declines in aboveground diversity [14] and increases in soil nutrient content [1] following biological invasions, similar shifts in soil microbial diversity could be expected. However, challenges to this paradigm exist and suggest that aboveground biodiversity may be insufficient for predicting and understanding belowground diversity [17,18]. Our limited understanding of microbial response to plant invasion stems from the fact that microbial diversity is dependent upon a wide set of edaphic factors and management history of the invaded lands [19], among other things. Our inability to conclude whether there are generalizable impacts of plant invasion on soil microbial diversity remains an important gap in our knowledge.
In order to better understand the impact of plant invasion on soil microbial diversity, we conducted a review of the existing literature and synthesized studies reporting microbial α-diversity in response to plant invasion. These data were then used to determine the impact plant invasion has on microbial α-diversity, using a weighted response ratio. To further examine whether the response of microbial α-diversity was associated with nutrient status following invasion, studies reporting both diversity and nutrient status parameters were subjected to Spearman correlation testing. Collecting both α-diversity and nutrient data will help to provide additional information of the mechanisms driving microbial response to invasion. We hypothesized that plant invasion would have positive impacts on microbial diversity due to increased substrate (soil C) availability [20] and thus increased microbial niche partitioning. Though plant invasion is associated with decreased aboveground diversity, complete extinction of native plants is rare [21]. With this, native plants and their microbial communities are preserved, albeit present in smaller numbers and more dispersed across the landscape. At the same time, invaders and their microbiomes become established, creating the potential for increased belowground diversity. Secondly, we hypothesized that invasive-induced changes in soil carbon would be positively correlated, and soil nitrogen negatively correlated with microbial α-diversity. In nitrogen deposition studies, increased inorganic nitrogen has been shown to lead to decreased microbial diversity, potentially a product of decreased competitive ability of N-fixing species [20], and we believe invasive systems will mimic this observed pattern, due to increases in N-pool sizes and N-mineralization observed in invaded systems [1]. Likewise, soil carbon availability has been shown to be positively associated with microbial α-diversity [20,22]. Increased substrate availability (soil C) has the potential to alleviate C limitation in soils, allowing for more microbial taxa to proliferate. We believe a similar shift in microbial abundances and diversity will be found, due to the associated increase in soil organic matter (SOM) following invasion [1].

2. Materials and Methods

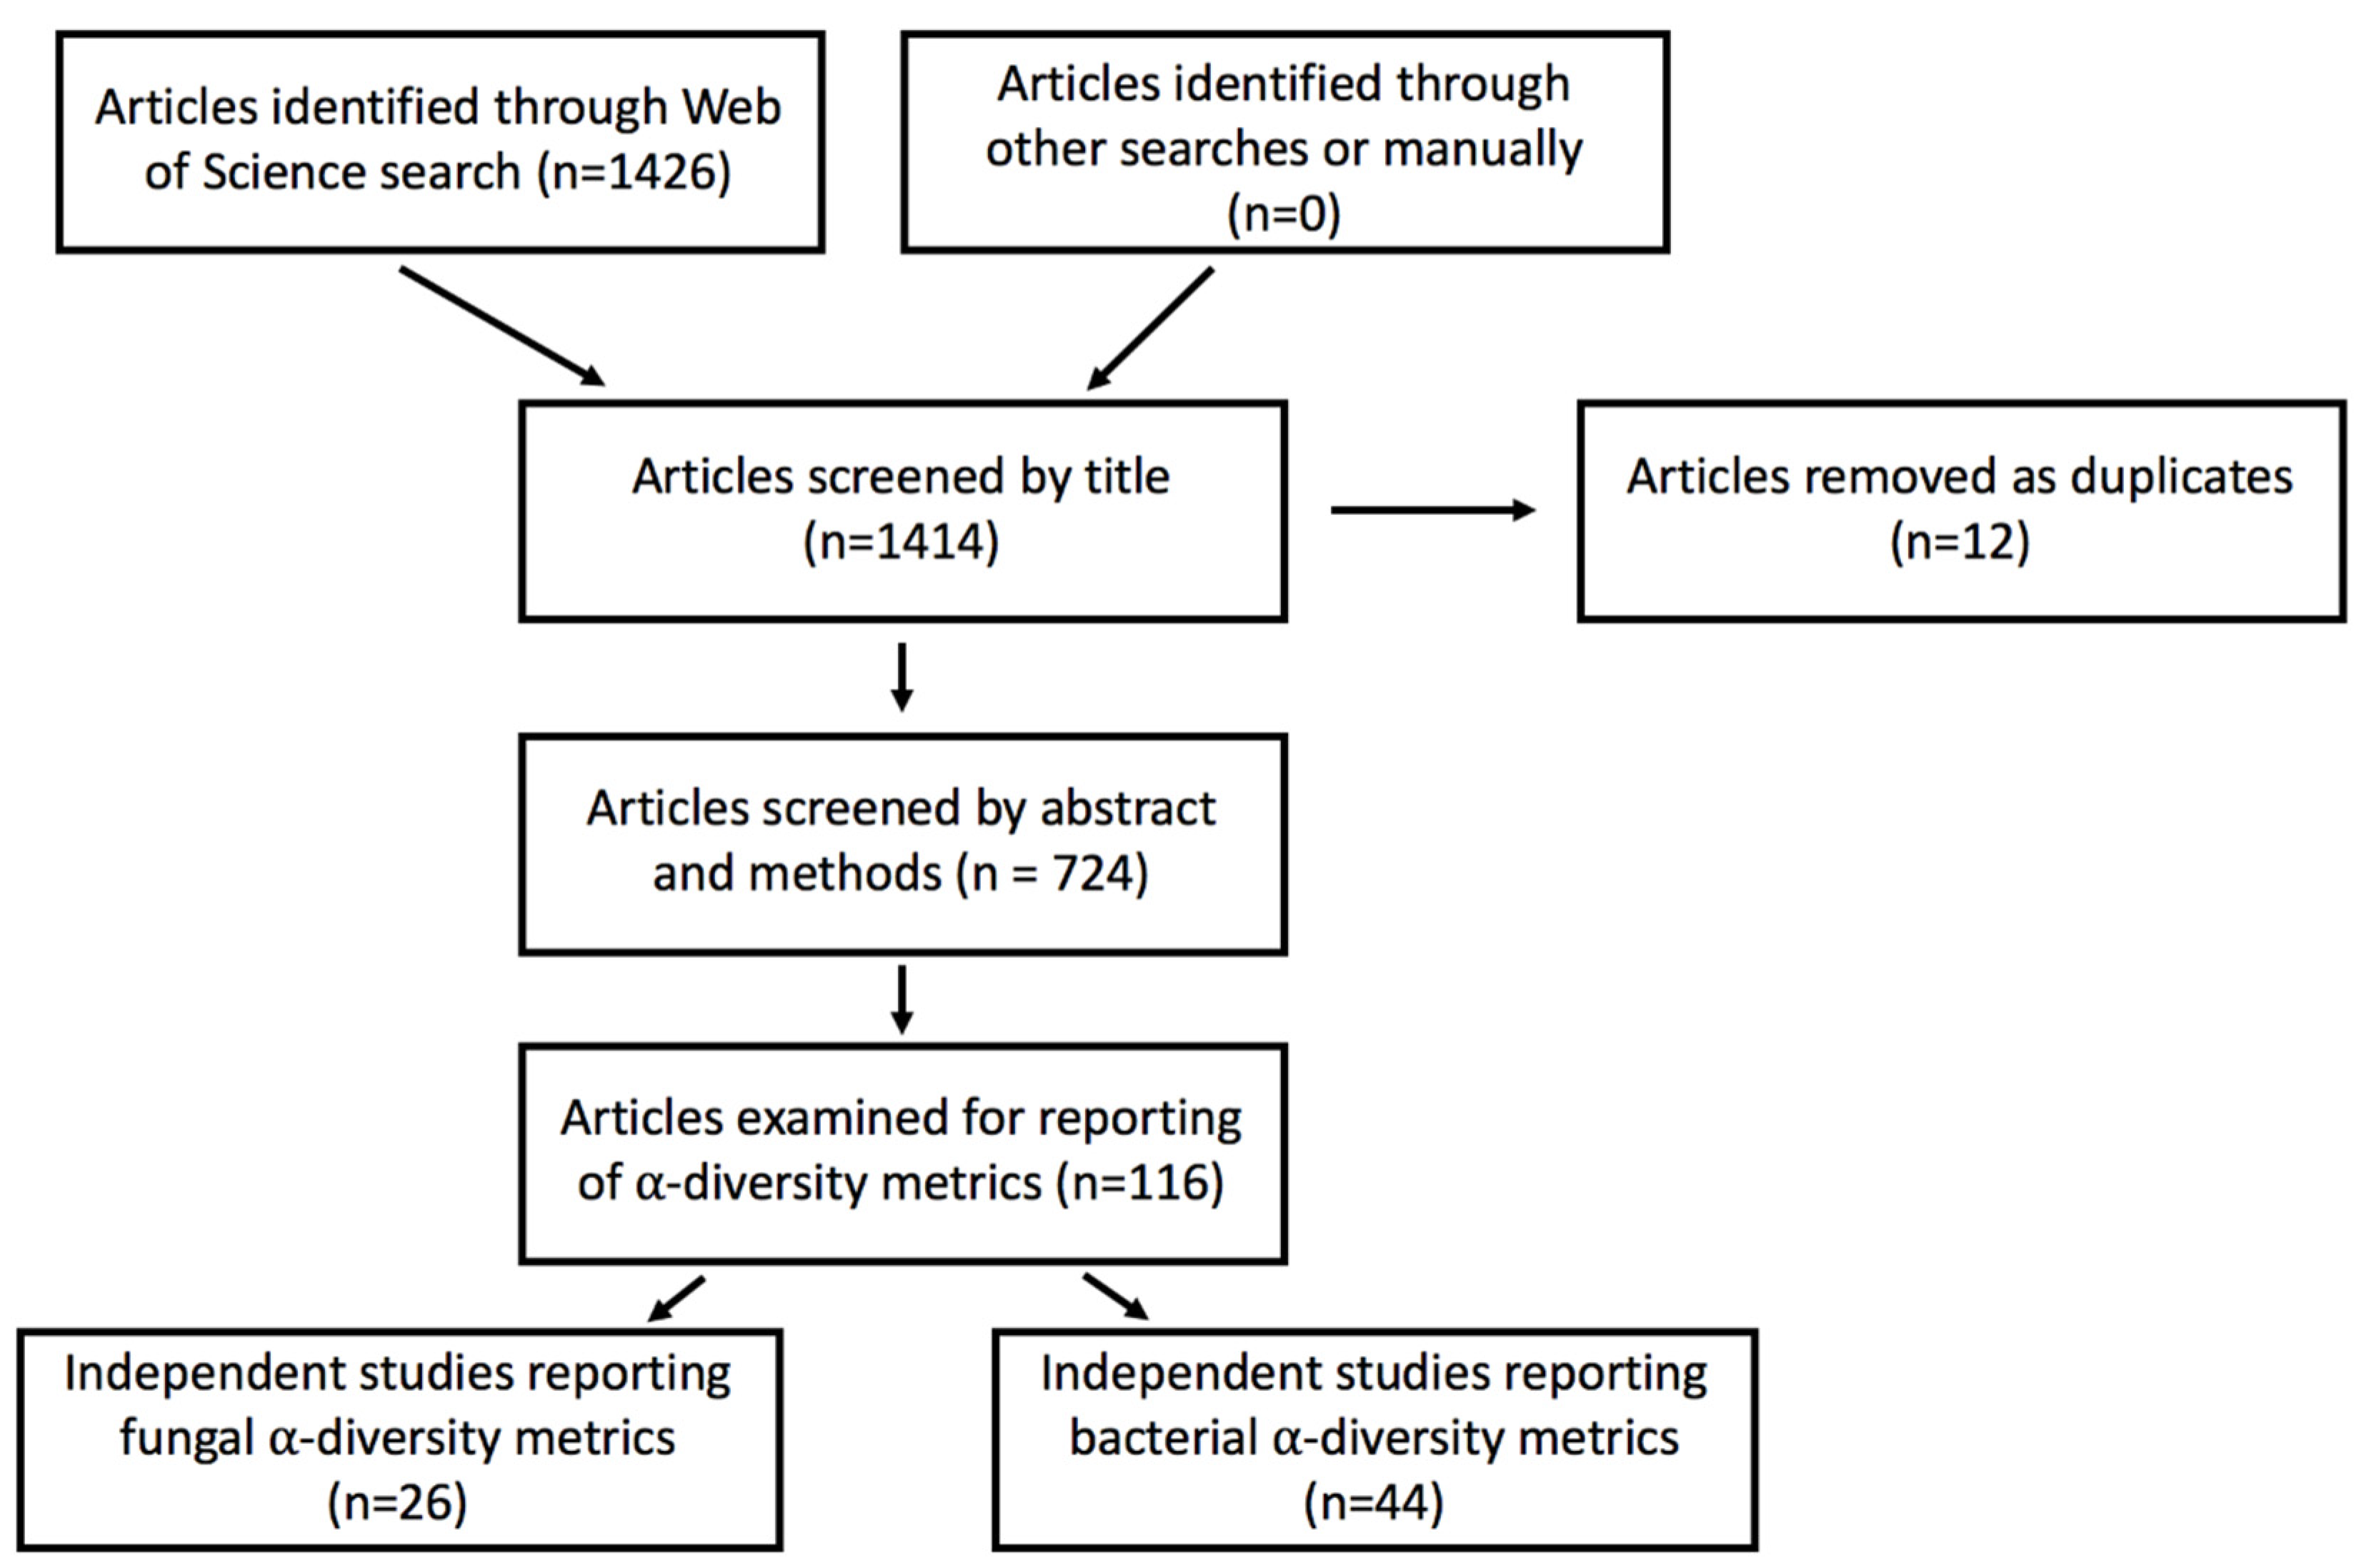
2.1. Data Acquisition

In July of 2019, a literature review was conducted using Web of Science™ all platforms. Exact search terms are reported in the supplementary materials ST1. Briefly, terms included microbial diversity, soil nutrients and plant invasion. The search returned 1426 papers, which were further pruned to only include those which reported α-diversity measurements of soil biota in both invaded and uninvaded plots. The criteria used to retain a study were as follows: (1) The identity of the invasive plant(s) must be reported explicitly and be vascular, (2) the ecosystem type must be discernable, i.e. wetland vs. terrestrial, as this would likely confound the impacts of invasion on microbial α-diversity, (3) studies reported natural (in vivo) invasion (no results from studies which added allelopathic chemicals to soils were retained), (4) studies measured and reported microbial α-diversity (Shannon diversity (H`) or richness) from the same time point in invaded and uninvaded plots, and (5) studies reported mean and standard error (SE) or standard deviation (SD) values for α-diversity in both invaded and uninvaded plots. In situations where no SE or SD values were reported, the average percentage SD was imputed [23,24] from the other studies reporting that metric. In multiple situations, more than one comparison was reported in a single paper. The following criteria were utilized to determine which comparisons were retained for our meta-analysis: (1) If a chronosequence was used, we used the uninvaded and longest time since invasion comparison only, (2) if multiple invasive plants were compared to a single native, we utilized all studies, as long as the invaded sites were independent of each other, (3) if an invasive was compared to multiple native plants, we only used a single comparison between the invasive and dominant vegetation type, and (4) if multiple classes of invasive cover were reported, the highest percentage cover was used.
After subjecting our Web of Science™ search to the above criteria, Shannon diversity (H`) and richness (number of taxa) were collected from the remaining studies. Other α-diversity metrics were often reported, but due to strong correlations and commonality in reporting both H` and richness, only these two metrics were retained for our analysis. When possible, nutrient status and physicochemical metrics including nitrate, ammonium, total nitrogen, total carbon (TC), soil organic matter (SOM), electrical conductivity and pH were retained for examining correlations with microbial α-diversity following invasion. Nutrient status and physicochemical metrics were not reported in every study.
For every retained study, we collected relevant information that could be used for sub-setting studies (Table 1). The majority of the sub-setting information was acquired from the papers themselves. However, in some cases, additional information, such as nitrogen fixing status or growth morphology, was collected from third party sources. Nitrogen fixing status of the invasive plant was coded as 0 (non-N-fixing) or 1 (N-fixing). Genomic methods were divided into two groups: 1) high throughput (HTS) methods, which yield higher taxonomic resolution, and 2) non-high throughput methods, which yield lower taxonomic resolution. Wetland (-) and unknown ecosystem types were removed from fungal analysis, due to the small sample size and inability to subset the unknown studies into the correct ecosystem type. Only unknown ecosystem types were removed from the bacterial analysis.
A list for each study used in our meta-analysis can be found in our supplementary information (supplementary Tables S1 and S2).

2.2. Statistical Analyses

2.2.1. Determination of Effect Sizes

All statistical analyses were carried out in R V3.5.2-Eggshell Igloo [25]. Our meta-analysis used a weighted log response ratio of means (ROM) approach to calculate effect size of invasion, as proposed by Hedges [26]. We chose this method due to its widespread application in ecological meta-analyses and its ease of interpretation. For our meta-analysis, invasion was regarded as the treatment. Mean ( X ¯ ), SD (S) and sample size (n) of both the control (c) and treatment (t) groups were used to calculate the 95% confidence intervals of the individual experiment effect sizes.
Formula (1) was used to calculate the log response ratio (lnRR), and formula (2) to calculate the variance of the log response ratio (v).
lnRR = ln ( X ¯ t )   ln ( X ¯ c )
v = S t 2 n t X ¯ t 2 +   S c 2 n c X ¯ c 2
Weighted mean effect size for microbial α-diversity metrics was calculated and analyzed using either a fixed or random effects model, with a restricted maximum likelihood estimator (REML) [27]. Log response ratio of the weighted mean (referred to as ratio of means (ROM)) and associated 95% confidence intervals were calculated for bacterial and fungal diversity metrics individually using formula (3):
ROM = i = 1 n t j = 1 n c 1 v ij RR ij i = 1 n t j = 1 n c 1 v ij
RRij and vij represent the pooled effect size and its associated variance, respectively, for each response of each individual study. Effect size and confidence intervals were adjusted using the Hartung-Knapp (H.K.) method [28]. However, Jackson et al. [29] discuss the pros and cons of the use of the H.K. adjustment and provide several options for the use of this adjustment, ranging from never using to always using. To ensure our meta-analysis was conservative, we ran our models with the H.K. adjustment and without, reporting both, as suggested by Jackson et al. [29]. In our results, we report both p-values and indicate when the adjusted and non-adjusted values suggest differences in statistical significance. Outliers were assessed by the find.outliers() function in the dmetar package [30]. This function removes values in which the individual study’s 95% confidence interval does not overlap with the pooled 95% confidence interval for the ROMs. Models were run with both outliers included and excluded, to determine whether these values were responsible for the observed trends. When statistical significance was different between the models with outliers excluded and included, both model outputs were reported.
Data were subset into subgroups, as detailed in Table 1, in situations where the number of studies (n) reporting a given metric was greater than or equal to 5. This cutoff was chosen to limit the inferences made from a small number of studies. In situations in which studies were subset to represent a single population with low heterogeneity (I2 < 25%), we utilized a fixed effects model, as this model could be justified. Otherwise, a random effects model was used. Between study variance (τ) was estimated, using the restricted maximum-likelihood estimator, as per the results of Veroniki et al. [31] for continuous response variables. The model type used for each response is indicated in Supplementary Tables S3 and S4. Small sample bias was assessed visually using funnel plots, and asymmetry of the plots was tested for using an Egger’s test for asymmetry [32]. If the Egger’s test suggested significant publication bias, then the Duval and Tweedie’s trim and fill procedure [33] was implemented to correct for this bias.

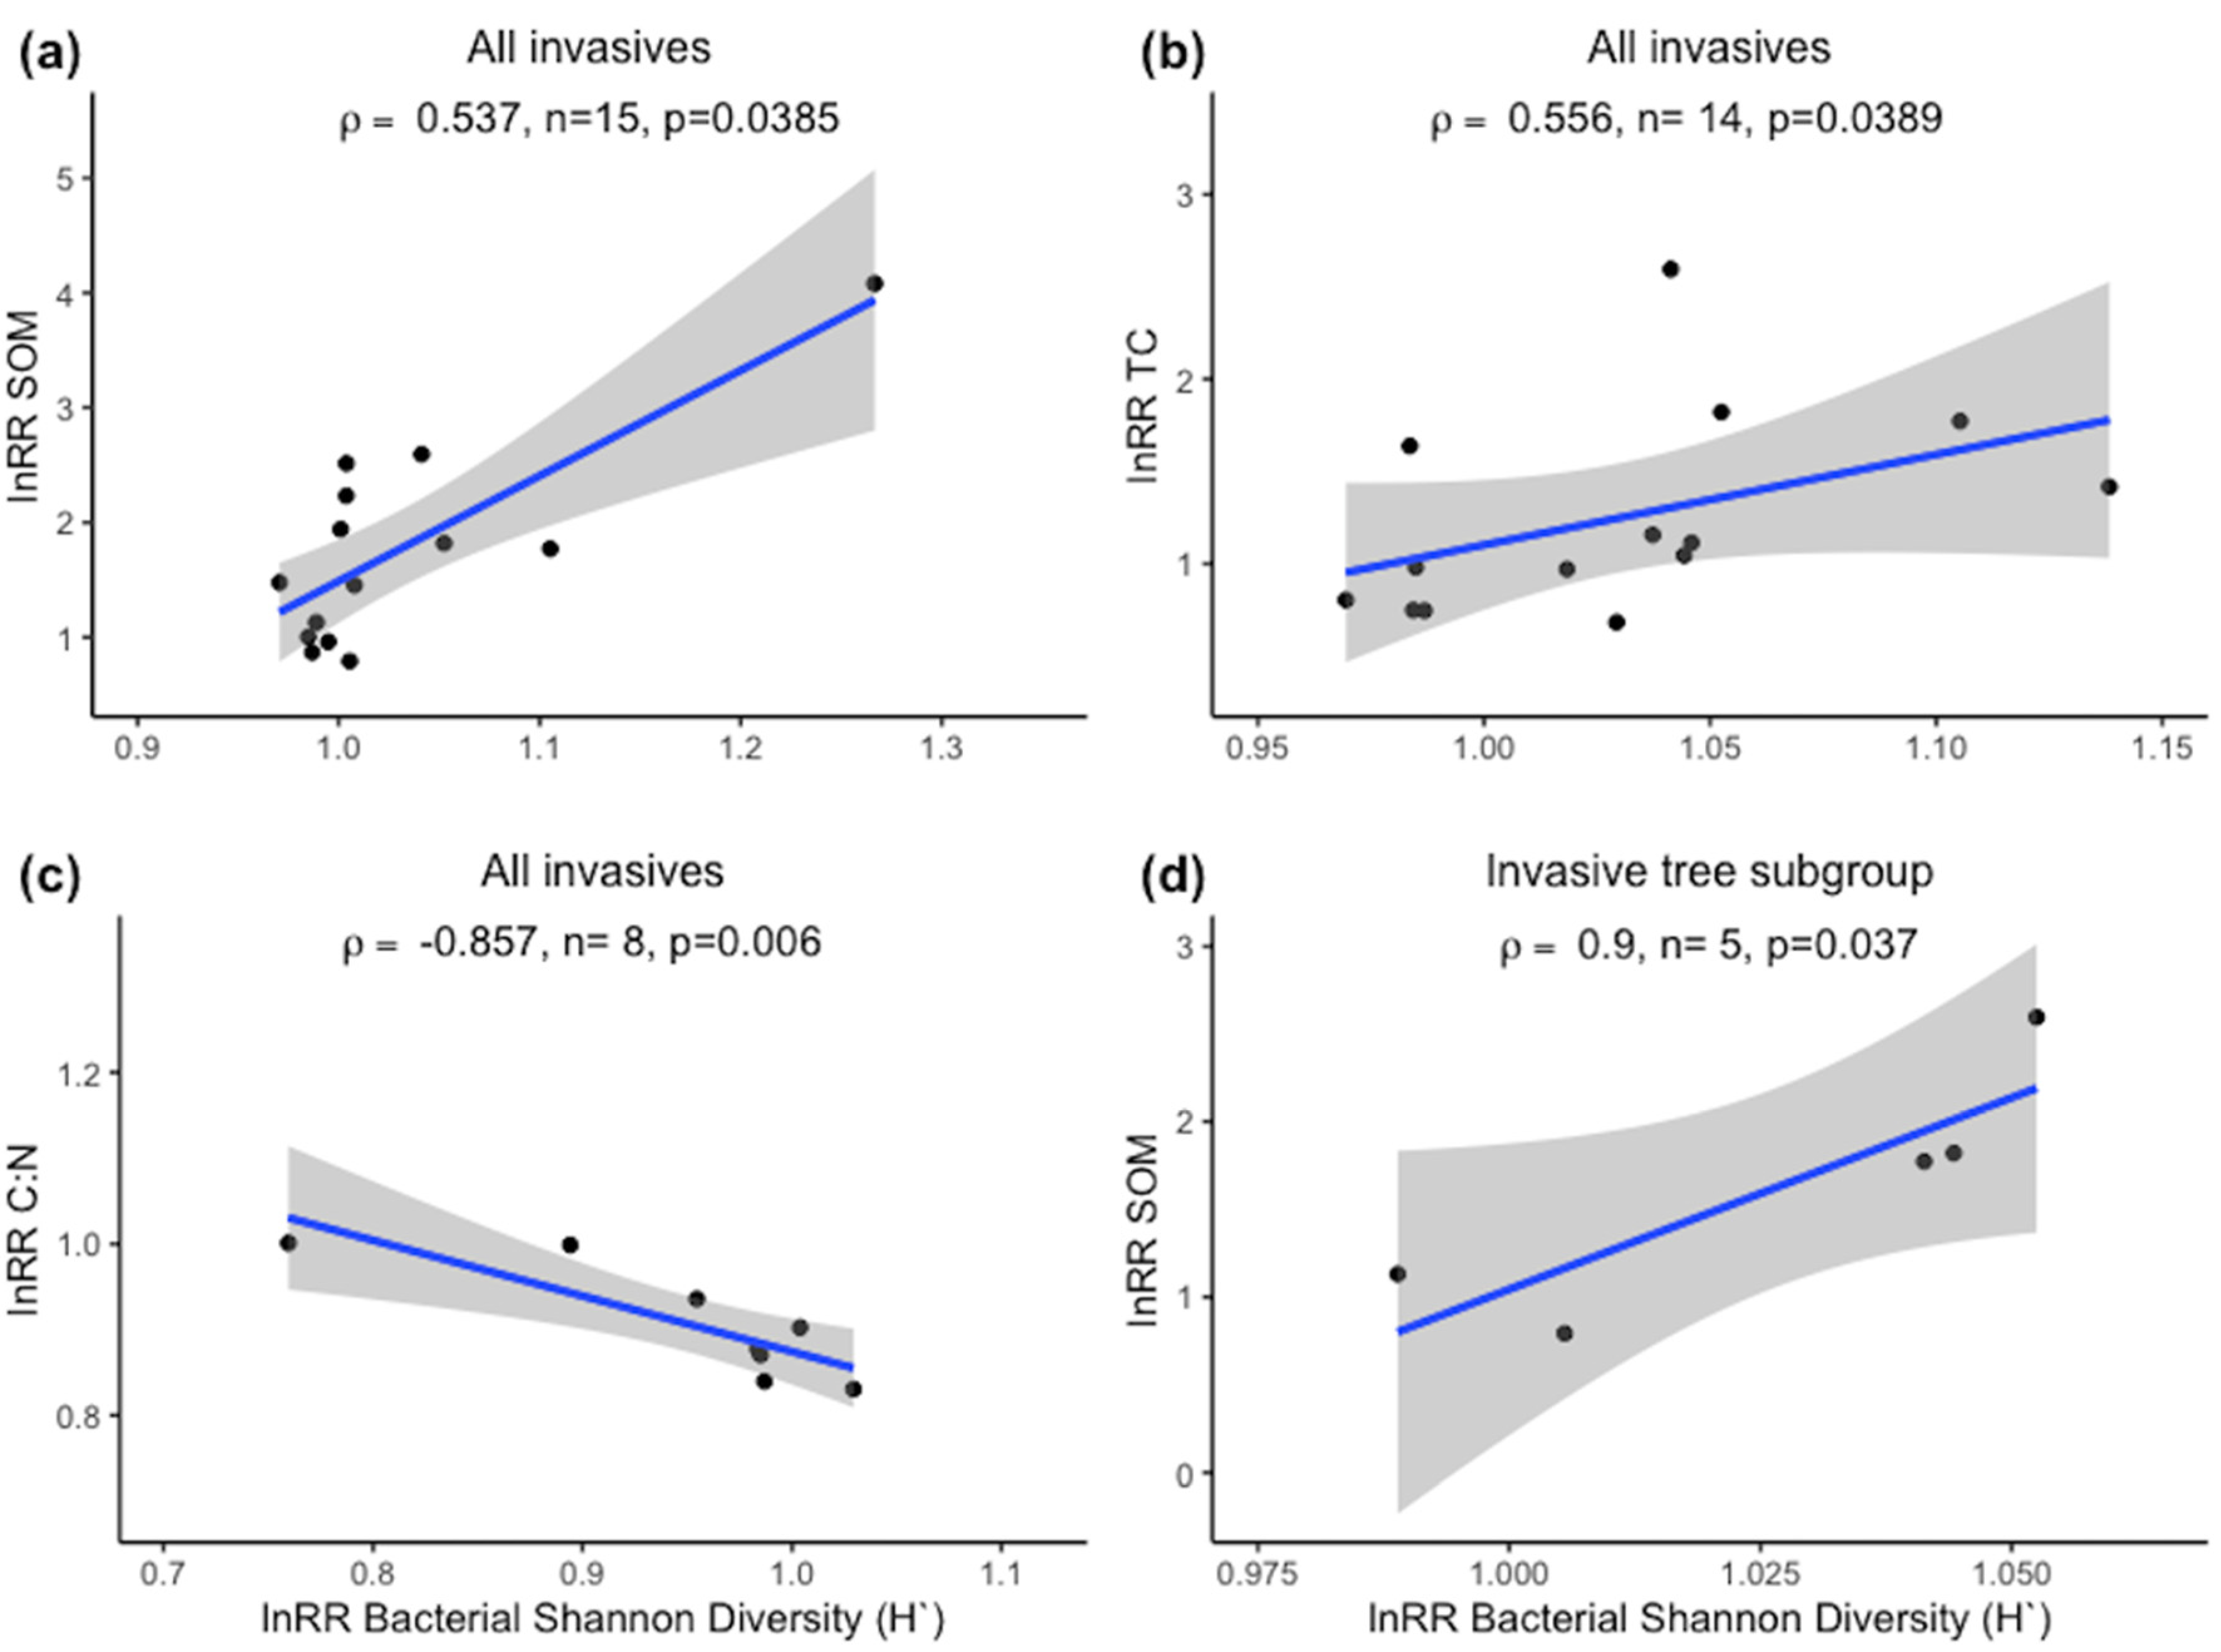
2.2.2. Spearman Correlations of α-Diversity and Nutrient Status
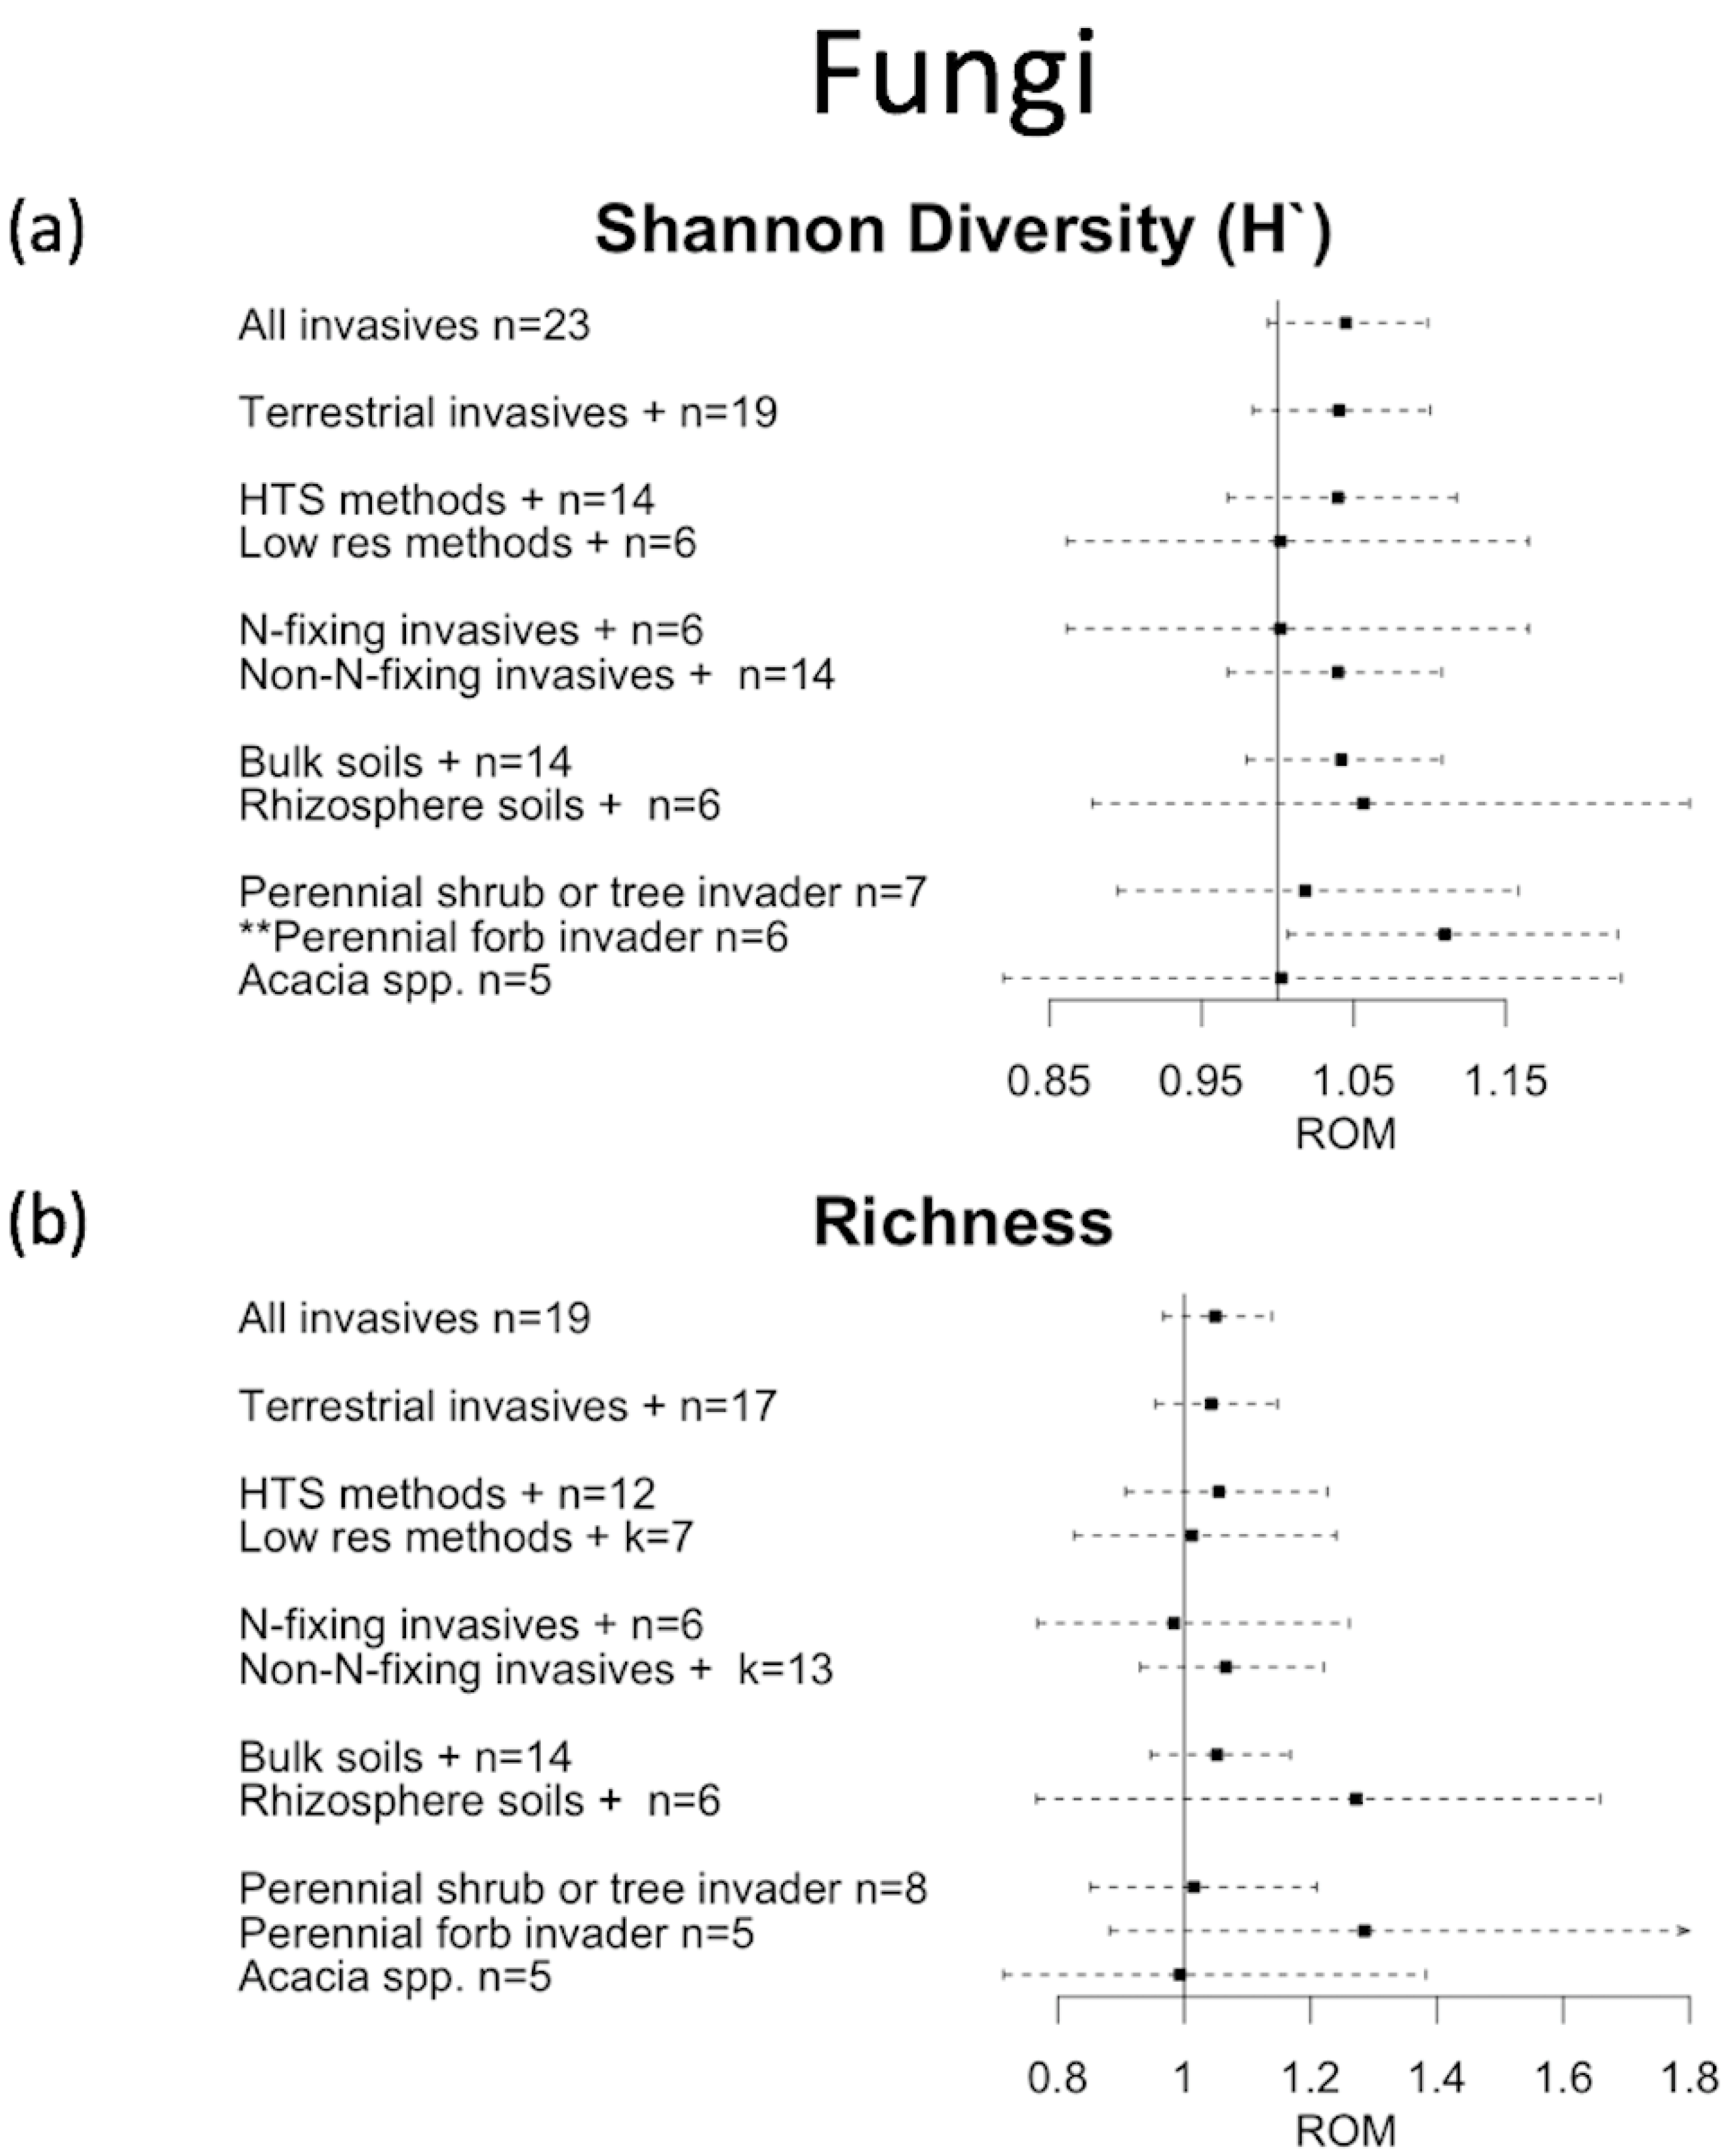
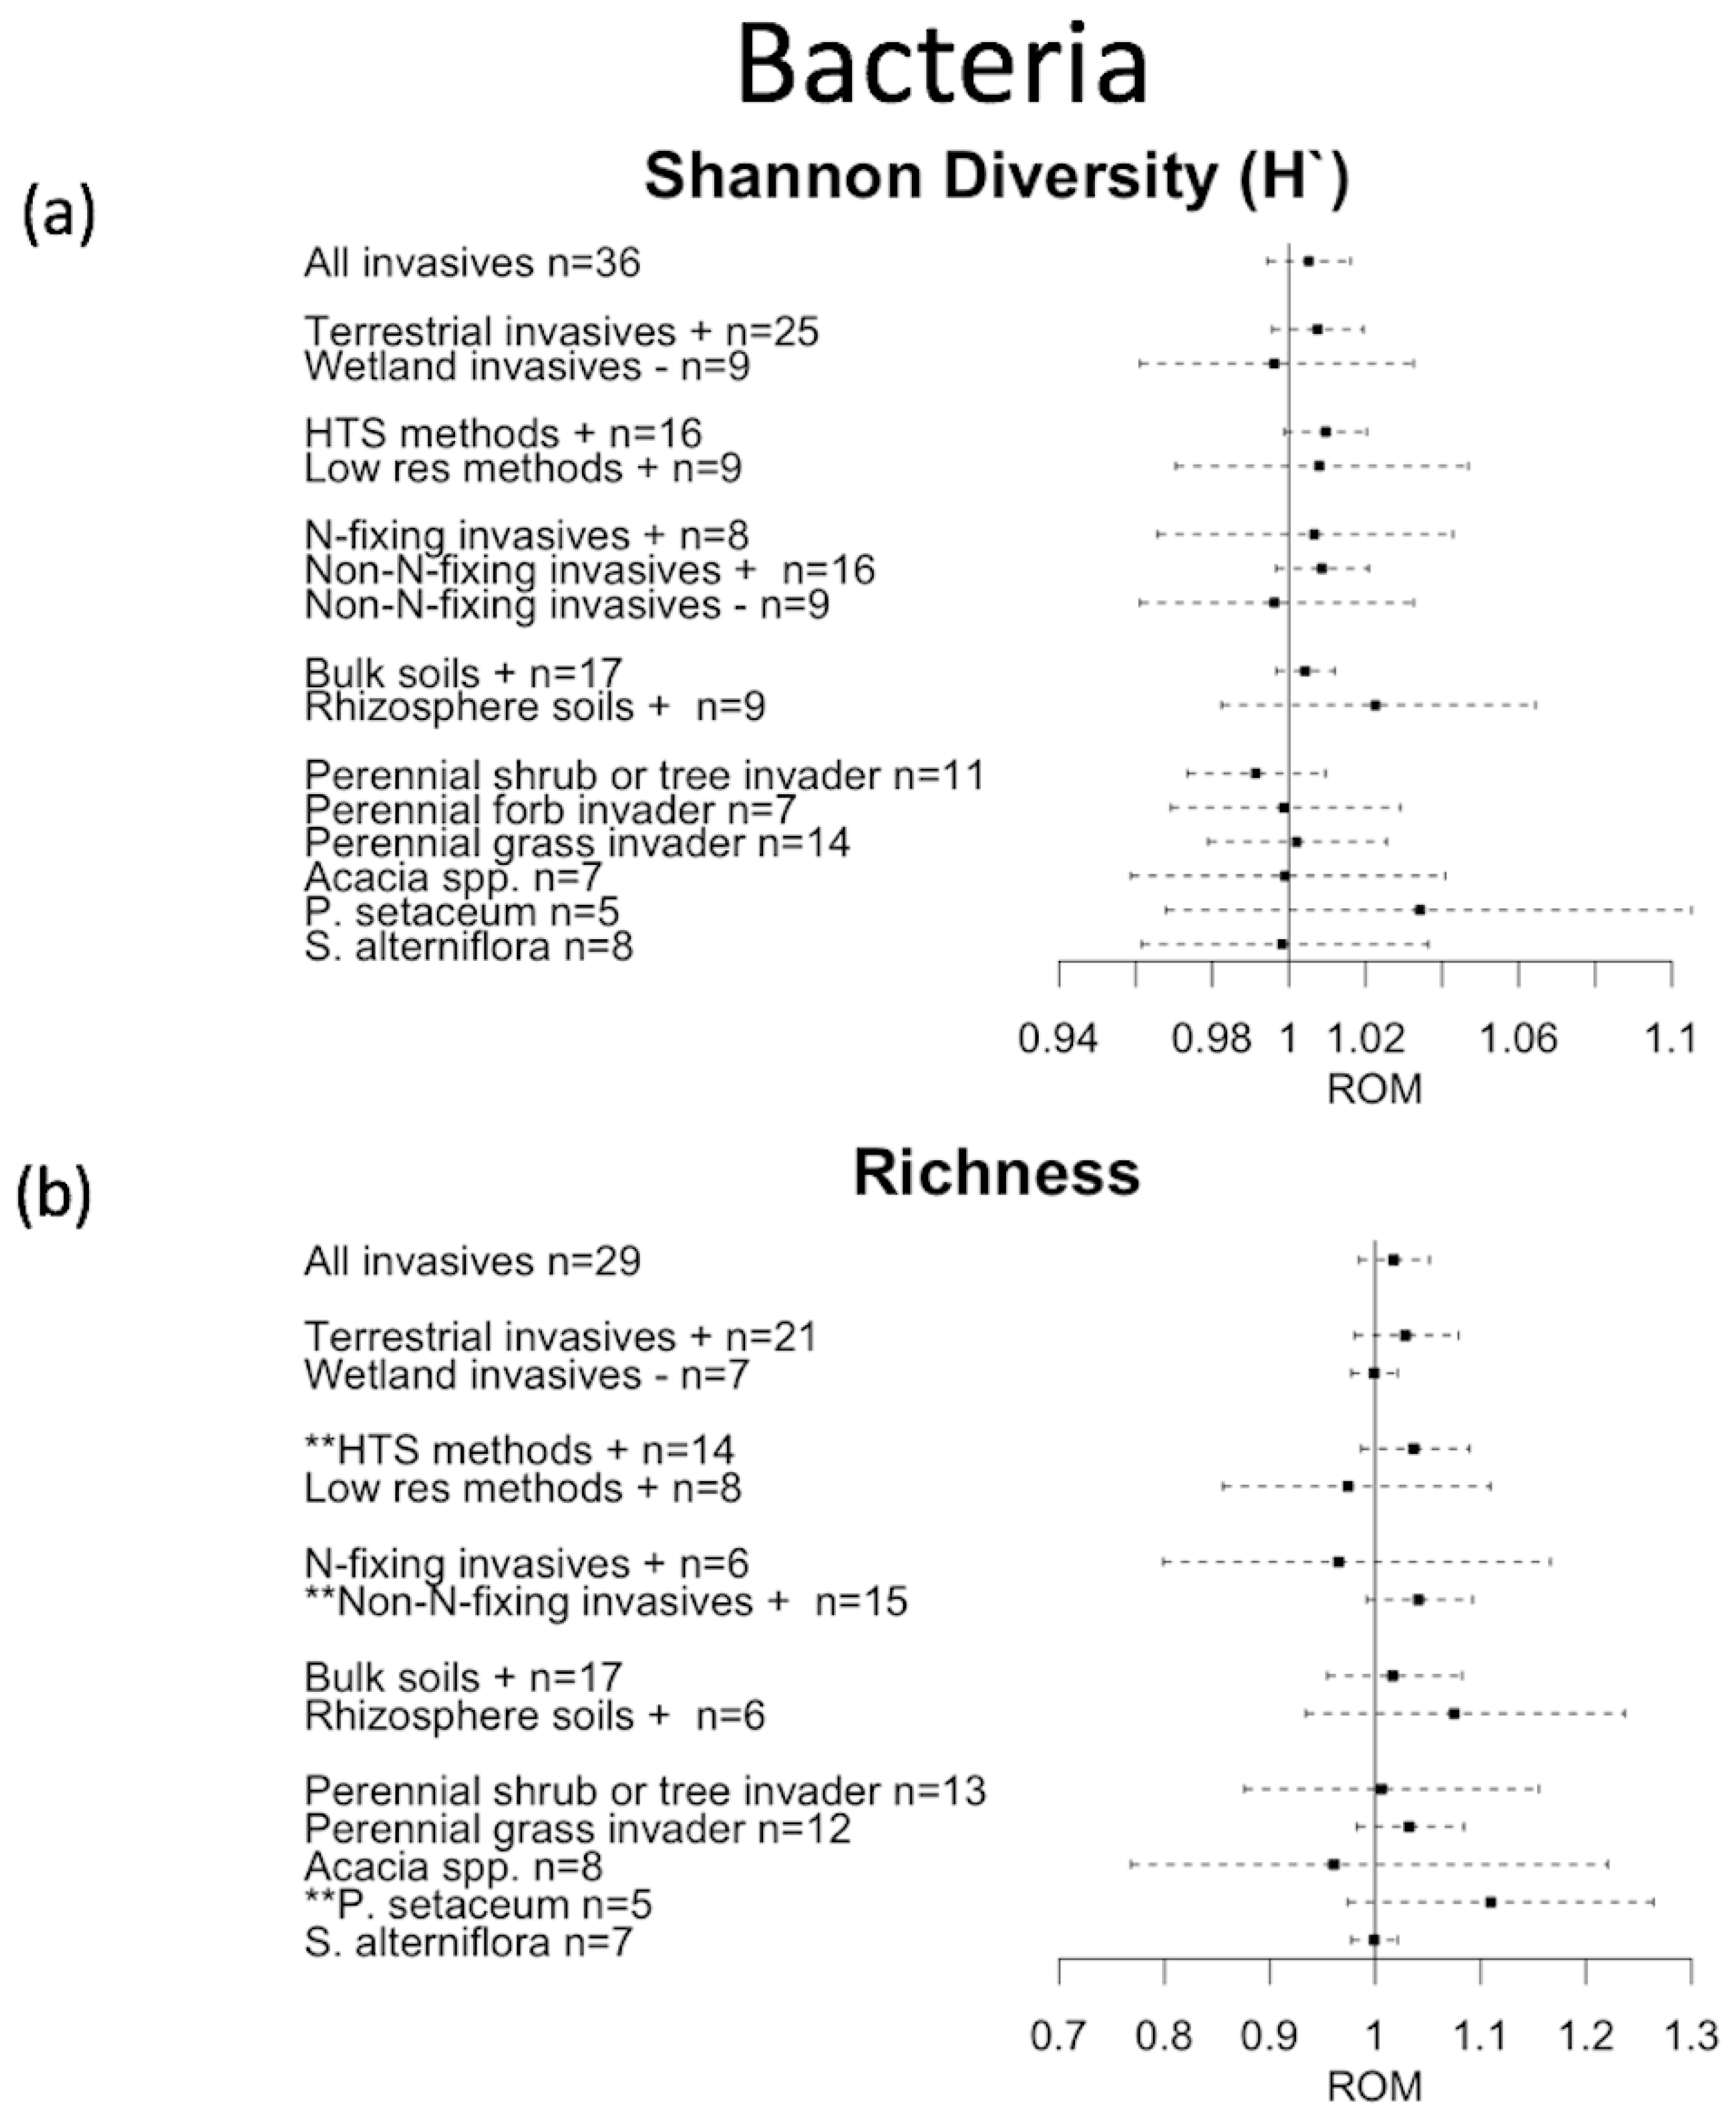
Log response ratios (lnRR) of α-diversity and nutrient status were extracted and correlations between pairs of α-diversity response ratios and nutrient status response ratios were examined using Spearman correlations. Only pairs with a sample size greater than five were used. Outlier response ratios were removed prior to testing for correlations due to the sensitivity of correlative analyses to outliers. Scatter plots of significant Spearman correlations were created using ggplot [34] and included line of best fit. We examined all studies together and then utilized subgroups to uncover correlations which may be specific to invader morphology or plant species. Due to the fact that numerous previous meta-analyses and reviews examining the impact of invasion on nutrient status exist, we did not find it necessary to repeat these analyses.

3. Results

Our Web of Science® search using search terms provided in the Supplementary Materials returned 1426 papers. Pruning based upon criteria listed in the above methods retained 70 independent comparisons from 39 publications (Supplementary Tables S1 and S2); 44 bacterial and 26 fungal comparisons (Figure 1). Our analysis used 23 unique invasive plants, with Spartina alterniflora and Acacia spp. as the most common species for bacteria and fungi, respectively, and one study reporting multiple simultaneous invaders. The distribution of study locations is as follows: North America (n = 19, 31%), Asia (n = 22, 36%), Europe (n = 16, 26%) and Africa (n = 4, 7%). A detailed list including the number of studies used in each subgroup meta-analysis are provided in Supplementary Tables S3 and S4.
Invasion resulted in no significant changes in either bacterial or fungal α-diversity when all studies were combined, though there was a marginally significant increase in fungal Shannon diversity (p = 0.08) (Figure 2 and Figure 3, Supplementary Tables S3 and S4). These findings, coupled with the large amount of heterogeneity (I2) present, support the idea of variability in the response of microbial α-diversity to plant invasion. Subgroup analysis of fungal α-diversity produced a lone significant response following invasion, with an 11% increase in Shannon diversity with perennial forb invaders (ROM = 1.110, p = 0.04) (Figure 2a). Significant bacterial responses were limited as well, with invasion significantly increasing bacterial richness in terrestrial studies using high throughput sequencing methods (+5%), terrestrial non-nitrogen fixing plants (+5%), and the P. setaceum plant species subgroups (+10%) (Figure 3b). The high throughput sequencing subgroup was only significant when the lone outlier was included with no H.K. adjustment (ROM = 1.036, p = 0.14 H.K. adjusted, ROM = 1.0543, p = 0.0380 non-H.K. adjusted). For the terrestrial non-N-fixing subset, significant positive impacts of invasion on bacterial richness were only found when the lone outlier was included in the analysis (ROM = 1.0573, p = 0.0514 H.K. adjusted and ROM = 1.0573, p = 0.0275 non-H.K. adjusted). Both models showed a small increase in the number of observed bacterial taxa, following invasion by terrestrial non-N-fixing plants. The P. setaceum subgroup produced a positive response in bacterial richness after invasion only in the non-H.K. adjusted model (ROM = 1.1096, p = 0.09 H.K. adjusted, ROM = 1.1096, p = 0.0202 non-H.K. adjusted). Other than the above mentioned four significant responses, no other subgroups showed a significant response of microbial α-diversity to plant invasion. There was, however, a marginally significant increase in bacterial Shannon diversity in the HTS subgroup (ROM = 1.0092, p = 0.0764), though the increase was very slight (+0.09%).
Testing for Spearman correlations among invasion-induced changes in α-diversity and nutrient status and physicochemical metrics revealed three significant correlations (p < 0.05) for bacterial diversity, when all studies were combined (Figure 4a–c). Response ratios (lnRR) of bacterial Shannon diversity were positively correlated with soil organic matter (SOM) content (ρ = 0.537) and total carbon (TC) (ρ = 0.556), while negatively correlated with C:N (ρ = −0.857). We did not include the significant correlation of fungal Shannon diversity and C:N, due to the small sample size (n = 3). When invader species and invader growth morphology were used as subgroups, one additional significant positive correlation was detected between bacterial Shannon diversity and SOM in the perennial shrub/tree group (ρ = 0.9) (Figure 4d). Weighted response ratios of nutrient status metrics were as expected and matched previous studies and meta-analyses, including increased C and N pool sizes (data not shown).

4. Discussion

Our meta-analytical approach to the impact of plant invasion on soil microbial α-diversity produced few significant responses and suggests plant invasion to have limited and variable effects on soil microbial α-diversity, contrary to our first hypothesis. Our results are supported by other studies examining multiple invaders [3,4], which have reported plant invasion to illicit unique responses based on the invasive plant species, invaded ecosystem type, and which biotic soil properties (i.e., bacteria, fungi, or microbial guilds/trophic modes) were measured. While not significant, trends in microbial diversity following invasion seemed to differ between bacteria and fungi. All but two of the fungal subgroups examined showed a positive, but non-significant, weighted response ratio following invasion (Figure 2). Bacteria, on the other hand, showed variability in the direction of microbial α-diversity response to invasion, with subgroup responses being both negative and positive, though insignificant (Figure 3). As both bacteria and fungi are important in the functioning of ecosystems, the mechanisms responsible for the differing responses to invasion is something that needs to be further investigated. A major limitation in our understanding of the response of microbial diversity to invasion lies in the fact that a large number of studies do not report α-diversity metrics. Up until ~10 years ago, with the adoption of next generation sequencing methods, most studies would report biomass changes of coarse microbial groups, which may or may not be correlated with diversity. Thus, our study is limited to experiments which reported diversity metrics, and this only represents a small fraction of the time and resources dedicated to studying this global problem.
Though only limited responses of α-diversity to invasion were found, changes in bacterial α-diversity were significantly correlated with changes in nutrient metrics in accordance with our second hypothesis (Figure 4). As for fungi, we were not able to test for these correlations in many cases, due to small sample size. Positive correlations of bacterial H` with TC and SOM indicate that as soil carbon increases following invasion, bacterial H` does as well. These parameters can be thought of as substrate or nutrient availability, and our results suggest that increased substrate availability, specifically carbon, following invasion may play a role in maintaining bacterial diversity in the face of invasion mediated ecosystem shifts. Shifts in carbon pools following invasion have been documented [1], with invasive plants exerting species specific impacts, depending upon the recalcitrance of their litter [35]. The correlation between carbon and belowground diversity presents itself as an avenue to better understand microbial response to invasion. Experimentation and mathematical modeling by Louis et al. [22] showed microbial α-diversity to be a significant predictor in soil carbon dynamics. Their study also reported that microbial carbon assimilation was correlated with microbial α-diversity and suggest that increased microbial diversity may be responsible for increased soil carbon, essentially creating a feedback loop. Their results, interpreted in the context of invasion, may help to explain the observed correlation of SOM and TC with bacterial H`, in that increased niche space due to carbon availability could allow for more taxa to become established, creating a positive feedback loop for bacterial H` and soil C. On the other hand, the negative correlation between bacterial H` and C:N suggests that the quality of substrates and potential availability of nitrogen in relation to carbon in the soil matrix may also play a role in determining patterns of microbial diversity following invasion. Previous studies and meta-analysis have shown increased N (specifically N-deposition) to have detrimental impacts on microbial parameters [36,37], including diversity [20]. Based on the generally lower C:N ratio of invasive plant litter [1], this represents a potential driver of the increased N-availability associated with invasion, but may mask the influence of increased C. The interactions of increased C and N following invasion is likely a very intricate problem and will require explicit experimentation to tease apart the contribution of each with respect to patterns in microbial α-diversity.
Of particular interest, when explaining the impacts of invasion on microbial diversity, is the phenotypic characteristics of invaders, as compared to the native vegetation of the region. Lekberg et al. [3] discuss phenotypic differences between the common western US invaders leafy spurge and cheatgrass. Their results showed the highest level of dissimilarity in arbuscular mycorrhizal fungal (AMF) diversity between plots invaded by these two plants and explained that it was likely due to their root morphology and mycotrophic nature. Zubek et al. [38] report similar results, with non-mycorrhizal invaders eliciting the greatest response in AMF diversity. This may help to explain the high level of heterogeneity observed in effect sizes in our meta-analysis. As the number of studies using any one invader were limited, we were unable to assess the impact of individual species in many cases and were forced to combine studies based on subgroups, potentially lumping together taxa with differing root morphologies or that lie at different points on the mycotrophic spectrum and thus elicit very different microbial responses. Furthermore, many studies only report a single alpha diversity metric for the entire bacterial or fungal community, again potentially masking the response of specific microbial guilds to invasion. For example, Gibbons et al. [4] reported no impact of invasion on microbial α or β-diversity in fungi and bacteria across multiple invader types. However, they did report that invader types elicit a unique response with respect to microbial guilds, specifically symbionts (mycorrhizal taxa), and saprotrophic taxa. With this, examining specific microbial guilds following invasion may help to illuminate how the soil microbiome responds to invasion. This information could inform land managers and those interested in restoring damaged lands as to which specific guilds may need be targeted in efforts to reclaim invaded lands and restore ecosystem function.
In conclusion, plant invasion is commonly seen as detrimental, due to the associated decreases in aboveground diversity and shifts in ecosystem structure and function [1,2,3,4,14,15]. However, despite this, our results suggest plant invasion does not illicit the same response in belowground diversity. Instead, the observed trends in our meta-analysis of microbial α-diversity suggest the opposite; a slight increase in the number and diversity of microbial taxa following invasion. Furthermore, soil nutrient status may prove to be a very complex pattern, with contributions of multiple nutrient metrics potentially masking each other. Again, this will need to be addressed with explicitly designed experiments capable of teasing apart the effect of each component.

Supplementary Materials

The following are available online under the following DOI number 10.5281/zenodo.3706831. Supplementary text ST1: Search terms used in Web of Science® literature search. Supplementary Table S1: Studies used for fungal meta-analysis. Supplementary Table S2: Studies used for bacterial meta-analysis. Supplementary Table S3: Fungal model outputs and number of studies used for each model. Supplementary Table S4: Bacterial model outputs and number of studies used for each model.

Author Contributions

Conceptualization, G.F.C. and L.T.A.v.D.; methodology, G.F.C. and L.T.A.v.D.; software, G.F.C.; validation, G.F.C., L.T.A.v.D.; formal analysis, G.F.C.; data curation, G.F.C.; writing—original draft preparation, G.F.C. and L.T.A.v.D.; writing—review and editing, G.F.C. and L.T.A.v.D.; visualization, G.F.C.; supervision, L.T.A.v.D.; project administration, L.T.A.v.D.; funding acquisition, L.T.A.v.D. All authors have read and agreed to the published version of the manuscript.

Funding

This research was funded by the Microbial Ecology Collaborative, with funding from NSF grant number #EPS-1655726.

Conflicts of Interest

The authors declare no conflict of interest. The funders had no role in the design of the study; in the collection, analyses, or interpretation of data; in the writing of the manuscript, or in the decision to publish the results.

References

  1. Liao, C.; Peng, R.; Luo, Y.; Zhou, X.; Wu, X.; Fang, C.; Chen, J.; Li, B. Altered ecosystem carbon and nitrogen cycles by plant invasion: A meta-analysis. New Phytol. 2007, 177, 706–714. [Google Scholar] [CrossRef]
  2. Castro-Díez, P.; Godoy, O.; Alonso, A.; Gallardo, A.; Saldaña, A. What explains variation in the impacts of exotic plant invasions on the nitrogen cycle? A meta-analysis. Ecol. Lett. 2014, 17, 1–12. [Google Scholar] [CrossRef] [PubMed] [Green Version]
  3. Lekberg, Y.; Gibbons, S.M.; Rosendahl, S.; Ramsey, P.W. Severe plant invasions can increase mycorrhizal fungal abundance and diversity. ISME J. 2013, 7, 1424–1433. [Google Scholar] [CrossRef] [PubMed] [Green Version]
  4. Gibbons, S.M.; Lekberg, Y.; Mummey, D.L.; Sangwan, N.; Ramsey, P.W.; Gilbert, J.A. Invasive Plants Rapidly Reshape Soil Properties in a Grassland Ecosystem. mSystems 2017, 2, e00178–e00216. [Google Scholar] [CrossRef] [PubMed] [Green Version]
  5. Meyerson, L.A.; Mooney, H.A. Invasive alien species in an era of globalization. Front. Ecol. Environ. 2007, 5, 199–208. [Google Scholar] [CrossRef]
  6. Hulme, P.E. Trade, transport and trouble: Managing invasive species pathways in an era of globalization. J. Appl. Ecol. 2009, 46, 10–18. [Google Scholar] [CrossRef]
  7. Seebens, H.; Essl, F.; Dawson, W.; Fuentes, N.; Moser, D.; Pergl, J.; Pyšek, P.; van Kleunen, M.; Weber, E.; Winter, M.; et al. Global trade will accelerate plant invasions in emerging economies under climate change. Glob. Chang. Biol. 2015, 21, 4128–4140. [Google Scholar] [CrossRef] [Green Version]
  8. Reichard, S.H.; White, P. Horticulture as a Pathway of Invasive Plant Introductions in the United States. Bioscience 2001, 51, 103–113. [Google Scholar] [CrossRef]
  9. Wolfe, B.E.; Klironomos, J.N. Breaking new ground: Soil communities and exotic plant invasion. Bioscience 2005, 55, 477–487. [Google Scholar] [CrossRef]
  10. Dickie, I.A.; Bufford, J.L.; Cobb, R.C.; Desprez-Loustau, M.L.; Grelet, G.; Hulme, P.E.; Klironomos, J.; Makiola, A.; Nuñez, M.A.; Pringle, A.; et al. The emerging science of linked plant–fungal invasions. New Phytol. 2017, 215, 1314–1332. [Google Scholar] [CrossRef] [Green Version]
  11. Van der Putten, W.H.; Klironomos, J.N.; Wardle, D.A. Microbial ecology of biological invasions. ISME J. 2007, 1, 28–37. [Google Scholar] [CrossRef] [PubMed] [Green Version]
  12. Dawson, W.; Schrama, M. Identifying the role of soil microbes in plant invasions. J. Ecol. 2016, 104, 1211–1218. [Google Scholar] [CrossRef] [Green Version]
  13. Martin, P.A.; Newton, A.C.; Bullock, J.M. Impacts of invasive plants on carbon pools depend on both species’ traits and local climate. Ecology 2017, 98, 1026–1035. [Google Scholar] [CrossRef] [Green Version]
  14. Vilà, M.; Espinar, J.L.; Hejda, M.; Hulme, P.E.; Jarošík, V.; Maron, J.L.; Pergl, J.; Schaffner, U.; Sun, Y.; Pyšek, P. Ecological impacts of invasive alien plants: A meta-analysis of their effects on species, communities and ecosystems. Ecol. Lett. 2011, 14, 702–708. [Google Scholar] [CrossRef] [PubMed]
  15. Hejda, M.; Pyšek, P.; Jarošík, V. Impact of invasive plants on the species richness, diversity and composition of invaded communities. J. Ecol. 2009, 97, 393–403. [Google Scholar] [CrossRef]
  16. Carey, C.J.; Michael Beman, J.; Eviner, V.T.; Malmstrom, C.M.; Hart, S.C. Soil microbial community structure is unaltered by plant invasion, vegetation clipping, and nitrogen fertilization in experimental semi-arid grasslands. Front. Microbiol. 2015, 6, 466. [Google Scholar] [CrossRef]
  17. Cameron, E.K.; Martins, I.S.; Lavelle, P.; Mathieu, J.; Tedersoo, L.; Bahram, M.; Gottschall, F.; Guerra, C.A.; Hines, J.; Patoine, G.; et al. Global mismatches in aboveground and belowground biodiversity. Conserv. Biol. 2019, 33, 1187–1192. [Google Scholar] [CrossRef]
  18. Prober, S.M.; Leff, J.W.; Bates, S.T.; Borer, E.T.; Firn, J.; Harpole, W.S.; Lind, E.M.; Seabloom, E.W.; Adler, P.B.; Bakker, J.D.; et al. Plant diversity predicts beta but not alpha diversity of soil microbes across grasslands worldwide. Ecol. Lett. 2015, 18, 85–95. [Google Scholar] [CrossRef]
  19. Weidenhamer, J.D.; Callaway, R.M. Direct and Indirect Effects of Invasive Plants on Soil Chemistry and Ecosystem Function. J. Chem. Ecol. 2010, 36, 59–69. [Google Scholar] [CrossRef]
  20. Wang, C.; Liu, D.; Bai, E. Decreasing soil microbial diversity is associated with decreasing microbial biomass under nitrogen addition. Soil Biol. Biochem. 2018, 120, 126–133. [Google Scholar] [CrossRef]
  21. Powell, K.I.; Chase, J.M.; Knight, T.M. A synthesis of plant invasion effects on biodiversity across spatial scales. Am. J. Bot. 2011, 98, 539–548. [Google Scholar] [CrossRef] [PubMed] [Green Version]
  22. Louis, B.P.; Maron, P.A.; Menasseri-Aubry, S.; Sarr, A.; Lévêque, J.; Mathieu, O.; Jolivet, C.; Leterme, P.; Viaud, V. Microbial diversity indexes can explain soil carbon dynamics as a function of carbon source. PLoS ONE 2016, 11, e0161251. [Google Scholar] [CrossRef] [Green Version]
  23. Furukawa, T.A.; Barbui, C.; Cipriani, A.; Brambilla, P.; Watanabe, N. Imputing missing standard deviations in meta-analyses can provide accurate results. J. Clin. Epidemiol. 2006, 59, 7–10. [Google Scholar] [CrossRef] [PubMed]
  24. Ma, J.; Liu, W.; Hunter, A.; Zhang, W. Performing meta-analysis with incomplete statistical information in clinical trials. BMC Med. Res. Methodol. 2008, 8, 56. [Google Scholar] [CrossRef] [PubMed] [Green Version]
  25. R Development Core Team. A Language and Environment for Statistical Computing; R Foundation for Statistical Computing: Vienna, Austria, 2020. [Google Scholar]
  26. Hedges, L.V.; Gurevitch, J.; Curtis, P.S. The meta-analysis of response ratios in experimental ecolgoy. Ecology 1999, 80, 1150–1156. [Google Scholar] [CrossRef]
  27. Borenstein, M.; Hedges, L.V.; Higgins, J.P.T.; Rothstein, H.R. Introduction to Meta-Analysis; John Wiley & Sons, Ltd.: Chichester, UK, 2009; ISBN 9780470743386. [Google Scholar]
  28. IntHout, J.; Ioannidis, J.P.; Borm, G.F. The Hartung-Knapp-Sidik-Jonkman method for random effects meta-analysis is straightforward and considerably outperforms the standard DerSimonian-Laird method. BMC Med. Res. Methodol. 2014, 14, 25. [Google Scholar] [CrossRef] [Green Version]
  29. Jackson, D.; Law, M.; Rücker, G.; Schwarzer, G. The Hartung-Knapp modification for random-effects meta-analysis: A useful refinement but are there any residual concerns? Stat. Med. 2017, 36, 3923–3934. [Google Scholar] [CrossRef] [Green Version]
  30. Harrer, M.; Cuijpers, P.; Furukawa, T.; Ebert, D.D. Dmetar: Companion R Package for the Guide “Doing Meta-Analysis in R”. 2019. Available online: https://rdrr.io/github/MathiasHarrer/dmetar/ (accessed on 1 February 2020).
  31. Veroniki, A.A.; Jackson, D.; Viechtbauer, W.; Bender, R.; Bowden, J.; Knapp, G.; Kuss, O.; Higgins, J.P.; Langan, D.; Salanti, G. Methods to estimate the between-study variance and its uncertainty in meta-analysis. Res. Synth. Methods 2016, 7, 55–79. [Google Scholar] [CrossRef] [Green Version]
  32. Egger, M.; Smith, G.D.; Schneider, M.; Minder, C. Bias in meta-analysis detected by a simple, graphical test. BMJ 1997, 315, 629–634. [Google Scholar] [CrossRef] [Green Version]
  33. Duval, S.; Tweedie, R. A Nonparametric “Trim and Fill” Method of Accounting for Publication Bias in Meta-Analysis. J. Am. Stat. Assoc. 2000, 95, 89–98. [Google Scholar]
  34. Wickham, H. ggplot2: Elegant Graphics for Data Analysis; Springer: New York, NY, USA, 2009; ISBN 978-0-387-98140-6. [Google Scholar]
  35. Tamura, M.; Tharayil, N. Plant litter chemistry and microbial priming regulate the accrual, composition and stability of soil carbon in invaded ecosystems. New Phytol. 2014, 203, 110–124. [Google Scholar] [CrossRef] [PubMed]
  36. Zhang, T.; Chen, H.Y.H.; Ruan, H. Global negative effects of nitrogen deposition on soil microbes. ISME J. 2018, 12, 1817–1825. [Google Scholar] [CrossRef] [PubMed] [Green Version]
  37. Treseder, K.K. Nitrogen additions and microbial biomass: A meta-analysis of ecosystem studies. Ecol. Lett. 2008, 11, 1111–1120. [Google Scholar] [CrossRef] [PubMed] [Green Version]
  38. Zubek, S.; Majewska, M.L.; Błaszkowski, J.; Stefanowicz, A.M.; Nobis, M.; Kapusta, P. Invasive plants affect arbuscular mycorrhizal fungi abundance and species richness as well as the performance of native plants grown in invaded soils. Biol. Fertil. Soils 2016, 52, 879–893. [Google Scholar] [CrossRef] [Green Version]
Figure 1. Flow diagram for studies retained through each filtering step. Final boxes represent the number of independent studies used for our meta-analysis.
Diversity 12 00112 g001
Figure 2. Forest plot of fungal weighted response ratio (ROM) following invasion. ** indicates statistical significance in at least one model. The symbol “+” indicates only terrestrial studies were used in the calculation of the ROM, and “-” indicates only wetland studies were used. Additional information on which model produced statistical significance can be found in Supplementary Table S3. The most conservative model results are presented in this figure. The top line is all fungal studies examined together. Plots are then sorted by subgroups. Labels include subgrouping and number of independent studies (n). Both panels follow the same formatting. (a) Weighted response ratio (ROM) of fungal Shannon diversity (H`); (b) Weighted response ratio (ROM) of fungal richness.
Diversity 12 00112 g002
Figure 3. Forest plot of bacterial weighted response ratio (ROM) following invasion. ** indicates statistical significance in at least one model. The symbol “+” indicates only terrestrial studies were used in the calculation of the ROM, and “-” indicates only wetland studies were used. Additional information on which model produced statistical significance can be found in Supplementary Table S4. The most conservative model results are presented in this figure. The top line is all bacterial studies examined together. Plots are then sorted by subgroups. Labels include subgrouping and number of independent studies (n). Both panels follow the same formatting. (a) Weighted response ratio (ROM) of bacterial Shannon diversity (H`); (b) Weighted response ratio (ROM) of bacterial richness.
Diversity 12 00112 g003
Figure 4. Scatter plots of invasion-induced changes in α-diversity by changes in nutrient status metrics. Only significant Spearman correlations (p < 0.05 and n ≥ 5) are shown. Grey bands represent the 95% CI of the fit regression line. All panels follow the same formatting. (a) Bacterial Shannon diversity (H`) by soil organic matter (SOM); (b) Bacterial Shannon diversity (H`) by total carbon (TC); (c) Bacterial Shannon diversity (H`) by C:N; and (d) Bacterial Shannon diversity (H`) of the invasive tree/shrub subgroup by SOM.
Diversity 12 00112 g004
Table 1. Subgrouping factors and the possible levels for each factor used in the meta-analysis.
FactorLevels of Each Factor
Ecosystem typeTerrestrial, wetland
Genomic methods—summarized to high throughput sequencing (HTS) and low-resolution methods.HTS: Illumina sequencing, 454/Roche sequencing
Low resolution: terminal restriction fragment length polymorphism (T-RFLP), cloning, denaturing gradient gel electrophoresis (DGGE), and culturing and sequencing
Nitrogen fixing status of invasiveN-fixing, non-N-fixing
Soil originBulk, rhizosphere, single core of bulk and rhizosphere
Invasive plant growth form and individual invasive speciesAnnual grass, perennial grass, perennial forb, perennial shrub/tree, Acacia spp., Pennisetum setaceum, Spartina alterniflora

